infrastructure roll-out for non- fossil fuels, a global ... transport/presentasjoner... · 1 600 1...
TRANSCRIPT
Infrastructure roll-out for non-fossil fuels, a global perspective
Oslo, 31st October 2013 l Emmanuel Rothan-Cederberg l Air Liquide Nordic

Air Liquide, world leader in gases for industry, health and the environment
Air Liquide, a worldwide leader
2
Revenue
€15.3
billion
Present in 80
countries
Close to
50,000
employees
31/10/2013 Regional Power for Clean
Transport conference
Air Liquide, world leader in gases for industry, health and the environment
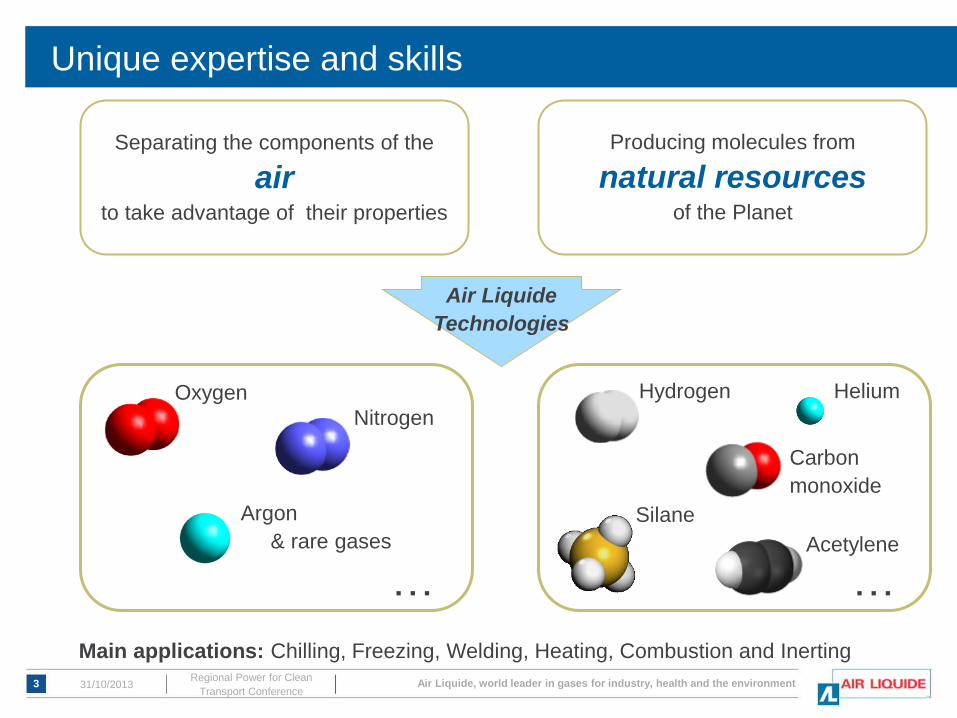
Unique expertise and skills
3
Producing molecules from
natural resources of the Planet
Air Liquide
Technologies
Oxygen
Argon
& rare gases
Hydrogen
Silane
… …
Nitrogen
Helium
Carbon
monoxide
Acetylene
Separating the components of the
air to take advantage of their properties
Main applications: Chilling, Freezing, Welding, Heating, Combustion and Inerting
31/10/2013 Regional Power for Clean
Transport Conference
Air Liquide, world leader in gases for industry, health and the environment
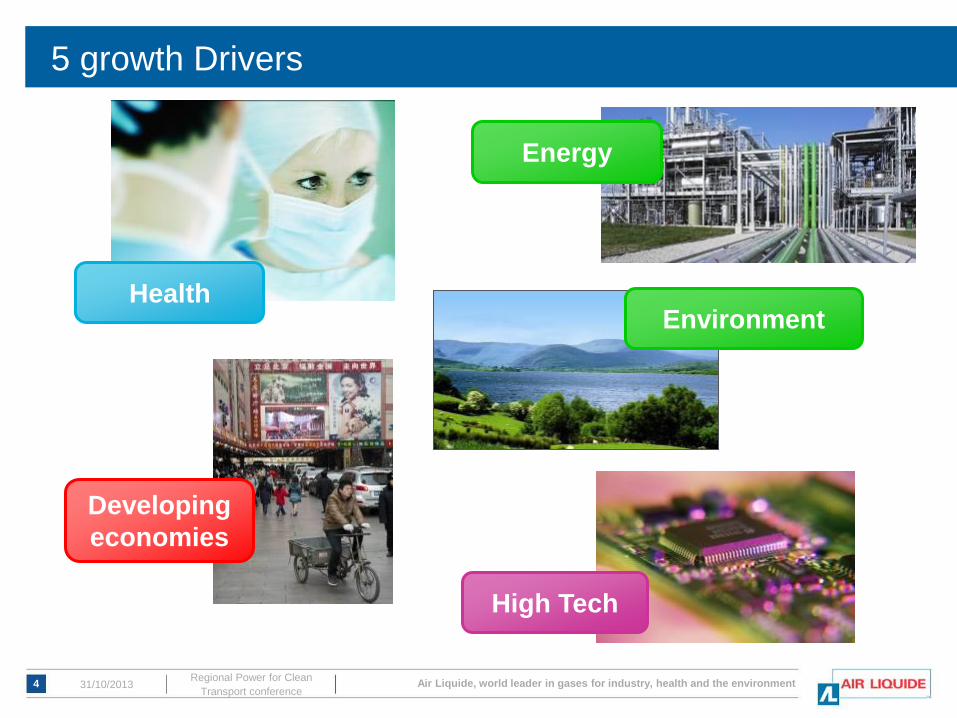
5 growth Drivers
4
High Tech
Developing
economies
Energy
Environment Health
31/10/2013 Regional Power for Clean
Transport conference

Air Liquide, world leader in gases for industry, health and the environment
Air Liquide in the Nordic countries
11/06/2012 IMS Group audit 5
Nordic management
Sales
Filling station
Offshore Filling station
Production sites
Air gases
Acetylene
Carbon dioxide
Hydrogen
High purity gases
Nitrous oxide
Medical gases
VSA
BioCH4 Liquefier
Region
DENMARK
Harjavalta
Raahe
Timrå
Surahammar
Kungsängen Västerås
Nässjö
Mölndal
Kristianstad Hedensted
Odense
Skellefteå
Odda
Kokkola
Sundbyberg
Region NORTH
Malmö
Region SOUTH
Mjøndalen
Oulu
Mullsjö
Kittilä
Helsinki
Karlsborg
Joutseno
Äänekoski
Bergen
Nokia
Horsens
Tåstrup
Helsingborg Mörrum & Nymölla
Kalundborg
Rosenholm
~ 230 million € revenue
~ 500 employees
~ 50,000 customers
> 50 AL sites
Present since 1912 in Sweden (Alfax)
31/10/2013 5 Regional Power for Clean
Transport conference
Lidköping

Air Liquide, world leader in gases for industry, health and the environment
10/
05/
201
2
ALH2E 2012
How to transition towards a new energy mix?
Air Liquide’s Blue Hydrogen initiative
At least 50% of hydrogen energy produced
through carbon-free processes by 2020
renewable energy sources, water electrolysis and
biogas reforming,
carbon capture and storage technologies with natural
gas reforming
A commitment to meet both environmental requirements
and social and economic constraints.

7 Air Liquide, world leader in gases for industry, health and the environment
Hydrogen & Biogas solutions by Air Liquide
■ Air Liquide is committed to leveraging a strong know-how in gas
technologies to offer complete solutions for clean energies
Electrolysis
Fuel-Cells
High pressure (700bar) filling
Membrane technology
Gas liquefaction
Hydrogen energy solutions for
stationary power and transport
Biogas upgrading &
liquefaction solutions
Ruter Hydrogen Refueling Station close to Oslo, Norway Air Liquide’s membrane solution for biogas upgrading
31/10/2013 Regional Power for Clean
Transport conference

Air Liquide, world leader in gases for industry, health and the environment 31/10/2013 8 Regional Power for Clean
Transport conference

Air Liquide, world leader in gases for industry, health and the environment
A broad coalition shared performance estimates on different power trains
Oil and gas
Utilities
Industrial gas
companies
Equipment
OEMs
NGOs, GOs
Car OEMs
Wind
Electrolyser
companies
Industry participants
Approach and principles
▪ All relevant powertrains
(ICE, BEV, PHEV, FCEV)
▪ 3 reference car segments
▪ Cost, emissions, energy
efficiency, driving
performance
▪ Well-to-wheel
▪ >10,000 company data
in a “clean room”
environment
31/10/2013 9 Regional Power for Clean
Transport conference

Air Liquide, world leader in gases for industry, health and the environment
A mix of all drive trains is required to realize full decarbonization
FCEV BEV PHEV ICE
Perfor-
mance
Environ-
ment
Econo-
mics
31/10/2013 10 Regional Power for Clean
Transport conference

Air Liquide, world leader in gases for industry, health and the environment 11 31/10/2013 Regional Power for Clean
Transport conference
Reference
vehicle
Power-
trains
Evaluation
criteria
Small
(A/B)
Medium
(C/D)
SUV
(J)
BEV
FCEV
ICE -
diesel
ICE -
gasoline
PHEV
Overall
sustain-
ability1
Perfor-
mance
User
economics
Purchase price
Running cost
Total cost of
ownership
Payoff time
Production
Operation
End-of-life
…
…
…
…
Data were collected on all drive trains and at a granular level
▪ Potential for biofuels not assessed.
Biofuels are assumed to be blended
achieving 10% CO2 reduction in 2020
and 24% in 2050
▪ Power sector will gradually
decarbonize from 2010 to 2050
▪ Oil price slowly increasing to
$119/bbl in 2030 (IEA)
▪ No taxes on purchase price and fuels
▪ No cherry picking of ‘best data’.
Frozen input data before sharing
results
▪ Impact of potential technology
breakthroughs not included

Air Liquide, world leader in gases for industry, health and the environment
0
20
40
60
80
100
120
140
160
180
200
0 200 400 600 800 1 000 1 200 1 400 1 600
CO2 emissions
gCO2 / km
Range
km
ICE – gasoline
2050
ICE – diesel
2010
BEV
2050
FCEV
2010
2050
2010
2010
2050
PHEV
Low emissions and high range
Battery and fuel cell vehicles can achieve low emissions
C/D SEGMENT
31/10/2013 12 Regional Power for Clean
Transport conference
Air Liquide, world leader in gases for industry, health and the environment
0
200
400
600
800
1 000
1 200
1 400
1 600
1 800
2 000
2 200
2 400
80 0 140 100 60 120 160 40
800
600
400
200
0
Range at constant speed km
20
2,400
2,200
2,000
1,800
1,600
1,200
1,000
200 220 180
1,400
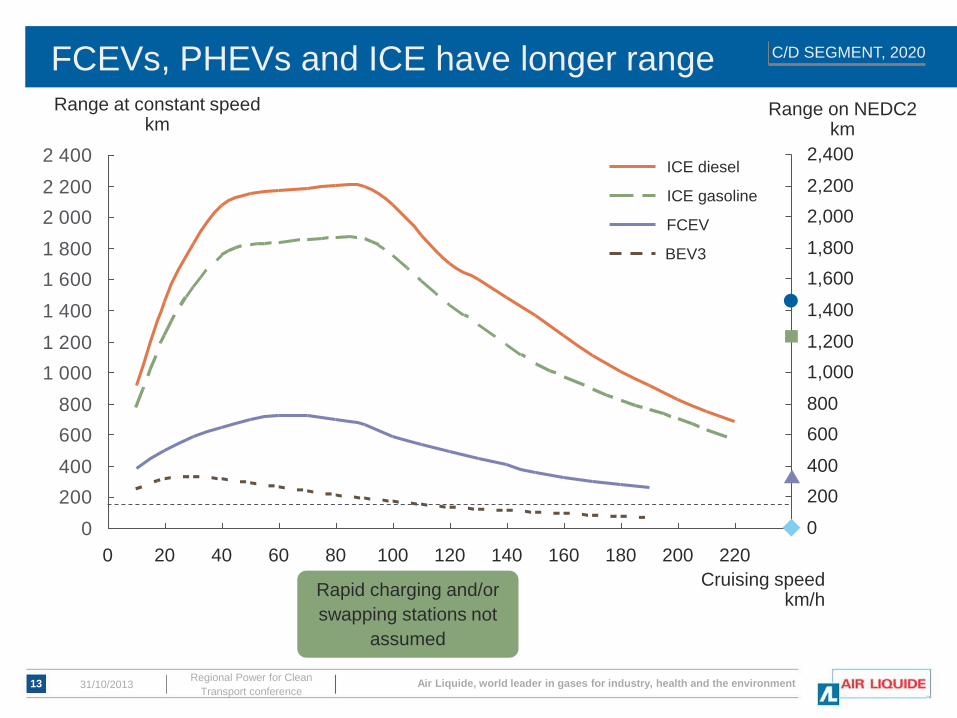
C/D SEGMENT, 2020
Range on NEDC2 km
BEV3
FCEV
ICE gasoline
ICE diesel
Cruising speed km/h
Rapid charging and/or
swapping stations not
assumed
FCEVs, PHEVs and ICE have longer range
31/10/2013 13 Regional Power for Clean
Transport conference
Air Liquide, world leader in gases for industry, health and the environment
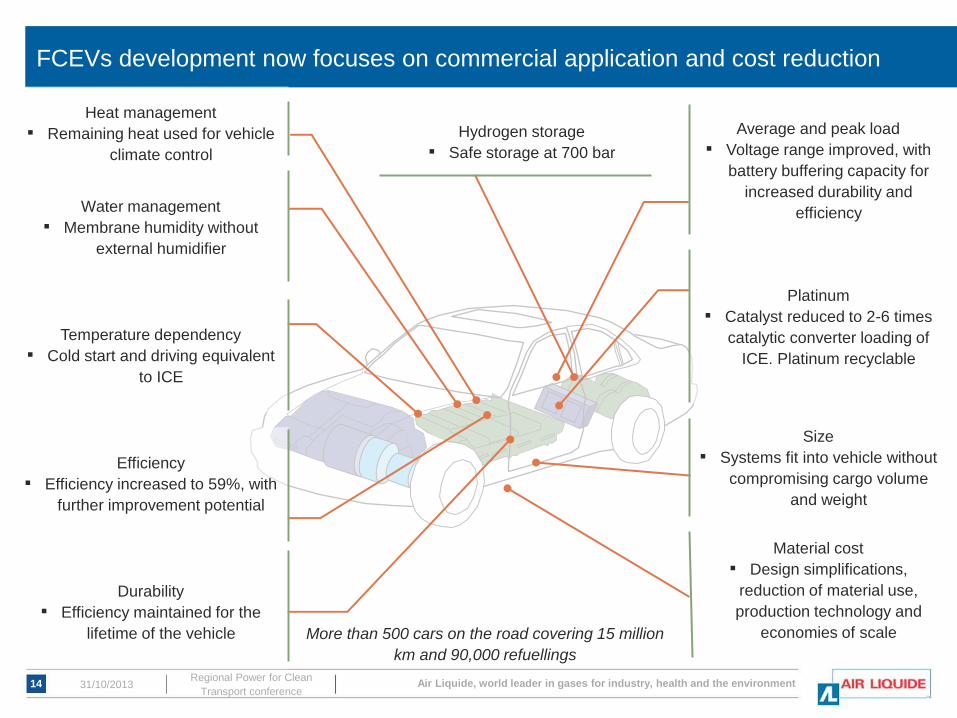
Heat management
▪ Remaining heat used for vehicle
climate control
FCEVs development now focuses on commercial application and cost reduction
Temperature dependency
▪ Cold start and driving equivalent
to ICE
Water management
▪ Membrane humidity without
external humidifier
Efficiency
▪ Efficiency increased to 59%, with
further improvement potential
Durability
▪ Efficiency maintained for the
lifetime of the vehicle
Material cost
▪ Design simplifications,
reduction of material use,
production technology and
economies of scale
Hydrogen storage
▪ Safe storage at 700 bar
Size
▪ Systems fit into vehicle without
compromising cargo volume
and weight
Average and peak load
▪ Voltage range improved, with
battery buffering capacity for
increased durability and
efficiency
Platinum
▪ Catalyst reduced to 2-6 times
catalytic converter loading of
ICE. Platinum recyclable
More than 500 cars on the road covering 15 million
km and 90,000 refuellings
31/10/2013 14 Regional Power for Clean
Transport conference
Air Liquide, world leader in gases for industry, health and the environment
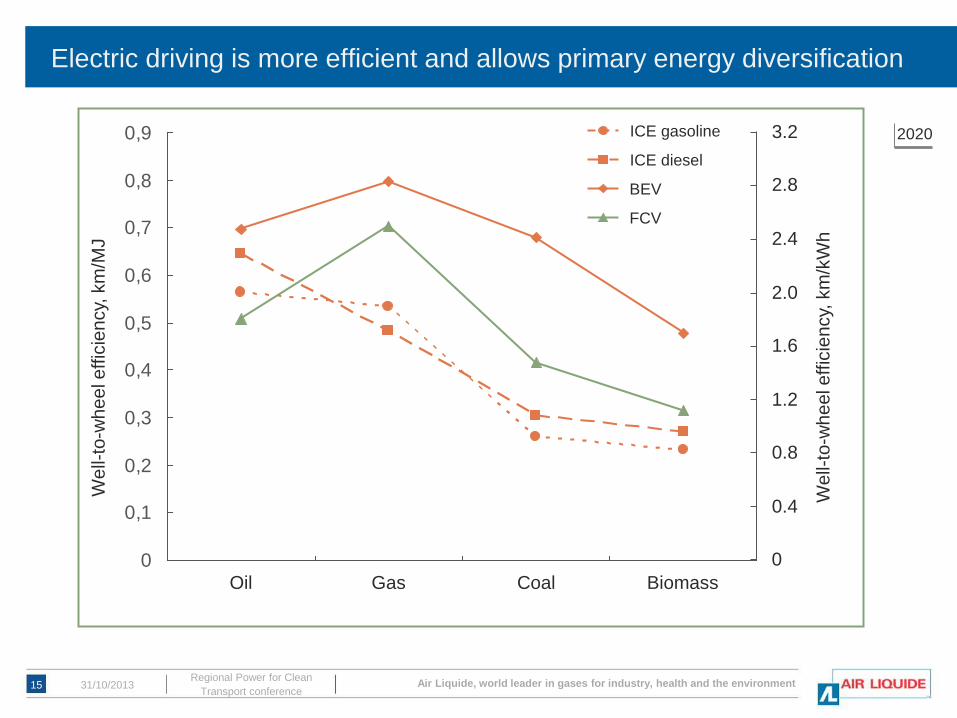
We
ll-to
-wh
ee
l e
ffic
ien
cy,
km
/MJ
FCV
BEV
ICE diesel
ICE gasoline
0
0,1
0,2
0,3
0,4
0,5
0,6
0,7
0,8
0,9 3.2
2.8
2.4
2.0
1.6
1.2
0.8
0.4
0
Biomass Coal Gas Oil
We
ll-to
-wh
ee
l e
ffic
ien
cy,
km
/kW
h
2020
Electric driving is more efficient and allows primary energy diversification
15 31/10/2013 Regional Power for Clean
Transport conference

Air Liquide, world leader in gases for industry, health and the environment
Annual
driving
distance
(1,000 km)
A/B C/D J
<10
10-20
>20
PHEV/BEV/FCEV
Lowest cost CO2 abatement solution
2050
FCEV
FCEVs are specifically suited for larger cars, that represent 70% of CO2
emissions
16 31/10/2013 Regional Power for Clean
Transport conference
Air Liquide, world leader in gases for industry, health and the environment
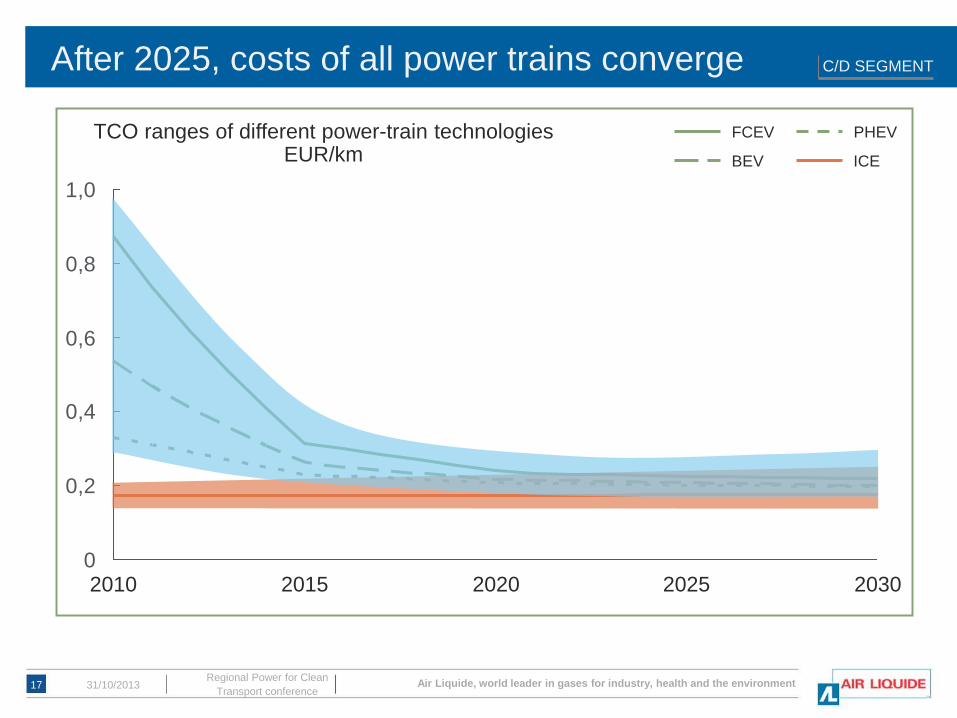
0
0,2
0,4
0,6
0,8
1,0
TCO ranges of different power-train technologies EUR/km
2030 2025 2020 2015 2010
BEV
FCEV
ICE
PHEV
C/D SEGMENT After 2025, costs of all power trains converge
17 31/10/2013 Regional Power for Clean
Transport conference
Air Liquide, world leader in gases for industry, health and the environment
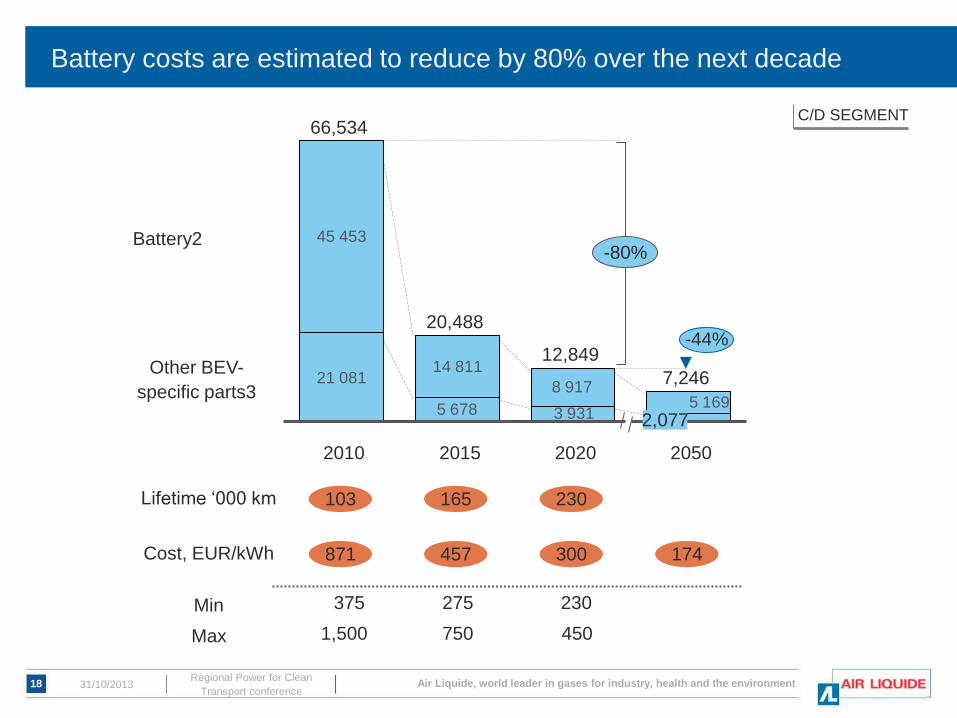
21 081
45 453
14 811
8 917
3 9315 678 5 169
7,246
12,849
20,488
Other BEV-
specific parts3
Battery2
2050
2,077
2020 2015 2010
66,534
-44%
Lifetime ‘000 km 103 165 230
Cost, EUR/kWh 871 457 300 174
Min 375 275 230
Max 1,500 750 450
-80%
Battery costs are estimated to reduce by 80% over the next decade
C/D SEGMENT
31/10/2013 18 Regional Power for Clean
Transport conference
Air Liquide, world leader in gases for industry, health and the environment
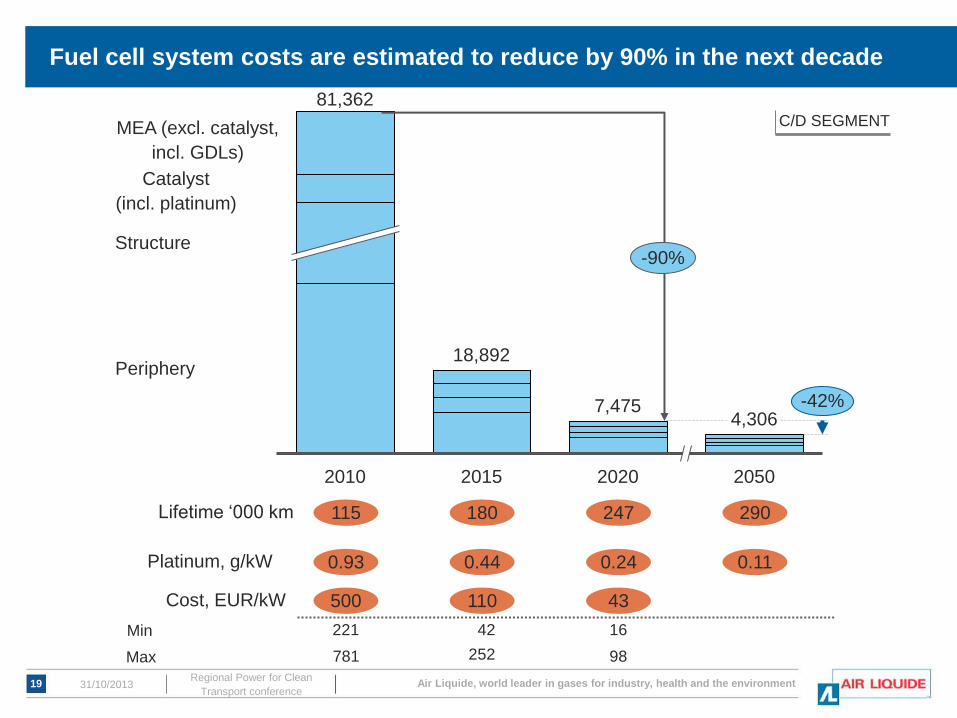
4,306
Periphery
Structure
Catalyst
(incl. platinum)
MEA (excl. catalyst,
incl. GDLs)
2050 2020
7,475
2015
18,892
2010
81,362
-42%
Lifetime ‘000 km 115 180 247 290
Platinum, g/kW 0.93 0.44 0.24 0.11
Cost, EUR/kW 500 110 43
Min
Max
42 16 221
781 252 98
-90%
Fuel cell system costs are estimated to reduce by 90% in the next decade
C/D SEGMENT
31/10/2013 19 Regional Power for Clean
Transport conference
Air Liquide, world leader in gases for industry, health and the environment
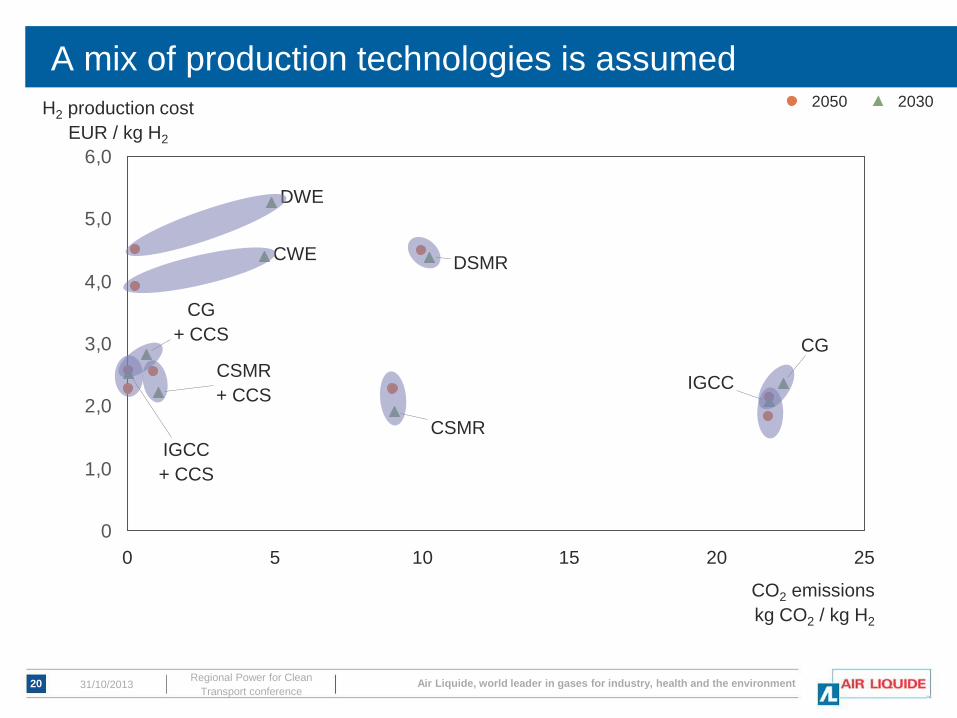
0
1,0
2,0
3,0
4,0
5,0
6,0
H2 production cost
EUR / kg H2
CO2 emissions
kg CO2 / kg H2
5 25 20 15 10 0
IGCC
+ CCS
IGCC
CG
+ CCS CG
CWE
DWE
CSMR
+ CCS
CSMR
DSMR
2030 2050
A mix of production technologies is assumed
31/10/2013 20 Regional Power for Clean
Transport conference

Air Liquide, world leader in gases for industry, health and the environment
0
5
10
15
2050
Hydrogen cost EUR per kg
2010 2045 2040 2035 2030 2025 2020 2015
-67%
Retail costs are inefficient in the first 15 years
Hydrogen
infrastructure 5%
of total cost
Retail Production Distribution
31/10/2013 21 Regional Power for Clean
Transport conference

Air Liquide, world leader in gases for industry, health and the environment
0
500
1 000
1 500
2 000
2 500
3 000
3 500
4 000
4 500
2050
3,363
2045
2,655
2040
3,581
2035
4,775
2030
3,922
2025
2,796
2020
890
2015
105
2010
Retail
Production
Distribution
EUR millions
Supply investments of about Eur 3 billion are required to build up a
market for 1 million vehicles
31/10/2013 Regional Power for Clean
Transport conference 22
Air Liquide, world leader in gases for industry, health and the environment
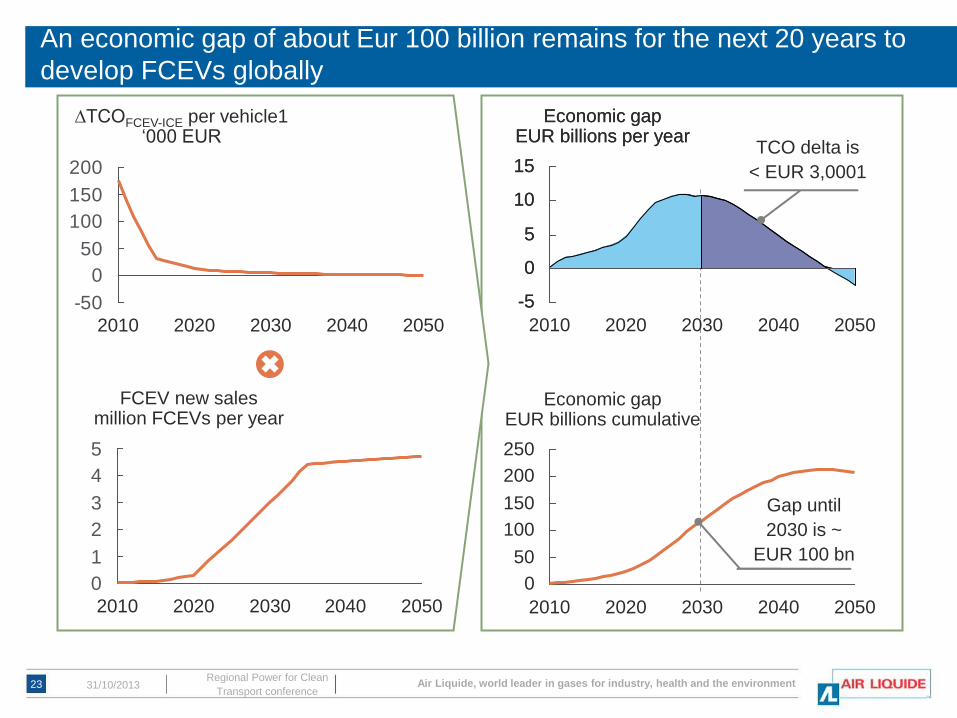
-50
0
50
100
150
200
∆TCOFCEV-ICE per vehicle1 ‘000 EUR
2050 2040 2030 2020 2010
0
1
2
3
4
5
2050
FCEV new sales million FCEVs per year
2010 2020 2040 2030
2020 2010 2050
5
2030 2040
Economic gap EUR billions per year
10
-5
0
15
150
Economic gap EUR billions cumulative
200
100
250
50
0
2050 2040 2010 2030 2020
Gap until
2030 is ~
EUR 100 bn
10
5
0
-5
15
Economic gap EUR billions per year
TCO delta is
< EUR 3,0001
An economic gap of about Eur 100 billion remains for the next 20 years to
develop FCEVs globally
31/10/2013 Regional Power for Clean
Transport conference 23
End of presentation Thank you for your attention