infrastructure and policy needs for personal electric
TRANSCRIPT
Infrastructure and Policy Needs for Personal Electric Mobility Devices in a Connected Vehicle World
Final Report
by
Judith L. Mwakalonge, South Carolina State University Md Mahmud Hasan Mamun, South Carolina State University
Jae-Dong Hong, South Carolina State University Mashrur Chowdhury, Clemson University
Contact information
Judith L. Mwakalonge, Ph.D. 134 Engineering and Computer Science Complex, SCSU
300 College Street NE, Orangeburg, SC 29117 Phone: (803) 536-8321; E-mail: [email protected]
November 2019
Center for Connected Multimodal Mobility (C2M2)
200 Lowry Hall, Clemson University Clemson, SC 29634
Infrastructure and Policy Needs for Personal Electric Mobility Devices in a Connected Vehicle World, 2019
Center for Connected Multimodal Mobility (C2M2) Clemson University, Benedict College, The Citadel, South Carolina State University, University of South Carolina
Page ii
DISCLAIMER The contents of this report reflect the views of the authors, who are responsible for the facts and the accuracy of the information presented herein. This document is disseminated in the interest of information exchange. The report is funded, partially or entirely, by the Center for Connected Multimodal Mobility (C2M2) (Tier 1 University Transportation Center) Grant, which is headquartered at Clemson University, Clemson, South Carolina, USA, from the U.S. Department of Transportation’s University Transportation Centers Program. However, the U.S. Government assumes no liability for the contents or use thereof.
Non-exclusive rights are retained by the U.S. DOT.

Infrastructure and Policy Needs for Personal Electric Mobility Devices in a Connected Vehicle World, 2019
Center for Connected Multimodal Mobility (C2M2) Clemson University, Benedict College, The Citadel, South Carolina State University, University of South Carolina
Page iii
ACKNOWLEDGMENT The authors would like to thank the administration of the Transportation Program of the South Carolina State University (SCSU) for assisting in completing this study. They would also like to thank Dr. Mashrur “Ronnie” Chowdhury, Director of the Center for Connected Multimodal Mobility (C2M2), and his research team (Dr. Mizanur Rahman, Md. Mhafuzul Islam, and Md. Zadid Khan) for providing support for the field experiments at the Clemson University Connected Vehicle Testbed (CU-CVT).

Infrastructure and Policy Needs for Personal Electric Mobility Devices in a Connected Vehicle World, 2019
Center for Connected Multimodal Mobility (C2M2) Clemson University, Benedict College, The Citadel, South Carolina State University, University of South Carolina
Page iv
Technical Report Documentation Page1. Report No. 2. Government Accession No. 3. Recipient’s Catalog No.
4. Title and Subtitle
Infrastructure and Policy Needs for Personal Electric Mobility Devices in a Connected Vehicle World
5. Report Date
November 2019
6. Performing Organization Code
7. Author(s)
Judith L. Mwakalonge, Ph.D.; ORCID: 0000-0002-7497-6829; Md Mahmud Hasan Mamun; ORCID: 0000-0003-4090-3661; Jae-Dong Hong, Ph.D.; ORCID: 0000-0003-1095-1195; and Mashrur Chowdhury, Ph.D.; ORCID: 0000-0002-3275-6983.
8. Performing Organization Report No.
9. Performing Organization Name and Address
South Carolina State University 300 College Street NE, Orangeburg, SC 29115
10. Work Unit No.
11. Contract or Grant No.
69A3551747117
12. Sponsoring Agency Name and Address
Center for Connected Multimodal Mobility (C2M2) Clemson University 200 Lowry Hall, Clemson Clemson, SC 29634
13. Type of Report and Period Covered
Final Report (September 2017 – November 2019)
14. Sponsoring Agency Code
15. Supplementary Notes
16. Abstract
The Personal Electric Mobility Device (PEMD) is becoming a popular, accessible mode of transportation among the people who used to walk, bike, and drive cars. Although PEMDs have plenty of features, their safety and operational features while running on a walkway or roadway are less known. As these devices are too fast for a footpath and too slow for highways, they may need particular infrastructure and policy. This report provides the outcomes of an investigation on policy and infrastructure needs for PEMDs on walkways and in the connected world. This study analyzed the safety data from the National Electronic Injury Surveillance System (NEISS) to investigate the features of crashes related to PEMDs. Data was collected from the NEISS Query Builder website for four NEISS product codes (1329-Electric Powered Scooters, 1744-Electric Mobility Cart, 3215-Mopeds, and 5042-Electric Skateboards) from 2006 to 2017. It was found that there were 1,085,352 estimated injuries nationwide for these four products during that time. This study analyzed PEMD-related injuries by time (year, season, month, day, weekend, or workday), the demographics of the victims (gender, age, race), the location of the crashes, and affected body-part of victims. Following this analysis, an experiment was conducted to examine the effect of a hoverboard on pedestrians’ walking speed in traditional operating conditions; it was found that pedestrian walking speed was reduced up to 10% when sharing the walkway with a hoverboard. Based on the experimental data, a simulated environment was created in VISSIM, a micro-simulation software, to measure any changes in operating characteristics of the pedestrian with and without PEMDs on a walkway. The simulation results concluded that PEMDs like a hoverboard or an electric scooter increased the delay time on the sidewalk; this magnitude is higher for a narrow path than a wider one. In a real-world test, the feasibility of a hoverboard was evaluated in a connected environment, and it was found that a connected vehicle could detect the hoverboard at a stopping-sight-distance at 40 mph. Finally, this report provides some recommendations for using PEMDs on walkways shared with pedestrians.
17. Keywords
Personal Electric Mobility Device; Safety Impact; Operational Impact; Delay Time; Walking Speed; NEISS; VISSIM; Connected Environment.
18. Distribution Statement
This report or any part of this report is restricted to publish until prior permission from the authors.
19. Security Classif. (of this report)
Unclassified
20. Security Classif. (of this page)
Unclassified
21. No. of Pages
66
22. Price
NA
Infrastructure and Policy Needs for Personal Electric Mobility Devices in a Connected Vehicle World, 2019
Center for Connected Multimodal Mobility (C2M2) Clemson University, Benedict College, The Citadel, South Carolina State University, University of South Carolina
Page v
TABLE OF CONTENTS
DISCLAIMER ......................................................................................................................................... ii
ACKNOWLEDGMENT .......................................................................................................................... iii
EXECUTIVE SUMMARY ....................................................................................................................... 1
CHAPTER 1 ........................................................................................................................................... 3
Introduction ........................................................................................................................................ 3
1.1 Personal Electric Mobility Devices .......................................................................................... 3
1.2 Objectives of the Project .......................................................................................................... 5
CHAPTER 2 ........................................................................................................................................... 6
Literature Review ............................................................................................................................... 6
2.1 Studies on PEMDs Growth and Category ............................................................................... 6
2.2 Studies on Acceptability and Application of PEMDs ............................................................... 6
2.3 Research on the Safety Issues Regarding the PEMDs .......................................................... 7
2.4 Investigation of present Rules & Regulation Regarding PEMDs ............................................ 7
CHAPTER 3 ........................................................................................................................................... 8
Research Approach ........................................................................................................................... 8
3.1 PEMD Related Injury Estimation from NEISS Database ........................................................ 8
3.2 PEMDs in a Traditional Operating Environment ................................................................... 10
3.3 PEMDs in Connected Environment Operating Conditions.................................................... 12
CHAPTER 4 ......................................................................................................................................... 14
Data Analysis and Comparison ....................................................................................................... 14
4.1 NEISS Safety Data Analysis.................................................................................................. 14
4.2 Data Analysis for PEMDs in a Traditional Operating Environment ....................................... 24
4.3 Data Analysis for a Simulated Environment .......................................................................... 26
4.4 Data Analysis for Connected Environment ........................................................................... 28
CHAPTER 5 ......................................................................................................................................... 42
Conclusions and Recommendations ............................................................................................... 42
5.1 Conclusions ........................................................................................................................... 42
5.2 Recommendations ................................................................................................................. 42
REFERENCES ..................................................................................................................................... 43
APPENDICES ...................................................................................................................................... 45
Appendix A - PEMDs along Roadway in a Non-connected Environment (Case-A) ................... 45
Appendix B - PEMDs along Roadway in a Connected Environment (Case-B) .......................... 50
Appendix C - PEMDs crossing the Roadway in a Non-connected Environment (Case-C) ........ 56
Appendix D - PEMDs crossing the Roadway in a Connected Environment (Case-D) ............... 58
Infrastructure and Policy Needs for Personal Electric Mobility Devices in a Connected Vehicle World, 2019
Center for Connected Multimodal Mobility (C2M2) Clemson University, Benedict College, The Citadel, South Carolina State University, University of South Carolina
Page vi
List of Tables Table 1 List of NEISS PEMDs Used in the Analysis ..................................................................14 Table 2 National Injury Estimates for All PEMDs by Year ..........................................................14 Table 3 National Injury Estimates for All PEMDs by Season .....................................................16 Table 4 National Injury Estimates for Specific PEMD Types by Month .....................................16 Table 5 National Injury Estimates for Specific PEMD Types by Day ..........................................18 Table 6 National Injury Estimates for Specific PEMD Types by Age ..........................................19 Table 7 National Injury Estimates for Specific PEMD Types by Gender ....................................20 Table 8 National Injury Estimates for Specific PEMD Types by Race ........................................21 Table 9 National Injury Estimates for All PEMDs by Location ....................................................22 Table 10 National Injury Estimates for Different Type of PEMDs by Body Part(s) .....................23 Table 11 Cases and Scenarios for the Experiment in Traditional Operating Condition ..............25 Table 12 Travel Speeds of Pedestrians and a Hoverboard Rider in a Traditional Operating Environment ..............................................................................................................................25 Table 13 Walking Speed Reduction with a Hoverboard Present on a Walkway.........................26 Table 14 Travel Speed Data in a Traditional Environment from the Simulation Run in VISSIM .27 Table 15 Travel Delay of Pedestrians and a Hoverboard Rider in VISSIM Simulation ...............27 Table 16 Cases and Scenarios for the Experiment in a Connected Environment ......................28
List of Figures Figure 1 Examples of Personal Electric Mobility Devices ........................................................... 4 Figure 2 Flowchart of the Research Approach ........................................................................... 8 Figure 3 Walkways Used in the Experiment in a Traditional Operating Environment .................10 Figure 4 A 2-Dimensional View of Pedestrians Walking in VISSIM ...........................................11 Figure 5 A 3-Dimensional View of Pedestrian Walking in the VISSIM .......................................11 Figure 6 Study Area of PEMDs in a Connected Environment Operating Condition ...................12 Figure 7 OBU and RSU Used to Create a Connected Environment ..........................................12 Figure 8 Setup of OBU and RSU to Create a Connected Environment .....................................13 Figure 9 Checking of Connectivity Among Pedestrians, Hoverboard, and Car ..........................13 Figure 10 National Injury Estimates for All PEMDs by Year.......................................................15 Figure 11 National Injury Estimates for Specific PEMD Types by Year .....................................15 Figure 12 National Injury Estimates for Specific PEMD Types by Season .................................16 Figure 13 National Injury Estimates for All PEMDs by Month ....................................................17 Figure 14 National Injury Estimates for Specific PEMD Types by Month ...................................17 Figure 15 National Injury Estimates of All PEMDs by Day .........................................................18 Figure 16 National Injury Estimates for Specific PEMD Types by Day ......................................18 Figure 17 National Injury Estimates of for All PEMDs by Age ....................................................19 Figure 18 National Injury Estimates for Specific PEMD Types by Age ......................................20 Figure 19 National Injury Estimates for Specific PEMD Types by Gender .................................20 Figure 20 National Injury Estimates for All PEMDs by Race ......................................................21 Figure 21 National Injury Estimates for All PEMDs by Location .................................................22 Figure 22 National Injury Estimates for Specific PEMD Types by Location ...............................22 Figure 23 National Injury Estimates for All PEMDs by Body Part ..............................................24 Figure 24 National Injury Estimates for a Specific PEMD by Body Part .....................................24 Figure 25 Impact of a Hoverboard on Pedestrian Walking Speed .............................................26 Figure 26 Pedestrian and Hoverboard Traveling Along the Roadway .......................................29 Figure 27 Pedestrian and Hoverboard Crossing the Roadway ..................................................29

Infrastructure and Policy Needs for Personal Electric Mobility Devices in a Connected Vehicle World, 2019
Center for Connected Multimodal Mobility (C2M2) Clemson University, Benedict College, The Citadel, South Carolina State University, University of South Carolina
Page vii
Figure 28 Speed Distributions of Pedestrian and Vehicle for Case-A Scenario-1 ......................30 Figure 29 Distance between Vehicle and Pedestrian for Case-A Scenario-1 ............................30 Figure 30 Speed Distributions of Pedestrian and Vehicle for Case-A Scenario-2 ......................31 Figure 31 Distance between Vehicle and Pedestrian for Case-A Scenario-2 ............................31 Figure 32 Speed Distribution for Case-A Scenario-3 at CU-CVT ...............................................32 Figure 33 Distance Distribution of Vehicle, Pedestrian and Hoverboard for Case-A Scenario-3 32 Figure 34 Speed Distribution for Case-A Scenario-4 .................................................................33 Figure 35 Distance Distribution of Vehicle for Case-A Scenario-4 .............................................33 Figure 36 Speed Distribution for Case-B Scenario-1 at CU-CVT ...............................................34 Figure 37 Distance Between Vehicle and Pedestrian for Case-B Scenario-1 ............................34 Figure 38 Speed Distribution for Case-B Scenario-2 .................................................................35 Figure 39 Distance between Vehicle and Pedestrian for Case-B Scenario-2 ............................35 Figure 40 Speed Distribution for Case-B Scenario-3 at CU-CVT ...............................................36 Figure 41 Distance Between Vehicle, Hoverboard, and Pedestrian for Case-B Scenario-3 .......36 Figure 42 Speed Distribution for Case-B Scenario-4 at CU-CVT ...............................................37 Figure 43 Distance Distribution of Vehicle from Pedestrian and Hoverboard for Case-B Scenario-4 ...............................................................................................................................................37 Figure 44 Speed Distribution for Case-C Scenario-1 .................................................................38 Figure 45 Distance Between Vehicle and Pedestrian for Case-C Scenario-1 ............................38 Figure 46 Speed Distribution for Case-C Scenario-2 .................................................................39 Figure 47 Distance Distribution Between Vehicle, Pedestrian and Hoverboard for Case-C Scenario-2 at CU-CVT ..............................................................................................................39 Figure 48 Speed Distribution for Case-D Scenario-1 .................................................................40 Figure 49 Distance between Vehicle and Pedestrian for Case-D Scenario-1 ............................40 Figure 50 Speed Distribution for Case-D Scenario-2 .................................................................41 Figure 51 Distance Distribution of Vehicle from Pedestrian and Hoverboard for Case-D Scenario-2 ...............................................................................................................................................41

Infrastructure and Policy Needs for Personal Electric Mobility Devices in a Connected Vehicle World, 2019
Center for Connected Multimodal Mobility (C2M2) Clemson University, Benedict College, The Citadel, South Carolina State University, University of South Carolina
Page 1
EXECUTIVE SUMMARY Personal Electric Mobility Devices (PEMDs) were initially created for people with mobility, cardiac, breathing, and/or neural disabilities. However, in recent years, the use of PEMDs has expanded, and PEMDs are becoming more popular. Due to advances in technology, personal electric mobility devices can be utilized to bridge the first- and last-mile gap (thus increasing accessibility to public transportation), improve people’s mobility, and reduce congestion and vehicle emissions by substituting for automobile travel. As more innovative mobility technologies are developed, they will provide more transportation options for people with mobility disabilities, public transport users, and those wanting to maintain an active lifestyle.
The current infrastructure in place for non-motorized traffic was designed for traditional transportation modes, e.g., pedestrians and bicyclists, and it is unclear how the existing infrastructure in place handles non-traditional non-motorized traffic (e.g., travelers on Segways, scooters, mopeds, hoverboards, and so on) and how infrastructure design and policy should be changed to accommodate PEMDs. Therefore, it is crucial for transport planners and public administrators to determine how non-motorized amenities (walkways, sidewalks, paths, and trails) should be maintained, including when/where specific vehicles and activities should be permitted, and how such legislation should be developed and implemented.
This study documents several types of PEMDs currently used on public transportation systems and explores the impact of PEMDs on walkways and the safety issues associated with these devices. Further, this study examines the operational effects of PEMDs in both traditional and connected environments. To explore the hazards of PEMDs, this study has analyzed data on public safety from the National Electronic Injury Surveillance System (NEISS). This data was collected from the NEISS Query Builder website for four NEISS product codes (1329 Electric Powered Scooters, 1744 Electric Mobility Cart, 3215 Mopeds, and 5042 Electric Skateboards) from 2006 to 2017. It was found that there were an estimated 1,085,352 injuries nationwide, which involve these devices, during that time. This analysis was expanded to organize these incidents by time (year, season, month, day, weekend, or workday), the physical characteristics of victims (gender, age, race), the location of the incidents, and the body parts injured, looking for trends. This study found that most crashes occurred during summer months, on weekends, and to kids age 2-10 years old. It was also discovered that head injuries are prevalent among PEMDs riders. Following the injury data analysis, the first experiment was conducted to investigate the effect of a hoverboard on pedestrians’ walking speed in a traditional operating environment. This experiment was conducted at South Carolina State University in Orangeburg, South Carolina. The travel times for each pedestrian and hoverboard rider for each run were recorded during the experiment. From the travel distance and travel time, the walking speed and hoverboard running speed were calculated for each trial. It was found that the highest walking speed at the walkway near Engineering and Computer Science Complex (ECSC) building without the presence of a hoverboard is 3.12 mph, and with a hoverboard is 2.77 mph; for the sidewalk along Geathers Street, without PEMDs the maximum walking speed is 3.29 mph, and with PEMDs it is 2.74 mph. Thus, it was found that walking speed was reduced up to 10% when sharing a walkway with a hoverboard. Using the data collected in this experiment, a simulated environment was created in VISSIM, a micro-simulation software, to measure the delay time for pedestrians when PEMDs are present on a walkway. The simulation results showed that PEMDs like a hoverboard would increase the delay time on the sidewalk, and this magnitude is higher for a narrow path than a wider one.
Infrastructure and Policy Needs for Personal Electric Mobility Devices in a Connected Vehicle World, 2019
Center for Connected Multimodal Mobility (C2M2) Clemson University, Benedict College, The Citadel, South Carolina State University, University of South Carolina
Page 2
The second experiment was carried out to explore the impact of the PEMDs on infrastructure utilizing the connected operating environment at the Clemson University Connected Vehicle Testbed (CU-CVT) in Clemson, South Carolina. Four different cases were defined, and twelve real-life scenarios were considered. For each situation, the travel time, speed, and the location of the pedestrian, hoverboard, and vehicle were recorded to determine the impact of hoverboard in the connected environment. From the experiment, it was observed that PEMD affects vehicle speed. The connected vehicle, when traveling at 40 mph, started reducing its speed at a distance of 250 ft. away from the pedestrian or hoverboard after receiving alert from the connected pedestrian or hoverboard. In summary, this study recommends that riders must receive proper training before riding PEMDs on public infrastructure and should wear protective gear to reduce injury incidences and severity. It is also recommended that transportation planners and professionals should consider the impact of PEMDs on the width of the walkway. Since these non-traditional modes increase the delay time and reduce pedestrians’ walking speed, an alternative lane could be created to divert PEMDs from sidewalks, and the use of these non-traditional vehicles on sidewalks or walkways could be restricted. Further, the widening of walkways may help to reduce the time delay for pedestrians.

Infrastructure and Policy Needs for Personal Electric Mobility Devices in a Connected Vehicle World, 2019
Center for Connected Multimodal Mobility (C2M2) Clemson University, Benedict College, The Citadel, South Carolina State University, University of South Carolina
Page 3
CHAPTER 1
Introduction 1.1 Personal Electric Mobility Devices
This research project is funded by the Center for Connected Multimodal Mobility (C2M2), a United States Department of Transportation (USDOT) Tier 1 University Transportation Center (UTC). The Center’s vision is to serve as an innovation center for transforming multimodal transportation through connectivity, data analytics, and automation. The Center addresses three USDOT priorities, namely, (i) promoting access to opportunities and equity, (ii) improving the mobility of people and goods, and (iii) optimizing passenger movement. This study examines the infrastructure and policy needs for Personal Electric Mobility Devices (PEMDs) in the connected vehicle world. PEMDs were first launched to assist people with neural, cardiac, breathing, and/or mobility disabilities. The basic design attributes of PEMDs are that they are lightweight, easy to operate, and user-friendly (Miller, et al., 2010). PEMDs have become popular due to their multiple uses, and the fields of application have been expanded over time. For example, in the past, wheelchairs were only used as personal mobility devices if a person was physically disabled (Edwards & Mccluskey, 2010). In recent years, PEMDs are not only used to help people with mobility limitations but are also used as an alternative mode of transportation and as toys for kids. Figure 1 depicts some examples of PEMDs currently used in different regions of the world. These modern PEMDs come with advanced technology and have the potential to increase transportation accessibility and mobility, which is why they are becoming a popular mode of transportation for people. By utilizing some of these PEMDs, for example, a Segway, people are able to travel up to a speed of 18 mph with a push of a button, where the human’s walking speed is approximately about 3.1 mph (Carey, 2005) (TranSafety, 1997) (Segway, 1999). PEMDs offer a lot of attractive and beneficial features for transportation systems: for example, they can reduce the first- and last-mile gap for public transport, increase travel speed, decrease traffic congestion by replacing shorter vehicle trips, reduce air pollution emissions, decrease road and parking facility needs(Liu & Parthasarathy, 2003) (Hoenig, et al., 2007) (Miller, et al., 2010) (Dowling, et al., 2015). The use of PEMD has been growing, and they have the potential to become a part of an active day-to-day lifestyle. As more advanced versions of PEMDs will be inevitably introduced in the future, their impact on the transportation system seems set to increase (Hoenig, et al., 2007). However, there are many challenges associated with them. PEMDs are comparatively faster than human walking speed but slower than the speed of an automobile. With their rise in popularity, there are plenty of safety concerns that have been raised regarding using these devices with pedestrians or motor vehicle facilities in mixed traffic. Since PEMDs like Segways, electric skateboards, or hoverboards are faster than most pedestrians, they can easily be involved in severe injury or fatal crashes due to differential speeds (Litman & Fitzroy, 2015) (Litman, 2006). For instance, a research study carried out in Australia found that between 2006 and 2008 about 713 patients were involved in motorized mobility scooter accidents, which was comparatively higher than 16% of all severe injuries reported in 2008 to 2009 (Clapperton & Cassell, 2011). Later, in Sydney in 2010, a survey was carried out among the injured patients at several hospitals; it concluded that about 31 patients out of 149 were hospitalized after being involved in PEMD accidents (Edwards & Mccluskey, 2010). The traditional transportation infrastructures are designed and constructed based on conventional motorized traffic like cars, buses, and trucks, and non-motorized transport such as pedestrians

Infrastructure and Policy Needs for Personal Electric Mobility Devices in a Connected Vehicle World, 2019
Center for Connected Multimodal Mobility (C2M2) Clemson University, Benedict College, The Citadel, South Carolina State University, University of South Carolina
Page 4
and bicyclists. Therefore, there are gaps in our knowledge about how PEMDs will affect the infrastructure and traffic safety as they increase. It is crucial for transportation planners, professionals, and public officials to consider these non-traditional motorized modes along with pedestrians or bicyclists.
(i) Electric Unicycle (ii) Egret (Kick Electric Scooter) (iii) Electric Scooter
(iv) Three-wheeler Electric Scooter (v) Electric Mobility Cart (vi) Electric Bike
(vii) One-Wheeler Hoverboard (viii) Electric Skateboard (ix) Electric Solo-wheel
(x) Hoverboard (xi) Segway (xii) Electric Caster Board
Figure 1 Examples of Personal Electric Mobility Devices (Source: pngkey.com, imgbin.com & iotatrax.com)
Infrastructure and Policy Needs for Personal Electric Mobility Devices in a Connected Vehicle World, 2019
Center for Connected Multimodal Mobility (C2M2) Clemson University, Benedict College, The Citadel, South Carolina State University, University of South Carolina
Page 5
1.2 Objectives of the Project
In this study, safety concerns associated with PEMDs have been examined, and their impact on pedestrian walking is discussed. First, raw safety data was queried from the National Electronic Injury Surveillance System (NEISS) from 2006 to 2017 for four product codes, which are 1329 (Electric Powered Scooters), 1744 (Electric Mobility Cart), 3215 (Mopeds), and 5042 (Electric Skateboards). Then two experiments were devised, one in a traditional operating environment and another in a connected environment. These experiments were conducted to investigate the influence of these devices on the walking of the pedestrians who share the sidewalk with PEMDs. In addition, the data from the traditional operating environment was input into micro-simulation software (VISSIM) for further study. Finally, the feasibility and impact of a hoverboard in a connected environment were examined by a real-world experiment.
Infrastructure and Policy Needs for Personal Electric Mobility Devices in a Connected Vehicle World, 2019
Center for Connected Multimodal Mobility (C2M2) Clemson University, University of South Carolina, South Carolina State University, The Citadel, Benedict College
Page 6
CHAPTER 2
Literature Review This section of the report reviews previous research on PEMDs. Scholarly articles and work in the traffic safety, injury prevention, and risk management fields were reviewed to illustrate the impacts of these non-traditional modes on roadway traffic operation and safety. 2.1 Studies on PEMD’s Growth and Category
Freedonia Custom Research, an international industry market research association, estimated in 2006 that the demand for wheelchairs and PEMDs for the United States will rise 5% per year from 2010 and predicted that number to expand more in the next ten years (Freedonia, 2006). Another study conducted by Transparency Market Research in 2006 states that the market value of PEMDs will expand at a rate of 7.2% from 2016 to 2024, which will eventually lead to $14.6 billion spent in 2024 (Research, 2016). This report also concluded that the features of PEMDs like cost-effectiveness, innovative advanced technologies, and user-friendly interaction would attract users in the future. Besides future demand predictions, many researchers have conducted studies to classify PEMDs. A United Kingdom-based research institute, the Research Institute for Consumer Affairs (RICA), first ranked these non-traditional modes based on their running speed and overall weights. They categorized the PEMDs as Class 2, which were allowed on roadways upon registration, and Class 3, which were permitted to operate on footpaths with proper licenses and registration. Dowling et al. (2015) conducted a similar study within the controlled pedestrian environment at the Macquarie University campus. They evaluated the perception and acceptance of PEMDs among people where they grouped the non-traditional modes according to their operating maneuvers (Dowling, et al., 2015). They discussed three types of non-motorized non-traditional vehicles, which were one-wheel (electric unicycle, solo-wheel), two-wheel (electric scooter, skateboard, hoverboard, caster board, Egret), and three or more-wheels (Qugo, electric cart). Another research study showed that riders preferred the two-wheeled devices due to their comfortable maneuvering, while one-wheelers have a balance issue, which requires proper practice, and three or more-wheelers have problems traveling at high speed (Litman & Fitzroy, 2015). Some previous reviews have demonstrated that Canada, New Zealand, and the USA treat PEMDs as pedestrians and the Netherlands, Switzerland, Ireland, South Africa, and some other European and African countries consider them as road users (Bruneau & Maurice, 2012). 2.2 Studies on the Acceptability and Application of PEMDs
Gitelman et al. (2016) examined how electric scooters can enhance the mobility and standard of living of older people (Gitelman, et al., 2016). Another research study was jointly conducted by NRMA Motoring & Services, the Australian Competition and Consumer Commission (ACCC), CHOICE, Enable NSW, and Flinders University to investigate user preferences towards PEMDs in Australia (NRMA, 2012). They surveyed 2406 randomly selected people who did not use PEMDs and 515 scooter users. It was found that 50% of scooter riders were below 60 years old, and they were less vulnerable to accidents as they lived in a rural region. Moreover, the researchers concluded that while a scooter assists those who would be pedestrians during long-distance walks, they cannot be an alternative to a personal vehicle. It should be noted that this survey was based on people over 18 years old and ignored children, who are more susceptible to injury by PEMDs.
Infrastructure and Policy Needs for Personal Electric Mobility Devices in a Connected Vehicle World, 2019
Center for Connected Multimodal Mobility (C2M2) Clemson University, Benedict College, The Citadel, South Carolina State University, University of South Carolina
Page 7
2.3 Research on the Safety Issues Regarding the PEMDs
The Canadian Council of Motor Transport Administrators conducted a real-world study in 2010, which included questionnaires for participants riding one, two and three-wheeled devices on footpaths and shared paths (Road Safety Canada Consulting, 2011). They observed that the average speed of PEMDs is 6 km/hr., which is too fast for walkways and too slow for roadways. In addition, they concluded that electric scooters and other PEMDs have a deleterious impact on pedestrians with impaired hearing or vision. Another study indicated that safety concerns were significantly higher for elderly or disabled people (Edwards & Mccluskey, 2010). Goodwin et al. (1998) learned that pedestrians and PEMD users have a propensity for more significant collision rates than drivers on a per-mile basis (Goodwin, et al., 1998). Further, the users of PEMDs are more vulnerable and exposed to a higher risk of being seriously injured compare to other road users, such as pedestrians (Löfqvist, et al., 2012). Powell et al. (2004) conducted a study to evaluate injuries involving scooters among the U.S. youth and compared them with inline skates and skateboards (Powell & Tanz, 2004). They estimated that of 190,878 casualties, and 90% of victims with injuries, were less than 15 years old. Results also indicated that the rate for scooter related-injuries peaked in 2001; further, forearm fractures were the most common injury type (56%) and accidents primarily involving children aged 5-12 years. Siracuse et al. (2017) explored hoverboard-related injuries with data extracted from the NEISS database from 2011 to 2015 (Siracuse, et al., 2017). This research showed that in 2015, there was a higher number of injuries with the most common type being a fracture (38.9%). At the end of the research period, there was substantial damage to various parts of the body, including arms (475% higher), legs (178% higher), heads and necks (187% higher), and over 4000% more wrist fractures than the previous four years. 2.4 Investigation of present Rules & Regulation Regarding PEMDs
Since PEMDs may have a significant impact on the health and safety of the user, some strategies have been proposed in various studies to handle mixing non-traditional traffic with regular pedestrians and automobiles (Hoenig, et al., 2007) (Litman, 2006). Currently, most governments have legislation to regulate PEMD use on footpaths such as helmet requirements (Zegeer, et al., 2002) (Liu & Parthasarathy, 2003). Many cities have introduced a code of conduct to promote safety with these non-traditional modes. For example, some major cities in China and Australia have restricted the use of PEMDs on roadways and limited them on public sidewalks, except for when used by physically disabled or elderly people (Rose & Richardson, 2009). Twaddell & Lynott, (2012) suggested incorporating safety education, outreach programs, and policy enforcement to provide necessary information to improve safety for these non-traditional modes (Edwards & Mccluskey, 2010) (Poncy, et al., 2011).

Infrastructure and Policy Needs for Personal Electric Mobility Devices in a Connected Vehicle World, 2019
Center for Connected Multimodal Mobility (C2M2) Clemson University, Benedict College, The Citadel, South Carolina State University, University of South Carolina
Page 8
CHAPTER 3
Research Approach The primary focus of this research was to investigate the traffic safety and operational impacts of PEMDs at the roadway network-level. The NEISS injury data were used to determine the effect of PEMDs on transportation safety. The injury data were collected from the NEISS database, which is obtained from the U.S. Consumer Product Safety Commission (CPSC) website (CPSC, 2019). This study extracted the data from 2006 to 2017 related to accidents involving scooters, skateboards, mopeds, and electric mobility carts to analyze and understand the safety implications of PEMDs. After analyzing safety, the traffic operational impact of PEMDs was investigated in two different roadway environments, i) a traditional environment (i.e., a non-connected transportation system); and ii) a connected environment. To analyze the impact of PEMDs on traffic operations in a traditional environment, a real-world experiment was conducted at South Carolina State University in Orangeburg, South Carolina. The data collected from this experiment was then used to create simulations using micro-simulation software named VISSIM. Another real-world experiment was conducted in the Clemson University Connected Vehicle Testbed (CU-CVT) in Clemson, South Carolina, to determine the impact of PEMDs in a connected vehicle environment. Figure 2 shows the research approach, with the details described in the following sections.
Figure 2 Flowchart of the Research Approach
3.1 PEMD-Related Injury Estimation from the NEISS Database
This section will provide a description of the NEISS data and the injury calculation procedure.
Impact of PEMD on Transportation System
Impact on Traffic Operation
Impact on Connected Environment
Experiment in Connected
Environment Operating Condition
Impact on Traditional Operating Condition
Simulation on VISSIM for Traditional
Operating Condition
Experiment in Traditional Operating Condition
Impact on Traffic Safety
PEMD Related Injury Estimation
from NEISS Database

Infrastructure and Policy Needs for Personal Electric Mobility Devices in a Connected Vehicle World, 2019
Center for Connected Multimodal Mobility (C2M2) Clemson University, Benedict College, The Citadel, South Carolina State University, University of South Carolina
Page 9
3.1.1 NEISS Database The NEISS database is a national archive that gathers and stores different product-related injury information from hospitals across the U.S. NEISS follows the rules and regulations of the American Hospital Association Registration to collect and process data. The mandatory requirements for hospitals in terms of collecting, analyzing, and preserving data are that the hospital must have a minimum of six beds for patients and 24-hour service or an emergency room. According to the size, location, type, and the number of patients visiting annually, the hospitals are typically categorized into five groups, which are small, medium, large, very large, and children’s hospitals. The reporting section of the emergency department of each hospital collects the data following the specific format and records the required patient information in the medical record book. Then the data is coded and transferred to the database according to the NEISS coding manual. Later, the CPSC updates the NEISS database, generates injury estimates nationally from the hospital data and maintains the computerized NEISS database (CPSC, 2019). For this study, the NEISS coding manual was utilized to decode the information and extract data for injuries due to PEMDs. The devices used throughout the study were identified as scooters, skateboards, mopeds, and electric mobility carts, as derived from product codes 1329, 5042, 3215, and 1744, respectively. The decoding of the data also used patient data, including demographic characteristics such as age, gender, race, time (year, season, month, and day), body part affected, and location of the incident.
3.1.2 PEMD Related Injury Estimation NEISS usually computes the weight of hospitals each year from the raw input and then calculates national estimates of injuries for specific product codes. According to the NEISS Design and Implementation Manual (Schroeder & Ault, 2001), the formula used by NEISS to calculate the weight of hospitals is as follows,
𝑤𝑡𝑔𝑖 = 𝑁ℎ ∗ 𝑛ℎ
′ ∗ 𝑅ℎ
𝑛ℎ ∗ 𝑟ℎ
where: 𝑤𝑡𝑔𝑖 = Weight of hospital i for a specific product code or injury type
𝑁ℎ = Number of hospitals in the 1995 sampling frame for stratum h
𝑛ℎ = Number of hospitals selected for the NEISS sample for stratum h 𝑛ℎ
′ = Number of in-scope hospitals in the NEISS sample for stratum h
𝑟ℎ = Number of NEISS hospitals participating in stratum h for the given month
𝑅ℎ = Ratio adjustment for combined stratum h However, in the extracted database used for this study, the weight of hospitals was calculated for each product code. Therefore, the national estimates of injury for specific product codes were calculated in this study by using an equation in the NEISS Design and Implementation Manual (Schroeder & Ault, 2001). The equation used for estimating national injury is:
𝐸 = ∑ 𝑤𝑡𝑔𝑖 ∗ 𝑥𝑖
𝑛
𝑖
Where: E = Injury estimation for hospital i (here, i = 1, 2, 3, … … … n) 𝑤𝑡𝑔𝑖 = Weight of hospital i for the month
𝑥𝑖 = Number of cases for a specified injury type reported by hospital i for the given month

Infrastructure and Policy Needs for Personal Electric Mobility Devices in a Connected Vehicle World, 2019
Center for Connected Multimodal Mobility (C2M2) Clemson University, Benedict College, The Citadel, South Carolina State University, University of South Carolina
Page 10
By using the above equations, the total injuries during 2006-2017 caused by the four PEMDs were calculated from the NEISS raw data and analyzed to understand the damage resulting from the use of these four types of PEMDs. 3.2 PEMDs in a Traditional Operating Environment
A real-world experiment and a simulation on VISSIM were carried out to investigate the impact of PEMDs in a traditional operating environment.
3.2.1 Experiment in Traditional Operating Environment An experiment was conducted on two different walkways at South Carolina State University, Orangeburg, SC, to examine the impact of PEMDs in a traditional pedestrian operation. The first walkway is away from the roadway and adjacent to the Engineering and Computer Science Complex (ECSC) building. The second walkway is along Geathers Street (as shown in Figure 3). The image was taken from Google Maps (Source: Map data © 2019 Google U.S.).
Figure 3 Walkways Used in the Experiment in a Traditional Operating Environment
The 1st walkway is comparatively wider than the second. The length of the 1st walkway is 239.5 ft., and the width is 10 ft. to 16 ft. The length of the 2nd walkway is 274.97 ft, and the width is 4.50 ft. During the experiment, two volunteers participated as regular pedestrians, and one trained volunteer participated as a hoverboard user for both walkways. The dimension of the hoverboard was 7.5 in × 23 in × 6.5 in.
3.2.2 Simulation of PEMD for Experiment in Traditional Operating Environment A micro-simulation software, PTV VISSIM 7.00-02, was utilized to create a simulation model of the walkway, as shown in Figures 4 and 5. Given the travel time and distance, the walking speed of each volunteer and the running speed of the hoverboard user was calculated. These estimated walking speeds and hoverboard running speed were incorporated in the simulation model to
Engineering and Computer Science Complex, ECSC

Infrastructure and Policy Needs for Personal Electric Mobility Devices in a Connected Vehicle World, 2019
Center for Connected Multimodal Mobility (C2M2) Clemson University, Benedict College, The Citadel, South Carolina State University, University of South Carolina
Page 11
create a digital environment similar to the real-world experiment. For each scenario, ten simulation runs with a simulation duration of 600 seconds were performed in VISSIM, and the travel time, travel distance, delay time, and gain time were recorded. The 2-dimensional and 3-dimensional views of the model in VISSIM during the simulation run are shown in Figures 4 and 5. The green regions in these figures are the pedestrian areas where the pedestrian uses the grey-colored walkway to move from one location to another.
Figure 4 A 2-Dimensional View of Pedestrians Walking in VISSIM
Figure 5 A 3-Dimensional View of Pedestrian Walking in the VISSIM

Infrastructure and Policy Needs for Personal Electric Mobility Devices in a Connected Vehicle World, 2019
Center for Connected Multimodal Mobility (C2M2) Clemson University, Benedict College, The Citadel, South Carolina State University, University of South Carolina
Page 12
3.3 PEMDs in Connected Environment Operating Conditions
The impact of the PEMDs on infrastructure and travelers in a connected operating environment was assessed at Clemson University. Figure 6 shows the experiment area of the test, along with Perimeter Road in Clemson, SC (marked by the red line).
Figure 6 Study Area of PEMDs in a Connected Environment Operating Condition
In the experiment, three on-board-units (OBU) and one road-side-unit (RSU) were used to create a connected environment where each pedestrian, hoverboard, and vehicle was equipped with one OBU. A Cohda MK5 model with IEEE 802.11p radio-frequency devices were used as OBUs and the RSU. The Center for Connected Multimodal Mobility (C2M2) at Clemson University provided the OBU, RSU, and power supply units. Figure 7 shows the devices used in this experiment.
(i) Cohda MK5 On-board-unit (OBU) with power-supply (ii) Cohda MK5 Road-side-unit (RSU)
Figure 7 OBU and RSU Used to Create a Connected Environment
The OBUs transmitted the data, including the real-time travel time, speed, and latitude & longitude of its carrier (i.e., pedestrians, hoverboard, and car). The RSU received the transmitted data. The

Infrastructure and Policy Needs for Personal Electric Mobility Devices in a Connected Vehicle World, 2019
Center for Connected Multimodal Mobility (C2M2) Clemson University, Benedict College, The Citadel, South Carolina State University, University of South Carolina
Page 13
data transmission and receiving mechanism were controlled by Python programming codes. The data collected by the RSU was processed and extracted in a JavaScript Object Notation (JSON) format for analysis. For this experiment, four different cases were defined, and twelve real-life scenarios were considered. For each situation, the travel time, speed, and location of pedestrians, the hoverboard, and the vehicle were recorded to determine the impact of a hoverboard in a connected environment. The connected environment and data collection setup are shown in Figures 8 and 9, respectively.
Figure 8 Setup of OBU and RSU to Create a Connected Environment
Figure 9 Checking of Connectivity Among Pedestrians, Hoverboard, and Car
Infrastructure and Policy Needs for Personal Electric Mobility Devices in a Connected Vehicle World, 2019
Center for Connected Multimodal Mobility (C2M2) Clemson University, Benedict College, The Citadel, South Carolina State University, University of South Carolina
Page 14
CHAPTER 4
Data Analysis and Comparison
This chapter describes the analysis of the data from the NEISS database and field experiments. The analysis is divided into four segments, which are (i) safety data analysis of the NEISS database, (ii) data analysis for traditional operating conditions, (iii) analysis of the simulation data of VISSIM, and (iv)data analysis for the connected environment. Microsoft Excel and Stata (SE/12) software were used in data calculation and analysis.
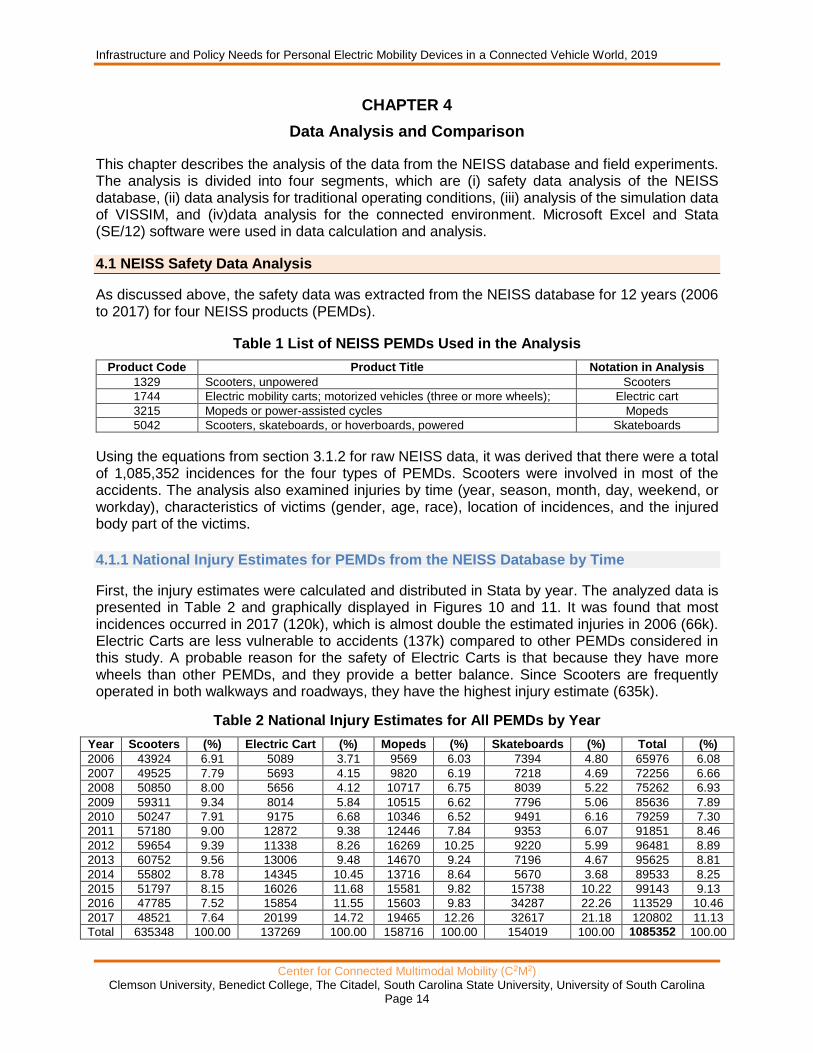
4.1 NEISS Safety Data Analysis
As discussed above, the safety data was extracted from the NEISS database for 12 years (2006 to 2017) for four NEISS products (PEMDs).
Table 1 List of NEISS PEMDs Used in the Analysis
Product Code Product Title Notation in Analysis
1329 Scooters, unpowered Scooters
1744 Electric mobility carts; motorized vehicles (three or more wheels); Electric cart
3215 Mopeds or power-assisted cycles Mopeds
5042 Scooters, skateboards, or hoverboards, powered Skateboards
Using the equations from section 3.1.2 for raw NEISS data, it was derived that there were a total of 1,085,352 incidences for the four types of PEMDs. Scooters were involved in most of the accidents. The analysis also examined injuries by time (year, season, month, day, weekend, or workday), characteristics of victims (gender, age, race), location of incidences, and the injured body part of the victims.
4.1.1 National Injury Estimates for PEMDs from the NEISS Database by Time
First, the injury estimates were calculated and distributed in Stata by year. The analyzed data is presented in Table 2 and graphically displayed in Figures 10 and 11. It was found that most incidences occurred in 2017 (120k), which is almost double the estimated injuries in 2006 (66k). Electric Carts are less vulnerable to accidents (137k) compared to other PEMDs considered in this study. A probable reason for the safety of Electric Carts is that because they have more wheels than other PEMDs, and they provide a better balance. Since Scooters are frequently operated in both walkways and roadways, they have the highest injury estimate (635k).
Table 2 National Injury Estimates for All PEMDs by Year
Year Scooters (%) Electric Cart (%) Mopeds (%) Skateboards (%) Total (%)
2006 43924 6.91 5089 3.71 9569 6.03 7394 4.80 65976 6.08
2007 49525 7.79 5693 4.15 9820 6.19 7218 4.69 72256 6.66
2008 50850 8.00 5656 4.12 10717 6.75 8039 5.22 75262 6.93
2009 59311 9.34 8014 5.84 10515 6.62 7796 5.06 85636 7.89
2010 50247 7.91 9175 6.68 10346 6.52 9491 6.16 79259 7.30
2011 57180 9.00 12872 9.38 12446 7.84 9353 6.07 91851 8.46
2012 59654 9.39 11338 8.26 16269 10.25 9220 5.99 96481 8.89
2013 60752 9.56 13006 9.48 14670 9.24 7196 4.67 95625 8.81
2014 55802 8.78 14345 10.45 13716 8.64 5670 3.68 89533 8.25
2015 51797 8.15 16026 11.68 15581 9.82 15738 10.22 99143 9.13
2016 47785 7.52 15854 11.55 15603 9.83 34287 22.26 113529 10.46
2017 48521 7.64 20199 14.72 19465 12.26 32617 21.18 120802 11.13
Total 635348 100.00 137269 100.00 158716 100.00 154019 100.00 1085352 100.00
Infrastructure and Policy Needs for Personal Electric Mobility Devices in a Connected Vehicle World, 2019
Center for Connected Multimodal Mobility (C2M2) Clemson University, Benedict College, The Citadel, South Carolina State University, University of South Carolina
Page 15
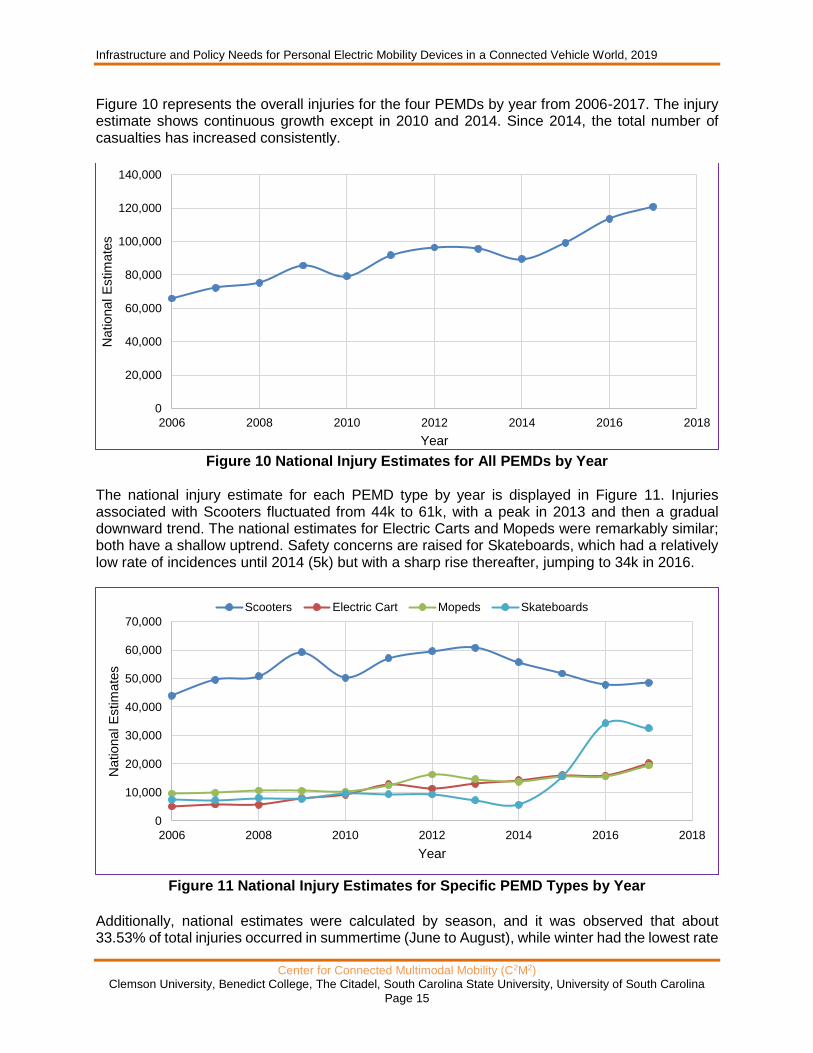
Figure 10 represents the overall injuries for the four PEMDs by year from 2006-2017. The injury estimate shows continuous growth except in 2010 and 2014. Since 2014, the total number of casualties has increased consistently.
Figure 10 National Injury Estimates for All PEMDs by Year
The national injury estimate for each PEMD type by year is displayed in Figure 11. Injuries associated with Scooters fluctuated from 44k to 61k, with a peak in 2013 and then a gradual downward trend. The national estimates for Electric Carts and Mopeds were remarkably similar; both have a shallow uptrend. Safety concerns are raised for Skateboards, which had a relatively low rate of incidences until 2014 (5k) but with a sharp rise thereafter, jumping to 34k in 2016.
Figure 11 National Injury Estimates for Specific PEMD Types by Year
Additionally, national estimates were calculated by season, and it was observed that about 33.53% of total injuries occurred in summertime (June to August), while winter had the lowest rate
0
20,000
40,000
60,000
80,000
100,000
120,000
140,000
2006 2008 2010 2012 2014 2016 2018
National E
stim
ate
s
Year
0
10,000
20,000
30,000
40,000
50,000
60,000
70,000
2006 2008 2010 2012 2014 2016 2018
National E
stim
ate
s
Year
Scooters Electric Cart Mopeds Skateboards

Infrastructure and Policy Needs for Personal Electric Mobility Devices in a Connected Vehicle World, 2019
Center for Connected Multimodal Mobility (C2M2) Clemson University, Benedict College, The Citadel, South Carolina State University, University of South Carolina
Page 16
of collisions (15.27%), as shown in Table 3. The reason behind it could be that in winter, people usually do not travel by PEMDs due to weather conditions. These data are graphically presented in Figure 12.
Table 3 National Injury Estimates for All PEMDs by Season
Season Scooters (%) Electric Cart (%) Mopeds (%) Skateboards (%) Total (%)
Spring 198066 31.17 32322 23.55 39525 24.90 36807 23.90 306720 28.26
Summer 215369 33.90 42872 31.23 61102 38.50 44602 28.96 363946 33.53
Autumn 140516 22.12 34693 25.27 41024 25.85 32698 21.23 248932 22.94
Winter 81397 12.81 27382 19.95 17064 10.75 39912 25.91 165755 15.27
Total 635348 100.00 137269 100.00 158716 100.00 154019 100.00 1085352 100.00
From Figure 12, it is observed that Scooters, Electric Cart, and Mopeds had higher incident frequencies in the summer season. However, Skateboards show that more incidents in winter.
Figure 12 National Injury Estimates for Specific PEMD Types by Season
Disaggregating further, most incidents occurred in August (124k), with the fewest in February (48k) [Table 4].
Table 4 National Injury Estimates for Specific PEMD Types by Month
Month Scooters (%) Electric Cart (%) Mopeds (%) Skateboards (%) Total (%)
January 29060 4.57 7568 5.51 5045 3.18 11094 7.20 52768 4.86
February 25957 4.09 8929 6.50 5840 3.68 7929 5.15 48655 4.48
March 46326 7.29 10180 7.42 9966 6.28 10564 6.86 77037 7.10
April 71487 11.25 10074 7.34 14388 9.07 13850 8.99 109800 10.12
May 80252 12.63 12068 8.79 15171 9.56 12392 8.05 119883 11.05
June 71216 11.21 13459 9.81 19148 12.06 14220 9.23 118043 10.88
July 70114 11.04 13766 10.03 21217 13.37 16220 10.53 121317 11.18
August 74039 11.65 15646 11.40 20738 13.07 14162 9.19 124585 11.48
September 62325 9.81 13691 9.97 17296 10.90 13344 8.66 106656 9.83
October 46993 7.40 11191 8.15 13825 8.71 10809 7.02 82818 7.63
November 31198 4.91 9811 7.15 9903 6.24 8546 5.55 59457 5.48
December 26381 4.15 10885 7.93 6179 3.89 20888 13.56 64333 5.93
Total 635348 100.00 137269 100.00 158716 100.00 154019 100.00 1085352 100.00
0
50,000
100,000
150,000
200,000
250,000
Spring Summer Autumn Winter
National E
stim
ate
s
Season
Scooters Electric Cart Mopeds Skateboards

Infrastructure and Policy Needs for Personal Electric Mobility Devices in a Connected Vehicle World, 2019
Center for Connected Multimodal Mobility (C2M2) Clemson University, Benedict College, The Citadel, South Carolina State University, University of South Carolina
Page 17
Figure 13 shows the overall estimates of PEMDs accidents; fewer incidences happen in February with a linear increase until April. From April to September, the number of collisions is almost constant. They then start decreasing gradually until November.
Figure 13 National Injury Estimates for All PEMDs by Month
In the injury distribution for specific PEMD type by month indicates that the estimated injury incidences were uniformly distributed throughout the entire year for each mode except for Scooters [Figure 14], which had a similar monthly injury distribution as the total estimates (higher for April to August).
Figure 14 National Injury Estimates for Specific PEMD Types by Month
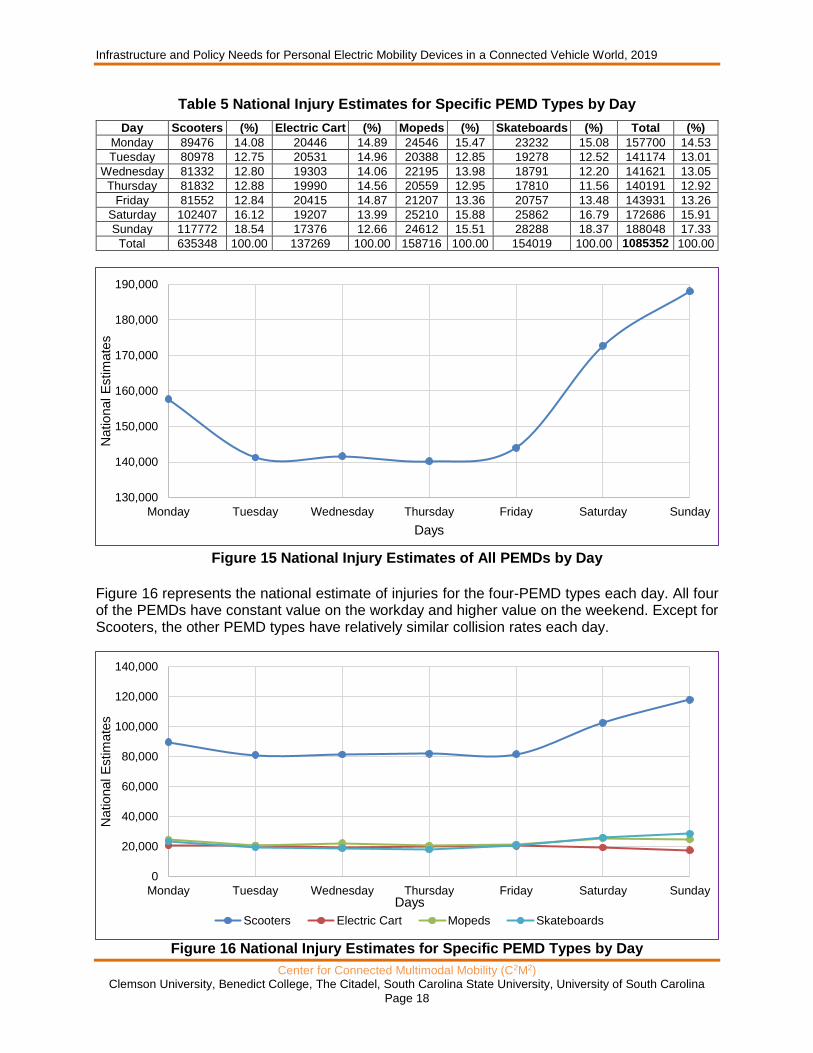
Table 5 presents the injury distribution by day of the week. The highest amount of injuries related to PEMDs occur on Sunday. Weekends are more prone to PEMDs accidents than workdays, with the number of injuries being relatively constant from Tuesday to Friday, then trending up on Sunday and down again on the next Tuesday [Figure 15]. This likely reflects the higher PEMD use on weekends.
0
20,000
40,000
60,000
80,000
100,000
120,000
140,000
National E
stim
ate
s
Months
0
10,000
20,000
30,000
40,000
50,000
60,000
70,000
80,000
90,000
National E
stim
ate
s
Months
Scooters Electric Cart Mopeds Skateboards
Infrastructure and Policy Needs for Personal Electric Mobility Devices in a Connected Vehicle World, 2019
Center for Connected Multimodal Mobility (C2M2) Clemson University, Benedict College, The Citadel, South Carolina State University, University of South Carolina
Page 18
Table 5 National Injury Estimates for Specific PEMD Types by Day
Day Scooters (%) Electric Cart (%) Mopeds (%) Skateboards (%) Total (%)
Monday 89476 14.08 20446 14.89 24546 15.47 23232 15.08 157700 14.53
Tuesday 80978 12.75 20531 14.96 20388 12.85 19278 12.52 141174 13.01
Wednesday 81332 12.80 19303 14.06 22195 13.98 18791 12.20 141621 13.05
Thursday 81832 12.88 19990 14.56 20559 12.95 17810 11.56 140191 12.92
Friday 81552 12.84 20415 14.87 21207 13.36 20757 13.48 143931 13.26
Saturday 102407 16.12 19207 13.99 25210 15.88 25862 16.79 172686 15.91
Sunday 117772 18.54 17376 12.66 24612 15.51 28288 18.37 188048 17.33
Total 635348 100.00 137269 100.00 158716 100.00 154019 100.00 1085352 100.00
Figure 15 National Injury Estimates of All PEMDs by Day
Figure 16 represents the national estimate of injuries for the four-PEMD types each day. All four of the PEMDs have constant value on the workday and higher value on the weekend. Except for Scooters, the other PEMD types have relatively similar collision rates each day.
Figure 16 National Injury Estimates for Specific PEMD Types by Day
130,000
140,000
150,000
160,000
170,000
180,000
190,000
Monday Tuesday Wednesday Thursday Friday Saturday Sunday
National E
stim
ate
s
Days
0
20,000
40,000
60,000
80,000
100,000
120,000
140,000
Monday Tuesday Wednesday Thursday Friday Saturday Sunday
National E
stim
ate
s
Days
Scooters Electric Cart Mopeds Skateboards

Infrastructure and Policy Needs for Personal Electric Mobility Devices in a Connected Vehicle World, 2019
Center for Connected Multimodal Mobility (C2M2) Clemson University, Benedict College, The Citadel, South Carolina State University, University of South Carolina
Page 19
4.1.2 Estimates for PEMD Injuries by User Demographic Based on the patient information from the NEISS database, an analysis was performed to understand the injury distribution by age groups, gender, and race. First, the national estimates are divided into 13 age categories for four specific PEMD types; this is presented in Table 6. It was found that children between the ages of 2-10 are most vulnerable to PEMD-related accidents — about 40.8% of the PEMD users who have been hospitalized fall into this age category. The distribution is shown in Figures 17 and 18. It was also found that Skateboard and Moped users between the ages of 11-20 are highly prone to collisions; for Electric Carts, the most vulnerable age group is 61-70, and for Scooters, those aged 2-10 are the most susceptible.
Table 6 National Injury Estimates for Specific PEMD Types by Age
Age (yr.) Scooters (%) Electric Cart (%) Mopeds (%) Skateboards (%) Total (%)
Unknown 0 0.00 7 0.00 32 0.02 0 0.00 39 0.00
< 2 6457 1.02 419 0.31 95 0.06 254 0.17 7226 0.67
2-10 396958 62.48 2109 1.54 4270 2.69 39221 25.46 442557 40.78
11-20 166191 26.16 2662 1.94 36969 23.29 45446 29.51 251269 23.15
21-30 19662 3.09 2276 1.66 35958 22.66 15204 9.87 73100 6.74
31-40 15915 2.50 5557 4.05 23567 14.85 13450 8.73 58490 5.39
41-50 11542 1.82 12899 9.40 24735 15.58 14127 9.17 63304 5.83
51-60 8822 1.39 21922 15.97 19722 12.43 11385 7.39 61852 5.70
61-70 5127 0.81 29615 21.57 9217 5.81 7245 4.70 51204 4.72
71-80 3235 0.51 28633 20.86 3321 2.09 4462 2.90 39651 3.65
81-90 1088 0.17 23890 17.40 812 0.51 2436 1.58 28226 2.60
> 91 350 0.06 7280 5.30 17 0.01 788 0.51 8435 0.78
Total 635348 100.00 137269 100.00 158716 100.00 154019 100.00 1085352 100.00
Figure 17 National Injury Estimates of for All PEMDs by Age
0
50,000
100,000
150,000
200,000
250,000
300,000
350,000
400,000
450,000
500,000
Unk. < 2 2-10 11-20 21-30 31-40 41-50 51-60 61-70 71-80 81-90 > 90
National E
stim
ate
s
Age

Infrastructure and Policy Needs for Personal Electric Mobility Devices in a Connected Vehicle World, 2019
Center for Connected Multimodal Mobility (C2M2) Clemson University, Benedict College, The Citadel, South Carolina State University, University of South Carolina
Page 20
Figure 18 National Injury Estimates for Specific PEMD Types by Age
The PEMDs related injury incidence distribution based on gender is shown in Table 7, which indicates that males (59.42%) are more vulnerable to injury from these devices than females (40.47%). Only for Electric Carts, females have higher incidences than males. The analyzed data has been depicted in Figure 19.
Table 7 National Injury Estimates for Specific PEMD Types by Gender
Gender Scooters (%) Electric Cart (%) Mopeds (%) Skateboards (%) Total (%)
Unknown 60 0.01 279 0.20 0.00 0.00 339 0.03
Male 383619 60.38 62709 45.59 116806 73.59 82863 53.80 645997 59.52
Female 251669 39.61 74560 54.21 41910 26.41 71156 46.20 439295 40.47
Total 635348 100.00 137548 100.00 158716 100.00 154019 100.00 1085631 100.03
Figure 19 National Injury Estimates for Specific PEMD Types by Gender
0
50,000
100,000
150,000
200,000
250,000
300,000
350,000
400,000
450,000
Unk. < 2 2-10 11-20 21-30 31-40 41-50 51-60 61-70 71-80 81-90 > 90
National E
stim
ate
s
Age
Scooters
Electric Cart
Mopeds
Skateboards
0 50,000 100,000 150,000 200,000 250,000 300,000 350,000 400,000 450,000
Unknown
Male
Female
National Estimates
Gender
of
vic
tim
s
Skateboards
Mopeds
Electric Cart
Scooters
Infrastructure and Policy Needs for Personal Electric Mobility Devices in a Connected Vehicle World, 2019
Center for Connected Multimodal Mobility (C2M2) Clemson University, Benedict College, The Citadel, South Carolina State University, University of South Carolina
Page 21
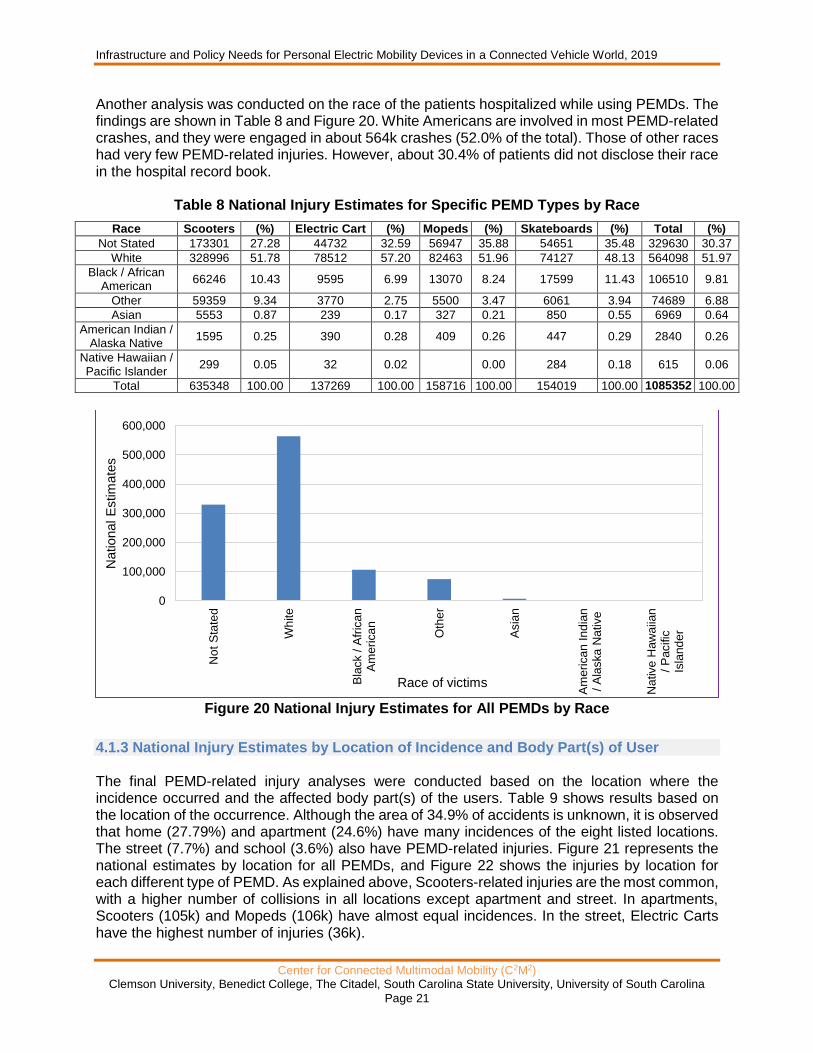
Another analysis was conducted on the race of the patients hospitalized while using PEMDs. The findings are shown in Table 8 and Figure 20. White Americans are involved in most PEMD-related crashes, and they were engaged in about 564k crashes (52.0% of the total). Those of other races had very few PEMD-related injuries. However, about 30.4% of patients did not disclose their race in the hospital record book.
Table 8 National Injury Estimates for Specific PEMD Types by Race
Race Scooters (%) Electric Cart (%) Mopeds (%) Skateboards (%) Total (%)
Not Stated 173301 27.28 44732 32.59 56947 35.88 54651 35.48 329630 30.37
White 328996 51.78 78512 57.20 82463 51.96 74127 48.13 564098 51.97
Black / African American
66246 10.43 9595 6.99 13070 8.24 17599 11.43 106510 9.81
Other 59359 9.34 3770 2.75 5500 3.47 6061 3.94 74689 6.88
Asian 5553 0.87 239 0.17 327 0.21 850 0.55 6969 0.64
American Indian / Alaska Native
1595 0.25 390 0.28 409 0.26 447 0.29 2840 0.26
Native Hawaiian / Pacific Islander
299 0.05 32 0.02 0.00 284 0.18 615 0.06
Total 635348 100.00 137269 100.00 158716 100.00 154019 100.00 1085352 100.00
Figure 20 National Injury Estimates for All PEMDs by Race
4.1.3 National Injury Estimates by Location of Incidence and Body Part(s) of User The final PEMD-related injury analyses were conducted based on the location where the incidence occurred and the affected body part(s) of the users. Table 9 shows results based on the location of the occurrence. Although the area of 34.9% of accidents is unknown, it is observed that home (27.79%) and apartment (24.6%) have many incidences of the eight listed locations. The street (7.7%) and school (3.6%) also have PEMD-related injuries. Figure 21 represents the national estimates by location for all PEMDs, and Figure 22 shows the injuries by location for each different type of PEMD. As explained above, Scooters-related injuries are the most common, with a higher number of collisions in all locations except apartment and street. In apartments, Scooters (105k) and Mopeds (106k) have almost equal incidences. In the street, Electric Carts have the highest number of injuries (36k).
0
100,000
200,000
300,000
400,000
500,000
600,000
Not
Sta
ted
Wh
ite
Bla
ck /
Afr
ica
nA
meri
ca
n
Oth
er
Asia
n
Am
eri
ca
n In
dia
n/
Ala
ska
Na
tive
Native
Haw
aiia
n/
Pacific
Isla
nd
er
National E
stim
ate
s
Race of victims

Infrastructure and Policy Needs for Personal Electric Mobility Devices in a Connected Vehicle World, 2019
Center for Connected Multimodal Mobility (C2M2) Clemson University, Benedict College, The Citadel, South Carolina State University, University of South Carolina
Page 22
Table 9 National Injury Estimates for All PEMDs by Location
Location Scooters (%) Electric Cart (%) Mopeds (%) Skateboards (%) Total (%)
Unknown 247154 38.90 39965 29.11 33934 21.38 57609 37.40 378662 34.89
Home 206856 32.56 41080 29.93 10788 6.80 42937 27.88 301661 27.79
Farm 94 0.01 0.00 124 0.08 71 0.05 289 0.03
Apartment 105413 16.59 17722 12.91 106827 67.31 36719 23.84 266682 24.57
Street 29593 4.66 36650 26.70 5068 3.19 12203 7.92 83514 7.69
Public 0.00 0.00 40 0.03 0.00 40 0.00
Mobile 0.00 0.00 0.00 0.00 0 0.00
Industry 14798 2.33 446 0.33 0.00 386 0.25 15631 1.44
School 31439 4.95 1406 1.02 1935 1.22 4094 2.66 38873 3.58
Total 635348 100.00 137269 100.00 158716 100.00 154019 100.00 1085352 100.00
Figure 21 National Injury Estimates for All PEMDs by Location
Figure 22 National Injury Estimates for Specific PEMD Types by Location
0
50,000
100,000
150,000
200,000
250,000
300,000
350,000
400,000
National E
stim
ate
s
Location of Incidence
0
50,000
100,000
150,000
200,000
250,000
300,000
Unkn
ow
n
Hom
e
Fa
rm
Ap
art
men
t
Str
eet
Pu
blic
Mo
bile
Indu
str
y
Scho
ol
National E
stim
ate
s
Location of Incidence
Scooters
Electric Cart
Mopeds
Skateboards
Infrastructure and Policy Needs for Personal Electric Mobility Devices in a Connected Vehicle World, 2019
Center for Connected Multimodal Mobility (C2M2) Clemson University, Benedict College, The Citadel, South Carolina State University, University of South Carolina
Page 23
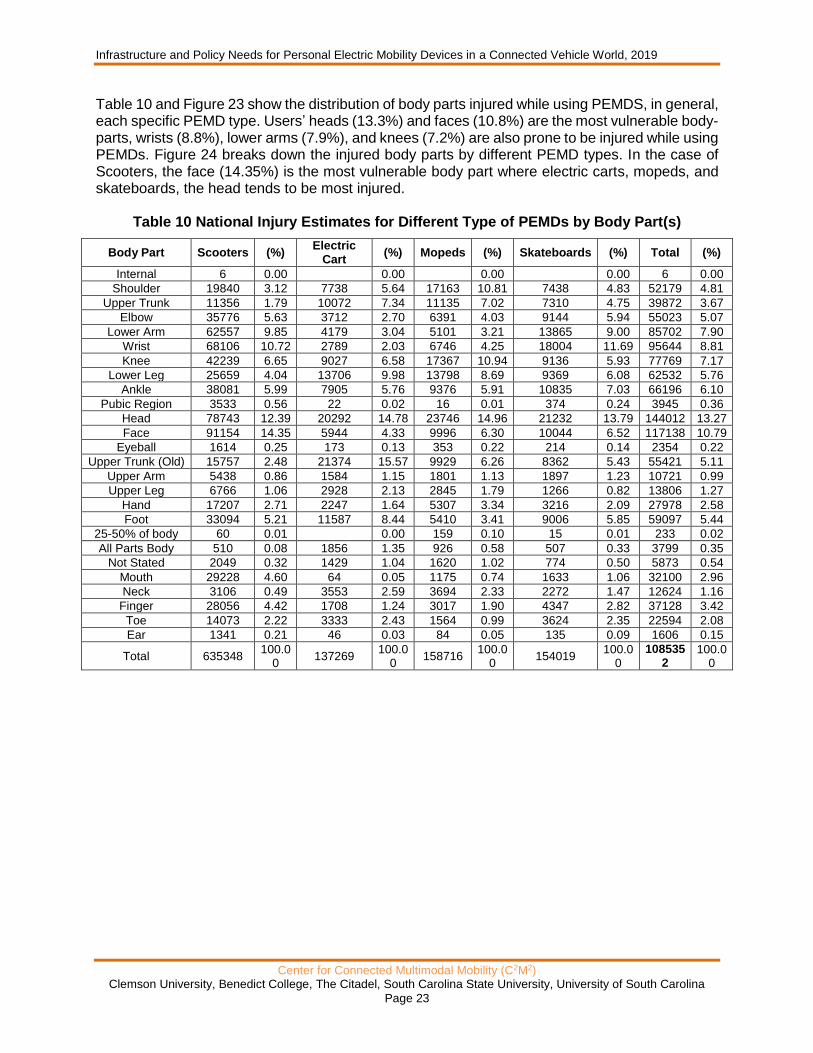
Table 10 and Figure 23 show the distribution of body parts injured while using PEMDS, in general, each specific PEMD type. Users’ heads (13.3%) and faces (10.8%) are the most vulnerable body-parts, wrists (8.8%), lower arms (7.9%), and knees (7.2%) are also prone to be injured while using PEMDs. Figure 24 breaks down the injured body parts by different PEMD types. In the case of Scooters, the face (14.35%) is the most vulnerable body part where electric carts, mopeds, and skateboards, the head tends to be most injured.
Table 10 National Injury Estimates for Different Type of PEMDs by Body Part(s)
Body Part Scooters (%) Electric
Cart (%) Mopeds (%) Skateboards (%) Total (%)
Internal 6 0.00 0.00 0.00 0.00 6 0.00
Shoulder 19840 3.12 7738 5.64 17163 10.81 7438 4.83 52179 4.81
Upper Trunk 11356 1.79 10072 7.34 11135 7.02 7310 4.75 39872 3.67
Elbow 35776 5.63 3712 2.70 6391 4.03 9144 5.94 55023 5.07
Lower Arm 62557 9.85 4179 3.04 5101 3.21 13865 9.00 85702 7.90
Wrist 68106 10.72 2789 2.03 6746 4.25 18004 11.69 95644 8.81
Knee 42239 6.65 9027 6.58 17367 10.94 9136 5.93 77769 7.17
Lower Leg 25659 4.04 13706 9.98 13798 8.69 9369 6.08 62532 5.76
Ankle 38081 5.99 7905 5.76 9376 5.91 10835 7.03 66196 6.10
Pubic Region 3533 0.56 22 0.02 16 0.01 374 0.24 3945 0.36
Head 78743 12.39 20292 14.78 23746 14.96 21232 13.79 144012 13.27
Face 91154 14.35 5944 4.33 9996 6.30 10044 6.52 117138 10.79
Eyeball 1614 0.25 173 0.13 353 0.22 214 0.14 2354 0.22
Upper Trunk (Old) 15757 2.48 21374 15.57 9929 6.26 8362 5.43 55421 5.11
Upper Arm 5438 0.86 1584 1.15 1801 1.13 1897 1.23 10721 0.99
Upper Leg 6766 1.06 2928 2.13 2845 1.79 1266 0.82 13806 1.27
Hand 17207 2.71 2247 1.64 5307 3.34 3216 2.09 27978 2.58
Foot 33094 5.21 11587 8.44 5410 3.41 9006 5.85 59097 5.44
25-50% of body 60 0.01 0.00 159 0.10 15 0.01 233 0.02
All Parts Body 510 0.08 1856 1.35 926 0.58 507 0.33 3799 0.35
Not Stated 2049 0.32 1429 1.04 1620 1.02 774 0.50 5873 0.54
Mouth 29228 4.60 64 0.05 1175 0.74 1633 1.06 32100 2.96
Neck 3106 0.49 3553 2.59 3694 2.33 2272 1.47 12624 1.16
Finger 28056 4.42 1708 1.24 3017 1.90 4347 2.82 37128 3.42
Toe 14073 2.22 3333 2.43 1564 0.99 3624 2.35 22594 2.08
Ear 1341 0.21 46 0.03 84 0.05 135 0.09 1606 0.15
Total 635348 100.0
0 137269
100.00
158716 100.0
0 154019
100.00
1085352
100.00

Infrastructure and Policy Needs for Personal Electric Mobility Devices in a Connected Vehicle World, 2019
Center for Connected Multimodal Mobility (C2M2) Clemson University, Benedict College, The Citadel, South Carolina State University, University of South Carolina
Page 24
Figure 23 National Injury Estimates for All PEMDs by Body Part
Figure 24 National Injury Estimates for a Specific PEMD by Body Part
Based on the analysis of the safety data obtained from the NEISS database, it can be concluded that PEMDs users are highly vulnerable to fall in collisions due to balance issues. The data also suggest that the manufacturers of PEMDs should be more concerned about safety issues and provide adequate protection measures like helmet or safety gear to reduce crash incidences. 4.2 Data Analysis for PEMDs in a Traditional Operating Environment
In the experiment involving PEMD use in traditional operating environments, four scenarios were defined for each route. Each volunteer performed 2 to 4 runs from the start-point to the end-point, and vice versa, for each scenario [Figure 3]. Details about the cases and scenarios are shown in
0
20,000
40,000
60,000
80,000
100,000
120,000
140,000
160,000N
ational E
stim
ate
s
Body Part(s)
0
10,000
20,000
30,000
40,000
50,000
60,000
70,000
80,000
90,000
100,000
National E
stim
ate
s
Body part(s)
ScootersElectric CartMopedsSkateboards
Infrastructure and Policy Needs for Personal Electric Mobility Devices in a Connected Vehicle World, 2019
Center for Connected Multimodal Mobility (C2M2) Clemson University, Benedict College, The Citadel, South Carolina State University, University of South Carolina
Page 25
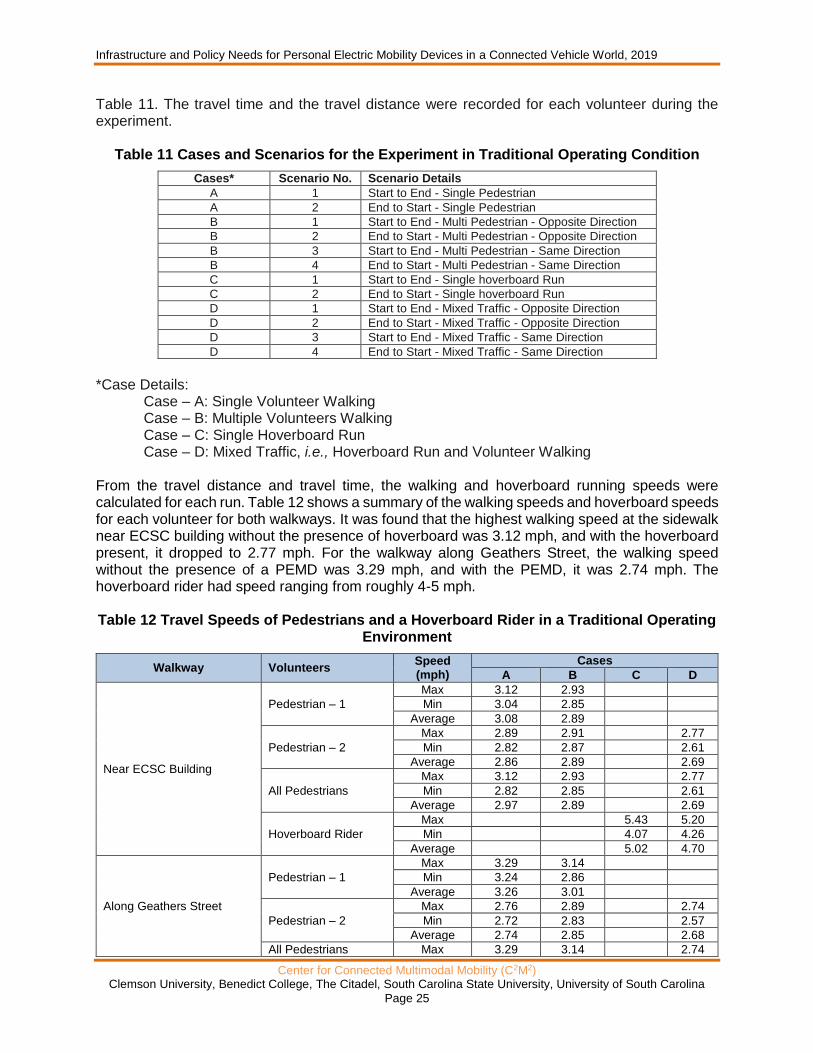
Table 11. The travel time and the travel distance were recorded for each volunteer during the experiment.
Table 11 Cases and Scenarios for the Experiment in Traditional Operating Condition
Cases* Scenario No. Scenario Details
A 1 Start to End - Single Pedestrian
A 2 End to Start - Single Pedestrian
B 1 Start to End - Multi Pedestrian - Opposite Direction
B 2 End to Start - Multi Pedestrian - Opposite Direction
B 3 Start to End - Multi Pedestrian - Same Direction
B 4 End to Start - Multi Pedestrian - Same Direction
C 1 Start to End - Single hoverboard Run
C 2 End to Start - Single hoverboard Run
D 1 Start to End - Mixed Traffic - Opposite Direction
D 2 End to Start - Mixed Traffic - Opposite Direction
D 3 Start to End - Mixed Traffic - Same Direction
D 4 End to Start - Mixed Traffic - Same Direction
*Case Details:
Case – A: Single Volunteer Walking Case – B: Multiple Volunteers Walking Case – C: Single Hoverboard Run Case – D: Mixed Traffic, i.e., Hoverboard Run and Volunteer Walking
From the travel distance and travel time, the walking and hoverboard running speeds were calculated for each run. Table 12 shows a summary of the walking speeds and hoverboard speeds for each volunteer for both walkways. It was found that the highest walking speed at the sidewalk near ECSC building without the presence of hoverboard was 3.12 mph, and with the hoverboard present, it dropped to 2.77 mph. For the walkway along Geathers Street, the walking speed without the presence of a PEMD was 3.29 mph, and with the PEMD, it was 2.74 mph. The hoverboard rider had speed ranging from roughly 4-5 mph. Table 12 Travel Speeds of Pedestrians and a Hoverboard Rider in a Traditional Operating
Environment
Walkway Volunteers Speed (mph)
Cases
A B C D
Near ECSC Building
Pedestrian – 1
Max 3.12 2.93
Min 3.04 2.85
Average 3.08 2.89
Pedestrian – 2
Max 2.89 2.91 2.77
Min 2.82 2.87 2.61
Average 2.86 2.89 2.69
All Pedestrians
Max 3.12 2.93 2.77
Min 2.82 2.85 2.61
Average 2.97 2.89 2.69
Hoverboard Rider
Max 5.43 5.20
Min 4.07 4.26
Average 5.02 4.70
Along Geathers Street
Pedestrian – 1
Max 3.29 3.14
Min 3.24 2.86
Average 3.26 3.01
Pedestrian – 2
Max 2.76 2.89 2.74
Min 2.72 2.83 2.57
Average 2.74 2.85 2.68
All Pedestrians Max 3.29 3.14 2.74
Infrastructure and Policy Needs for Personal Electric Mobility Devices in a Connected Vehicle World, 2019
Center for Connected Multimodal Mobility (C2M2) Clemson University, Benedict College, The Citadel, South Carolina State University, University of South Carolina
Page 26
Walkway Volunteers Speed (mph)
Cases
A B C D
Min 2.72 2.83 2.57
Average 3.00 2.93 2.68
Hoverboard Rider
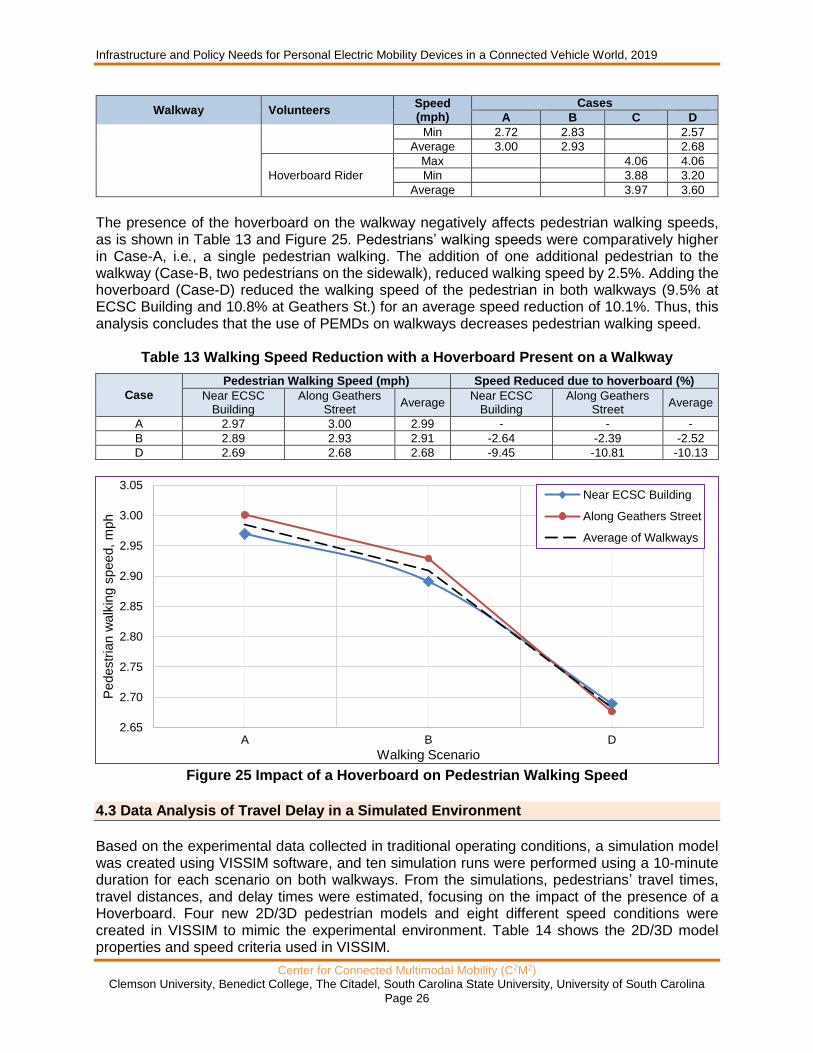
Max 4.06 4.06
Min 3.88 3.20
Average 3.97 3.60
The presence of the hoverboard on the walkway negatively affects pedestrian walking speeds, as is shown in Table 13 and Figure 25. Pedestrians’ walking speeds were comparatively higher in Case-A, i.e., a single pedestrian walking. The addition of one additional pedestrian to the walkway (Case-B, two pedestrians on the sidewalk), reduced walking speed by 2.5%. Adding the hoverboard (Case-D) reduced the walking speed of the pedestrian in both walkways (9.5% at ECSC Building and 10.8% at Geathers St.) for an average speed reduction of 10.1%. Thus, this analysis concludes that the use of PEMDs on walkways decreases pedestrian walking speed.
Table 13 Walking Speed Reduction with a Hoverboard Present on a Walkway
Case
Pedestrian Walking Speed (mph) Speed Reduced due to hoverboard (%)
Near ECSC Building
Along Geathers Street
Average Near ECSC
Building Along Geathers
Street Average
A 2.97 3.00 2.99 - - -
B 2.89 2.93 2.91 -2.64 -2.39 -2.52
D 2.69 2.68 2.68 -9.45 -10.81 -10.13
Figure 25 Impact of a Hoverboard on Pedestrian Walking Speed
4.3 Data Analysis of Travel Delay in a Simulated Environment
Based on the experimental data collected in traditional operating conditions, a simulation model was created using VISSIM software, and ten simulation runs were performed using a 10-minute duration for each scenario on both walkways. From the simulations, pedestrians’ travel times, travel distances, and delay times were estimated, focusing on the impact of the presence of a Hoverboard. Four new 2D/3D pedestrian models and eight different speed conditions were created in VISSIM to mimic the experimental environment. Table 14 shows the 2D/3D model properties and speed criteria used in VISSIM.
2.65
2.70
2.75
2.80
2.85
2.90
2.95
3.00
3.05
A B D
Pedestr
ian w
alk
ing s
peed,
mph
Walking Scenario
Near ECSC Building
Along Geathers Street
Average of Walkways

Infrastructure and Policy Needs for Personal Electric Mobility Devices in a Connected Vehicle World, 2019
Center for Connected Multimodal Mobility (C2M2) Clemson University, Benedict College, The Citadel, South Carolina State University, University of South Carolina
Page 27
Table 14 Travel Speed Data in a Traditional Environment from the Simulation Run in VISSIM
From Field Data
Speed for walkway near to ECSC Building (mph)
Speed for walkway along Geathers Street (mph)
Pedestrian characteristics
Pedestrian Type in VISSIM
Max Min Max Min Width
(in) Length
(in) Height
(in)
Pedestrian-1 3.12 2.85 3.29 2.86 20 15 67 300
Pedestrian-2 2.91 2.61 2.89 2.57 23 20 73 400
Mixed Pedestrian 3.12 2.61 3.29 2.57 21.5 17.5 70 500
Hoverboard 5.43 4.07 4.06 3.20 24 19.5 72 600
Four pedestrian type was created in the VISSIM model based on real-world physical properties which are 300, 400, 500, and 600 representing Pedestrian-1, Pedestrian-2, Mixed Pedestrian, and hoverboard, respectively (as shown in Table 14). These simulation results were analyzed to examine the impact of PEMDs on the average delay on the walkway. Case B is more realistic than A, and Case C has no interaction between pedestrians and a hoverboard rider. Therefore, Case A and C were omitted in these simulations. For all simulations, it is observed that PEMDs create a time delay on the walkway (last row in Table 15), and it signifies that PEMDs have an adverse impact on walkers maneuvering the footpath. Since the sidewalk along ECSC building is comparatively wider (10-16 ft.) than the sidewalk along the Geathers Street, the delay time for pedestrians (1.70 sec) is shorter in the walkway along with ECSC building than the walkway along Geathers Street (9.01 sec). The hoverboard caused more delay (10.47 – 9.01 = 1.46 sec) in the narrow walkway than the wider one (1.11 sec).
Table 15 Travel Delay of Pedestrians and a Hoverboard Rider in VISSIM Simulation
Simulation Number
Pedestrian or hoverboard
Code in VISSIM
Case B - Near ECSC Building
Case D - Near ECSC Building
Case B - Along Geathers Street
Case D - Along Geathers Street
Ped/hr Mean Delay
(s) Ped/hr
Mean Delay (s)
Ped/hr Mean Delay
(s) Ped/hr
Mean Delay (s)
1 300 73 1.95 51 1.24 90 9.13 68 7.86
1 400 48 1.06 52 1.16 94 7.38 66 7.73
1 500 53 1.57 34 1.34 79 8.06 72 7.53
1 600 32 5.98 57 17.79
2 300 71 1.91 52 1.47 96 9.63 71 7.93
2 400 62 1.42 54 1.18 85 7.39 73 6.69
2 500 46 1.82 40 2.17 84 8.33 55 7.70
2 600 26 5.28 69 16.18
3 300 67 1.96 51 1.74 85 9.84 67 8.59
3 400 72 1.44 50 1.22 90 8.19 69 8.07
3 500 53 1.81 50 2.07 101 8.52 63 7.95
3 600 38 6.75 78 17.18
4 300 70 1.76 51 1.66 83 10.05 71 8.21
4 400 66 1.39 54 1.22 91 8.12 62 7.14
4 500 57 1.42 46 2.08 103 9.63 67 7.70
4 600 42 6.45 85 18.08
5 300 66 1.89 52 1.76 90 9.89 72 8.44
5 400 74 1.51 54 1.22 94 8.24 63 7.20
5 500 68 1.98 50 1.49 108 9.05 69 8.21
5 600 46 7.29 88 16.69
6 300 63 1.46 56 0.98 92 10.04 67 8.99
6 400 63 1.49 42 1.35 94 7.87 67 8.18
6 500 67 1.87 45 1.54 81 9.25 68 8.23

Infrastructure and Policy Needs for Personal Electric Mobility Devices in a Connected Vehicle World, 2019
Center for Connected Multimodal Mobility (C2M2) Clemson University, Benedict College, The Citadel, South Carolina State University, University of South Carolina
Page 28
Simulation Number
Pedestrian or hoverboard
Code in VISSIM
Case B - Near ECSC Building
Case D - Near ECSC Building
Case B - Along Geathers Street
Case D - Along Geathers Street
Ped/hr Mean Delay
(s) Ped/hr
Mean Delay (s)
Ped/hr Mean Delay
(s) Ped/hr
Mean Delay (s)
6 600 46 5.63 64 18.80
7 300 72 2.19 58 1.51 78 9.28 61 8.32
7 400 60 1.08 41 1.06 104 7.90 75 7.61
7 500 79 1.93 49 1.66 76 9.74 69 8.36
7 600 59 9.25 56 19.05
8 300 65 1.92 49 1.52 81 10.11 62 8.98
8 400 70 1.52 48 1.23 97 8.21 72 7.28
8 500 59 1.83 51 2.04 91 10.07 65 8.51
8 600 41 7.39 70 17.87
9 300 61 2.18 47 1.46 78 9.71 56 8.57
9 400 76 1.16 58 1.16 101 8.07 79 7.56
9 500 50 2.11 44 1.60 106 9.40 69 8.95
9 600 33 6.40 81 18.18
10 300 59 2.25 46 1.85 87 10.78 65 9.41
10 400 73 1.23 59 1.36 87 8.13 68 7.05
10 500 63 1.97 45 1.71 114 10.36 72 8.38
10 600 43 7.04 86 17.86
For all Simulation
Walkway user 1.70 2.81 9.01 10.47
4.4 Data Analysis for Connected Environment
Twelve categories of tests were conducted to assess the impact of the PEMDs on travel behavior and infrastructure in a connected versus a non-connected environment. Table 16 indicates the details of the cases and the scenarios of the experiment conducted in the Clemson University Connected Vehicle Testbed (CU-CVT).
Table 16 Cases and Scenarios for the Experiment in a Connected Environment
Cases Scenarios Details of the Scenarios No. of Trials
Case-A
Scenario-1 A pedestrian walking in the same direction of the vehicle in a non-connected environment
3
Scenario-2 A pedestrian walking in the opposite direction of the vehicle in a non-connected environment
2
Scenario-3 A pedestrian & a hoverboard traveling in the same direction of the vehicle in a non- connected environment
1
Scenario-4 A pedestrian & a hoverboard traveling in the opposite direction of the vehicle in a non-connected environment
1
Case-B
Scenario-1 A pedestrian walking in the same direction of the vehicle in a connected environment
3
Scenario-2 A pedestrian walking in the opposite direction of the vehicle in a connected environment
3
Scenario-3 A pedestrian & a hoverboard traveling in the same direction of the vehicle in a connected environment
1
Scenario-4 A pedestrian & a hoverboard traveling in the opposite direction of the vehicle in a connected environment
1
Case-C
Scenario-1 A pedestrian crossing the roadway in a non-connected environment 1
Scenario-2 A pedestrian & a hoverboard crossing the roadway in a non-connected environment
2
Case-D Scenario-1 A pedestrian crossing the roadway in a connected environment 1
Scenario-2 A pedestrian & a hoverboard crossing the roadway in a connected environment 2
Total Number of Trials = 21
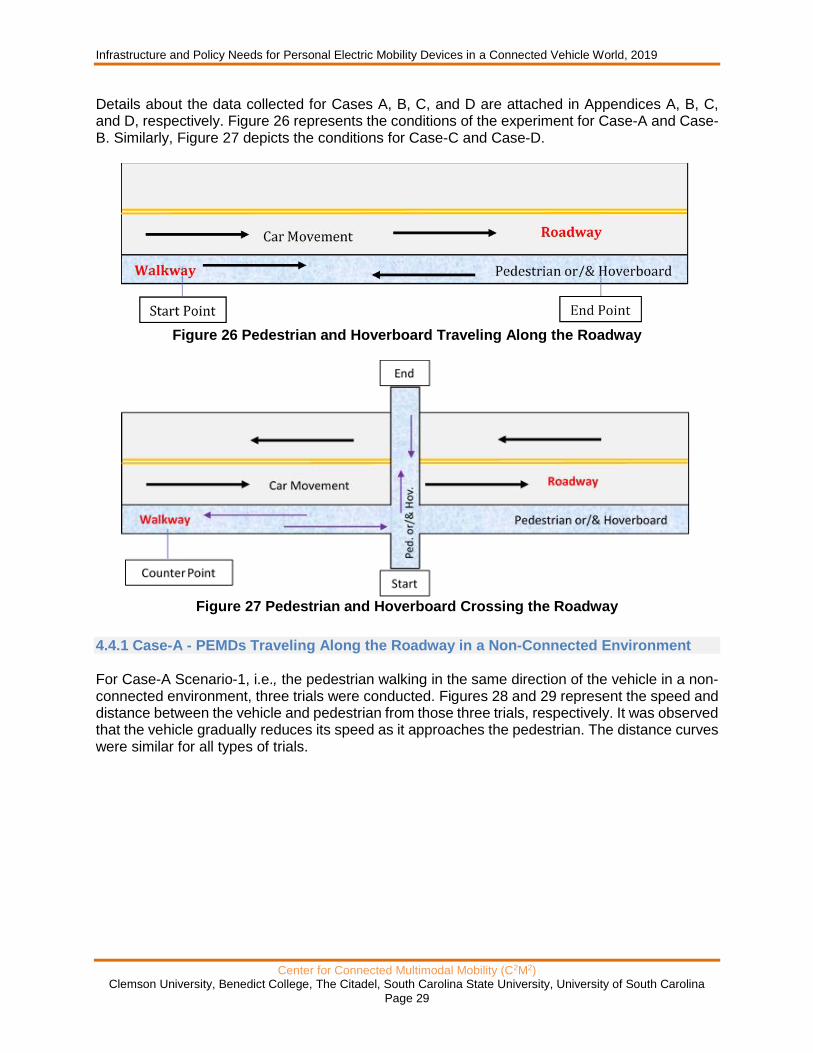
Infrastructure and Policy Needs for Personal Electric Mobility Devices in a Connected Vehicle World, 2019
Center for Connected Multimodal Mobility (C2M2) Clemson University, Benedict College, The Citadel, South Carolina State University, University of South Carolina
Page 29
Details about the data collected for Cases A, B, C, and D are attached in Appendices A, B, C, and D, respectively. Figure 26 represents the conditions of the experiment for Case-A and Case-B. Similarly, Figure 27 depicts the conditions for Case-C and Case-D.
Figure 26 Pedestrian and Hoverboard Traveling Along the Roadway
Figure 27 Pedestrian and Hoverboard Crossing the Roadway
4.4.1 Case-A - PEMDs Traveling Along the Roadway in a Non-Connected Environment For Case-A Scenario-1, i.e., the pedestrian walking in the same direction of the vehicle in a non-connected environment, three trials were conducted. Figures 28 and 29 represent the speed and distance between the vehicle and pedestrian from those three trials, respectively. It was observed that the vehicle gradually reduces its speed as it approaches the pedestrian. The distance curves were similar for all types of trials.

Infrastructure and Policy Needs for Personal Electric Mobility Devices in a Connected Vehicle World, 2019
Center for Connected Multimodal Mobility (C2M2) Clemson University, Benedict College, The Citadel, South Carolina State University, University of South Carolina
Page 30
Figure 28 Speed Distributions of Pedestrian and Vehicle for Case-A Scenario-1
Figure 29 Distance between Vehicle and Pedestrian for Case-A Scenario-1
For Case-A Scenario-2, i.e., the pedestrian walking in the opposite direction of the vehicle in a non-connected environment, two trials were conducted. Figures 30 and 31 represent the speed and distance between the vehicle and pedestrian from those two trials, respectively. It was found that the vehicle gradually reduced its speed as it approached the pedestrian. The distance curves were similar for all types of trials. The diamond and bullet on the curves indicate the speed of the vehicle while passing the pedestrian.
0
5
10
15
20
25
30
35
40
45
50
0 10 20 30 40 50
Sp
ee
d, m
ph
Travel Time, sec
Vehicle-Trial-1
Pedestrian-Trial-1
Vehicle-Trial-1
Pedestrian-Trial-2
Vehicle-Trial-3
Pedestrian-Tral-3
0
200
400
600
800
1000
1200
1400
0 5 10 15 20 25 30 35 40 45
Dis
tan
ce
, ft
.
Travel Time, sec
Trial-1
Trial-2
Trial-3

Infrastructure and Policy Needs for Personal Electric Mobility Devices in a Connected Vehicle World, 2019
Center for Connected Multimodal Mobility (C2M2) Clemson University, Benedict College, The Citadel, South Carolina State University, University of South Carolina
Page 31
Figure 30 Speed Distributions of Pedestrian and Vehicle for Case-A Scenario-2
Figure 31 Distance between Vehicle and Pedestrian for Case-A Scenario-2
For Case-A Scenario-3, i.e., the pedestrian walking & hoverboard running in the same direction of the vehicle in a non-connected environment, one trial was conducted. Figures 32 and 33 represent the speeds of, and distances between the vehicle, the hoverboard, and the pedestrian, respectively. It was found that the vehicle maintained a relatively constant speed while passing the pedestrian and hoverboard. The distance curves for both the pedestrian and the hoverboard were similar. The diamond and bullet on the curve indicate the speed of the vehicle while passing the pedestrian. By comparing the speed between the pedestrian and hoverboard, it was found that the hoverboard maintained a relatively constant speed with a higher magnitude than the pedestrian, as observed in Figure 32.
0
5
10
15
20
25
30
35
40
45
0 10 20 30 40 50
Sp
ee
d, m
ph
Travel Time, sec
Vehicle-Trial-1
Pedestrian-Trial-1
Vehicle-Trial-2
Pedestrian-Trial-2
0
200
400
600
800
1000
1200
0 5 10 15 20 25 30 35 40 45
Dis
tan
ce
, ft
.
Travel Time, sec
Trial-1
Trial-2

Infrastructure and Policy Needs for Personal Electric Mobility Devices in a Connected Vehicle World, 2019
Center for Connected Multimodal Mobility (C2M2) Clemson University, Benedict College, The Citadel, South Carolina State University, University of South Carolina
Page 32
Figure 32 Speed Distribution for Case-A Scenario-3 at CU-CVT
Figure 33 Distance Distribution of Vehicle, Pedestrian and Hoverboard for Case-A
Scenario-3 For Case A-Scenario 4, i.e., a pedestrian walking and a hoverboard running in the opposite direction of the vehicle in a non-connected environment, one trial was conducted. Figures 34 and 35 represent the speed and distance among the vehicle, hoverboard, and pedestrian from that trial. It was found that the speed variation and distance variation is similar to the previous experiment where the pedestrian was passing in the same direction (Case-A Scenario-3).
0
5
10
15
20
25
30
35
40
45
50
0 5 10 15 20 25 30 35 40
Sp
ee
d, m
ph
Travel Time, sec
Vehicle
Pedestrian
Hoverboard
0
100
200
300
400
500
600
700
800
900
0 5 10 15 20 25 30 35 40
Dis
tan
ce
, ft
.
Travel Time, sec
From Pedestrian
From Hoverboard
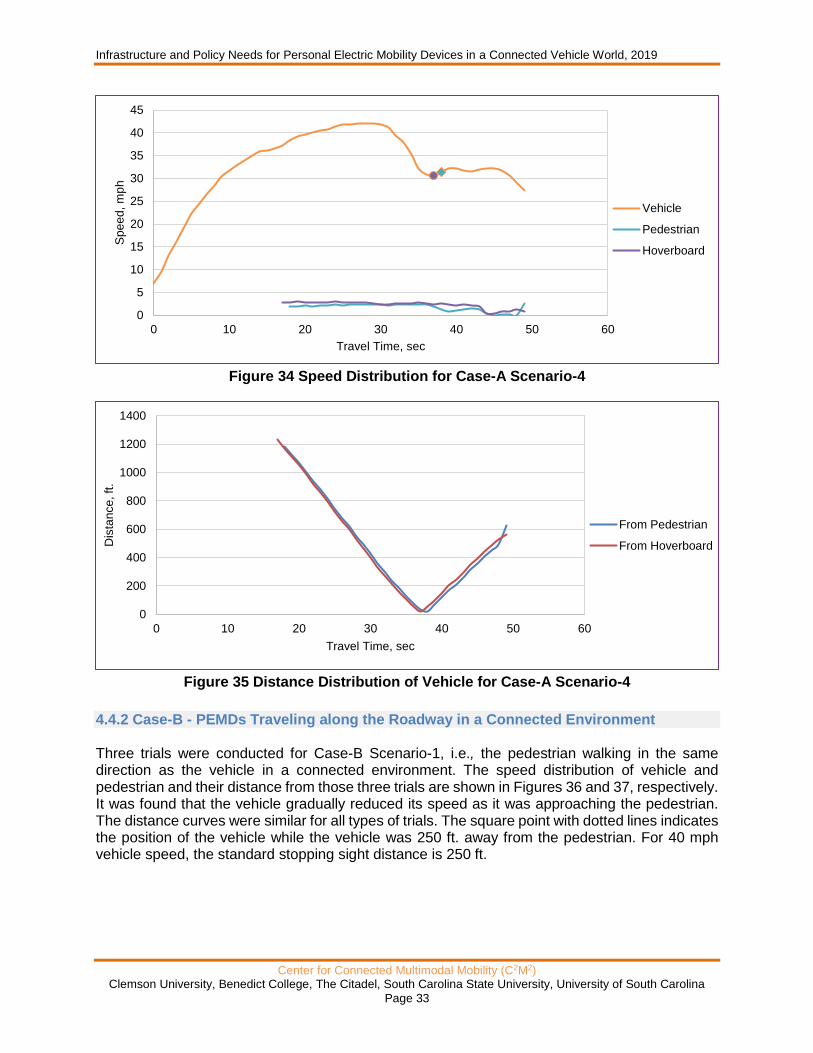
Infrastructure and Policy Needs for Personal Electric Mobility Devices in a Connected Vehicle World, 2019
Center for Connected Multimodal Mobility (C2M2) Clemson University, Benedict College, The Citadel, South Carolina State University, University of South Carolina
Page 33
Figure 34 Speed Distribution for Case-A Scenario-4
Figure 35 Distance Distribution of Vehicle for Case-A Scenario-4
4.4.2 Case-B - PEMDs Traveling along the Roadway in a Connected Environment Three trials were conducted for Case-B Scenario-1, i.e., the pedestrian walking in the same direction as the vehicle in a connected environment. The speed distribution of vehicle and pedestrian and their distance from those three trials are shown in Figures 36 and 37, respectively. It was found that the vehicle gradually reduced its speed as it was approaching the pedestrian. The distance curves were similar for all types of trials. The square point with dotted lines indicates the position of the vehicle while the vehicle was 250 ft. away from the pedestrian. For 40 mph vehicle speed, the standard stopping sight distance is 250 ft.
0
5
10
15
20
25
30
35
40
45
0 10 20 30 40 50 60
Sp
ee
d, m
ph
Travel Time, sec
Vehicle
Pedestrian
Hoverboard
0
200
400
600
800
1000
1200
1400
0 10 20 30 40 50 60
Dis
tan
ce
, ft
.
Travel Time, sec
From Pedestrian
From Hoverboard

Infrastructure and Policy Needs for Personal Electric Mobility Devices in a Connected Vehicle World, 2019
Center for Connected Multimodal Mobility (C2M2) Clemson University, Benedict College, The Citadel, South Carolina State University, University of South Carolina
Page 34
Figure 36 Speed Distribution for Case-B Scenario-1 at CU-CVT
Figure 37 Distance between Vehicle and Pedestrian for Case-B Scenario-1
For Case-B Scenario-2, i.e., the pedestrian walking in the opposite direction of the vehicle in a connected environment, three trials were conducted. Figures 38 and 39 represent the speed and distance between the vehicle and pedestrian from those three trials, respectively. It was observed that the vehicle gradually reduced speed as it was approaching the pedestrian. The distance curves were similar for all types of trials. The square point with dotted lines indicates the position of the vehicle while the vehicle was 250 ft. away from the pedestrian. For 40 mph vehicle speed, the standard stopping sight distance is 250 ft. The diamond and bullet on the curves indicate the speed of the vehicle while passing a pedestrian.
0
5
10
15
20
25
30
35
40
45
50
0 10 20 30 40 50
Sp
ee
d, m
ph
Travel Time, sec
Vehicle-Trial-1
Pedestrian-Trial-1
Vehicle-Trial-2
Pedestrian-Trial-2
Vehicle-Trial-3
Pedestrian-Trial-3
At 250 ft.-Trial-1
At 250 ft.-Trial-2
At 250 ft.-Trial-3
0
200
400
600
800
1000
1200
1400
0 10 20 30 40 50
Dis
tan
ce
, ft
.
Travel Time, sec
Trial-1
Trial-2
Trial-3

Infrastructure and Policy Needs for Personal Electric Mobility Devices in a Connected Vehicle World, 2019
Center for Connected Multimodal Mobility (C2M2) Clemson University, Benedict College, The Citadel, South Carolina State University, University of South Carolina
Page 35
Figure 38 Speed Distribution for Case-B Scenario-2
Figure 39 Distance between Vehicle and Pedestrian for Case-B Scenario-2
One trial was conducted for Case-B Scenario-3, i.e., the pedestrian walking and the hoverboard running in the same direction of the vehicle in a connected environment. Figures 40 and 41 depict the speed and distance between the vehicle, hoverboard, and pedestrian, respectively. It was shown that the distance curves for both the pedestrian and the hoverboard were similar. The diamond and bullet on the curves indicate the speed of the vehicle while passing the pedestrian. The hoverboard had a relatively constant speed and a higher speed than the pedestrian. The square point indicates the position of the vehicle while the vehicle was 250 ft. away from the pedestrian and hoverboard.
0
5
10
15
20
25
30
35
40
45
0 10 20 30 40 50
Sp
ee
d, m
ph
Travel Time, sec
Vehicle-Trial-1
Pedestrian-Trial-1
Vehicle-Trial-2
Pedestrian-Trial-2
Vehicle-Trial-3
Pedestrian-Trial-3
At 250 ft.-Trial-1
At 250 ft.-Trial-2
At 250 ft.-Trial-3
0
200
400
600
800
1000
1200
1400
0 10 20 30 40 50
Dis
tan
ce
, ft
.
Travel Time, sec
Trial-1
Trial-2
Trial-3
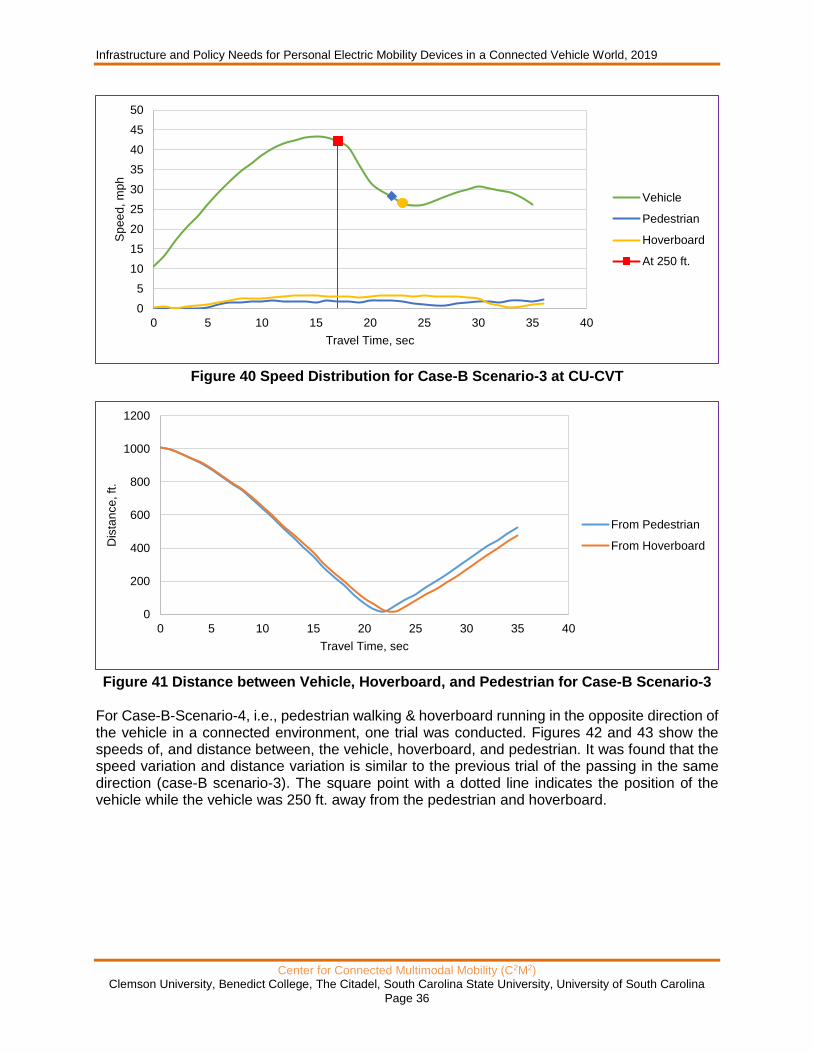
Infrastructure and Policy Needs for Personal Electric Mobility Devices in a Connected Vehicle World, 2019
Center for Connected Multimodal Mobility (C2M2) Clemson University, Benedict College, The Citadel, South Carolina State University, University of South Carolina
Page 36
Figure 40 Speed Distribution for Case-B Scenario-3 at CU-CVT
Figure 41 Distance between Vehicle, Hoverboard, and Pedestrian for Case-B Scenario-3
For Case-B-Scenario-4, i.e., pedestrian walking & hoverboard running in the opposite direction of the vehicle in a connected environment, one trial was conducted. Figures 42 and 43 show the speeds of, and distance between, the vehicle, hoverboard, and pedestrian. It was found that the speed variation and distance variation is similar to the previous trial of the passing in the same direction (case-B scenario-3). The square point with a dotted line indicates the position of the vehicle while the vehicle was 250 ft. away from the pedestrian and hoverboard.
0
5
10
15
20
25
30
35
40
45
50
0 5 10 15 20 25 30 35 40
Sp
ee
d, m
ph
Travel Time, sec
Vehicle
Pedestrian
Hoverboard
At 250 ft.
0
200
400
600
800
1000
1200
0 5 10 15 20 25 30 35 40
Dis
tan
ce
, ft
.
Travel Time, sec
From Pedestrian
From Hoverboard

Infrastructure and Policy Needs for Personal Electric Mobility Devices in a Connected Vehicle World, 2019
Center for Connected Multimodal Mobility (C2M2) Clemson University, Benedict College, The Citadel, South Carolina State University, University of South Carolina
Page 37
Figure 42 Speed Distribution for Case-B Scenario-4 at CU-CVT
Figure 43 Distance Distribution of Vehicle from Pedestrian and Hoverboard for Case-B Scenario-4
4.4.3 Case-C - PEMDs Crossing the Roadway in Non-connected Environment Two trials were conducted for Case-C Scenario-1, i.e., a pedestrian crossing the roadway of the vehicle in a non-connected operating environment. The speed distribution and distance between the vehicle and pedestrian from those two trials are shown in Figures 44 and 45, respectively. It was found that the vehicle gradually reduces its speed as it approaches the pedestrian. The distance curves were similar for all types of trials.
0
5
10
15
20
25
30
35
40
45
0 5 10 15 20 25 30 35 40
Sp
ee
d, m
ph
Travel Time, sec
Vehicle
Pedestrian
Hoverboard
At 250 ft.
0
200
400
600
800
1000
1200
1400
0 5 10 15 20 25 30 35 40
Dis
tan
ce
, ft
.
Travel Time, sec
From Pedestrian
From Hoverboard

Infrastructure and Policy Needs for Personal Electric Mobility Devices in a Connected Vehicle World, 2019
Center for Connected Multimodal Mobility (C2M2) Clemson University, Benedict College, The Citadel, South Carolina State University, University of South Carolina
Page 38
Figure 44 Speed Distribution for Case-C Scenario-1
Figure 45 Distance between Vehicle and Pedestrian for Case-C Scenario-1
For Case-C Scenario-2, i.e., the pedestrian and hoverboard crossing the roadway in a non-connected operating environment, two trials were performed. The speed distribution and distance between the vehicle and pedestrian from those two trials are shown in Figures 46 and 47, respectively. It was observed that the vehicle gradually reduces its speed as it approaches the pedestrian and the hoverboard user. However, the speed of the pedestrian and the hoverboard were comparatively consistent. The distance curves were similar for both trials.
0
5
10
15
20
25
30
35
0 5 10 15 20 25 30 35
Sp
ee
d, m
ph
Travel Time, sec
Vehicle-Trial-1
Pedestrian-Trial-1
Vehicle-Trial-2
Pedestrian-Trial-2
0
100
200
300
400
500
600
700
800
900
0 5 10 15 20 25 30 35
Dis
tan
ce
, ft
.
Travel Time, sec
Trial-1
Trial-2

Infrastructure and Policy Needs for Personal Electric Mobility Devices in a Connected Vehicle World, 2019
Center for Connected Multimodal Mobility (C2M2) Clemson University, Benedict College, The Citadel, South Carolina State University, University of South Carolina
Page 39
Figure 46 Speed Distribution for Case-C Scenario-2
Figure 47 Distance Distribution between Vehicle, Pedestrian and Hoverboard for Case-C
Scenario-2 at CU-CVT
4.4.4 Case-D - PEMDs Crossing the Roadway in Connected Environment One trial was conducted for Case-D Scenario-1, i.e., the pedestrian crossing the roadway in a connected environment. The speed distribution and distance between the vehicle and the pedestrian from that trial are presented in Figures 48 and 49, respectively. The vehicle gradually reduced its speed as it approached the pedestrian. The distance curves were similar to the other trials. The square point with dotted lines indicates the position of the vehicle while the vehicle was 250 ft. away from the pedestrian. For 40 mph vehicle speed, the standard stopping sight distance is 250 ft.
0
5
10
15
20
25
30
35
40
45
0 5 10 15 20 25 30
Sp
ee
d, m
ph
Travel Time, sec
Vehicle-Trial-1
Pedestrian-Trial-1
Hoverboard-Trial-1
Vehicle-Trial-2
Pedestrian-Trial-2
Hoverboard-Trial-2
0
100
200
300
400
500
600
700
800
0 5 10 15 20 25 30
Dis
tan
ce
, ft
.
Travel Time, sec
From Pedestrian - Trial-1
From Pedestrian - Trial-2
From Hoverboard - Trial-1
From Hoverboard - Trial-2

Infrastructure and Policy Needs for Personal Electric Mobility Devices in a Connected Vehicle World, 2019
Center for Connected Multimodal Mobility (C2M2) Clemson University, Benedict College, The Citadel, South Carolina State University, University of South Carolina
Page 40
Figure 48 Speed Distribution for Case-D Scenario-1
Figure 49 Distance between Vehicle and Pedestrian for Case-D Scenario-1
For Case-D Scenario-2, i.e., the pedestrian and hoverboard crossing the roadway in a connected operating environment, two trials were carried out. The speed distribution and distance between the vehicle and pedestrian from those two trials are shown in Figures 50 and 51, respectively. It was observed that the vehicle gradually reduced speed as it approached the pedestrian. The distance curves were similar for all trials. The square point with dotted lines indicates the position of the vehicle while the vehicle was 250 ft. away from the pedestrian. For 40 mph vehicle speed, the standard stopping sight distance is 250 ft.
0
5
10
15
20
25
30
35
40
0 5 10 15 20 25
Sp
ee
d, m
ph
Travel Time, sec
Vehicle
Pedestrian
At 250 ft.
0
100
200
300
400
500
600
700
0 5 10 15 20 25
Dis
tan
ce
, ft
.
Travel Time, sec

Infrastructure and Policy Needs for Personal Electric Mobility Devices in a Connected Vehicle World, 2019
Center for Connected Multimodal Mobility (C2M2) Clemson University, Benedict College, The Citadel, South Carolina State University, University of South Carolina
Page 41
Figure 50 Speed Distribution for Case-D Scenario-2
Figure 51 Distance Distribution of Vehicle from Pedestrian and Hoverboard for Case-D
Scenario-2
0
5
10
15
20
25
30
35
40
0 10 20 30 40 50 60
Sp
ee
d, m
ph
Travel Time, sec
Vehicle-Trial-1
Pedestrian-Trial-1
Hoverboard-Trial-1
Vehicle-Trial-2
Pedestrian-Trial-2
Hoverboard-Trial-2
At 250 ft. - Trial 1
At 250 ft. - Trial 2
0
100
200
300
400
500
600
700
800
900
0 10 20 30 40 50 60
Dis
tan
ce
, ft
.
Travel Time, sec
From Pedestrian - Trial-1
From Pedestrian - Trial-2
From Hoverboard - Trial-1
From Hoverboard - Trial-2
Infrastructure and Policy Needs for Personal Electric Mobility Devices in a Connected Vehicle World, 2019
Center for Connected Multimodal Mobility (C2M2) Clemson University, Benedict College, The Citadel, South Carolina State University, University of South Carolina
Page 42
CHAPTER 5
Conclusions and Recommendations 5.1 Conclusions
There is no consensus as to whether PEMDs should operate on roadways or walkways. For example, some major cities in China and Australia have restricted the use of PEMDs on roads and limited their use on public sidewalks except by the physically disabled or elderly people. In the US, several states prohibit PEMDs from congested non-motorized facilities, again except for people with disabilities. PEMDs are associated with high levels of injuries as they have balance issues, unlike pedestrians or automobiles. During the real-world experiments conducted in this research, the volunteer mentioned the issue of losing their balance, especially on the narrow walkway. From the safety data analysis of the NEISS database, the majority of injuries occur to children age 2-10 years, and most crashes occur at homes or apartments. Frequently, crashes occur in the summer, especially in August, with the majority of crashes happening on Sundays. This study found that PEMDs are faster than pedestrians and slower than cars, and similar findings are reported in a study by the Canadian Council of Motor Transport Administrators (CCMTA, 2010). From the experiment and corresponding VISSIM simulation for PEMDs in traditional operating environments, it was found that hoverboards on walkways reduce the walking speed of pedestrians (up to 10%) and create delays for both the hoverboard users and pedestrians. The delay time for the pedestrian is comparatively shorter on a broader walkway than on a narrower sidewalk. In a connected vehicle environment where vehicles and pedestrian/hoverboard are wirelessly connected, the vehicles usually started reducing their speed at a distance of 250 ft. away from the pedestrian or hoverboard while the vehicle was moving at 40 mph. 5.2 Recommendations
Based on this study, the following recommendations are made:
1. Based on this study of the hoverboard, it is recommended that PEMDs users should spend adequate time for training and must use protective gear while riding PEMD on public infrastructure (whenever allowable by law).
2. Transportation planners and professionals should consider the impact of PEMDs on the width of the walkway. Since these non-traditional modes increase the delay time and reduce pedestrians’ walking speed, an alternative lane should be created to divert PEMDs from the walkway and restrict the use of these non-traditional vehicles on existing walkways. If PEMDs and pedestrians must share a walkway, the widening of walkways may help to reduce the delay time.
3. PEMDs are faster than pedestrians and slower than motorized vehicles. Therefore, more studies are required to observe the incorporation of PEMD into the existing and future transportation infrastructure.
4. PEMDs reduce pedestrians' walking speed at a higher rate compared to pedestrians in walkways without PEMDs. It is recommended that further analysis can be conducted to estimate infrastructure capacity reduction caused by operating PEMDs on walkways.

Infrastructure and Policy Needs for Personal Electric Mobility Devices in a Connected Vehicle World, 2019
Center for Connected Multimodal Mobility (C2M2) Clemson University, Benedict College, The Citadel, South Carolina State University, University of South Carolina
Page 43
REFERENCES
Bruneau, J.-F. & Maurice, P., 2012. A Legal Status for Personal Mobility Devices. New Delhi, India, s.n.
Carey, N., 2005. Establishing Pedestrian Walking Speeds. [Online] Available at: https://www.westernite.org/datacollectionfund/2005/psu_ped_summary.pdf [Accessed 22 3 2019].
Clapperton, A. & Cassell, E., 2011. A national review of rock fishing deaths and hospital-treated injury, Melbourne, Australia: Monash University.
CPSC, 2019. NEISS Frequently Asked Questions. [Online] Available at: https://www.cpsc.gov/Research--Statistics/NEISS-Injury-Data/Neiss-Frequently-Asked-Questions [Accessed 21 March 2019].
CPSC, 2019. NEISS Highlights, Data and Query Builder. [Online] Available at: https://www.cpsc.gov/cgibin/NEISSQuery/home.aspx [Accessed 6 March 2019].
Dowling, R., Irwin, J. D., Faulks, I. J. & Howitt, R., 2015. Use of personal mobility devices for first-and-last mile travel: The Macquarie-Ryde trial. Gold Coast, Australia, s.n.
Edwards, K. & Mccluskey, A., 2010. A survey of adult power wheelchair and scooter users. Disability and Rehabilitation: Assistive Technology, 5(6), pp. 411-419.
Freedonia, 2006. Wheelchairs & Other Personal Mobility Devices - US Industry Study with Forecasts to 2010 & 2015, Cleveland, OH, USA: The Freedonia Group.
Gitelman, V., Pesahov, F., Carmel, R. & Chen, S., 2016. The Use of Mobility Scooters by the Elderly – A Feasibility Study in Israel. Transportation Research Procedia, Volume 14, pp. 2324-2333.
Goodwin, P., Hass-Klau, C. & Cairns, S., 1998. Evidence on the Effects of Road Capacity Reduction on Traffic Levels. Traffic Engineering and Control, 39(6), pp. 348-354.
Hoenig, H., Pieper, C., Branch, L. G. & Cohen, H. J., 2007. Effect of Motorized Scooters on Physical Performance and Mobility: A Randomized Clinical Trial. Archives of Physical Medicine and Rehabilitation, 88(3), pp. 279-286.
Litman, T., 2006. Managing Diverse Modes and Activities on Nonmotorized Facilities: Guidance for Practitioners. ITE Journal, 76(6), pp. 20-27.
Litman, T. & Fitzroy, S., 2015. Safe Travels: Evaluating Mobility Management Traffic Safety Impacts, Victoria, BC, Canada: Victoria Transport Policy Institute.
Liu, R. & Parthasarathy, R., 2003. Urban Street: Is There Room for Segway Human Transporter (HT)?. Anaheim, California, s.n.
Löfqvist, C., Pettersson, C., Iwarsson, S. & Brandt, A., 2012. Mobility and mobility-related participation outcomes of powered wheelchair and scooter interventions after 4-months and 1-year use. Disability and Rehabilitation: Assistive Technology, 7(3), pp. 211-218.
Miller, S. et al., 2010. Operating Characteristics of the SegwayTM Human Transporter, McLean, VA: U.S. Department of Transportation - Federal Highway Administration.

Infrastructure and Policy Needs for Personal Electric Mobility Devices in a Connected Vehicle World, 2019
Center for Connected Multimodal Mobility (C2M2) Clemson University, Benedict College, The Citadel, South Carolina State University, University of South Carolina
Page 44
NRMA, 2012. Mobility scooter usage and safety survey report, Australia: A collaborative project involving the Australian Competition and Consumer Commission, NRMA Motoring & Services, CHOICE, EnableNSWand Flinders University.
Poncy, A. T., Twaddell, H. & Lynott, J., 2011. Policy and Design Considerations for Accommodating Low-Speed Vehicles and Golf Carts in Community Transportation Networks, Washington, DC: AARP Public Policy Institute.
Powell, E. C. & Tanz, R. R., 2004. Incidence and Description of Scooter-Related Injuries Among Children. Ambulatory Pediatrics, 4(6), pp. 495-499.
Research, T. M., 2016. Personal Mobility Devices Market. [Online] Available at: https://www.prnewswire.com/news-releases/personal-mobility-devices-market-to-touch-us-146-bn-by-2024-propelled-by-rising-preference-for-electric-wheelchairs-a-new-report-by-tmr-589847341.html [Accessed 28 March 2019].
Road Safety Canada Consulting, 2011. Road Safety in Canada, Ontario, Canada: Canadian Council of Motor Transport Administrators.
Rose, G. & Richardson, M., 2009. Implications for road system management of emerging types of private passenger vehicles. Auckland, New Zealand, s.n.
Schroeder, T. & Ault, K., 2001. The NEISS Sample (Design and Implementation) 1997 to Present, Bethesda, MD: U.S. Consumer Product Safety Commission.
Segway, 1999. Segway: Personal Transportation That Simply Moves You. [Online] Available at: http://www.segway.com/ [Accessed July 2017].
Siracuse, B., Ippolito, J. A., Gibson, P. & Beebe, K., 2017. Hoverboards: A new cause of pediatric morbidity. Injury, 48(6), pp. 1110-1114.
TranSafety, I., 1997. Study Compares Older and Younger Pedestrian Walking Speeds. [Online] Available at: http://www.usroads.com/journals/p/rej/9710/re971001.htm [Accessed July 2017].
Zegeer, C. V. et al., 2002. Pedestrian Facilities Users Guide: Providing Safety and Mobility, Pedestrian and Bicycle Information Center, McLean, VA: U.S. Department of Transportation - Federal Highway Administration.

Infrastructure and Policy Needs for Personal Electric Mobility Devices in a Connected Vehicle World, 2019
Center for Connected Multimodal Mobility (C2M2) Clemson University, Benedict College, The Citadel, South Carolina State University, University of South Carolina
Page 45
APPENDICES Appendix A - PEMDs along Roadway in a Non-connected Environment (Case-A)
Case A - Scenario 1 - Trial 1
Real Time Travel Time (sec)
Vehicle-Trial-1 Pedestrian-Trial-1 Distance vehicle - Ped. (ft.)
Speed longitude latitude speed longitude latitude
2019-05-22 11:52:28 AM 0 2.597903 -82.846040 34.676469 0.049214 -82.843403 34.673654 1296.1863
2019-05-22 11:52:29 AM 1 4.816261 -82.846029 34.676462 0.106817 -82.843402 34.673654 1292.3479
2019-05-22 11:52:30 AM 2 8.352958 -82.846002 34.676446
2019-05-22 11:52:31 AM 3 11.505211 -82.845964 34.676425 0.064873 -82.843399 34.673653 1270.8393
2019-05-22 11:52:32 AM 4 15.247392 -82.845906 34.676392 0.085006 -82.843394 34.673651 1252.1961
2019-05-22 11:52:33 AM 5 18.833942 -82.845841 34.676347 0.055925 -82.843394 34.673651 1227.4415
2019-05-22 11:52:34 AM 6 22.656975 -82.845767 34.676285 0.073262 -82.843392 34.673651 1196.1787
2019-05-22 11:52:35 AM 7 26.225097 -82.845690 34.676208 0.058801 -82.843392 34.673651 1159.953
2019-05-22 11:52:36 AM 8 29.141079 -82.845618 34.676128 0.072223 -82.843391 34.673651 1123.6763
2019-05-22 11:52:37 AM 9 32.294930 -82.845522 34.676018 0.071584 -82.843391 34.673651 1074.3382
2019-05-22 11:52:38 AM 10 33.684746 -82.845422 34.675903 0.049587 -82.843391 34.673651 1022.8762
2019-05-22 11:52:39 AM 11 35.205533 -82.845321 34.675785 0.067430 -82.843391 34.673651 970.43664
2019-05-22 11:52:40 AM 12 36.980806 -82.845224 34.675670 0.131344 -82.843390 34.673651 919.40275
2019-05-22 11:52:41 AM 13 38.234058 -82.845122 34.675548 0.151743 -82.843389 34.673650 865.95298
2019-05-22 11:52:42 AM 14 39.646031 -82.845017 34.675423 0.077336 -82.843387 34.673650 810.91208
2019-05-22 11:52:43 AM 15 40.752388 -82.844897 34.675283 0.052410 -82.843385 34.673649 748.91989
2019-05-22 11:52:44 AM 16 41.542368 -82.844776 34.675144 0.087989 -82.843384 34.673648 687.11952
2019-05-22 11:52:45 AM 17 42.160366 -82.844663 34.675015 0.358559 -82.843383 34.673647 629.40921
2019-05-22 11:52:46 AM 18 42.373574 -82.844544 34.674881 0.484151 -82.843383 34.673647 569.27189
2019-05-22 11:52:47 AM 19 42.371337 -82.844421 34.674744 1.150937 -82.843380 34.673646 507.9215
2019-05-22 11:52:48 AM 20 42.535277 -82.844290 34.674599 1.888667 -82.843373 34.673642 444.6683
2019-05-22 11:52:49 AM 21 43.088348 -82.844172 34.674470 2.155190 -82.843364 34.673637 388.88339
2019-05-22 11:52:50 AM 22 43.623098 -82.844042 34.674331 2.331700 -82.843357 34.673631 327.91022
2019-05-22 11:52:51 AM 23 43.585388 -82.843900 34.674187 1.911357 -82.843350 34.673627 262.67222
2019-05-22 11:52:52 AM 24 43.101877 -82.843761 34.674055 1.706831 -82.843342 34.673623 201.72975
2019-05-22 11:52:53 AM 25 42.332349 -82.843620 34.673928 1.707950 -82.843338 34.673618 141.26005
2019-05-22 11:52:54 AM 26 40.912120 -82.843483 34.673811 1.902409 -82.843332 34.673613 85.098491
2019-05-22 11:52:55 AM 27 38.128067 -82.843350 34.673703 2.018733 -82.843324 34.673608 35.511396
2019-05-22 11:52:56 AM 28 36.395351 -82.843218 34.673601 1.882595 -82.843318 34.673603 29.993207
2019-05-22 11:52:57 AM 29 35.683665 -82.843081 34.673496 1.573730 -82.843312 34.673599 78.588632
2019-05-22 11:52:58 AM 30 35.130168 -82.842955 34.673404 1.142148 -82.843305 34.673598 126.37447
2019-05-22 11:52:59 AM 31 34.646283 -82.842829 34.673317 1.204145 -82.843294 34.673595 172.44812
2019-05-22 11:53:00 AM 32 34.428069 -82.842695 34.673231 1.347952 -82.843290 34.673590 221.53685
2019-05-22 11:53:01 AM 33 34.571237 -82.842552 34.673143 0.681539 -82.843292 34.673588 275.08684
2019-05-22 11:53:02 AM 34 34.308549 -82.842411 34.673060 1.047555 -82.843294 34.673593 328.60148
2019-05-22 11:53:03 AM 35 33.304829 -82.842277 34.672987 1.077595 -82.843292 34.673595 376.92023
2019-05-22 11:53:04 AM 36 31.968967 -82.842151 34.672921 1.761797 -82.843295 34.673602 423.63064
2019-05-22 11:53:05 AM 37 30.096278 -82.842014 34.672853 1.359723 -82.843298 34.673608 473.52898
2019-05-22 11:53:06 AM 38 27.775711 -82.841897 34.672795 0.967662 -82.843299 34.673613 515.55449
2019-05-22 11:53:07 AM 39 22.705550 -82.841796 34.672744 1.183053 -82.843302 34.673617 552.76597
2019-05-22 11:53:08 AM 40 16.640723 -82.841721 34.672697 1.297460 -82.843305 34.673622 582.99915
2019-05-22 11:53:09 AM 41 12.756865 -82.841688 34.672664 0.877650 -82.843308 34.673625 599.29379
Case A - Scenario 1 - Trial 2
Real Time Travel Time (sec)
Vehicle-Trial-2 Pedestrian-Trial-2 Distance vehicle - Ped. (ft.)
speed longitude latitude speed longitude latitude
2019-05-22 11:57:24 AM 0 7.005538 -82.845799 34.676176
2019-05-22 11:57:25 AM 1 9.716889 -82.845771 34.676158 0.821352 -82.843348 34.673657 1166.7022
2019-05-22 11:57:26 AM 2 14.004579 -82.845721 34.676126 1.483877 -82.843344 34.673655 1149.4357
2019-05-22 11:57:27 AM 3 18.325184 -82.845657 34.676085 2.088612 -82.843336 34.673654 1127.748
2019-05-22 11:57:28 AM 4 22.241852 -82.845577 34.676032 2.192260 -82.843327 34.673651 1099.8346
2019-05-22 11:57:29 AM 5 25.510002 -82.845498 34.675971 2.117800 -82.843320 34.673647 1070.5269
2019-05-22 11:57:30 AM 6 28.548914 -82.845412 34.675887 2.077853 -82.843312 34.673641 1033.561
2019-05-22 11:57:31 AM 7 31.737597 -82.845322 34.675785 2.132234 -82.843304 34.673636 990.70044
2019-05-22 11:57:32 AM 8 34.659705 -82.845232 34.675678 2.354602 -82.843295 34.673627 947.15405
2019-05-22 11:57:33 AM 9 37.082110 -82.845137 34.675565 2.105390 -82.843288 34.673621 900.48832
2019-05-22 11:57:34 AM 10 38.537438 -82.845021 34.675430 2.301873 -82.843281 34.673613 843.68843
2019-05-22 11:57:35 AM 11 39.681504 -82.844906 34.675298 2.384642 -82.843273 34.673606 788.2256
2019-05-22 11:57:36 AM 12 40.558727 -82.844787 34.675164 2.544960 -82.843264 34.673599 731.14837
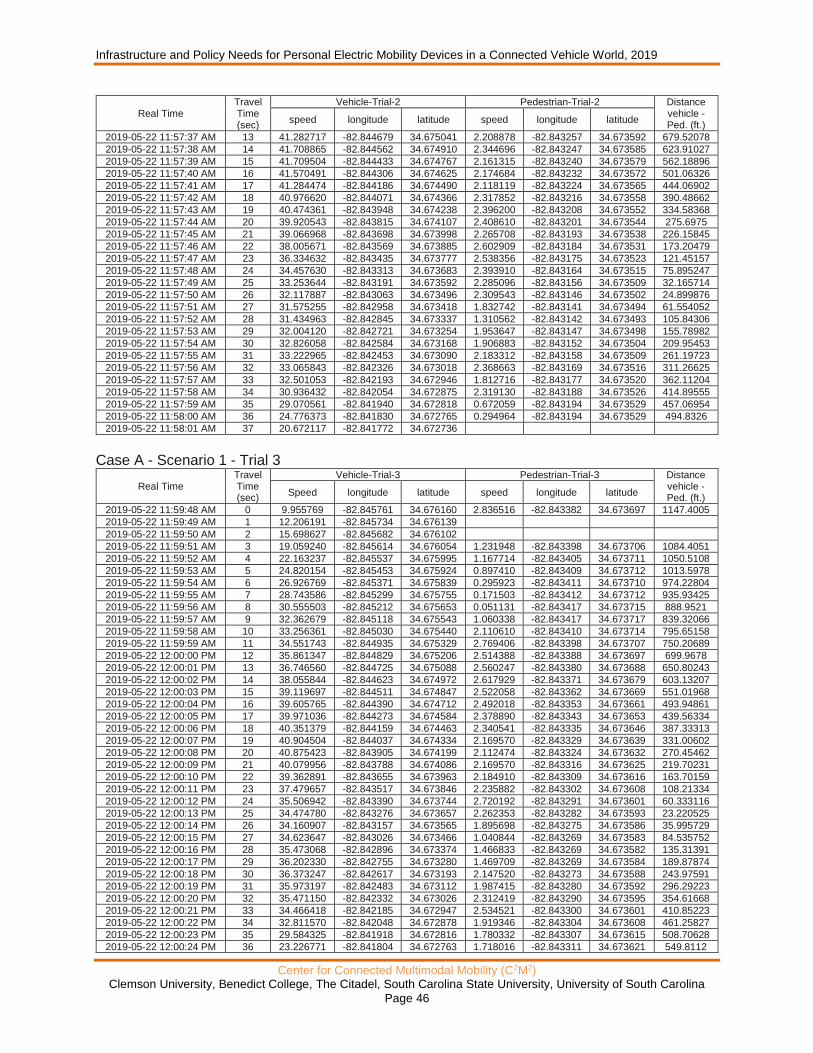
Infrastructure and Policy Needs for Personal Electric Mobility Devices in a Connected Vehicle World, 2019
Center for Connected Multimodal Mobility (C2M2) Clemson University, Benedict College, The Citadel, South Carolina State University, University of South Carolina
Page 46
Real Time Travel Time (sec)
Vehicle-Trial-2 Pedestrian-Trial-2 Distance vehicle - Ped. (ft.)
speed longitude latitude speed longitude latitude
2019-05-22 11:57:37 AM 13 41.282717 -82.844679 34.675041 2.208878 -82.843257 34.673592 679.52078
2019-05-22 11:57:38 AM 14 41.708865 -82.844562 34.674910 2.344696 -82.843247 34.673585 623.91027
2019-05-22 11:57:39 AM 15 41.709504 -82.844433 34.674767 2.161315 -82.843240 34.673579 562.18896
2019-05-22 11:57:40 AM 16 41.570491 -82.844306 34.674625 2.174684 -82.843232 34.673572 501.06326
2019-05-22 11:57:41 AM 17 41.284474 -82.844186 34.674490 2.118119 -82.843224 34.673565 444.06902
2019-05-22 11:57:42 AM 18 40.976620 -82.844071 34.674366 2.317852 -82.843216 34.673558 390.48662
2019-05-22 11:57:43 AM 19 40.474361 -82.843948 34.674238 2.396200 -82.843208 34.673552 334.58368
2019-05-22 11:57:44 AM 20 39.920543 -82.843815 34.674107 2.408610 -82.843201 34.673544 275.6975
2019-05-22 11:57:45 AM 21 39.066968 -82.843698 34.673998 2.265708 -82.843193 34.673538 226.15845
2019-05-22 11:57:46 AM 22 38.005671 -82.843569 34.673885 2.602909 -82.843184 34.673531 173.20479
2019-05-22 11:57:47 AM 23 36.334632 -82.843435 34.673777 2.538356 -82.843175 34.673523 121.45157
2019-05-22 11:57:48 AM 24 34.457630 -82.843313 34.673683 2.393910 -82.843164 34.673515 75.895247
2019-05-22 11:57:49 AM 25 33.253644 -82.843191 34.673592 2.285096 -82.843156 34.673509 32.165714
2019-05-22 11:57:50 AM 26 32.117887 -82.843063 34.673496 2.309543 -82.843146 34.673502 24.899876
2019-05-22 11:57:51 AM 27 31.575255 -82.842958 34.673418 1.832742 -82.843141 34.673494 61.554052
2019-05-22 11:57:52 AM 28 31.434963 -82.842845 34.673337 1.310562 -82.843142 34.673493 105.84306
2019-05-22 11:57:53 AM 29 32.004120 -82.842721 34.673254 1.953647 -82.843147 34.673498 155.78982
2019-05-22 11:57:54 AM 30 32.826058 -82.842584 34.673168 1.906883 -82.843152 34.673504 209.95453
2019-05-22 11:57:55 AM 31 33.222965 -82.842453 34.673090 2.183312 -82.843158 34.673509 261.19723
2019-05-22 11:57:56 AM 32 33.065843 -82.842326 34.673018 2.368663 -82.843169 34.673516 311.26625
2019-05-22 11:57:57 AM 33 32.501053 -82.842193 34.672946 1.812716 -82.843177 34.673520 362.11204
2019-05-22 11:57:58 AM 34 30.936432 -82.842054 34.672875 2.319130 -82.843188 34.673526 414.89555
2019-05-22 11:57:59 AM 35 29.070561 -82.841940 34.672818 0.672059 -82.843194 34.673529 457.06954
2019-05-22 11:58:00 AM 36 24.776373 -82.841830 34.672765 0.294964 -82.843194 34.673529 494.8326
2019-05-22 11:58:01 AM 37 20.672117 -82.841772 34.672736
Case A - Scenario 1 - Trial 3
Real Time Travel Time (sec)
Vehicle-Trial-3 Pedestrian-Trial-3 Distance vehicle - Ped. (ft.)
Speed longitude latitude speed longitude latitude
2019-05-22 11:59:48 AM 0 9.955769 -82.845761 34.676160 2.836516 -82.843382 34.673697 1147.4005
2019-05-22 11:59:49 AM 1 12.206191 -82.845734 34.676139
2019-05-22 11:59:50 AM 2 15.698627 -82.845682 34.676102
2019-05-22 11:59:51 AM 3 19.059240 -82.845614 34.676054 1.231948 -82.843398 34.673706 1084.4051
2019-05-22 11:59:52 AM 4 22.163237 -82.845537 34.675995 1.167714 -82.843405 34.673711 1050.5108
2019-05-22 11:59:53 AM 5 24.820154 -82.845453 34.675924 0.897410 -82.843409 34.673712 1013.5978
2019-05-22 11:59:54 AM 6 26.926769 -82.845371 34.675839 0.295923 -82.843411 34.673710 974.22804
2019-05-22 11:59:55 AM 7 28.743586 -82.845299 34.675755 0.171503 -82.843412 34.673712 935.93425
2019-05-22 11:59:56 AM 8 30.555503 -82.845212 34.675653 0.051131 -82.843417 34.673715 888.9521
2019-05-22 11:59:57 AM 9 32.362679 -82.845118 34.675543 1.060338 -82.843417 34.673717 839.32066
2019-05-22 11:59:58 AM 10 33.256361 -82.845030 34.675440 2.110610 -82.843410 34.673714 795.65158
2019-05-22 11:59:59 AM 11 34.551743 -82.844935 34.675329 2.769406 -82.843398 34.673707 750.20689
2019-05-22 12:00:00 PM 12 35.861347 -82.844829 34.675206 2.514388 -82.843388 34.673697 699.9678
2019-05-22 12:00:01 PM 13 36.746560 -82.844725 34.675088 2.560247 -82.843380 34.673688 650.80243
2019-05-22 12:00:02 PM 14 38.055844 -82.844623 34.674972 2.617929 -82.843371 34.673679 603.13207
2019-05-22 12:00:03 PM 15 39.119697 -82.844511 34.674847 2.522058 -82.843362 34.673669 551.01968
2019-05-22 12:00:04 PM 16 39.605765 -82.844390 34.674712 2.492018 -82.843353 34.673661 493.94861
2019-05-22 12:00:05 PM 17 39.971036 -82.844273 34.674584 2.378890 -82.843343 34.673653 439.56334
2019-05-22 12:00:06 PM 18 40.351379 -82.844159 34.674463 2.340541 -82.843335 34.673646 387.33313
2019-05-22 12:00:07 PM 19 40.904504 -82.844037 34.674334 2.169570 -82.843329 34.673639 331.00602
2019-05-22 12:00:08 PM 20 40.875423 -82.843905 34.674199 2.112474 -82.843324 34.673632 270.45462
2019-05-22 12:00:09 PM 21 40.079956 -82.843788 34.674086 2.169570 -82.843316 34.673625 219.70231
2019-05-22 12:00:10 PM 22 39.362891 -82.843655 34.673963 2.184910 -82.843309 34.673616 163.70159
2019-05-22 12:00:11 PM 23 37.479657 -82.843517 34.673846 2.235882 -82.843302 34.673608 108.21334
2019-05-22 12:00:12 PM 24 35.506942 -82.843390 34.673744 2.720192 -82.843291 34.673601 60.333116
2019-05-22 12:00:13 PM 25 34.474780 -82.843276 34.673657 2.262353 -82.843282 34.673593 23.220525
2019-05-22 12:00:14 PM 26 34.160907 -82.843157 34.673565 1.895698 -82.843275 34.673586 35.995729
2019-05-22 12:00:15 PM 27 34.623647 -82.843026 34.673466 1.040844 -82.843269 34.673583 84.535752
2019-05-22 12:00:16 PM 28 35.473068 -82.842896 34.673374 1.466833 -82.843269 34.673582 135.31391
2019-05-22 12:00:17 PM 29 36.202330 -82.842755 34.673280 1.469709 -82.843269 34.673584 189.87874
2019-05-22 12:00:18 PM 30 36.373247 -82.842617 34.673193 2.147520 -82.843273 34.673588 243.97591
2019-05-22 12:00:19 PM 31 35.973197 -82.842483 34.673112 1.987415 -82.843280 34.673592 296.29223
2019-05-22 12:00:20 PM 32 35.471150 -82.842332 34.673026 2.312419 -82.843290 34.673595 354.61668
2019-05-22 12:00:21 PM 33 34.466418 -82.842185 34.672947 2.534521 -82.843300 34.673601 410.85223
2019-05-22 12:00:22 PM 34 32.811570 -82.842048 34.672878 1.919346 -82.843304 34.673608 461.25827
2019-05-22 12:00:23 PM 35 29.584325 -82.841918 34.672816 1.780332 -82.843307 34.673615 508.70628
2019-05-22 12:00:24 PM 36 23.226771 -82.841804 34.672763 1.718016 -82.843311 34.673621 549.8112

Infrastructure and Policy Needs for Personal Electric Mobility Devices in a Connected Vehicle World, 2019
Center for Connected Multimodal Mobility (C2M2) Clemson University, Benedict College, The Citadel, South Carolina State University, University of South Carolina
Page 47
Real Time Travel Time (sec)
Vehicle-Trial-3 Pedestrian-Trial-3 Distance vehicle - Ped. (ft.)
Speed longitude latitude speed longitude latitude
2019-05-22 12:00:25 PM 37 16.133564 -82.841727 34.672718 1.515195 -82.843315 34.673626 580.20355
2019-05-22 12:00:26 PM 38 11.942597 -82.841692 34.672687 0.997702 -82.843318 34.673627 596.57602
Case A - Scenario 2 - Trial 1
Real Time Travel Time (sec)
Vehicle-Trial-1 Pedestrian-Trial-1 Distance vehicle - Ped. (ft.)
speed longitude latitude speed longitude latitude
2019-05-22 12:04:11 PM 0 0.914933 -82.845904 34.676297
2019-05-22 12:04:12 PM 1 0.960951 -82.845902 34.676295
2019-05-22 12:04:13 PM 2 1.148700 -82.845899 34.676292
2019-05-22 12:04:14 PM 3 1.791517 -82.845894 34.676288
2019-05-22 12:04:15 PM 4 2.903626 -82.845885 34.676281
2019-05-22 12:04:16 PM 5 6.383759 -82.845867 34.676269
2019-05-22 12:04:17 PM 6 10.205940 -82.845836 34.676249
2019-05-22 12:04:18 PM 7 12.127736 -82.845795 34.676217
2019-05-22 12:04:19 PM 8 11.572321 -82.845757 34.676178
2019-05-22 12:04:20 PM 9 10.747507 -82.845724 34.676143
2019-05-22 12:04:21 PM 10 10.290946 -82.845693 34.676111
2019-05-22 12:04:22 PM 11 10.285726 -82.845662 34.676080 2.560247 -82.843421 34.673723 1091.6812
2019-05-22 12:04:23 PM 12 11.602041 -82.845627 34.676046 1.710559 -82.843425 34.673727 1073.5262
2019-05-22 12:04:24 PM 13 14.997487 -82.845581 34.676005 2.149757 -82.843433 34.673735 1049.5082
2019-05-22 12:04:25 PM 14 18.985419 -82.845522 34.675955 2.260329 -82.843441 34.673741 1020.7823
2019-05-22 12:04:26 PM 15 22.992632 -82.845453 34.675897 1.914872 -82.843446 34.673744 989.5556
2019-05-22 12:04:27 PM 16 27.356273 -82.845371 34.675819 2.292925 -82.843461 34.673755 946.28585
2019-05-22 12:04:28 PM 17 31.272301 -82.845276 34.675720 2.141368 -82.843467 34.673760 897.62714
2019-05-22 12:04:29 PM 18 33.589514 -82.845180 34.675614 2.179733 -82.843476 34.673767 845.51535
2019-05-22 12:04:30 PM 19 34.375606 -82.845088 34.675508 2.427592 -82.843485 34.673774 794.45041
2019-05-22 12:04:31 PM 20 35.123776 -82.844990 34.675393 2.014791 -82.843490 34.673779 741.14055
2019-05-22 12:04:32 PM 21 36.086006 -82.844882 34.675270 2.023207 -82.843495 34.673784 683.25972
2019-05-22 12:04:33 PM 22 37.043761 -82.844777 34.675150 1.820279 -82.843501 34.673790 626.87248
2019-05-22 12:04:34 PM 23 37.720614 -82.844666 34.675025 1.754447 -82.843507 34.673794 567.95964
2019-05-22 12:04:35 PM 24 38.353738 -82.844554 34.674899 2.249463 -82.843515 34.673800 507.93163
2019-05-22 12:04:36 PM 25 38.582178 -82.844448 34.674780 2.258997 -82.843525 34.673806 450.42716
2019-05-22 12:04:37 PM 26 38.681086 -82.844340 34.674663 2.377931 -82.843536 34.673814 392.31149
2019-05-22 12:04:38 PM 27 38.619248 -82.844226 34.674540 2.323497 -82.843547 34.673823 331.36441
2019-05-22 12:04:39 PM 28 37.905326 -82.844106 34.674411 2.354602 -82.843557 34.673830 268.0069
2019-05-22 12:04:40 PM 29 36.581981 -82.843989 34.674290 2.340541 -82.843568 34.673839 207.45257
2019-05-22 12:04:41 PM 30 34.843512 -82.843878 34.674182 2.526532 -82.843579 34.673849 151.1327
2019-05-22 12:04:42 PM 31 33.242779 -82.843770 34.674081 2.898406 -82.843591 34.673858 97.647925
2019-05-22 12:04:43 PM 32 31.757730 -82.843664 34.673986 2.567437 -82.843601 34.673866 47.34921
2019-05-22 12:04:44 PM 33 30.868736 -82.843564 34.673899 2.416919 -82.843612 34.673875 16.848061
2019-05-22 12:04:45 PM 34 30.252549 -82.843461 34.673811 1.780332 -82.843620 34.673881 54.22756
2019-05-22 12:04:46 PM 35 29.440837 -82.843354 34.673720 1.395142 -82.843623 34.673882 100.19964
2019-05-22 12:04:47 PM 36 28.613467 -82.843254 34.673638 2.244670 -82.843618 34.673878 140.03332
2019-05-22 12:04:48 PM 37 27.733953 -82.843159 34.673563 2.544108 -82.843610 34.673870 175.51354
2019-05-22 12:04:49 PM 38 26.805651 -82.843061 34.673491 2.563975 -82.843600 34.673863 211.22321
2019-05-22 12:04:50 PM 39 25.361828 -82.842958 34.673419 2.587889 -82.843592 34.673856 248.0723
2019-05-22 12:04:51 PM 40 21.855810 -82.842870 34.673358 2.656917 -82.843582 34.673847 278.23657
2019-05-22 12:04:52 PM 41 19.228134 -82.842822 34.673326 2.688128 -82.843576 34.673841 293.85042
Case A - Scenario 2 - Trial 2
Real Time Travel Time (sec)
Vehicle-Trial-2 Pedestrian-Trial-2 Distance vehicle - Ped. (ft.)
speed longitude latitude speed longitude latitude
2019-05-22 12:08:40 PM 0 6.057796 -82.845720 34.676087 0.163301 -82.843447 34.673732 1096.9091
2019-05-22 12:08:41 PM 1 7.017096 -82.845707 34.676078 0.072330 -82.843446 34.673732 1091.8757
2019-05-22 12:08:42 PM 2 9.709858 -82.845675 34.676055 0.088202 -82.843446 34.673732 1079.3233
2019-05-22 12:08:43 PM 3 13.716645 -82.845629 34.676023 0.070093 -82.843447 34.673733 1061.2364
2019-05-22 12:08:44 PM 4 18.377275 -82.845567 34.675981 0.072543 -82.843448 34.673734 1037.3509
2019-05-22 12:08:45 PM 5 22.786455 -82.845493 34.675929 0.369105 -82.843448 34.673735 1008.4058
2019-05-22 12:08:46 PM 6 26.967035 -82.845408 34.675856 1.460761 -82.843452 34.673739 969.86165
2019-05-22 12:08:47 PM 7 30.725834 -82.845311 34.675760 2.250102 -82.843457 34.673746 921.6885
2019-05-22 12:08:48 PM 8 34.367031 -82.845212 34.675651 2.256813 -82.843463 34.673752 869.04451
2019-05-22 12:08:49 PM 9 37.495476 -82.845106 34.675531 2.530047 -82.843471 34.673759 811.57428
2019-05-22 12:08:50 PM 10 40.015456 -82.845011 34.675419 2.310501 -82.843478 34.673765 758.65996
2019-05-22 12:08:51 PM 11 40.941574 -82.844894 34.675281 2.082647 -82.843483 34.673771 694.54492
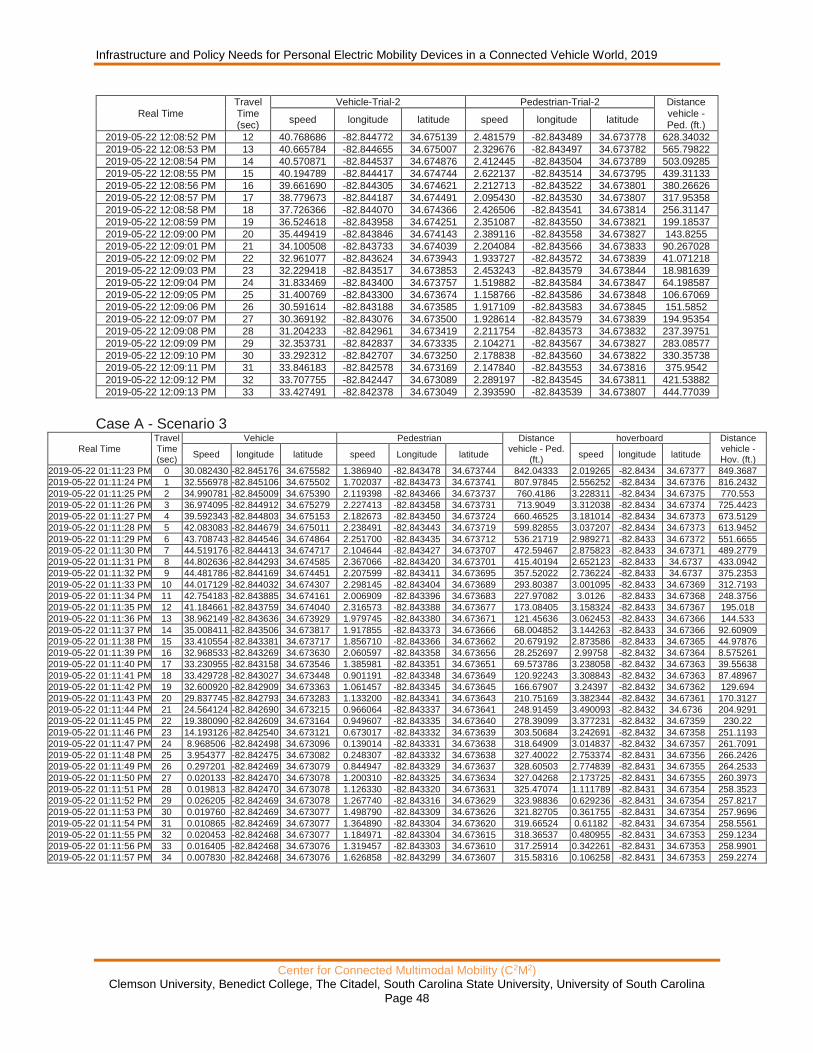
Infrastructure and Policy Needs for Personal Electric Mobility Devices in a Connected Vehicle World, 2019
Center for Connected Multimodal Mobility (C2M2) Clemson University, Benedict College, The Citadel, South Carolina State University, University of South Carolina
Page 48
Real Time Travel Time (sec)
Vehicle-Trial-2 Pedestrian-Trial-2 Distance vehicle - Ped. (ft.)
speed longitude latitude speed longitude latitude
2019-05-22 12:08:52 PM 12 40.768686 -82.844772 34.675139 2.481579 -82.843489 34.673778 628.34032
2019-05-22 12:08:53 PM 13 40.665784 -82.844655 34.675007 2.329676 -82.843497 34.673782 565.79822
2019-05-22 12:08:54 PM 14 40.570871 -82.844537 34.674876 2.412445 -82.843504 34.673789 503.09285
2019-05-22 12:08:55 PM 15 40.194789 -82.844417 34.674744 2.622137 -82.843514 34.673795 439.31133
2019-05-22 12:08:56 PM 16 39.661690 -82.844305 34.674621 2.212713 -82.843522 34.673801 380.26626
2019-05-22 12:08:57 PM 17 38.779673 -82.844187 34.674491 2.095430 -82.843530 34.673807 317.95358
2019-05-22 12:08:58 PM 18 37.726366 -82.844070 34.674366 2.426506 -82.843541 34.673814 256.31147
2019-05-22 12:08:59 PM 19 36.524618 -82.843958 34.674251 2.351087 -82.843550 34.673821 199.18537
2019-05-22 12:09:00 PM 20 35.449419 -82.843846 34.674143 2.389116 -82.843558 34.673827 143.8255
2019-05-22 12:09:01 PM 21 34.100508 -82.843733 34.674039 2.204084 -82.843566 34.673833 90.267028
2019-05-22 12:09:02 PM 22 32.961077 -82.843624 34.673943 1.933727 -82.843572 34.673839 41.071218
2019-05-22 12:09:03 PM 23 32.229418 -82.843517 34.673853 2.453243 -82.843579 34.673844 18.981639
2019-05-22 12:09:04 PM 24 31.833469 -82.843400 34.673757 1.519882 -82.843584 34.673847 64.198587
2019-05-22 12:09:05 PM 25 31.400769 -82.843300 34.673674 1.158766 -82.843586 34.673848 106.67069
2019-05-22 12:09:06 PM 26 30.591614 -82.843188 34.673585 1.917109 -82.843583 34.673845 151.5852
2019-05-22 12:09:07 PM 27 30.369192 -82.843076 34.673500 1.928614 -82.843579 34.673839 194.95354
2019-05-22 12:09:08 PM 28 31.204233 -82.842961 34.673419 2.211754 -82.843573 34.673832 237.39751
2019-05-22 12:09:09 PM 29 32.353731 -82.842837 34.673335 2.104271 -82.843567 34.673827 283.08577
2019-05-22 12:09:10 PM 30 33.292312 -82.842707 34.673250 2.178838 -82.843560 34.673822 330.35738
2019-05-22 12:09:11 PM 31 33.846183 -82.842578 34.673169 2.147840 -82.843553 34.673816 375.9542
2019-05-22 12:09:12 PM 32 33.707755 -82.842447 34.673089 2.289197 -82.843545 34.673811 421.53882
2019-05-22 12:09:13 PM 33 33.427491 -82.842378 34.673049 2.393590 -82.843539 34.673807 444.77039
Case A - Scenario 3
Real Time Travel Time (sec)
Vehicle Pedestrian Distance vehicle - Ped.
(ft.)
hoverboard Distance vehicle - Hov. (ft.)
Speed longitude latitude speed Longitude latitude speed longitude latitude
2019-05-22 01:11:23 PM 0 30.082430 -82.845176 34.675582 1.386940 -82.843478 34.673744 842.04333 2.019265 -82.8434 34.67377 849.3687
2019-05-22 01:11:24 PM 1 32.556978 -82.845106 34.675502 1.702037 -82.843473 34.673741 807.97845 2.556252 -82.8434 34.67376 816.2432
2019-05-22 01:11:25 PM 2 34.990781 -82.845009 34.675390 2.119398 -82.843466 34.673737 760.4186 3.228311 -82.8434 34.67375 770.553
2019-05-22 01:11:26 PM 3 36.974095 -82.844912 34.675279 2.227413 -82.843458 34.673731 713.9049 3.312038 -82.8434 34.67374 725.4423
2019-05-22 01:11:27 PM 4 39.592343 -82.844803 34.675153 2.182673 -82.843450 34.673724 660.46525 3.181014 -82.8434 34.67373 673.5129
2019-05-22 01:11:28 PM 5 42.083083 -82.844679 34.675011 2.238491 -82.843443 34.673719 599.82855 3.037207 -82.8434 34.67373 613.9452
2019-05-22 01:11:29 PM 6 43.708743 -82.844546 34.674864 2.251700 -82.843435 34.673712 536.21719 2.989271 -82.8433 34.67372 551.6655
2019-05-22 01:11:30 PM 7 44.519176 -82.844413 34.674717 2.104644 -82.843427 34.673707 472.59467 2.875823 -82.8433 34.67371 489.2779
2019-05-22 01:11:31 PM 8 44.802636 -82.844293 34.674585 2.367066 -82.843420 34.673701 415.40194 2.652123 -82.8433 34.6737 433.0942
2019-05-22 01:11:32 PM 9 44.481786 -82.844169 34.674451 2.207599 -82.843411 34.673695 357.52022 2.736224 -82.8433 34.6737 375.2353
2019-05-22 01:11:33 PM 10 44.017129 -82.844032 34.674307 2.298145 -82.843404 34.673689 293.80387 3.001095 -82.8433 34.67369 312.7193
2019-05-22 01:11:34 PM 11 42.754183 -82.843885 34.674161 2.006909 -82.843396 34.673683 227.97082 3.0126 -82.8433 34.67368 248.3756
2019-05-22 01:11:35 PM 12 41.184661 -82.843759 34.674040 2.316573 -82.843388 34.673677 173.08405 3.158324 -82.8433 34.67367 195.018
2019-05-22 01:11:36 PM 13 38.962149 -82.843636 34.673929 1.979745 -82.843380 34.673671 121.45636 3.062453 -82.8433 34.67366 144.533
2019-05-22 01:11:37 PM 14 35.008411 -82.843506 34.673817 1.917855 -82.843373 34.673666 68.004852 3.144263 -82.8433 34.67366 92.60909
2019-05-22 01:11:38 PM 15 33.410554 -82.843381 34.673717 1.856710 -82.843366 34.673662 20.679192 2.873586 -82.8433 34.67365 44.97876
2019-05-22 01:11:39 PM 16 32.968533 -82.843269 34.673630 2.060597 -82.843358 34.673656 28.252697 2.99758 -82.8432 34.67364 8.575261
2019-05-22 01:11:40 PM 17 33.230955 -82.843158 34.673546 1.385981 -82.843351 34.673651 69.573786 3.238058 -82.8432 34.67363 39.55638
2019-05-22 01:11:41 PM 18 33.429728 -82.843027 34.673448 0.901191 -82.843348 34.673649 120.92243 3.308843 -82.8432 34.67363 87.48967
2019-05-22 01:11:42 PM 19 32.600920 -82.842909 34.673363 1.061457 -82.843345 34.673645 166.67907 3.24397 -82.8432 34.67362 129.694
2019-05-22 01:11:43 PM 20 29.837745 -82.842793 34.673283 1.133200 -82.843341 34.673643 210.75169 3.382344 -82.8432 34.67361 170.3127
2019-05-22 01:11:44 PM 21 24.564124 -82.842690 34.673215 0.966064 -82.843337 34.673641 248.91459 3.490093 -82.8432 34.6736 204.9291
2019-05-22 01:11:45 PM 22 19.380090 -82.842609 34.673164 0.949607 -82.843335 34.673640 278.39099 3.377231 -82.8432 34.67359 230.22
2019-05-22 01:11:46 PM 23 14.193126 -82.842540 34.673121 0.673017 -82.843332 34.673639 303.50684 3.242691 -82.8432 34.67358 251.1193
2019-05-22 01:11:47 PM 24 8.968506 -82.842498 34.673096 0.139014 -82.843331 34.673638 318.64909 3.014837 -82.8432 34.67357 261.7091
2019-05-22 01:11:48 PM 25 3.954377 -82.842475 34.673082 0.248307 -82.843332 34.673638 327.40022 2.753374 -82.8431 34.67356 266.2426
2019-05-22 01:11:49 PM 26 0.297201 -82.842469 34.673079 0.844947 -82.843329 34.673637 328.60503 2.774839 -82.8431 34.67355 264.2533
2019-05-22 01:11:50 PM 27 0.020133 -82.842470 34.673078 1.200310 -82.843325 34.673634 327.04268 2.173725 -82.8431 34.67355 260.3973
2019-05-22 01:11:51 PM 28 0.019813 -82.842470 34.673078 1.126330 -82.843320 34.673631 325.47074 1.111789 -82.8431 34.67354 258.3523
2019-05-22 01:11:52 PM 29 0.026205 -82.842469 34.673078 1.267740 -82.843316 34.673629 323.98836 0.629236 -82.8431 34.67354 257.8217
2019-05-22 01:11:53 PM 30 0.019760 -82.842469 34.673077 1.498790 -82.843309 34.673626 321.82705 0.361755 -82.8431 34.67354 257.9696
2019-05-22 01:11:54 PM 31 0.010865 -82.842469 34.673077 1.364890 -82.843304 34.673620 319.66524 0.61182 -82.8431 34.67354 258.5561
2019-05-22 01:11:55 PM 32 0.020453 -82.842468 34.673077 1.184971 -82.843304 34.673615 318.36537 0.480955 -82.8431 34.67353 259.1234
2019-05-22 01:11:56 PM 33 0.016405 -82.842468 34.673076 1.319457 -82.843303 34.673610 317.25914 0.342261 -82.8431 34.67353 258.9901
2019-05-22 01:11:57 PM 34 0.007830 -82.842468 34.673076 1.626858 -82.843299 34.673607 315.58316 0.106258 -82.8431 34.67353 259.2274

Infrastructure and Policy Needs for Personal Electric Mobility Devices in a Connected Vehicle World, 2019
Center for Connected Multimodal Mobility (C2M2) Clemson University, Benedict College, The Citadel, South Carolina State University, University of South Carolina
Page 49
Case A - Scenario 4
Real Time Travel Time (sec)
Vehicle Pedestrian Distance vehicle - Ped. (ft.)
hoverboard Distance vehicle - Hov. (ft.)
speed longitude latitude speed Longitude latitude speed longitude latitude
2019-05-22 01:05:42 PM 0 6.857151 -82.847066 34.677648
2019-05-22 01:05:43 PM 1 9.667994 -82.847036 34.677643
2019-05-22 01:05:44 PM 2 13.035745 -82.846988 34.677624
2019-05-22 01:05:45 PM 3 16.252444 -82.846938 34.677582
2019-05-22 01:05:46 PM 4 19.379770 -82.846881 34.677521
2019-05-22 01:05:47 PM 5 22.219801 -82.846816 34.677448
2019-05-22 01:05:48 PM 6 24.554058 -82.846752 34.677374
2019-05-22 01:05:49 PM 7 26.573643 -82.846683 34.677295
2019-05-22 01:05:50 PM 8 28.519833 -82.846603 34.677205
2019-05-22 01:05:51 PM 9 30.372069 -82.846514 34.677107
2019-05-22 01:05:52 PM 10 31.764761 -82.846420 34.677003
2019-05-22 01:05:53 PM 11 32.882622 -82.846323 34.676894
2019-05-22 01:05:54 PM 12 33.887567 -82.846230 34.676788
2019-05-22 01:05:55 PM 13 34.920209 -82.846135 34.676678
2019-05-22 01:05:56 PM 14 35.838977 -82.846029 34.676555
2019-05-22 01:05:57 PM 15 36.160785 -82.845923 34.676434
2019-05-22 01:05:58 PM 16 36.470184 -82.845824 34.676321
2019-05-22 01:05:59 PM 17 37.257555 -82.845721 34.676205 2.772985 -82.8432 34.67352 1231.557
2019-05-22 01:06:00 PM 18 38.276668 -82.845603 34.676071 1.836577 -82.843167 34.673519 1183.8035 2.80392 -82.8432 34.67353 1167.54
2019-05-22 01:06:01 PM 19 39.091575 -82.845498 34.675951 1.885045 -82.843174 34.673524 1126.9726 2.909059 -82.8432 34.67354 1109.215
2019-05-22 01:06:02 PM 20 39.641557 -82.845392 34.675830 2.035111 -82.843190 34.673537 1065.8376 2.845144 -82.8433 34.67355 1050.734
2019-05-22 01:06:03 PM 21 40.120595 -82.845269 34.675687 1.912262 -82.843195 34.673541 1000.1428 2.705279 -82.8433 34.67356 983.2032
2019-05-22 01:06:04 PM 22 40.494494 -82.845153 34.675551 2.184590 -82.843202 34.673546 936.49733 2.814146 -82.8433 34.67356 918.4237
2019-05-22 01:06:05 PM 23 40.793559 -82.845044 34.675424 2.187786 -82.843210 34.673552 877.20171 2.881576 -82.8433 34.67357 857.4517
2019-05-22 01:06:06 PM 24 41.307803 -82.844931 34.675294 2.302768 -82.843217 34.673558 815.7599 2.943572 -82.8433 34.67358 795.2437
2019-05-22 01:06:07 PM 25 41.760316 -82.844806 34.675150 2.226454 -82.843225 34.673565 747.88794 2.869112 -82.8433 34.67359 726.3966
2019-05-22 01:06:08 PM 26 41.869556 -82.844688 34.675017 2.275029 -82.843233 34.673570 685.01113 2.772389 -82.8433 34.67359 662.6624
2019-05-22 01:06:09 PM 27 42.078290 -82.844571 34.674886 2.309543 -82.843244 34.673576 622.13843 2.693348 -82.8433 34.6736 599.1206
2019-05-22 01:06:10 PM 28 42.111525 -82.844436 34.674739 2.312738 -82.843253 34.673582 551.57847 2.698461 -82.8433 34.67361 528.2133
2019-05-22 01:06:11 PM 29 42.090646 -82.844318 34.674612 2.439076 -82.843260 34.673589 489.77067 2.578941 -82.8433 34.67362 465.6526
2019-05-22 01:06:12 PM 30 41.877599 -82.844197 34.674482 2.351087 -82.843267 34.673597 426.8536 2.398703 -82.8434 34.67362 402.4194
2019-05-22 01:06:13 PM 31 41.114782 -82.844062 34.674339 2.198332 -82.843276 34.673604 357.15439 2.352578 -82.8434 34.67363 333.1159
2019-05-22 01:06:14 PM 32 39.468882 -82.843949 34.674224 2.237959 -82.843284 34.673611 299.50465 2.561685 -82.8434 34.67364 275.6227
2019-05-22 01:06:15 PM 33 37.769828 -82.843832 34.674108 2.403284 -82.843292 34.673617 241.4237 2.535799 -82.8434 34.67364 217.0032
2019-05-22 01:06:16 PM 34 35.234348 -82.843709 34.673991 2.360994 -82.843301 34.673624 181.56874 2.634866 -82.8434 34.67365 156.7446
2019-05-22 01:06:17 PM 35 32.157195 -82.843594 34.673892 2.378251 -82.843310 34.673631 127.64812 2.751883 -82.8434 34.67366 103.3683
2019-05-22 01:06:18 PM 36 30.853077 -82.843487 34.673806 2.307093 -82.843319 34.673637 79.449864 2.574467 -82.8434 34.67366 56.50797
2019-05-22 01:06:19 PM 37 30.532493 -82.843383 34.673723 1.905604 -82.843327 34.673644 33.289162 2.451432 -82.8434 34.67367 21.48449
2019-05-22 01:06:20 PM 38 31.377121 -82.843265 34.673628 1.279884 -82.843333 34.673650 21.94907 2.476679 -82.8434 34.67368 51.78797
2019-05-22 01:06:21 PM 39 32.130777 -82.843158 34.673544 0.845959 -82.843337 34.673653 66.943059 2.240515 -82.8434 34.67369 98.2896
2019-05-22 01:06:22 PM 40 32.181802 -82.843042 34.673457 1.045318 -82.843342 34.673656 115.61278 2.159025 -82.8434 34.67369 148.1509
2019-05-22 01:06:23 PM 41 31.748463 -82.842918 34.673367 1.229711 -82.843347 34.673659 166.81579 2.39881 -82.8434 34.6737 200.7478
2019-05-22 01:06:24 PM 42 31.596134 -82.842806 34.673290 1.432426 -82.843352 34.673662 212.78384 2.198971 -82.8435 34.67371 247.9673
2019-05-22 01:06:25 PM 43 31.876291 -82.842685 34.673211 1.173147 -82.843360 34.673665 261.49252 1.819001 -82.8435 34.67371 297.4181
2019-05-22 01:06:26 PM 44 32.188513 -82.842553 34.673129 0.282182 -82.843363 34.673667 312.34121 0.457307 -82.8435 34.67371 348.5863
2019-05-22 01:06:27 PM 45 32.233679 -82.842431 34.673057 0.030040 -82.843364 34.673667 357.35194 0.326922 -82.8435 34.67372 394.6011
2019-05-22 01:06:28 PM 46 31.730886 -82.842299 34.672983 0.041757 -82.843364 34.673667 405.16382 0.82737 -82.8435 34.67372 443.0584
2019-05-22 01:06:29 PM 47 30.537287 -82.842168 34.672914 0.044740 -82.843364 34.673667 452.02663 0.916052 -82.8435 34.67372 488.5523
2019-05-22 01:06:30 PM 48 29.148110 -82.842050 34.672854 0.030200 -82.843365 34.673667 493.51506 1.21565 -82.8435 34.67372 528.1747
2019-05-22 01:06:31 PM 49 27.304375 -82.841951 34.672804 2.587889 -82.843592 34.673856 624.11758 0.729709 -82.8435 34.67372 561.7185

Infrastructure and Policy Needs for Personal Electric Mobility Devices in a Connected Vehicle World, 2019
Center for Connected Multimodal Mobility (C2M2) Clemson University, Benedict College, The Citadel, South Carolina State University, University of South Carolina
Page 50
Appendix B - PEMDs along Roadway in a Connected Environment (Case-B)
Case B - Scenario 1 - Trial 1
Real Time Travel Time (sec)
Vehicle-Trial-1 Pedestrian-Trial-1 Distance vehicle - Ped.
(ft.) speed longitude latitude speed longitude latitude
2019-05-22 12:23:20 PM 0 4.144415 -82.847097 34.677654
2019-05-22 12:23:21 PM 1 6.931504 -82.847075 34.677657
2019-05-22 12:23:22 PM 2 10.358908 -82.847031 34.677652
2019-05-22 12:23:23 PM 3 14.115790 -82.846977 34.677626
2019-05-22 12:23:24 PM 4 17.725988 -82.846921 34.677579
2019-05-22 12:23:25 PM 5 20.915204 -82.846865 34.677518
2019-05-22 12:23:26 PM 6 23.933983 -82.846801 34.677444
2019-05-22 12:23:27 PM 7 26.596332 -82.846726 34.677358
2019-05-22 12:23:28 PM 8 28.880629 -82.846642 34.677265
2019-05-22 12:23:29 PM 9 30.718857 -82.846565 34.677179
2019-05-22 12:23:30 PM 10 32.652850 -82.846471 34.677073
2019-05-22 12:23:31 PM 11 34.159949 -82.846372 34.676960
2019-05-22 12:23:32 PM 12 35.160207 -82.846269 34.676844
2019-05-22 12:23:33 PM 13 36.033916 -82.846166 34.676727
2019-05-22 12:23:34 PM 14 36.383527 -82.846060 34.676605
2019-05-22 12:23:35 PM 15 36.205472 -82.845968 34.676500
2019-05-22 12:23:36 PM 16 36.594763 -82.845856 34.676371
2019-05-22 12:23:37 PM 17 37.238380 -82.845750 34.676251
2019-05-22 12:23:38 PM 18 37.954806 -82.845647 34.676135 0.083216 -82.843397 34.673717 1110.8198
2019-05-22 12:23:39 PM 19 38.938500 -82.845533 34.676007 0.126231 -82.843399 34.673717 1052.6017
2019-05-22 12:23:40 PM 20 39.823713 -82.845416 34.675875 0.134540 -82.843400 34.673718 992.45411
2019-05-22 12:23:41 PM 21 40.282778 -82.845301 34.675741 0.219599 -82.843400 34.673717 933.06375
2019-05-22 12:23:42 PM 22 40.354521 -82.845189 34.675610 1.036370 -82.843401 34.673719 874.13065
2019-05-22 12:23:43 PM 23 40.532523 -82.845075 34.675477 1.376075 -82.843399 34.673718 815.29907
2019-05-22 12:23:44 PM 24 40.953132 -82.844965 34.675351 2.048453 -82.843394 34.673715 760.43302
2019-05-22 12:23:45 PM 25 41.638240 -82.844848 34.675216 1.979372 -82.843387 34.673709 703.11888
2019-05-22 12:23:46 PM 26 42.058796 -82.844722 34.675071 1.900491 -82.843381 34.673704 640.93947
2019-05-22 12:23:47 PM 27 42.341563 -82.844610 34.674946 1.945870 -82.843375 34.673698 587.19352
2019-05-22 12:23:48 PM 28 42.548699 -82.844483 34.674805 1.749334 -82.843369 34.673692 525.74509
2019-05-22 12:23:49 PM 29 42.492135 -82.844351 34.674660 1.784753 -82.843365 34.673687 462.00241
2019-05-22 12:23:50 PM 30 42.313228 -82.844233 34.674531 1.707470 -82.843361 34.673683 405.13317
2019-05-22 12:23:51 PM 31 41.894536 -82.844109 34.674398 1.866031 -82.843355 34.673679 346.15506
2019-05-22 12:23:52 PM 32 41.367243 -82.843979 34.674263 2.023207 -82.843349 34.673674 286.02963
2019-05-22 12:23:53 PM 33 40.829724 -82.843846 34.674133 2.053939 -82.843343 34.673669 226.68075
2019-05-22 12:23:54 PM 34 39.905843 -82.843724 34.674017 1.862462 -82.843337 34.673664 173.26751
2019-05-22 12:23:55 PM 35 36.742086 -82.843599 34.673904 2.036309 -82.843330 34.673658 120.74741
2019-05-22 12:23:56 PM 36 32.688003 -82.843475 34.673801 1.703635 -82.843323 34.673652 70.787462
2019-05-22 12:23:57 PM 37 31.407853 -82.843373 34.673720 1.833701 -82.843318 34.673647 31.382575
2019-05-22 12:23:58 PM 38 31.289558 -82.843256 34.673634 1.764620 -82.843313 34.673642 17.336183
2019-05-22 12:23:59 PM 39 32.066756 -82.843135 34.673543 1.263585 -82.843309 34.673637 62.347988
2019-05-22 12:24:00 PM 40 32.774607 -82.843014 34.673453 0.688676 -82.843309 34.673633 110.17324
2019-05-22 12:24:01 PM 41 32.152028 -82.842897 34.673367 0.622845 -82.843310 34.673631 156.87516
2019-05-22 12:24:02 PM 42 29.306298 -82.842785 34.673289 0.774002 -82.843313 34.673629 201.43787
2019-05-22 12:24:03 PM 43 24.338240 -82.842685 34.673221 0.536241 -82.843315 34.673628 240.42993
2019-05-22 12:24:04 PM 44 19.516035 -82.842614 34.673174 0.599516 -82.843317 34.673628 268.14423
Case B - Scenario 1 - Trial 2
Real Time Travel Time (sec)
Vehicle-Trial-2 Pedestrian-Trial-2 Distance vehicle - Ped.
(ft.) speed longitude latitude speed longitude latitude
2019-05-22 12:28:11 PM 0 2.785811 -82.847095 34.677667
2019-05-22 12:28:12 PM 1 5.350265 -82.847078 34.677668
2019-05-22 12:28:13 PM 2 9.128238 -82.847040 34.677663
2019-05-22 12:28:14 PM 3 12.785733 -82.846990 34.677641
2019-05-22 12:28:15 PM 4 16.186293 -82.846936 34.677598
2019-05-22 12:28:16 PM 5 19.135298 -82.846880 34.677539
2019-05-22 12:28:17 PM 6 21.615013 -82.846825 34.677478
2019-05-22 12:28:18 PM 7 23.845142 -82.846761 34.677405
2019-05-22 12:28:19 PM 8 25.995857 -82.846687 34.677320
2019-05-22 12:28:20 PM 9 27.942367 -82.846610 34.677231
2019-05-22 12:28:21 PM 10 29.855322 -82.846521 34.677131
2019-05-22 12:28:22 PM 11 31.624469 -82.846428 34.677027
2019-05-22 12:28:23 PM 12 32.786218 -82.846342 34.676931
2019-05-22 12:28:24 PM 13 33.729486 -82.846251 34.676828
2019-05-22 12:28:25 PM 14 34.845429 -82.846151 34.676712
2019-05-22 12:28:26 PM 15 35.787846 -82.846051 34.676595
2019-05-22 12:28:27 PM 16 36.346456 -82.845945 34.676473 1.634129 -82.843366 34.673680 1279.5529

Infrastructure and Policy Needs for Personal Electric Mobility Devices in a Connected Vehicle World, 2019
Center for Connected Multimodal Mobility (C2M2) Clemson University, Benedict College, The Citadel, South Carolina State University, University of South Carolina
Page 51
Real Time Travel Time (sec)
Vehicle-Trial-2 Pedestrian-Trial-2 Distance vehicle - Ped.
(ft.) speed longitude latitude speed longitude latitude
2019-05-22 12:28:28 PM 17 36.864801 -82.845833 34.676347 2.078173 -82.843361 34.673676 1224.7015
2019-05-22 12:28:29 PM 18 37.734355 -82.845729 34.676229 2.050770 -82.843352 34.673668 1175.4875
2019-05-22 12:28:30 PM 19 38.105431 -82.845623 34.676109 1.841051 -82.843346 34.673663 1123.6929
2019-05-22 12:28:31 PM 20 38.880019 -82.845518 34.675990 2.028639 -82.843339 34.673656 1073.583
2019-05-22 12:28:32 PM 21 39.826589 -82.845396 34.675850 1.981236 -82.843331 34.673649 1014.1527
2019-05-22 12:28:33 PM 22 40.400859 -82.845275 34.675710 1.834340 -82.843324 34.673642 955.00971
2019-05-22 12:28:34 PM 23 40.864025 -82.845166 34.675584 1.958653 -82.843317 34.673635 901.86592
2019-05-22 12:28:35 PM 24 41.401437 -82.845050 34.675449 2.049838 -82.843310 34.673628 845.00525
2019-05-22 12:28:36 PM 25 42.035467 -82.844924 34.675305 2.189703 -82.843300 34.673620 784.35698
2019-05-22 12:28:37 PM 26 42.557434 -82.844813 34.675178 2.083286 -82.843291 34.673612 731.39286
2019-05-22 12:28:38 PM 27 43.005686 -82.844695 34.675041 1.814846 -82.843281 34.673603 674.75886
2019-05-22 12:28:39 PM 28 43.296176 -82.844568 34.674896 1.409310 -82.843276 34.673596 612.67657
2019-05-22 12:28:40 PM 29 43.396522 -82.844435 34.674748 1.422732 -82.843269 34.673592 547.90448
2019-05-22 12:28:41 PM 30 43.345390 -82.844303 34.674605 1.679028 -82.843262 34.673587 485.48426
2019-05-22 12:28:42 PM 31 42.810215 -82.844182 34.674474 1.856390 -82.843255 34.673580 428.84316
2019-05-22 12:28:43 PM 32 41.596056 -82.844057 34.674341 1.927655 -82.843248 34.673575 369.93256
2019-05-22 12:28:44 PM 33 40.106534 -82.843929 34.674209 1.804620 -82.843240 34.673569 311.68252
2019-05-22 12:28:45 PM 34 39.085983 -82.843810 34.674095 1.778415 -82.843232 34.673563 260.3861
2019-05-22 12:28:46 PM 35 38.360715 -82.843682 34.673975 1.921583 -82.843224 34.673557 205.11691
2019-05-22 12:28:47 PM 36 38.000558 -82.843551 34.673860 1.729201 -82.843216 34.673552 150.8217
2019-05-22 12:28:48 PM 37 36.799769 -82.843429 34.673759 1.893141 -82.843207 34.673545 102.4411
2019-05-22 12:28:49 PM 38 32.204491 -82.843311 34.673667 1.857456 -82.843199 34.673540 57.155776
2019-05-22 12:28:50 PM 39 30.328607 -82.843188 34.673579 1.839773 -82.843191 34.673534 16.10019
2019-05-22 12:28:51 PM 40 29.669704 -82.843084 34.673504 1.458844 -82.843184 34.673529 31.52753
2019-05-22 12:28:52 PM 41 29.681155 -82.842975 34.673425 0.804361 -82.843177 34.673528 71.26415
2019-05-22 12:28:53 PM 42 29.139801 -82.842860 34.673343 0.946624 -82.843177 34.673529 116.83645
2019-05-22 12:28:54 PM 43 27.326074 -82.842756 34.673272 2.142087 -82.843185 34.673532 159.78921
2019-05-22 12:28:55 PM 44 23.452069 -82.842667 34.673212 2.408610 -82.843196 34.673534 197.43847
2019-05-22 12:28:56 PM 45 16.450898 -82.842584 34.673158 2.129624 -82.843206 34.673540 232.97021
Case B - Scenario 1 - Trial 3
Real Time Travel Time (sec)
Vehicle-Trial-3 Pedestrian-Trial-3 Distance vehicle - Ped.
(ft.) speed longitude latitude speed longitude latitude
2019-05-22 12:32:06 PM 0 13.747707 -82.846969 34.677623
2019-05-22 12:32:07 PM 1 16.499473 -82.846927 34.677583
2019-05-22 12:32:08 PM 2 19.350423 -82.846875 34.677528
2019-05-22 12:32:09 PM 3 22.022945 -82.846814 34.677460
2019-05-22 12:32:10 PM 4 24.179733 -82.846744 34.677380
2019-05-22 12:32:11 PM 5 25.932582 -82.846672 34.677297
2019-05-22 12:32:12 PM 6 27.579653 -82.846593 34.677210
2019-05-22 12:32:13 PM 7 29.041054 -82.846510 34.677118
2019-05-22 12:32:14 PM 8 30.422082 -82.846428 34.677026
2019-05-22 12:32:15 PM 9 31.632778 -82.846338 34.676926
2019-05-22 12:32:16 PM 10 32.811038 -82.846242 34.676818
2019-05-22 12:32:17 PM 11 33.524641 -82.846143 34.676706
2019-05-22 12:32:18 PM 12 33.881602 -82.846047 34.676595
2019-05-22 12:32:19 PM 13 34.645910 -82.845958 34.676493
2019-05-22 12:32:20 PM 14 36.044781 -82.845856 34.676377
2019-05-22 12:32:21 PM 15 37.958375 -82.845739 34.676246 0.079637 -82.843416 34.673730 1152.5562
2019-05-22 12:32:22 PM 16 38.961190 -82.845624 34.676117 0.231689 -82.843418 34.673731 1093.5904
2019-05-22 12:32:23 PM 17 39.477458 -82.845525 34.676004 0.079573 -82.843420 34.673731 1042.122
2019-05-22 12:32:24 PM 18 39.747655 -82.845416 34.675877 0.121118 -82.843422 34.673730 985.75658
2019-05-22 12:32:25 PM 19 39.883473 -82.845297 34.675739 0.588331 -82.843422 34.673731 923.81073
2019-05-22 12:32:26 PM 20 39.798147 -82.845177 34.675601 1.243772 -82.843416 34.673730 863.18952
2019-05-22 12:32:27 PM 21 40.085762 -82.845064 34.675470 1.602651 -82.843406 34.673726 807.79821
2019-05-22 12:32:28 PM 22 40.815184 -82.844956 34.675344 1.624382 -82.843401 34.673720 754.0888
2019-05-22 12:32:29 PM 23 41.463754 -82.844839 34.675210 1.951783 -82.843392 34.673716 696.85859
2019-05-22 12:32:30 PM 24 41.681382 -82.844714 34.675066 1.576126 -82.843387 34.673711 634.59748
2019-05-22 12:32:31 PM 25 41.570491 -82.844594 34.674930 2.009146 -82.843381 34.673704 576.83466
2019-05-22 12:32:32 PM 26 41.204049 -82.844480 34.674804 2.055803 -82.843374 34.673697 522.60603
2019-05-22 12:32:33 PM 27 40.708287 -82.844359 34.674674 1.995404 -82.843368 34.673691 465.86588
2019-05-22 12:32:34 PM 28 40.482350 -82.844232 34.674537 1.861184 -82.843362 34.673683 406.30028
2019-05-22 12:32:35 PM 29 40.179396 -82.844112 34.674408 1.978999 -82.843355 34.673676 350.47142
2019-05-22 12:32:36 PM 30 39.889811 -82.844002 34.674292 2.136015 -82.843347 34.673669 300.28409
2019-05-22 12:32:37 PM 31 39.527151 -82.843884 34.674171 2.081688 -82.843340 34.673663 246.80455
2019-05-22 12:32:38 PM 32 38.973973 -82.843756 34.674048 1.740386 -82.843334 34.673658 190.2702
2019-05-22 12:32:39 PM 33 37.692811 -82.843619 34.673924 1.854153 -82.843328 34.673651 132.5308
2019-05-22 12:32:40 PM 34 35.219967 -82.843491 34.673817 1.895059 -82.843320 34.673642 81.820568
2019-05-22 12:32:41 PM 35 32.101323 -82.843382 34.673733 2.097560 -82.843311 34.673633 42.177119
2019-05-22 12:32:42 PM 36 31.164286 -82.843264 34.673643 1.968880 -82.843305 34.673626 13.662032
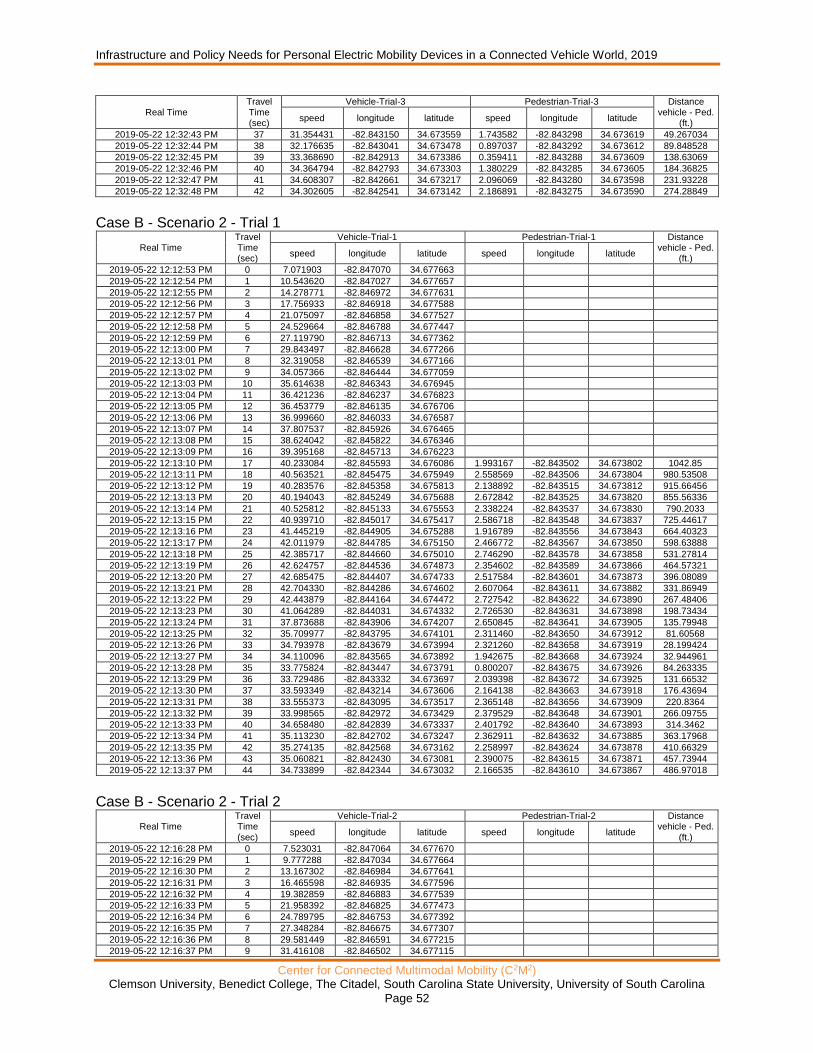
Infrastructure and Policy Needs for Personal Electric Mobility Devices in a Connected Vehicle World, 2019
Center for Connected Multimodal Mobility (C2M2) Clemson University, Benedict College, The Citadel, South Carolina State University, University of South Carolina
Page 52
Real Time Travel Time (sec)
Vehicle-Trial-3 Pedestrian-Trial-3 Distance vehicle - Ped.
(ft.) speed longitude latitude speed longitude latitude
2019-05-22 12:32:43 PM 37 31.354431 -82.843150 34.673559 1.743582 -82.843298 34.673619 49.267034
2019-05-22 12:32:44 PM 38 32.176635 -82.843041 34.673478 0.897037 -82.843292 34.673612 89.848528
2019-05-22 12:32:45 PM 39 33.368690 -82.842913 34.673386 0.359411 -82.843288 34.673609 138.63069
2019-05-22 12:32:46 PM 40 34.364794 -82.842793 34.673303 1.380229 -82.843285 34.673605 184.36825
2019-05-22 12:32:47 PM 41 34.608307 -82.842661 34.673217 2.096069 -82.843280 34.673598 231.93228
2019-05-22 12:32:48 PM 42 34.302605 -82.842541 34.673142 2.186891 -82.843275 34.673590 274.28849
Case B - Scenario 2 - Trial 1
Real Time Travel Time (sec)
Vehicle-Trial-1 Pedestrian-Trial-1 Distance vehicle - Ped.
(ft.) speed longitude latitude speed longitude latitude
2019-05-22 12:12:53 PM 0 7.071903 -82.847070 34.677663
2019-05-22 12:12:54 PM 1 10.543620 -82.847027 34.677657
2019-05-22 12:12:55 PM 2 14.278771 -82.846972 34.677631
2019-05-22 12:12:56 PM 3 17.756933 -82.846918 34.677588
2019-05-22 12:12:57 PM 4 21.075097 -82.846858 34.677527
2019-05-22 12:12:58 PM 5 24.529664 -82.846788 34.677447
2019-05-22 12:12:59 PM 6 27.119790 -82.846713 34.677362
2019-05-22 12:13:00 PM 7 29.843497 -82.846628 34.677266
2019-05-22 12:13:01 PM 8 32.319058 -82.846539 34.677166
2019-05-22 12:13:02 PM 9 34.057366 -82.846444 34.677059
2019-05-22 12:13:03 PM 10 35.614638 -82.846343 34.676945
2019-05-22 12:13:04 PM 11 36.421236 -82.846237 34.676823
2019-05-22 12:13:05 PM 12 36.453779 -82.846135 34.676706
2019-05-22 12:13:06 PM 13 36.999660 -82.846033 34.676587
2019-05-22 12:13:07 PM 14 37.807537 -82.845926 34.676465
2019-05-22 12:13:08 PM 15 38.624042 -82.845822 34.676346
2019-05-22 12:13:09 PM 16 39.395168 -82.845713 34.676223
2019-05-22 12:13:10 PM 17 40.233084 -82.845593 34.676086 1.993167 -82.843502 34.673802 1042.85
2019-05-22 12:13:11 PM 18 40.563521 -82.845475 34.675949 2.558569 -82.843506 34.673804 980.53508
2019-05-22 12:13:12 PM 19 40.283576 -82.845358 34.675813 2.138892 -82.843515 34.673812 915.66456
2019-05-22 12:13:13 PM 20 40.194043 -82.845249 34.675688 2.672842 -82.843525 34.673820 855.56336
2019-05-22 12:13:14 PM 21 40.525812 -82.845133 34.675553 2.338224 -82.843537 34.673830 790.2033
2019-05-22 12:13:15 PM 22 40.939710 -82.845017 34.675417 2.586718 -82.843548 34.673837 725.44617
2019-05-22 12:13:16 PM 23 41.445219 -82.844905 34.675288 1.916789 -82.843556 34.673843 664.40323
2019-05-22 12:13:17 PM 24 42.011979 -82.844785 34.675150 2.466772 -82.843567 34.673850 598.63888
2019-05-22 12:13:18 PM 25 42.385717 -82.844660 34.675010 2.746290 -82.843578 34.673858 531.27814
2019-05-22 12:13:19 PM 26 42.624757 -82.844536 34.674873 2.354602 -82.843589 34.673866 464.57321
2019-05-22 12:13:20 PM 27 42.685475 -82.844407 34.674733 2.517584 -82.843601 34.673873 396.08089
2019-05-22 12:13:21 PM 28 42.704330 -82.844286 34.674602 2.607064 -82.843611 34.673882 331.86949
2019-05-22 12:13:22 PM 29 42.443879 -82.844164 34.674472 2.727542 -82.843622 34.673890 267.48406
2019-05-22 12:13:23 PM 30 41.064289 -82.844031 34.674332 2.726530 -82.843631 34.673898 198.73434
2019-05-22 12:13:24 PM 31 37.873688 -82.843906 34.674207 2.650845 -82.843641 34.673905 135.79948
2019-05-22 12:13:25 PM 32 35.709977 -82.843795 34.674101 2.311460 -82.843650 34.673912 81.60568
2019-05-22 12:13:26 PM 33 34.793978 -82.843679 34.673994 2.321260 -82.843658 34.673919 28.199424
2019-05-22 12:13:27 PM 34 34.110096 -82.843565 34.673892 1.942675 -82.843668 34.673924 32.944961
2019-05-22 12:13:28 PM 35 33.775824 -82.843447 34.673791 0.800207 -82.843675 34.673926 84.263335
2019-05-22 12:13:29 PM 36 33.729486 -82.843332 34.673697 2.039398 -82.843672 34.673925 131.66532
2019-05-22 12:13:30 PM 37 33.593349 -82.843214 34.673606 2.164138 -82.843663 34.673918 176.43694
2019-05-22 12:13:31 PM 38 33.555373 -82.843095 34.673517 2.365148 -82.843656 34.673909 220.8364
2019-05-22 12:13:32 PM 39 33.998565 -82.842972 34.673429 2.379529 -82.843648 34.673901 266.09755
2019-05-22 12:13:33 PM 40 34.658480 -82.842839 34.673337 2.401792 -82.843640 34.673893 314.3462
2019-05-22 12:13:34 PM 41 35.113230 -82.842702 34.673247 2.362911 -82.843632 34.673885 363.17968
2019-05-22 12:13:35 PM 42 35.274135 -82.842568 34.673162 2.258997 -82.843624 34.673878 410.66329
2019-05-22 12:13:36 PM 43 35.060821 -82.842430 34.673081 2.390075 -82.843615 34.673871 457.73944
2019-05-22 12:13:37 PM 44 34.733899 -82.842344 34.673032 2.166535 -82.843610 34.673867 486.97018
Case B - Scenario 2 - Trial 2
Real Time Travel Time (sec)
Vehicle-Trial-2 Pedestrian-Trial-2 Distance vehicle - Ped.
(ft.) speed longitude latitude speed longitude latitude
2019-05-22 12:16:28 PM 0 7.523031 -82.847064 34.677670
2019-05-22 12:16:29 PM 1 9.777288 -82.847034 34.677664
2019-05-22 12:16:30 PM 2 13.167302 -82.846984 34.677641
2019-05-22 12:16:31 PM 3 16.465598 -82.846935 34.677596
2019-05-22 12:16:32 PM 4 19.382859 -82.846883 34.677539
2019-05-22 12:16:33 PM 5 21.958392 -82.846825 34.677473
2019-05-22 12:16:34 PM 6 24.789795 -82.846753 34.677392
2019-05-22 12:16:35 PM 7 27.348284 -82.846675 34.677307
2019-05-22 12:16:36 PM 8 29.581449 -82.846591 34.677215
2019-05-22 12:16:37 PM 9 31.416108 -82.846502 34.677115

Infrastructure and Policy Needs for Personal Electric Mobility Devices in a Connected Vehicle World, 2019
Center for Connected Multimodal Mobility (C2M2) Clemson University, Benedict College, The Citadel, South Carolina State University, University of South Carolina
Page 53
Real Time Travel Time (sec)
Vehicle-Trial-2 Pedestrian-Trial-2 Distance vehicle - Ped.
(ft.) speed longitude latitude speed longitude latitude
2019-05-22 12:16:38 PM 10 32.920012 -82.846406 34.677007
2019-05-22 12:16:39 PM 11 34.277178 -82.846309 34.676899
2019-05-22 12:16:40 PM 12 35.258955 -82.846213 34.676791
2019-05-22 12:16:41 PM 13 35.394773 -82.846112 34.676675
2019-05-22 12:16:42 PM 14 35.474346 -82.846012 34.676558
2019-05-22 12:16:43 PM 15 36.028483 -82.845909 34.676438 2.682163 -82.843380 34.673732 1244.8139
2019-05-22 12:16:44 PM 16 37.015319 -82.845802 34.676314 1.402599 -82.843383 34.673736 1187.7904
2019-05-22 12:16:45 PM 17 38.110278 -82.845706 34.676206 0.897037 -82.843387 34.673738 1137.648
2019-05-22 12:16:46 PM 18 39.318471 -82.845594 34.676079 0.827690 -82.843391 34.673735 1081.0235
2019-05-22 12:16:47 PM 19 40.498648 -82.845472 34.675942 0.723510 -82.843393 34.673734 1018.7065
2019-05-22 12:16:48 PM 20 41.636322 -82.845350 34.675804 1.647923 -82.843398 34.673738 954.35255
2019-05-22 12:16:49 PM 21 42.045054 -82.845230 34.675667 1.921956 -82.843408 34.673742 889.98671
2019-05-22 12:16:50 PM 22 42.261777 -82.845112 34.675532 2.017774 -82.843418 34.673748 825.79139
2019-05-22 12:16:51 PM 23 42.138049 -82.844997 34.675399 1.900332 -82.843427 34.673752 763.20323
2019-05-22 12:16:52 PM 24 41.410705 -82.844873 34.675253 1.570374 -82.843434 34.673755 696.35445
2019-05-22 12:16:53 PM 25 40.564160 -82.844758 34.675119 1.636206 -82.843439 34.673761 634.0645
2019-05-22 12:16:54 PM 26 40.717235 -82.844638 34.674982 1.794074 -82.843445 34.673767 569.73651
2019-05-22 12:16:55 PM 27 40.978485 -82.844522 34.674851 2.072101 -82.843451 34.673773 507.65212
2019-05-22 12:16:56 PM 28 41.020189 -82.844403 34.674720 1.923074 -82.843459 34.673780 444.93907
2019-05-22 12:16:57 PM 29 40.941894 -82.844282 34.674588 1.710027 -82.843465 34.673786 381.76975
2019-05-22 12:16:58 PM 30 40.765490 -82.844158 34.674453 1.630453 -82.843471 34.673791 317.63671
2019-05-22 12:16:59 PM 31 40.519154 -82.844038 34.674326 1.640041 -82.843479 34.673796 255.82616
2019-05-22 12:17:00 PM 32 39.390055 -82.843917 34.674203 1.659108 -82.843486 34.673801 195.33807
2019-05-22 12:17:01 PM 33 37.181816 -82.843795 34.674086 2.079132 -82.843495 34.673808 135.83627
2019-05-22 12:17:02 PM 34 34.437869 -82.843676 34.673979 2.083606 -82.843505 34.673815 78.822209
2019-05-22 12:17:03 PM 35 33.022594 -82.843564 34.673883 2.115456 -82.843514 34.673822 26.876597
2019-05-22 12:17:04 PM 36 32.850025 -82.843447 34.673787 1.963447 -82.843525 34.673828 27.764321
2019-05-22 12:17:05 PM 37 33.728368 -82.843332 34.673694 0.997329 -82.843538 34.673832 79.669959
2019-05-22 12:17:06 PM 38 34.415606 -82.843213 34.673600 1.711944 -82.843541 34.673832 129.48361
2019-05-22 12:17:07 PM 39 34.609266 -82.843089 34.673506 1.942835 -82.843539 34.673828 178.95917
2019-05-22 12:17:08 PM 40 34.616297 -82.842963 34.673413 1.918707 -82.843534 34.673823 227.39838
2019-05-22 12:17:09 PM 41 34.229935 -82.842834 34.673324 2.088399 -82.843531 34.673818 276.02894
2019-05-22 12:17:10 PM 42 33.801070 -82.842708 34.673239 2.128026 -82.843528 34.673813 322.92679
2019-05-22 12:17:11 PM 43 33.659021 -82.842626 34.673187 2.213512 -82.843525 34.673810 352.94273
Case B - Scenario 2 - Trial 3
Real Time Travel Time (sec)
Vehicle-Trial-3 Pedestrian-Trial-3 Distance vehicle - Ped.
(ft.) speed longitude latitude speed longitude latitude
2019-05-22 12:19:54 PM 0 7.464869 -82.847052 34.677660
2019-05-22 12:19:55 PM 1 10.754005 -82.847014 34.677651
2019-05-22 12:19:56 PM 2 14.047721 -82.846962 34.677622
2019-05-22 12:19:57 PM 3 17.369346 -82.846910 34.677572
2019-05-22 12:19:58 PM 4 20.239417 -82.846856 34.677509
2019-05-22 12:19:59 PM 5 22.733033 -82.846795 34.677437
2019-05-22 12:20:00 PM 6 25.022762 -82.846726 34.677355
2019-05-22 12:20:01 PM 7 26.983440 -82.846655 34.677274
2019-05-22 12:20:02 PM 8 28.931121 -82.846574 34.677183
2019-05-22 12:20:03 PM 9 30.836725 -82.846484 34.677082
2019-05-22 12:20:04 PM 10 32.113413 -82.846390 34.676977
2019-05-22 12:20:05 PM 11 33.196441 -82.846298 34.676873
2019-05-22 12:20:06 PM 12 34.406924 -82.846206 34.676768
2019-05-22 12:20:07 PM 13 35.803185 -82.846106 34.676654
2019-05-22 12:20:08 PM 14 37.007969 -82.845996 34.676528
2019-05-22 12:20:09 PM 15 37.896058 -82.845888 34.676405
2019-05-22 12:20:10 PM 16 37.812970 -82.845776 34.676278
2019-05-22 12:20:11 PM 17 37.189007 -82.845678 34.676166 2.666504 -82.843400 34.673693 1131.895
2019-05-22 12:20:12 PM 18 36.837957 -82.845576 34.676050 2.178838 -82.843411 34.673703 1074.6049
2019-05-22 12:20:13 PM 19 37.310284 -82.845466 34.675926 2.590446 -82.843417 34.673710 1015.7225
2019-05-22 12:20:14 PM 20 38.356880 -82.845351 34.675796 2.583735 -82.843427 34.673719 952.29095
2019-05-22 12:20:15 PM 21 39.085823 -82.845240 34.675669 2.398064 -82.843437 34.673729 890.75132
2019-05-22 12:20:16 PM 22 39.757242 -82.845125 34.675536 2.376014 -82.843447 34.673739 826.49983
2019-05-22 12:20:17 PM 23 40.319688 -82.845014 34.675405 2.054685 -82.843455 34.673746 765.06442
2019-05-22 12:20:18 PM 24 40.801921 -82.844898 34.675270 2.386240 -82.843465 34.673755 700.29273
2019-05-22 12:20:19 PM 25 41.151479 -82.844791 34.675146 2.355561 -82.843475 34.673763 640.71534
2019-05-22 12:20:20 PM 26 41.313555 -82.844670 34.675009 2.157107 -82.843483 34.673771 575.25024
2019-05-22 12:20:21 PM 27 41.398295 -82.844544 34.674869 2.203072 -82.843490 34.673778 508.66223
2019-05-22 12:20:22 PM 28 40.933265 -82.844425 34.674739 1.961210 -82.843495 34.673788 445.32482
2019-05-22 12:20:23 PM 29 40.139982 -82.844308 34.674612 2.180116 -82.843501 34.673797 383.51911
2019-05-22 12:20:24 PM 30 39.098286 -82.844190 34.674482 2.292605 -82.843509 34.673806 320.3705
2019-05-22 12:20:25 PM 31 37.884554 -82.844075 34.674360 2.169517 -82.843519 34.673814 259.93714

Infrastructure and Policy Needs for Personal Electric Mobility Devices in a Connected Vehicle World, 2019
Center for Connected Multimodal Mobility (C2M2) Clemson University, Benedict College, The Citadel, South Carolina State University, University of South Carolina
Page 54
Real Time Travel Time (sec)
Vehicle-Trial-3 Pedestrian-Trial-3 Distance vehicle - Ped.
(ft.) speed longitude latitude speed longitude latitude
2019-05-22 12:20:26 PM 32 36.418999 -82.843959 34.674241 2.170849 -82.843526 34.673822 200.38282
2019-05-22 12:20:27 PM 33 35.532508 -82.843848 34.674132 2.081901 -82.843534 34.673829 145.06832
2019-05-22 12:20:28 PM 34 34.914776 -82.843742 34.674034 2.293564 -82.843544 34.673837 93.052714
2019-05-22 12:20:29 PM 35 34.065995 -82.843621 34.673926 2.217506 -82.843553 34.673846 35.901277
2019-05-22 12:20:30 PM 36 33.427171 -82.843506 34.673829 2.047601 -82.843561 34.673853 18.513332
2019-05-22 12:20:31 PM 37 33.125869 -82.843393 34.673737 1.181775 -82.843568 34.673855 68.032664
2019-05-22 12:20:32 PM 38 32.643582 -82.843275 34.673643 1.031577 -82.843568 34.673854 116.81444
2019-05-22 12:20:33 PM 39 32.551333 -82.843166 34.673558 1.980704 -82.843564 34.673852 160.37946
2019-05-22 12:20:34 PM 40 33.227120 -82.843047 34.673470 2.139531 -82.843561 34.673845 206.30439
2019-05-22 12:20:35 PM 41 34.188071 -82.842915 34.673376 2.055057 -82.843559 34.673838 256.35594
2019-05-22 12:20:36 PM 42 35.017039 -82.842780 34.673285 2.030876 -82.843553 34.673831 305.8389
2019-05-22 12:20:37 PM 43 35.493733 -82.842647 34.673198 2.114711 -82.843548 34.673826 354.32987
2019-05-22 12:20:38 PM 44 35.500631 -82.842536 34.673130 2.031643 -82.843542 34.673819 393.00883
Case B - Scenario 3
Real Time Travel Time (sec)
Vehicle Pedestrian Distance vehicle - Ped. (ft.)
hoverboard Distance vehicle - Hov. (ft.)
speed longitude latitude speed longitude latitude speed longitude latitude
2019-05-22 01:14:14 PM 0 10.540744 -82.845578 34.675896 0.041385 -82.843464 34.673739 1010.5035 0.182875 -82.8434 34.67376 1009.332
2019-05-22 01:14:15 PM 1 13.386954 -82.845547 34.675870 0.066151 -82.843465 34.673741 996.8697 0.401701 -82.8434 34.67376 996.1294
2019-05-22 01:14:16 PM 2 17.206365 -82.845489 34.675828 0.068388 -82.843465 34.673742 973.56746 0.113767 -82.8434 34.67376 973.454
2019-05-22 01:14:17 PM 3 20.520321 -82.845411 34.675771 0.062263 -82.843466 34.673744 942.02177 0.632751 -82.8434 34.67376 943.0942
2019-05-22 01:14:18 PM 4 23.219314 -82.845340 34.675715 0.074460 -82.843467 34.673744 912.56859 0.815546 -82.8434 34.67375 915.0345
2019-05-22 01:14:19 PM 5 26.213805 -82.845257 34.675642 0.321010 -82.843467 34.673744 876.28386 1.124252 -82.8434 34.67375 880.1643
2019-05-22 01:14:20 PM 6 29.260919 -82.845165 34.675550 1.116902 -82.843463 34.673743 834.05943 1.630134 -82.8434 34.67375 838.8426
2019-05-22 01:14:21 PM 7 31.898129 -82.845079 34.675457 1.500281 -82.843457 34.673739 793.54566 2.043979 -82.8434 34.67374 799.4491
2019-05-22 01:14:22 PM 8 34.567083 -82.844981 34.675349 1.401640 -82.843452 34.673735 746.51898 2.478596 -82.8434 34.67374 753.2071
2019-05-22 01:14:23 PM 9 36.633112 -82.844878 34.675232 1.735912 -82.843447 34.673731 695.96197 2.556252 -82.8434 34.67373 704.168
2019-05-22 01:14:24 PM 10 38.597837 -82.844770 34.675108 1.726325 -82.843443 34.673727 642.34376 2.509275 -82.8434 34.67372 652.3332
2019-05-22 01:14:25 PM 11 40.283896 -82.844656 34.674979 1.931650 -82.843438 34.673723 586.34305 2.90778 -82.8434 34.67371 598.4489
2019-05-22 01:14:26 PM 12 41.620344 -82.844527 34.674835 1.740066 -82.843434 34.673718 523.07482 3.154543 -82.8434 34.67371 537.1506
2019-05-22 01:14:27 PM 13 42.375811 -82.844404 34.674699 1.710559 -82.843429 34.673714 463.38015 3.282957 -82.8434 34.6737 480.1772
2019-05-22 01:14:28 PM 14 42.959721 -82.844285 34.674569 1.784806 -82.843423 34.673709 406.49292 3.346552 -82.8434 34.67369 425.7344
2019-05-22 01:14:29 PM 15 43.247601 -82.844165 34.674440 1.633756 -82.843419 34.673705 349.02462 3.307564 -82.8433 34.67368 371.1901
2019-05-22 01:14:30 PM 16 43.060972 -82.844027 34.674295 1.946190 -82.843412 34.673699 285.16821 3.060536 -82.8433 34.67367 308.9959
2019-05-22 01:14:31 PM 17 42.149927 -82.843899 34.674166 1.793115 -82.843404 34.673694 227.38964 2.956036 -82.8433 34.67367 252.6652
2019-05-22 01:14:32 PM 18 40.457423 -82.843771 34.674045 1.862675 -82.843397 34.673690 171.20517 2.954757 -82.8433 34.67366 197.9856
2019-05-22 01:14:33 PM 19 36.059162 -82.843642 34.673929 1.565261 -82.843391 34.673686 116.17321 2.857288 -82.8433 34.67365 144.9365
2019-05-22 01:14:34 PM 20 31.835386 -82.843518 34.673825 1.913274 -82.843385 34.673683 65.633236 3.020323 -82.8433 34.67364 95.86928
2019-05-22 01:14:35 PM 21 29.629811 -82.843417 34.673744 1.929892 -82.843377 34.673678 27.147749 3.22895 -82.8433 34.67364 57.96811
2019-05-22 01:14:36 PM 22 28.290380 -82.843320 34.673670 1.911889 -82.843370 34.673672 15.111793 3.189962 -82.8433 34.67363 23.16196
2019-05-22 01:14:37 PM 23 26.562777 -82.843212 34.673587 1.740066 -82.843363 34.673666 53.688184 3.223837 -82.8433 34.67362 16.63948
2019-05-22 01:14:38 PM 24 25.874261 -82.843125 34.673518 1.332613 -82.843357 34.673661 86.985915 3.138884 -82.8432 34.67361 48.68468
2019-05-22 01:14:39 PM 25 26.258865 -82.843034 34.673450 1.039459 -82.843353 34.673658 122.10997 3.168231 -82.8432 34.6736 80.81487
2019-05-22 01:14:40 PM 26 27.288524 -82.842926 34.673374 0.666626 -82.843350 34.673656 163.74011 3.162798 -82.8432 34.67359 118.7186
2019-05-22 01:14:41 PM 27 28.283882 -82.842827 34.673305 0.760900 -82.843346 34.673654 201.18753 2.964984 -82.8432 34.67358 152.6982
2019-05-22 01:14:42 PM 28 29.196685 -82.842721 34.673235 1.172508 -82.843342 34.673651 240.41238 2.992786 -82.8432 34.67358 189.1531
2019-05-22 01:14:43 PM 29 30.085093 -82.842599 34.673157 1.545394 -82.843336 34.673647 284.46075 2.835238 -82.8432 34.67357 230.7993
2019-05-22 01:14:44 PM 30 30.639816 -82.842482 34.673086 1.694368 -82.843330 34.673642 325.43378 2.449888 -82.8432 34.67356 270.5832
2019-05-22 01:14:45 PM 31 30.256703 -82.842363 34.673019 1.891384 -82.843323 34.673636 365.54506 1.358179 -82.8432 34.67356 310.8827
2019-05-22 01:14:46 PM 32 29.674444 -82.842230 34.672948 1.532025 -82.843316 34.673632 410.50403 0.676213 -82.8432 34.67355 357.4459
2019-05-22 01:14:47 PM 33 29.123130 -82.842118 34.672891 2.050370 -82.843308 34.673627 446.69949 0.190145 -82.8432 34.67355 396.8122
2019-05-22 01:14:48 PM 34 28.004364 -82.841995 34.672830 2.120676 -82.843300 34.673622 486.48415 0.609583 -82.8432 34.67355 440.1169
2019-05-22 01:14:49 PM 35 26.087574 -82.841881 34.672775 1.783848 -82.843294 34.673616 523.1401 0.906305 -82.8432 34.67355 479.1185
2019-05-22 01:14:50 PM 36 2.384642 -82.843290 34.673613 1.377992 -82.8432 34.67355
Case B - Scenario 4
Real Time Travel Time (sec)
Vehicle Pedestrian Distance vehicle - Ped. (ft.)
hoverboard Distance vehicle - Hov. (ft.)
speed longitude latitude speed longitude latitude speed longitude latitude
2019-05-22 01:02:15 PM 0 14.381673 -82.846983 34.677627
2019-05-22 01:02:16 PM 1 16.709751 -82.846947 34.677595
2019-05-22 01:02:17 PM 2 20.044159 -82.846890 34.677533
2019-05-22 01:02:18 PM 3 23.121632 -82.846823 34.677455
2019-05-22 01:02:19 PM 4 25.628670 -82.846753 34.677374
2019-05-22 01:02:20 PM 5 27.965483 -82.846678 34.677291
2019-05-22 01:02:21 PM 6 30.155080 -82.846596 34.677199
2019-05-22 01:02:22 PM 7 32.174771 -82.846501 34.677095
2019-05-22 01:02:23 PM 8 33.880324 -82.846398 34.676981
2019-05-22 01:02:24 PM 9 35.053790 -82.846304 34.676874
2019-05-22 01:02:25 PM 10 35.910881 -82.846209 34.676765

Infrastructure and Policy Needs for Personal Electric Mobility Devices in a Connected Vehicle World, 2019
Center for Connected Multimodal Mobility (C2M2) Clemson University, Benedict College, The Citadel, South Carolina State University, University of South Carolina
Page 55
Real Time Travel Time (sec)
Vehicle Pedestrian Distance vehicle - Ped. (ft.)
hoverboard Distance vehicle - Hov. (ft.)
speed longitude latitude speed longitude latitude speed longitude latitude
2019-05-22 01:02:26 PM 11 36.966105 -82.846099 34.676639
2019-05-22 01:02:27 PM 12 38.110491 -82.845987 34.676513
2019-05-22 01:02:28 PM 13 38.852962 -82.845882 34.676394
2019-05-22 01:02:29 PM 14 38.373178 -82.845775 34.676272 1.772263 -82.8432 34.67354 1254.915
2019-05-22 01:02:30 PM 15 37.954220 -82.845666 34.676147 1.712583 -82.8432 34.67355 1196.987
2019-05-22 01:02:31 PM 16 37.946231 -82.845548 34.676013 1.738149 -82.843175 34.673526 1153.3299 1.690213 -82.8432 34.67355 1134.23
2019-05-22 01:02:32 PM 17 38.062555 -82.845442 34.675892 1.837323 -82.843179 34.673529 1097.179 1.928614 -82.8432 34.67356 1077.216
2019-05-22 01:02:33 PM 18 38.243432 -82.845340 34.675774 2.097859 -82.843187 34.673534 1041.7462 2.124404 -82.8433 34.67356 1022.045
2019-05-22 01:02:34 PM 19 38.222021 -82.845228 34.675645 2.120676 -82.843194 34.673540 980.89016 1.93117 -82.8433 34.67357 961.8021
2019-05-22 01:02:35 PM 20 38.220636 -82.845120 34.675520 2.044618 -82.843201 34.673545 922.17197 2.027681 -82.8433 34.67357 902.8858
2019-05-22 01:02:36 PM 21 38.416640 -82.845014 34.675398 1.895059 -82.843209 34.673551 864.64338 2.163818 -82.8433 34.67358 845.4454
2019-05-22 01:02:37 PM 22 38.932748 -82.844894 34.675260 1.915319 -82.843214 34.673555 800.68226 2.241794 -82.8433 34.67358 780.5551
2019-05-22 01:02:38 PM 23 39.054185 -82.844780 34.675129 2.226454 -82.843222 34.673561 738.74575 2.311567 -82.8433 34.67359 718.7212
2019-05-22 01:02:39 PM 24 39.136688 -82.844678 34.675012 1.916150 -82.843228 34.673567 683.56052 2.205043 -82.8433 34.67359 663.3003
2019-05-22 01:02:40 PM 25 39.433836 -82.844564 34.674885 2.028000 -82.843234 34.673573 622.97445 2.292925 -82.8433 34.6736 602.2907
2019-05-22 01:02:41 PM 26 39.481452 -82.844449 34.674757 2.124032 -82.843240 34.673579 562.40927 2.368663 -82.8433 34.6736 540.981
2019-05-22 01:02:42 PM 27 39.578868 -82.844332 34.674630 2.110769 -82.843247 34.673585 501.45168 2.083606 -82.8433 34.67361 479.9283
2019-05-22 01:02:43 PM 28 39.462597 -82.844216 34.674503 2.015857 -82.843254 34.673590 440.79797 2.232899 -82.8433 34.67362 418.964
2019-05-22 01:02:44 PM 29 39.181055 -82.844090 34.674367 1.895698 -82.843260 34.673595 375.73054 2.603548 -82.8433 34.67362 352.8568
2019-05-22 01:02:45 PM 30 38.804493 -82.843982 34.674254 1.905924 -82.843267 34.673600 320.81639 2.767489 -82.8433 34.67363 296.3544
2019-05-22 01:02:46 PM 31 38.022289 -82.843866 34.674138 2.083606 -82.843273 34.673604 263.70909 2.770045 -82.8434 34.67364 237.565
2019-05-22 01:02:47 PM 32 36.005154 -82.843745 34.674021 1.777137 -82.843279 34.673609 205.24741 2.461446 -82.8434 34.67365 177.9385
2019-05-22 01:02:48 PM 33 32.295889 -82.843624 34.673914 2.014259 -82.843286 34.673613 149.11522 2.666184 -82.8434 34.67365 121.0179
2019-05-22 01:02:49 PM 34 30.121578 -82.843523 34.673830 2.033060 -82.843292 34.673618 103.77432 2.468157 -82.8434 34.67366 74.90648
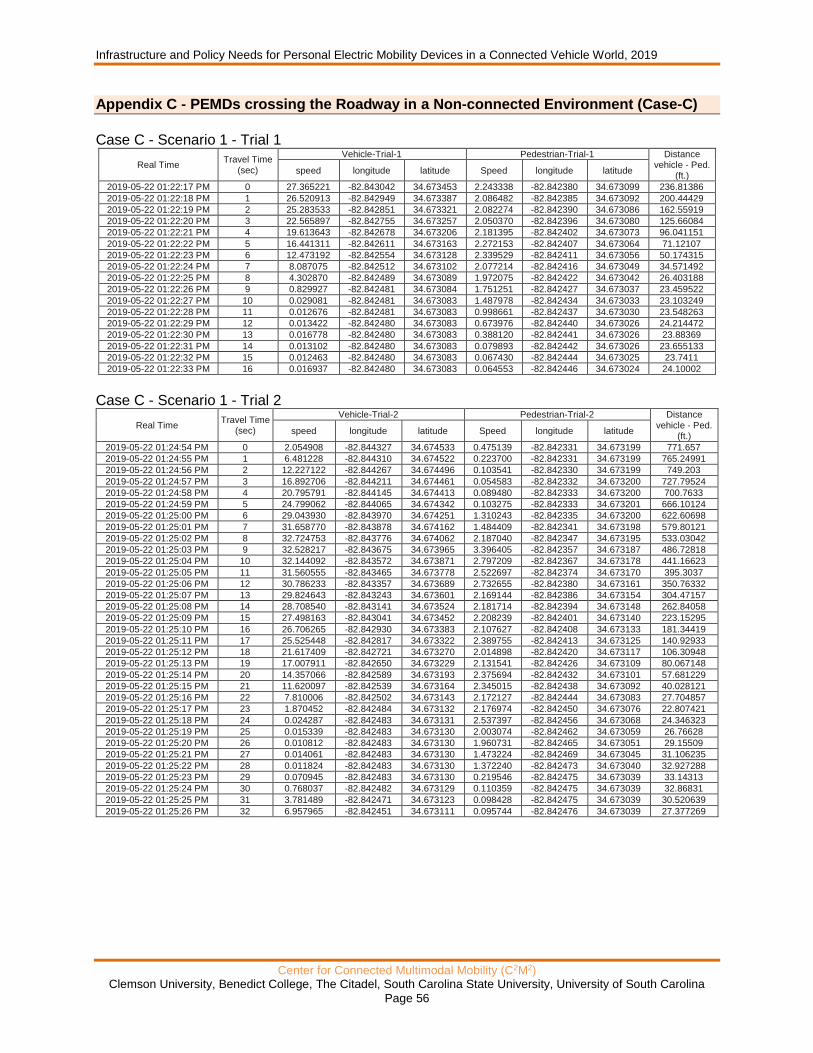
Infrastructure and Policy Needs for Personal Electric Mobility Devices in a Connected Vehicle World, 2019
Center for Connected Multimodal Mobility (C2M2) Clemson University, Benedict College, The Citadel, South Carolina State University, University of South Carolina
Page 56
Appendix C - PEMDs crossing the Roadway in a Non-connected Environment (Case-C)
Case C - Scenario 1 - Trial 1
Real Time Travel Time
(sec)
Vehicle-Trial-1 Pedestrian-Trial-1 Distance vehicle - Ped.
(ft.) speed longitude latitude Speed longitude latitude
2019-05-22 01:22:17 PM 0 27.365221 -82.843042 34.673453 2.243338 -82.842380 34.673099 236.81386
2019-05-22 01:22:18 PM 1 26.520913 -82.842949 34.673387 2.086482 -82.842385 34.673092 200.44429
2019-05-22 01:22:19 PM 2 25.283533 -82.842851 34.673321 2.082274 -82.842390 34.673086 162.55919
2019-05-22 01:22:20 PM 3 22.565897 -82.842755 34.673257 2.050370 -82.842396 34.673080 125.66084
2019-05-22 01:22:21 PM 4 19.613643 -82.842678 34.673206 2.181395 -82.842402 34.673073 96.041151
2019-05-22 01:22:22 PM 5 16.441311 -82.842611 34.673163 2.272153 -82.842407 34.673064 71.12107
2019-05-22 01:22:23 PM 6 12.473192 -82.842554 34.673128 2.339529 -82.842411 34.673056 50.174315
2019-05-22 01:22:24 PM 7 8.087075 -82.842512 34.673102 2.077214 -82.842416 34.673049 34.571492
2019-05-22 01:22:25 PM 8 4.302870 -82.842489 34.673089 1.972075 -82.842422 34.673042 26.403188
2019-05-22 01:22:26 PM 9 0.829927 -82.842481 34.673084 1.751251 -82.842427 34.673037 23.459522
2019-05-22 01:22:27 PM 10 0.029081 -82.842481 34.673083 1.487978 -82.842434 34.673033 23.103249
2019-05-22 01:22:28 PM 11 0.012676 -82.842481 34.673083 0.998661 -82.842437 34.673030 23.548263
2019-05-22 01:22:29 PM 12 0.013422 -82.842480 34.673083 0.673976 -82.842440 34.673026 24.214472
2019-05-22 01:22:30 PM 13 0.016778 -82.842480 34.673083 0.388120 -82.842441 34.673026 23.88369
2019-05-22 01:22:31 PM 14 0.013102 -82.842480 34.673083 0.079893 -82.842442 34.673026 23.655133
2019-05-22 01:22:32 PM 15 0.012463 -82.842480 34.673083 0.067430 -82.842444 34.673025 23.7411
2019-05-22 01:22:33 PM 16 0.016937 -82.842480 34.673083 0.064553 -82.842446 34.673024 24.10002
Case C - Scenario 1 - Trial 2
Real Time Travel Time
(sec)
Vehicle-Trial-2 Pedestrian-Trial-2 Distance vehicle - Ped.
(ft.) speed longitude latitude Speed longitude latitude
2019-05-22 01:24:54 PM 0 2.054908 -82.844327 34.674533 0.475139 -82.842331 34.673199 771.657
2019-05-22 01:24:55 PM 1 6.481228 -82.844310 34.674522 0.223700 -82.842331 34.673199 765.24991
2019-05-22 01:24:56 PM 2 12.227122 -82.844267 34.674496 0.103541 -82.842330 34.673199 749.203
2019-05-22 01:24:57 PM 3 16.892706 -82.844211 34.674461 0.054583 -82.842332 34.673200 727.79524
2019-05-22 01:24:58 PM 4 20.795791 -82.844145 34.674413 0.089480 -82.842333 34.673200 700.7633
2019-05-22 01:24:59 PM 5 24.799062 -82.844065 34.674342 0.103275 -82.842333 34.673201 666.10124
2019-05-22 01:25:00 PM 6 29.043930 -82.843970 34.674251 1.310243 -82.842335 34.673200 622.60698
2019-05-22 01:25:01 PM 7 31.658770 -82.843878 34.674162 1.484409 -82.842341 34.673198 579.80121
2019-05-22 01:25:02 PM 8 32.724753 -82.843776 34.674062 2.187040 -82.842347 34.673195 533.03042
2019-05-22 01:25:03 PM 9 32.528217 -82.843675 34.673965 3.396405 -82.842357 34.673187 486.72818
2019-05-22 01:25:04 PM 10 32.144092 -82.843572 34.673871 2.797209 -82.842367 34.673178 441.16623
2019-05-22 01:25:05 PM 11 31.560555 -82.843465 34.673778 2.522697 -82.842374 34.673170 395.3037
2019-05-22 01:25:06 PM 12 30.786233 -82.843357 34.673689 2.732655 -82.842380 34.673161 350.76332
2019-05-22 01:25:07 PM 13 29.824643 -82.843243 34.673601 2.169144 -82.842386 34.673154 304.47157
2019-05-22 01:25:08 PM 14 28.708540 -82.843141 34.673524 2.181714 -82.842394 34.673148 262.84058
2019-05-22 01:25:09 PM 15 27.498163 -82.843041 34.673452 2.208239 -82.842401 34.673140 223.15295
2019-05-22 01:25:10 PM 16 26.706265 -82.842930 34.673383 2.107627 -82.842408 34.673133 181.34419
2019-05-22 01:25:11 PM 17 25.525448 -82.842817 34.673322 2.389755 -82.842413 34.673125 140.92933
2019-05-22 01:25:12 PM 18 21.617409 -82.842721 34.673270 2.014898 -82.842420 34.673117 106.30948
2019-05-22 01:25:13 PM 19 17.007911 -82.842650 34.673229 2.131541 -82.842426 34.673109 80.067148
2019-05-22 01:25:14 PM 20 14.357066 -82.842589 34.673193 2.375694 -82.842432 34.673101 57.681229
2019-05-22 01:25:15 PM 21 11.620097 -82.842539 34.673164 2.345015 -82.842438 34.673092 40.028121
2019-05-22 01:25:16 PM 22 7.810006 -82.842502 34.673143 2.172127 -82.842444 34.673083 27.704857
2019-05-22 01:25:17 PM 23 1.870452 -82.842484 34.673132 2.176974 -82.842450 34.673076 22.807421
2019-05-22 01:25:18 PM 24 0.024287 -82.842483 34.673131 2.537397 -82.842456 34.673068 24.346323
2019-05-22 01:25:19 PM 25 0.015339 -82.842483 34.673130 2.003074 -82.842462 34.673059 26.76628
2019-05-22 01:25:20 PM 26 0.010812 -82.842483 34.673130 1.960731 -82.842465 34.673051 29.15509
2019-05-22 01:25:21 PM 27 0.014061 -82.842483 34.673130 1.473224 -82.842469 34.673045 31.106235
2019-05-22 01:25:22 PM 28 0.011824 -82.842483 34.673130 1.372240 -82.842473 34.673040 32.927288
2019-05-22 01:25:23 PM 29 0.070945 -82.842483 34.673130 0.219546 -82.842475 34.673039 33.14313
2019-05-22 01:25:24 PM 30 0.768037 -82.842482 34.673129 0.110359 -82.842475 34.673039 32.86831
2019-05-22 01:25:25 PM 31 3.781489 -82.842471 34.673123 0.098428 -82.842475 34.673039 30.520639
2019-05-22 01:25:26 PM 32 6.957965 -82.842451 34.673111 0.095744 -82.842476 34.673039 27.377269
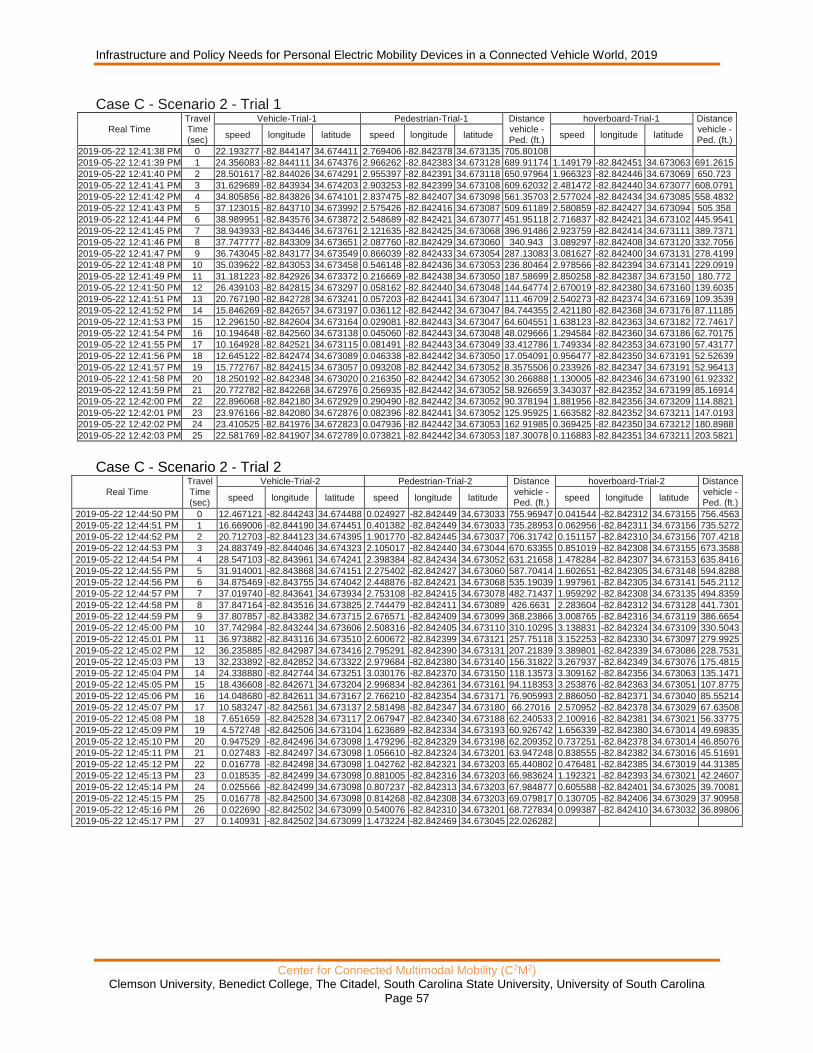
Infrastructure and Policy Needs for Personal Electric Mobility Devices in a Connected Vehicle World, 2019
Center for Connected Multimodal Mobility (C2M2) Clemson University, Benedict College, The Citadel, South Carolina State University, University of South Carolina
Page 57
Case C - Scenario 2 - Trial 1
Real Time Travel Time (sec)
Vehicle-Trial-1 Pedestrian-Trial-1 Distance vehicle - Ped. (ft.)
hoverboard-Trial-1 Distance vehicle - Ped. (ft.)
speed longitude latitude speed longitude latitude speed longitude latitude
2019-05-22 12:41:38 PM 0 22.193277 -82.844147 34.674411 2.769406 -82.842378 34.673135 705.80108
2019-05-22 12:41:39 PM 1 24.356083 -82.844111 34.674376 2.966262 -82.842383 34.673128 689.91174 1.149179 -82.842451 34.673063 691.2615
2019-05-22 12:41:40 PM 2 28.501617 -82.844026 34.674291 2.955397 -82.842391 34.673118 650.97964 1.966323 -82.842446 34.673069 650.723
2019-05-22 12:41:41 PM 3 31.629689 -82.843934 34.674203 2.903253 -82.842399 34.673108 609.62032 2.481472 -82.842440 34.673077 608.0791
2019-05-22 12:41:42 PM 4 34.805856 -82.843826 34.674101 2.837475 -82.842407 34.673098 561.35703 2.577024 -82.842434 34.673085 558.4832
2019-05-22 12:41:43 PM 5 37.123015 -82.843710 34.673992 2.575426 -82.842416 34.673087 509.61189 2.580859 -82.842427 34.673094 505.358
2019-05-22 12:41:44 PM 6 38.989951 -82.843576 34.673872 2.548689 -82.842421 34.673077 451.95118 2.716837 -82.842421 34.673102 445.9541
2019-05-22 12:41:45 PM 7 38.943933 -82.843446 34.673761 2.121635 -82.842425 34.673068 396.91486 2.923759 -82.842414 34.673111 389.7371
2019-05-22 12:41:46 PM 8 37.747777 -82.843309 34.673651 2.087760 -82.842429 34.673060 340.943 3.089297 -82.842408 34.673120 332.7056
2019-05-22 12:41:47 PM 9 36.743045 -82.843177 34.673549 0.866039 -82.842433 34.673054 287.13083 3.081627 -82.842400 34.673131 278.4199
2019-05-22 12:41:48 PM 10 35.039622 -82.843053 34.673458 0.546148 -82.842436 34.673053 236.80464 2.978566 -82.842394 34.673141 229.0919
2019-05-22 12:41:49 PM 11 31.181223 -82.842926 34.673372 0.216669 -82.842438 34.673050 187.58699 2.850258 -82.842387 34.673150 180.772
2019-05-22 12:41:50 PM 12 26.439103 -82.842815 34.673297 0.058162 -82.842440 34.673048 144.64774 2.670019 -82.842380 34.673160 139.6035
2019-05-22 12:41:51 PM 13 20.767190 -82.842728 34.673241 0.057203 -82.842441 34.673047 111.46709 2.540273 -82.842374 34.673169 109.3539
2019-05-22 12:41:52 PM 14 15.846269 -82.842657 34.673197 0.036112 -82.842442 34.673047 84.744355 2.421180 -82.842368 34.673176 87.11185
2019-05-22 12:41:53 PM 15 12.296150 -82.842604 34.673164 0.029081 -82.842443 34.673047 64.604551 1.638123 -82.842363 34.673182 72.74617
2019-05-22 12:41:54 PM 16 10.194648 -82.842560 34.673138 0.045060 -82.842443 34.673048 48.029666 1.294584 -82.842360 34.673186 62.70175
2019-05-22 12:41:55 PM 17 10.164928 -82.842521 34.673115 0.081491 -82.842443 34.673049 33.412786 1.749334 -82.842353 34.673190 57.43177
2019-05-22 12:41:56 PM 18 12.645122 -82.842474 34.673089 0.046338 -82.842442 34.673050 17.054091 0.956477 -82.842350 34.673191 52.52639
2019-05-22 12:41:57 PM 19 15.772767 -82.842415 34.673057 0.093208 -82.842442 34.673052 8.3575506 0.233926 -82.842347 34.673191 52.96413
2019-05-22 12:41:58 PM 20 18.250192 -82.842348 34.673020 0.216350 -82.842442 34.673052 30.266888 1.130005 -82.842346 34.673190 61.92332
2019-05-22 12:41:59 PM 21 20.772782 -82.842268 34.672976 0.256935 -82.842442 34.673052 58.926659 3.343037 -82.842352 34.673199 85.16914
2019-05-22 12:42:00 PM 22 22.896068 -82.842180 34.672929 0.290490 -82.842442 34.673052 90.378194 1.881956 -82.842356 34.673209 114.8821
2019-05-22 12:42:01 PM 23 23.976166 -82.842080 34.672876 0.082396 -82.842441 34.673052 125.95925 1.663582 -82.842352 34.673211 147.0193
2019-05-22 12:42:02 PM 24 23.410525 -82.841976 34.672823 0.047936 -82.842442 34.673053 162.91985 0.369425 -82.842350 34.673212 180.8988
2019-05-22 12:42:03 PM 25 22.581769 -82.841907 34.672789 0.073821 -82.842442 34.673053 187.30078 0.116883 -82.842351 34.673211 203.5821
Case C - Scenario 2 - Trial 2
Real Time Travel Time (sec)
Vehicle-Trial-2 Pedestrian-Trial-2 Distance vehicle - Ped. (ft.)
hoverboard-Trial-2 Distance vehicle - Ped. (ft.)
speed longitude latitude speed longitude latitude speed longitude latitude
2019-05-22 12:44:50 PM 0 12.467121 -82.844243 34.674488 0.024927 -82.842449 34.673033 755.96947 0.041544 -82.842312 34.673155 756.4563
2019-05-22 12:44:51 PM 1 16.669006 -82.844190 34.674451 0.401382 -82.842449 34.673033 735.28953 0.062956 -82.842311 34.673156 735.5272
2019-05-22 12:44:52 PM 2 20.712703 -82.844123 34.674395 1.901770 -82.842445 34.673037 706.31742 0.151157 -82.842310 34.673156 707.4218
2019-05-22 12:44:53 PM 3 24.883749 -82.844046 34.674323 2.105017 -82.842440 34.673044 670.63355 0.851019 -82.842308 34.673155 673.3588
2019-05-22 12:44:54 PM 4 28.547103 -82.843961 34.674241 2.398384 -82.842434 34.673052 631.21658 1.478284 -82.842307 34.673153 635.8416
2019-05-22 12:44:55 PM 5 31.914001 -82.843868 34.674151 2.275402 -82.842427 34.673060 587.70414 1.602651 -82.842305 34.673148 594.8288
2019-05-22 12:44:56 PM 6 34.875469 -82.843755 34.674042 2.448876 -82.842421 34.673068 535.19039 1.997961 -82.842305 34.673141 545.2112
2019-05-22 12:44:57 PM 7 37.019740 -82.843641 34.673934 2.753108 -82.842415 34.673078 482.71437 1.959292 -82.842308 34.673135 494.8359
2019-05-22 12:44:58 PM 8 37.847164 -82.843516 34.673825 2.744479 -82.842411 34.673089 426.6631 2.283604 -82.842312 34.673128 441.7301
2019-05-22 12:44:59 PM 9 37.807857 -82.843382 34.673715 2.676571 -82.842409 34.673099 368.23866 3.008765 -82.842316 34.673119 386.6654
2019-05-22 12:45:00 PM 10 37.742984 -82.843244 34.673606 2.508316 -82.842405 34.673110 310.10295 3.138831 -82.842324 34.673109 330.5043
2019-05-22 12:45:01 PM 11 36.973882 -82.843116 34.673510 2.600672 -82.842399 34.673121 257.75118 3.152253 -82.842330 34.673097 279.9925
2019-05-22 12:45:02 PM 12 36.235885 -82.842987 34.673416 2.795291 -82.842390 34.673131 207.21839 3.389801 -82.842339 34.673086 228.7531
2019-05-22 12:45:03 PM 13 32.233892 -82.842852 34.673322 2.979684 -82.842380 34.673140 156.31822 3.267937 -82.842349 34.673076 175.4815
2019-05-22 12:45:04 PM 14 24.338880 -82.842744 34.673251 3.030176 -82.842370 34.673150 118.13573 3.309162 -82.842356 34.673063 135.1471
2019-05-22 12:45:05 PM 15 18.436608 -82.842671 34.673204 2.996834 -82.842361 34.673161 94.118353 3.253876 -82.842363 34.673051 107.8775
2019-05-22 12:45:06 PM 16 14.048680 -82.842611 34.673167 2.766210 -82.842354 34.673171 76.905993 2.886050 -82.842371 34.673040 85.55214
2019-05-22 12:45:07 PM 17 10.583247 -82.842561 34.673137 2.581498 -82.842347 34.673180 66.27016 2.570952 -82.842378 34.673029 67.63508
2019-05-22 12:45:08 PM 18 7.651659 -82.842528 34.673117 2.067947 -82.842340 34.673188 62.240533 2.100916 -82.842381 34.673021 56.33775
2019-05-22 12:45:09 PM 19 4.572748 -82.842506 34.673104 1.623689 -82.842334 34.673193 60.926742 1.656339 -82.842380 34.673014 49.69835
2019-05-22 12:45:10 PM 20 0.947529 -82.842496 34.673098 1.479296 -82.842329 34.673198 62.209352 0.737251 -82.842378 34.673014 46.85076
2019-05-22 12:45:11 PM 21 0.027483 -82.842497 34.673098 1.056610 -82.842324 34.673201 63.947248 0.838555 -82.842382 34.673016 45.51691
2019-05-22 12:45:12 PM 22 0.016778 -82.842498 34.673098 1.042762 -82.842321 34.673203 65.440802 0.476481 -82.842385 34.673019 44.31385
2019-05-22 12:45:13 PM 23 0.018535 -82.842499 34.673098 0.881005 -82.842316 34.673203 66.983624 1.192321 -82.842393 34.673021 42.24607
2019-05-22 12:45:14 PM 24 0.025566 -82.842499 34.673098 0.807237 -82.842313 34.673203 67.984877 0.605588 -82.842401 34.673025 39.70081
2019-05-22 12:45:15 PM 25 0.016778 -82.842500 34.673098 0.814268 -82.842308 34.673203 69.079817 0.130705 -82.842406 34.673029 37.90958
2019-05-22 12:45:16 PM 26 0.022690 -82.842502 34.673099 0.540076 -82.842310 34.673201 68.727834 0.099387 -82.842410 34.673032 36.89806
2019-05-22 12:45:17 PM 27 0.140931 -82.842502 34.673099 1.473224 -82.842469 34.673045 22.026282

Infrastructure and Policy Needs for Personal Electric Mobility Devices in a Connected Vehicle World, 2019
Center for Connected Multimodal Mobility (C2M2) Clemson University, Benedict College, The Citadel, South Carolina State University, University of South Carolina
Page 58
Appendix D - PEMDs crossing the Roadway in a Connected Environment (Case-D)
Case D - Scenario 1 - Trial 1
Real Time Travel Time (sec)
Vehicle-Trial-1 Pedestrian-Trial-1 Distance vehicle - Ped. (ft.)
speed longitude latitude speed longitude latitude
2019-05-22 01:19:05 PM 0 29.446750 -82.843941 34.674236 2.277266 -82.842345 34.673128 626.57667
2019-05-22 01:19:06 PM 1 31.114753 -82.843874 34.674169 2.336706 -82.842349 34.673122 595.79406
2019-05-22 01:19:07 PM 2 32.753036 -82.843772 34.674071 2.313378 -82.842355 34.673115 549.83476
2019-05-22 01:19:08 PM 3 34.654006 -82.843667 34.673970 2.220223 -82.842360 34.673107 502.93827
2019-05-22 01:19:09 PM 4 36.271091 -82.843551 34.673864 2.030557 -82.842364 34.673099 452.49189
2019-05-22 01:19:10 PM 5 37.593424 -82.843425 34.673756 2.400301 -82.842369 34.673091 399.14511
2019-05-22 01:19:11 PM 6 37.302614 -82.843292 34.673646 2.304749 -82.842373 34.673083 343.74163
2019-05-22 01:19:12 PM 7 36.148322 -82.843150 34.673536 2.243391 -82.842378 34.673075 286.404
2019-05-22 01:19:13 PM 8 34.708919 -82.843028 34.673446 2.153113 -82.842382 34.673068 238.02946
2019-05-22 01:19:14 PM 9 30.662559 -82.842915 34.673367 2.066988 -82.842388 34.673060 193.87396
2019-05-22 01:19:15 PM 10 25.519057 -82.842808 34.673294 2.257453 -82.842393 34.673052 152.75442
2019-05-22 01:19:16 PM 11 20.050231 -82.842723 34.673238 2.088399 -82.842397 34.673044 120.85743
2019-05-22 01:19:17 PM 12 15.484194 -82.842658 34.673196 2.427891 -82.842402 34.673036 96.335651
2019-05-22 01:19:18 PM 13 12.309252 -82.842602 34.673160 2.376972 -82.842407 34.673028 75.636603
2019-05-22 01:19:19 PM 14 10.294301 -82.842561 34.673134 2.267200 -82.842413 34.673020 61.001533
2019-05-22 01:19:20 PM 15 8.906456 -82.842526 34.673113 1.809413 -82.842418 34.673014 48.6468
2019-05-22 01:19:21 PM 16 4.722946 -82.842499 34.673096 1.865019 -82.842425 34.673008 39.257266
2019-05-22 01:19:22 PM 17 0.259812 -82.842493 34.673092 1.353385 -82.842428 34.673002 38.271235
2019-05-22 01:19:23 PM 18 0.017257 -82.842493 34.673092 0.978315 -82.842429 34.672997 39.609069
2019-05-22 01:19:24 PM 19 0.016032 -82.842493 34.673092 0.805959 -82.842431 34.672994 40.464414
2019-05-22 01:19:25 PM 20 0.017257 -82.842493 34.673092 0.539437 -82.842432 34.672991 41.101913
2019-05-22 01:19:26 PM 21 0.015339 -82.842493 34.673092 0.102902 -82.842433 34.672991 40.748714
2019-05-22 01:19:27 PM 22 0.014541 -82.842493 34.673091 0.109166 -82.842435 34.672995 39.262208
Case D - Scenario 2 - Trial 1
Real Time Travel Time (sec)
Vehicle-Trial-1 Pedestrian-Trial-1 Distance vehicle - Ped. (ft.)
hoverboard-Trial-1 Distance vehicle - Ped. (ft.)
speed longitude latitude speed longitude latitude speed longitude latitude
2019-05-22 12:52:41 PM 0 11.296850 -82.844271 34.674514 0.073821 -82.842447 34.673027 770.75494 0.096191 -82.842263 34.673137 784.5029
2019-05-22 12:52:42 PM 1 14.132248 -82.844242 34.674495 0.062316 -82.842447 34.673027 759.55939 0.146364 -82.842263 34.673137 773.1887
2019-05-22 12:52:43 PM 2 18.579883 -82.844179 34.674451 0.024607 -82.842446 34.673027 735.18793 0.085965 -82.842263 34.673137 748.6062
2019-05-22 12:52:44 PM 3 22.916787 -82.844105 34.674389 0.212195 -82.842445 34.673027 703.42994 0.127509 -82.842263 34.673136 717.0685
2019-05-22 12:52:45 PM 4 26.209811 -82.844028 34.674318 0.741406 -82.842443 34.673028 668.90404 0.066151 -82.842262 34.673136 682.8957
2019-05-22 12:52:46 PM 5 28.867846 -82.843946 34.674237 1.575807 -82.842438 34.673031 630.92865 0.071264 -82.842261 34.673136 645.5157
2019-05-22 12:52:47 PM 6 31.018242 -82.843848 34.674141 1.759401 -82.842434 34.673036 585.20554 0.869554 -82.842261 34.673134 601.4589
2019-05-22 12:52:48 PM 7 31.892909 -82.843745 34.674042 2.215589 -82.842426 34.673044 537.5361 1.915192 -82.842263 34.673130 555.0402
2019-05-22 12:52:49 PM 8 32.677350 -82.843644 34.673946 2.210529 -82.842420 34.673051 491.51194 1.964406 -82.842265 34.673123 511.2565
2019-05-22 12:52:50 PM 9 33.754413 -82.843537 34.673850 2.271194 -82.842413 34.673059 443.80526 2.468306 -82.842265 34.673116 466.2017
2019-05-22 12:52:51 PM 10 34.811076 -82.843420 34.673752 2.441526 -82.842407 34.673068 393.24943 2.569674 -82.842267 34.673108 418.3074
2019-05-22 12:52:52 PM 11 34.855975 -82.843296 34.673654 2.459209 -82.842401 34.673077 341.36016 3.415260 -82.842273 34.673097 368.3872
2019-05-22 12:52:53 PM 12 33.577690 -82.843163 34.673553 2.324882 -82.842395 34.673086 286.53522 4.156985 -82.842275 34.673080 317.4244
2019-05-22 12:52:54 PM 13 30.606314 -82.843040 34.673462 2.310501 -82.842389 34.673094 236.87387 3.911554 -82.842283 34.673065 269.363
2019-05-22 12:52:55 PM 14 27.265302 -82.842939 34.673390 2.429062 -82.842383 34.673103 197.19584 3.251639 -82.842294 34.673053 229.3235
2019-05-22 12:52:56 PM 15 24.342075 -82.842847 34.673328 2.532284 -82.842376 34.673112 161.74914 3.746975 -82.842304 34.673043 193.3704
2019-05-22 12:52:57 PM 16 20.844366 -82.842757 34.673268 2.540114 -82.842371 34.673121 127.68877 3.388096 -82.842314 34.673031 158.6171
2019-05-22 12:52:58 PM 17 16.490791 -82.842690 34.673225 2.412125 -82.842365 34.673131 103.33308 3.051588 -82.842323 34.673021 132.9598
2019-05-22 12:52:59 PM 18 11.362043 -82.842637 34.673192 2.430501 -82.842361 34.673140 85.067135 2.419316 -82.842331 34.673012 112.8037
2019-05-22 12:53:00 PM 19 6.463332 -82.842603 34.673170 2.513429 -82.842356 34.673149 74.432267 2.018413 -82.842337 34.673005 99.93789
2019-05-22 12:53:01 PM 20 3.272731 -82.842587 34.673160 2.244350 -82.842351 34.673158 70.60358 1.756365 -82.842339 34.672997 94.99708
2019-05-22 12:53:02 PM 21 0.593125 -82.842581 34.673156 2.427784 -82.842346 34.673167 70.687347 1.607125 -82.842341 34.672992 93.51965
2019-05-22 12:53:03 PM 22 0.022370 -82.842581 34.673156 2.096442 -82.842341 34.673175 72.105236 0.940179 -82.842342 34.672990 93.54713
2019-05-22 12:53:04 PM 23 0.017257 -82.842581 34.673156 1.589548 -82.842340 34.673182 72.831471 0.167029 -82.842345 34.672993 92.3983
2019-05-22 12:53:05 PM 24 0.013049 -82.842580 34.673156 1.219911 -82.842339 34.673187 73.187578 0.194299 -82.842347 34.672995 91.30728
2019-05-22 12:53:06 PM 25 0.013742 -82.842580 34.673156 1.166116 -82.842338 34.673191 73.893331 0.552859 -82.842354 34.672997 89.14938
2019-05-22 12:53:07 PM 26 0.009587 -82.842580 34.673156 1.392533 -82.842333 34.673194 75.413742 1.004093 -82.842360 34.672998 87.67797
2019-05-22 12:53:08 PM 27 0.010226 -82.842581 34.673156 1.120737 -82.842329 34.673196 76.864354 0.806918 -82.842364 34.672999 86.52857
2019-05-22 12:53:09 PM 28 0.014168 -82.842581 34.673155 1.217887 -82.842324 34.673198 78.515767 0.296243 -82.842369 34.673000 85.06885
2019-05-22 12:53:10 PM 29 0.156270 -82.842580 34.673155 0.919087 -82.842319 34.673200 79.988959 0.137096 -82.842373 34.673002 83.68455
2019-05-22 12:53:11 PM 30 1.182734 -82.842578 34.673153 0.793017 -82.842317 34.673202 80.202736 0.296775 -82.842375 34.673005 81.54205
2019-05-22 12:53:12 PM 31 3.844764 -82.842567 34.673147 0.301356 -82.842317 34.673201 77.645424 0.690274 -82.842374 34.673007 77.26027
2019-05-22 12:53:13 PM 32 7.083833 -82.842545 34.673134 0.206763 -82.842316 34.673201 73.126578 0.425989 -82.842377 34.673007 68.57097
2019-05-22 12:53:14 PM 33 10.362743 -82.842511 34.673115 0.339385 -82.842317 34.673201 65.998785 0.175125 -82.842379 34.673009 55.18691
2019-05-22 12:53:15 PM 34 13.647617 -82.842456 34.673085 0.187535 -82.842319 34.673198 58.478805 0.103861 -82.842382 34.673010 35.29354
2019-05-22 12:53:16 PM 35 16.305120 -82.842397 34.673051 0.128148 -82.842318 34.673195 57.72158 0.159200 -82.842383 34.673010 15.24601
2019-05-22 12:53:17 PM 36 19.125391 -82.842320 34.673007 0.080212 -82.842317 34.673193 67.678818 0.147003 -82.842383 34.673011 18.94583
2019-05-22 12:53:18 PM 37 21.523775 -82.842236 34.672962 0.150199 -82.842316 34.673191 87.07509 0.119839 -82.842383 34.673013 47.8232
2019-05-22 12:53:19 PM 38 22.887866 -82.842149 34.672916 0.130865 -82.842315 34.673191 112.20355 0.149240 -82.842382 34.673015 78.77974
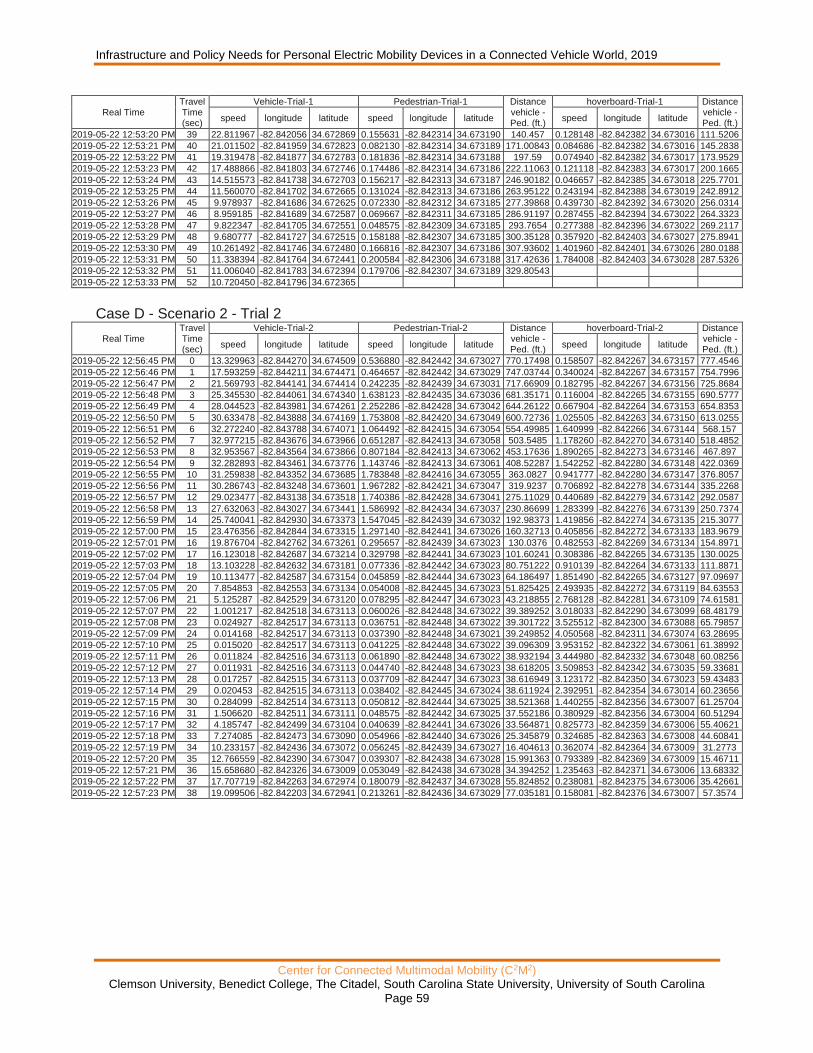
Infrastructure and Policy Needs for Personal Electric Mobility Devices in a Connected Vehicle World, 2019
Center for Connected Multimodal Mobility (C2M2) Clemson University, Benedict College, The Citadel, South Carolina State University, University of South Carolina
Page 59
Real Time Travel Time (sec)
Vehicle-Trial-1 Pedestrian-Trial-1 Distance vehicle - Ped. (ft.)
hoverboard-Trial-1 Distance vehicle - Ped. (ft.)
speed longitude latitude speed longitude latitude speed longitude latitude
2019-05-22 12:53:20 PM 39 22.811967 -82.842056 34.672869 0.155631 -82.842314 34.673190 140.457 0.128148 -82.842382 34.673016 111.5206
2019-05-22 12:53:21 PM 40 21.011502 -82.841959 34.672823 0.082130 -82.842314 34.673189 171.00843 0.084686 -82.842382 34.673016 145.2838
2019-05-22 12:53:22 PM 41 19.319478 -82.841877 34.672783 0.181836 -82.842314 34.673188 197.59 0.074940 -82.842382 34.673017 173.9529
2019-05-22 12:53:23 PM 42 17.488866 -82.841803 34.672746 0.174486 -82.842314 34.673186 222.11063 0.121118 -82.842383 34.673017 200.1665
2019-05-22 12:53:24 PM 43 14.515573 -82.841738 34.672703 0.156217 -82.842313 34.673187 246.90182 0.046657 -82.842385 34.673018 225.7701
2019-05-22 12:53:25 PM 44 11.560070 -82.841702 34.672665 0.131024 -82.842313 34.673186 263.95122 0.243194 -82.842388 34.673019 242.8912
2019-05-22 12:53:26 PM 45 9.978937 -82.841686 34.672625 0.072330 -82.842312 34.673185 277.39868 0.439730 -82.842392 34.673020 256.0314
2019-05-22 12:53:27 PM 46 8.959185 -82.841689 34.672587 0.069667 -82.842311 34.673185 286.91197 0.287455 -82.842394 34.673022 264.3323
2019-05-22 12:53:28 PM 47 9.822347 -82.841705 34.672551 0.048575 -82.842309 34.673185 293.7654 0.277388 -82.842396 34.673022 269.2117
2019-05-22 12:53:29 PM 48 9.680777 -82.841727 34.672515 0.158188 -82.842307 34.673185 300.35128 0.357920 -82.842403 34.673027 275.8941
2019-05-22 12:53:30 PM 49 10.261492 -82.841746 34.672480 0.166816 -82.842307 34.673186 307.93602 1.401960 -82.842401 34.673026 280.0188
2019-05-22 12:53:31 PM 50 11.338394 -82.841764 34.672441 0.200584 -82.842306 34.673188 317.42636 1.784008 -82.842403 34.673028 287.5326
2019-05-22 12:53:32 PM 51 11.006040 -82.841783 34.672394 0.179706 -82.842307 34.673189 329.80543
2019-05-22 12:53:33 PM 52 10.720450 -82.841796 34.672365
Case D - Scenario 2 - Trial 2
Real Time Travel Time (sec)
Vehicle-Trial-2 Pedestrian-Trial-2 Distance vehicle - Ped. (ft.)
hoverboard-Trial-2 Distance vehicle - Ped. (ft.)
speed longitude latitude speed longitude latitude speed longitude latitude
2019-05-22 12:56:45 PM 0 13.329963 -82.844270 34.674509 0.536880 -82.842442 34.673027 770.17498 0.158507 -82.842267 34.673157 777.4546
2019-05-22 12:56:46 PM 1 17.593259 -82.844211 34.674471 0.464657 -82.842442 34.673029 747.03744 0.340024 -82.842267 34.673157 754.7996
2019-05-22 12:56:47 PM 2 21.569793 -82.844141 34.674414 0.242235 -82.842439 34.673031 717.66909 0.182795 -82.842267 34.673156 725.8684
2019-05-22 12:56:48 PM 3 25.345530 -82.844061 34.674340 1.638123 -82.842435 34.673036 681.35171 0.116004 -82.842265 34.673155 690.5777
2019-05-22 12:56:49 PM 4 28.044523 -82.843981 34.674261 2.252286 -82.842428 34.673042 644.26122 0.667904 -82.842264 34.673153 654.8353
2019-05-22 12:56:50 PM 5 30.633478 -82.843888 34.674169 1.753808 -82.842420 34.673049 600.72736 1.025505 -82.842263 34.673150 613.0255
2019-05-22 12:56:51 PM 6 32.272240 -82.843788 34.674071 1.064492 -82.842415 34.673054 554.49985 1.640999 -82.842266 34.673144 568.157
2019-05-22 12:56:52 PM 7 32.977215 -82.843676 34.673966 0.651287 -82.842413 34.673058 503.5485 1.178260 -82.842270 34.673140 518.4852
2019-05-22 12:56:53 PM 8 32.953567 -82.843564 34.673866 0.807184 -82.842413 34.673062 453.17636 1.890265 -82.842273 34.673146 467.897
2019-05-22 12:56:54 PM 9 32.282893 -82.843461 34.673776 1.143746 -82.842413 34.673061 408.52287 1.542252 -82.842280 34.673148 422.0369
2019-05-22 12:56:55 PM 10 31.259838 -82.843352 34.673685 1.783848 -82.842416 34.673055 363.0827 0.941777 -82.842280 34.673147 376.8057
2019-05-22 12:56:56 PM 11 30.286743 -82.843248 34.673601 1.967282 -82.842421 34.673047 319.9237 0.706892 -82.842278 34.673144 335.2268
2019-05-22 12:56:57 PM 12 29.023477 -82.843138 34.673518 1.740386 -82.842428 34.673041 275.11029 0.440689 -82.842279 34.673142 292.0587
2019-05-22 12:56:58 PM 13 27.632063 -82.843027 34.673441 1.586992 -82.842434 34.673037 230.86699 1.283399 -82.842276 34.673139 250.7374
2019-05-22 12:56:59 PM 14 25.740041 -82.842930 34.673373 1.547045 -82.842439 34.673032 192.98373 1.419856 -82.842274 34.673135 215.3077
2019-05-22 12:57:00 PM 15 23.476356 -82.842844 34.673315 1.297140 -82.842441 34.673026 160.32713 0.405856 -82.842272 34.673133 183.9679
2019-05-22 12:57:01 PM 16 19.876704 -82.842762 34.673261 0.295657 -82.842439 34.673023 130.0376 0.482553 -82.842269 34.673134 154.8971
2019-05-22 12:57:02 PM 17 16.123018 -82.842687 34.673214 0.329798 -82.842441 34.673023 101.60241 0.308386 -82.842265 34.673135 130.0025
2019-05-22 12:57:03 PM 18 13.103228 -82.842632 34.673181 0.077336 -82.842442 34.673023 80.751222 0.910139 -82.842264 34.673133 111.8871
2019-05-22 12:57:04 PM 19 10.113477 -82.842587 34.673154 0.045859 -82.842444 34.673023 64.186497 1.851490 -82.842265 34.673127 97.09697
2019-05-22 12:57:05 PM 20 7.854853 -82.842553 34.673134 0.054008 -82.842445 34.673023 51.825425 2.493935 -82.842272 34.673119 84.63553
2019-05-22 12:57:06 PM 21 5.125287 -82.842529 34.673120 0.078295 -82.842447 34.673023 43.218855 2.768128 -82.842281 34.673109 74.61581
2019-05-22 12:57:07 PM 22 1.001217 -82.842518 34.673113 0.060026 -82.842448 34.673022 39.389252 3.018033 -82.842290 34.673099 68.48179
2019-05-22 12:57:08 PM 23 0.024927 -82.842517 34.673113 0.036751 -82.842448 34.673022 39.301722 3.525512 -82.842300 34.673088 65.79857
2019-05-22 12:57:09 PM 24 0.014168 -82.842517 34.673113 0.037390 -82.842448 34.673021 39.249852 4.050568 -82.842311 34.673074 63.28695
2019-05-22 12:57:10 PM 25 0.015020 -82.842517 34.673113 0.041225 -82.842448 34.673022 39.096309 3.953152 -82.842322 34.673061 61.38992
2019-05-22 12:57:11 PM 26 0.011824 -82.842516 34.673113 0.061890 -82.842448 34.673022 38.932194 3.444980 -82.842332 34.673048 60.08256
2019-05-22 12:57:12 PM 27 0.011931 -82.842516 34.673113 0.044740 -82.842448 34.673023 38.618205 3.509853 -82.842342 34.673035 59.33681
2019-05-22 12:57:13 PM 28 0.017257 -82.842515 34.673113 0.037709 -82.842447 34.673023 38.616949 3.123172 -82.842350 34.673023 59.43483
2019-05-22 12:57:14 PM 29 0.020453 -82.842515 34.673113 0.038402 -82.842445 34.673024 38.611924 2.392951 -82.842354 34.673014 60.23656
2019-05-22 12:57:15 PM 30 0.284099 -82.842514 34.673113 0.050812 -82.842444 34.673025 38.521368 1.440255 -82.842356 34.673007 61.25704
2019-05-22 12:57:16 PM 31 1.506620 -82.842511 34.673111 0.048575 -82.842442 34.673025 37.552186 0.380929 -82.842356 34.673004 60.51294
2019-05-22 12:57:17 PM 32 4.185747 -82.842499 34.673104 0.040639 -82.842441 34.673026 33.564871 0.825773 -82.842359 34.673006 55.40621
2019-05-22 12:57:18 PM 33 7.274085 -82.842473 34.673090 0.054966 -82.842440 34.673026 25.345879 0.324685 -82.842363 34.673008 44.60841
2019-05-22 12:57:19 PM 34 10.233157 -82.842436 34.673072 0.056245 -82.842439 34.673027 16.404613 0.362074 -82.842364 34.673009 31.2773
2019-05-22 12:57:20 PM 35 12.766559 -82.842390 34.673047 0.039307 -82.842438 34.673028 15.991363 0.793389 -82.842369 34.673009 15.46711
2019-05-22 12:57:21 PM 36 15.658680 -82.842326 34.673009 0.053049 -82.842438 34.673028 34.394252 1.235463 -82.842371 34.673006 13.68332
2019-05-22 12:57:22 PM 37 17.707719 -82.842263 34.672974 0.180079 -82.842437 34.673028 55.824852 0.238081 -82.842375 34.673006 35.42661
2019-05-22 12:57:23 PM 38 19.099506 -82.842203 34.672941 0.213261 -82.842436 34.673029 77.035181 0.158081 -82.842376 34.673007 57.3574