infraspec manual
TRANSCRIPT

8132019 InfraSpec Manual
httpslidepdfcomreaderfullinfraspec-manual 152
Inf
InfraSpec iCo yrigh
aSpecTM VFA-Ipectrometer
Userrsquos GuideVersion 275
April 2010
s a registered trademark of Wilks Enterprise Inct 2010 Wilks Enterprise Inc East orwalk CT
R
8132019 InfraSpec Manual
httpslidepdfcomreaderfullinfraspec-manual 252
Table of Content
1 InfraSpec VFA-IR Spectrometer Overview 5
11 Introduction 512 Basic Measurement Concept 513 InfraSpec 26 Software Program Overview 6
2 Getting Started 7
21 Spectrometer Care 722 Spectrometer Spectral Limits and Serial Number 723 Supplied and Optional Spectrometer Accessories 824 Spectrometer Connections 925 Program Installation 926 Initial Instrument Setup 9
3 Main Program Panel 11
31 Introduction 11
32 The InfraSpec Experiment 1133 Control Bar Buttons 12
3311 Background Acquisition 123312 Spectrum Acquisition 13
332 The Experiment Group 143321 Saving Spectra 143322 Loading Spectra 153323 Starting a New Experiment 153324 Experiment Setup 16
333 The Display Group 163331 The Autoscale Button 163332 The Set Scale Button 163333 The Sel Traces Button 163334 The Abs PanelMain Panel Button 17
34 Top Menu Controls 17341 The InfraSpec Menu 17
3411 Show MainAbsorbance Panel 173412 Open Manual 173413 Version Info 173414 Quit 18
342 The SpectraBkgnd Menu 183421 Select Spectra 183422 Select Background 183423 Load Data From Old VFA Version 18
343 The Display Menu 183431 Autoscale Both Axes 183432 Autoscale X 183433 Autoscale Y 193434 Autoscale Y from Zero 19
3435 Set Scale 193436 Copy Graph as Picture 19
344 The InfraSpec Setup Menu 193441 Setup Panel 193442 Start Test Scans 193443 Connect Spectrometer 193444 ShowHide Igor Menus 193445 Correct Screen Resolution 193446 Show Command History Window 193447 Restore Factory Default Settings 19
8132019 InfraSpec Manual
httpslidepdfcomreaderfullinfraspec-manual 352
35 Cursors 20
4 The Absorbance Panel 21
41 Introduction 2142 The Analyze Heading 21
421 Compare 21
4211 Subtraction Fit 224212 Mean Center Subtraction Fit 224213 Mean Centered Unit Variance Subtraction Fit 23
422 Baseline Correction 23423 Peak and Area 24424 Difference Spectra 24425 Quantitative Analysis 25
5 The Setup Panel 27
51 Introduction 2752 Bottom Buttons 27
521 Save For This Session Button 27522 Save Setup as Default Button 27523 Revert to Default Setup 27524 Cancel Button 27
53 General Tab 28531 Experiment Setup Heading 28
5311 of Scans 285312 Max Bkgd Age 285313 X Units 285314 Interpolation 285315 Crosstalk Correction 285316 Ask to Sample 295317 Save Folder 295318 Serial Port 295319 Company 2953110 Address 2953111 Operator 29
532 Spectrometer Setup Heading 295321 microm at First and Last Pixel 295322 Sample Stage 29
54 The System Tab 30541 Startup Heading 30
5411 Startup Options Panel 305412 Password 305413 Data Log 30
55 The Calibration Tab 31551 Current Calibrations Saving and Loading Calibrations 31552 Creating a Calibration 32
5521 Calibration Wizard Step 1 325522 Calibration Wizard Step 2 325523 Calibration Wizard Step 3 (Standard) 33
5524 Calibration Wizard Step 4 (Standard) 335525 Calibration Wizard Step 5 (Standard) 345526 Calibration Wizard Step 6 (Standard) 355527 Calibration Wizard Step 7 365528 Calibration Wizard Step 8 37
553 PLS Calibrations 375531 Calibration Wizard Step 3 (PLS) 385532 Calibration Wizard Step 4 (PLS) 38
56 Simplified Program Tab 39561 Materials Verification Setup 39
8132019 InfraSpec Manual
httpslidepdfcomreaderfullinfraspec-manual 452
5611 Largest Acceptable Deviation Value 395612 Match Method 405613 Range Limits 405614 No Sample Threshold 40
562 Simplified Program Setup 405621 Barcode Scanner 405622 Help Files 40
57 Verif Library Tab 40571 Add to Library 41572 Delete Sel 42573 Load Library 42574 Save Library 42
6 Simplified Programs for Non-Technical Operators 43
61 Introduction 43611 Notes on Backgrounds 43
62 Quantitative Analysis Simplified Program 43621 Step 1 Choose A Calibration 43622 Step 2 Run a Background 44623 Step 3 Run a Sample 45
6231 Data LoggingNote Option 466232 PassFail Option 46
624 Help and Exit buttons 47625 Reportrdquo Button 47
6251 Single Detail Report 486252 Date Range Report 49
63 Materials Verification Simplified Program 49631 Step 1 Run a Background 49632 Step 2 Choose a Material 50633 Step 3 Run a Sample 51
7 Spectrometer Specifications 53
8 Service and Technical Support 54
8132019 InfraSpec Manual
httpslidepdfcomreaderfullinfraspec-manual 552
1 InfraSpec VFA-IR Spectrometer Overview
11 Introduction
The InfraSpec VFA-IR Spectrometer is a new concept in mid infrared instrumentation It utilizes apatented cutting-edge design consisting of an electronically modulated source coupled with a linearvariable filter (LVF) and multi pixel detector array The result is a compact infrared spectrometer withno moving parts and no optical path exposed to air The InfraSpec is capable of gathering infrareddata on a vast quantity of materials including liquids powders pastes and solids The InfraSpec isavailable in Attenuated Total Reflection (ATR) and Transmission models depending on theapplication and can be supplied with 3 different filter ranges The InfraSpec makes quantitative andqualitative measurements quick and easy and can even be used by untrained personnel
12 Basic Measurement ConceptThe InfraSpec can be supplied in two basic sample stage setups Attenuated Total Reflection orTransmission In both setups a multi pixel linear pyroelectric array is coupled with a linear variable
filter (LVF) and illuminated by an electronically modulated source Pyroelectric detectors can be usedthroughout the entire IR range from visible to the far infrared and provide stable operation without theneed for cooling LVFs are wedge shaped interference filters that gradually change in wavelengthtransmitted from one end to the other A LVF typically covers approximately an octave in wavelength(ie 25-49 microns (400-2041cm
-1) or 55-105 microns (1818-952cm
-1))
Figure 1 shows a schematic of the InfraSpecrsquos ATR optical system The source and detector arrayare optically connected via an ATR crystal which is usually made of zinc selenide (ZnSe) zinc sulfide(ZnS) or cubic zirconia (CuZ) depending on the LVF filter range and application Light emitted fromthe source reflects down the crystal towards the detector array En route the light is absorbed by asample that is placed in contact with the top of the crystal The detector array measures the amountof infrared light absorbed from the sample which is separated into different wavelengths by the LVF in
order to provide an infrared spectrum The ATR crystal width accommodates the width of thedetector array
Figure 1 InfraSpec ATR Setup
Figure 2 shows a schematic of the InfraSpec transmission optical system An electronicallymodulated source is focused on the pyroelectric detector array such that a sample can be placedbetween the source and the detector The detector then measures the amount of infrared lightabsorbed as it passes through a sample The sample can be placed in a sealed infrared cell cuvetteor infrared card depending on the application
8132019 InfraSpec Manual
httpslidepdfcomreaderfullinfraspec-manual 652
Figure 2 InfraSpec Transmission Setup
13 InfraSpec 27 Software Program Overview
The InfraSpec VFA-IR Spectrometer is operated via dedicated software that was written specificallyfor the spectrometer The program provides all of the operating controls and analysis tools needed touse the spectrometer to its full potential The program allows trained personnel to operate thespectrometer with a full set of analytical tools and also allows untrained personnel to use thespectrometer via simplified programs for quantitative analysis or materials verification InfraSpec 27is written within Igor Pro
TM which is a program that provides a vast amount of general and
spectroscopy tools An advanced user can take advantage of the InfraSpec 27 software and alsoadd on hisher own tools via the Igor programming language
8132019 InfraSpec Manual
httpslidepdfcomreaderfullinfraspec-manual 752
2 Getting Started
21 Spectrometer CareThe InfraSpec is designed for use in the field or factory and can handle harsher environments thansensitive lab instruments Care should be taken however not to drop or shock the instrumentespecially if the instrument has been calibrated Excessive shock can damage the instrument andcan also invalidate a calibration or library set The InfraSpec should be powered and connected to thecomputer only with the provided connection and power cables The ATR crystal (if applicable) shouldbe cleaned with hydrocarbon solvents acetone alcohol or water with a soft wipe such as a KimwipeDo not use caustics mineral acids amines or ammonia to clean the crystal Long exposure to warmwater will also degrade zinc selenide or zinc sulfide Minor scratches may occur as a result of regularuse and will not affect the sample analysis
N ote Wilks Enterprise Inc is not responsible for damage to the crystal by the customer (seeenclosed warranty)
It is recommended to warm up the instrument for one hour before using the instrument for quantitativeuse The instrument should be turned off when not in use for extended periods Do not touch thesource or LVF as they are fragile
22 Spectrometer Spectral Limits and Serial NumberThe linear array spectral limits are expressed in microns for pixel 1 and 128 and are located on the onthe bottom of the instrument along with the serial number
8132019 InfraSpec Manual
httpslidepdfcomreaderfullinfraspec-manual 852
23 Supplied and Optional Spectrometer Accessories
Accessories Supplied With Analyzer
bull Users Manual and InfraSpec Program CD
bull Igor Pro Manual and Program CDbull Universal AC-DC Power Supply
bull AC Power Cord (US version)
bull Polycarbonate Sample Cover
bull USB Cable
Optional Accessories
bull Stainless Steel Sample Cover
bull Carrying Case
bull Spare Cables
24 Spectrometer ConnectionsTo power on the spectrometer connect the 12 VDC power supply to the line supply (100 ndash 240 VAC)and the 12 VDC output to the female barrel connector on the spectrometer Connect the USB cableto the instrument and computer For the initial USB connection insert the InfraSpec Installation CD inthe drive and when the installation wizard asks for where to find the drivers select the CD-ROMoption Note It is recommended that the computer be started up before the InfraSpec connection ismade
If you do not have a serial port and your InfraSpec does not have a USB connection install a USB to
RS-232 converter following the manufacturers instructions A tested and recommended USB to RS-232 converter is available as an accessory to the InfraSpec Using this converter will ensure lownoise performance
25 Program InstallationFollow the steps below to install the InfraSpec 27 software
1 Insert the InfraSpec Installer CD The installer will start automatically Follow the installerinstructions If this is the first install be sure to select ldquoFirst Install (Launches Igor ProInstaller)rdquo otherwise select ldquoIgor Pro Already Installedrdquo
2 If Igor Pro was selected to be installed the Igor Pro installer will initialize after theInfraSpec software has installed Follow the Igor Pro instructions to install Igor Pro Theserial number and key are located with the Igor Pro Install CD Note that the Igor Pro InstallCD is not needed for the InfraSpec install since both InfraSpec and Igor Pro are packagedtogether with the InfraSpec Installer The Igor Pro CD is provided for backup only
3 After the Installation is complete plug in the spectrometer into the wall outlet and then to thecomputer If the USB cable is used a driver must be installed to work properly The driver canbe installed using the Windows New Hardware Wizard Be sure to select the Installation CD asthe location of the driver
8132019 InfraSpec Manual
httpslidepdfcomreaderfullinfraspec-manual 952
4 The program should now be installed and can be started from a desktop shortcut or from theprograms menu
26 Initial Instrument SetupNote In order to get the best performance from the InfraSpec it is essential to follow these setupinstructions before using the InfraSpec for the first time
After the InfraSpec program is started the Main Panel should show a top bar with buttons and a graphbelow as shown in Figure 3 (See section 3 for complete Main Panel explanation) The followingprocedure must be completed before using the InfraSpec for the first time
1 Click the Setup button on the top button bar under the heading Experiment A panel asshown in Figure 4 should appear (See Section 5 for more information on the Setup Panel
2 On the right hand side enter the microm at first pixel microm at last pixel and ldquoSerial rdquo valueswhich are located on the bottom of the instrument This may automatically be completed withnewer versions of the InfraSpec
3 Select the Sample Stage from the drop down menu according to the type of instrument thatis connected either ATR or Transmission
4 Enter the company address and operator in the spaces provided5 Click Save Setup as Default at the bottom of the panel This will save these settings so that
they will be accessible every time the InfraSpec 27 program is opened
Once this process has been completed the InfraSpec will be ready to use
Figure 3 InfraSpec Main Panel
8132019 InfraSpec Manual
httpslidepdfcomreaderfullinfraspec-manual 1052
Figure 4 InfraSpec Setup Panel
3 Main Program Panel
31 IntroductionWhen the InfraSpec program starts for the first time the Main Panel will appear as shown in Figure 5This panel contains a large graph area for displaying and acquiring spectra and a top control barwhich contains most of the functions needed to operate the InfraSpec The buttons are separatedinto 3 headings Experiment Display and Collect Each of these sets of controls will beexplained below
In addition to the button bar the top of the screen contains menu items which can be used to accessfurther functions of the InfraSpec 27 program Note that some of these menus are disabled Theseare Igor Pro menus and are used by advanced users and programmers only The InfraSpec menuitems are explained belowNote Please refer to the Igor Pro manual for information on the Igor menus or contact WilksEnterprise Inc for more Information
Figure 5 InfraSpec Main Panel
32 The InfraSpec ExperimentEvery session that spectra are acquired analyzed or otherwise viewed in the InfraSpec program iscalled an experiment Within an experiment spectra that have been acquired or loaded will bepresent along with their respective background spectra The spectra can be saved for use in a future
8132019 InfraSpec Manual
httpslidepdfcomreaderfullinfraspec-manual 1152
experiment and can be deleted out of an experiment if they are no longer necessary for the currentexperiment Any changes to saved spectra will not be permanent unless the spectra are saved afterthe changes have been made For the majority of applications only the spectra need to be saved inorder to use data in the future For advanced users and programmers the experiment itself can besaved via the Igor menus although this is not the recommended way to save data within theInfraSpec program
33 Control Bar ButtonsMost of the InfraSpec functions can be accessed via the buttons located on the top control bar Thebuttons are separated into groups with headings of ldquoCollect Experiment and Display Each ofthese button groups will be explained in detail below
331 The Collect GroupThis heading contains the Background and Sample buttons These are the only buttonsneeded to acquire spectra from samples In a normal spectrum acquisition a background scan isobtained with either a clean crystal or in some cases a blank sample Then a sample is placed onthe instrument and the Sample button is pressed to acquire a sample
3311 Background Acquisition1 IntroductionThe Background button collects and saves a background spectrum A background spectrumis necessary with the InfraSpec to compensate for variation in individual pixel sensitivity andflattens out the source emission curve The InfraSpec program ratios sample spectra againstthe current background that is chosen to get a transmission spectrum which shows thepercent of light at a given wavelength absorbed by a sample compared to the backgroundspectrum In addition spectra can be displayed in absorbance (see Section 4 for moreinformation on absorbance spectra) The current background can be selected via thebackground selector (see section 3432)
2 Background Collection
To run a background spectrum make sure the sample crystal is clean and dry or that thebackground sample has been placed on a clean crystal so that the entire crystal is coveredFor a transmission instrument place a blank sample cellcardcuvette into the spectrometerPress the Background button to begin background spectrum acquisition Depending on thenumber of scans chosen (see Section 5311) this process should take about 30 seconds to 1minute The background is an average every scan acquired so that more scans will result inreduced spectrum noise
While acquiring the background spectrum the graph will show the resulting backgroundspectrum similar to that shown in Figure 6 Note that the background acquisition can bestopped at any time by pressing the Stop Scans button which appears to the right of theCollect heading during acquisition If this button is pressed no background is saved
8132019 InfraSpec Manual
httpslidepdfcomreaderfullinfraspec-manual 1252
Figure 6 Background Acquisition
3312 Check Background XXXXXXXXXX1 IntroductionThe ldquoCheck Bkgndrdquo button checks the background to ensure that the crystal is clean and thebackground is still adequate
2 Background CheckingTo check the background make sure the sample crystal is clean and dry and then click theldquoCheck Bkgndrdquo button The instrument will collect three scans and compare them to threescans collected from the first background A view of the ratio of the checked scans to thecurrent background is displayed in order to help visually determine whether any absorption
bands are present that would indicate that either the crystal is not clean or the background isno longer valid See Figure 7 for an exampleIn addition to the visual queue of background cleanliness a number is calculated based on thevariance seen If this number is within +- 10 then the current background is adequate If thenumber is greater than 10 or less than -10 then the sample crystal should be cleanedthoroughly and the background should be re-checked If the result is still not within +- 10 it isrecommended that a new background be run
Figure 7 Background Checking3313
3314 Spectrum Acquisition1 IntroductionThe Sample button collects and saves a sample spectrum A background spectrum must becollected first so that a ratio can be calculated
2 Sample CollectionTo collect a sample spectrum make sure a background spectrum has been collected and thenplace a sample onto the ATR crystal or into the transmission sample holder Cover volatilesamples with the supplied plastic cover or optional stainless steel cover Make sure the sample
8132019 InfraSpec Manual
httpslidepdfcomreaderfullinfraspec-manual 1352
is covering the whole crystal completely and then press the Sample button In addition ifpowders are used with an ATR sample stage the powders must be finely ground and a weightmay need to be used in order to get good crystal contact
Note Excessive weight or pressure on the ATR crystal can crack or damage the crystalContact Wilks Enterprise Inc if you are unsure as to how much pressure to apply to the
crystal Wilks Enterprise is not responsible for damage to the crystal by the customer (seeenclosed warranty)
For the transmission version fill the sealed cell cuvette or IR card according to manufacturersspecifications and place into the sample holder
While acquiring a sample spectrum the graph will show the current average spectrum for thenumber of scans acquired so far as shown in Figure 7 Note that the sample acquisition can bestopped at any time by pressing the Stop Scans button which appears to the right of theCollect heading during acquisition If this button is pressed no sample is savedOnce sample acquisition has completed a dialog will allow the entry of a spectrum name Thisname must be unique and not contain or + and must have 1-22 characters After thespectrum name is entered the spectrum will appear on the graph along with a legend which
shows the spectrum name Spectrum names must always be in quotes in this entry box
Figure 7 Sample Acquisition
332 The Experiment GroupThis heading contains the Save Spectra Load Spectra New Exp and Setup buttonsThese controls allow you to load InfraSpec spectra into the current experiment save spectra in avariety of formats start a new experiment and adjust the settings for the InfraSpec program
3321 Saving SpectraThe Save Spectra panel shown in figure 8 below can be accessed by pressing the SaveSpectra button There are two basic file types to save a spectrum or group of spectra in theInfraSpec program InfraSpec type spectra and text spectra Both will be explained below
8132019 InfraSpec Manual
httpslidepdfcomreaderfullinfraspec-manual 1452
8132019 InfraSpec Manual
httpslidepdfcomreaderfullinfraspec-manual 1552
Figure 9 Save as Text Panel
3322 Loading Spectra
Spectra can be loaded into the InfraSpec program if they are in the InfraSpec format To loadspectra press the Load Spectra button and select the file to load After selecting the file thespectra within the file will be displayed in the graph area The loaded spectra will now be partof the current experiment
3323 Starting a New ExperimentIn order to clear all data spectra and temporary settings a New Experiment may be startedThis is done by selecting the New Exp buttonNote Starting a new experiment will permanently delete all spectra that have not been savedin the current experiment
3324 Experiment SetupPressing the Setup button will access all of the setup options for the spectrometer and
program Please refer to Section 5 for more information on the setup panel
333 The Display GroupThis group of controls contains functions for displaying spectra in various formats and scaling theviewable area of the graph In addition the Absorbance Panel can be accessed via thesecontrols (see Section 4 for more information on the Absorbance Panel
3331 The Autoscale ButtonThe autoscale button scales the spectra in the current top window so that every trace on thegraph is entirely visible This is the default view for the graph window
3332 The Set Scale Button
The Set Scale button sets the x and y scale of the graph using the Axis Scaling Panel shownin Figure 11 below After the numbers are entered for the scaling Press OK to set the graphwindow to the selected scale or Cancel to return to the previous scale
3333 The Sel Traces ButtonThe Sel Traces button brings up the Select Spectra panel as shown in Figure 10 Severaloptions can be accessed from this panel including displaying spectra displaying spectra as atable deleting spectra renaming spectra and restoring processed spectra Each will beexplained below If a spectrum is clicked in the spectral list box a spectrum info panel will
8132019 InfraSpec Manual
httpslidepdfcomreaderfullinfraspec-manual 1652
appear to the left of the Select Spectra panel This panel displays information about thecurrent spectrum
1 Displaying SpectraThe Display button control displays the selected spectra on the current top window (either theMain Panel or the Absorbance Panel) Spectra that are not selected will be removed from the
graph window if they were previously displayed
2 Displaying Spectra as a TableThe Table button will display the selected spectra in a table format This table can be copiedinto spreadsheets or other programs for further processing or displaying The format of thedata is dependent on the current top window and x scaling For instance if the Main Panel isdisplayed and the x scaling is wavelength the table will display an x column in wavelength anda y column in reflectancetransmittance
3 Deleting Spectra from the experimentThe Delete button deletes spectra from the current experiment Deleting absorbance spectrawill delete transmissionreflectance spectra as well and vice versa Note Spectra that havenot previously been saved will be permanently deleted
4 Renaming SpectraThe Rename button renames spectra and their corresponding absorbance and differencespectra will be renamed as well The new name must be unique and not contain or + andmust have 1-22 characters
5 Adjusting the Spectrum Scale (Main panel only)The Adj Scale button will adjust the wavelength limits of the selected spectra This is usefulin cases where the current scale is not correct or is inaccurate
6 Restoring Processed Spectra (Absorbance panel only)The Restore button will restore any processed spectra in the Absorbance Panel Note thatthis button will only appear in the Select Spectra panel if the Absorbance Window is on topRestoring spectra will permanently remove any baseline corrections that have been done onthe spectra
7 Averaging Spectra (Absorbance panel only)The Average button will make an average of any selected absorbance spectra It is possibleto select a
6 Closing the Select Spectra PanelPressing the Done button or the X box in the upper right of the window will close the paneland return the current top window
8132019 InfraSpec Manual
httpslidepdfcomreaderfullinfraspec-manual 1752
Figure 10 Select Spectra Panel
3334 The Abs PanelMain Panel ButtonThe Abs Panel button on the top bar of the Main Panel will bring the Absorbance Panel tothe top so that spectra can be viewed and processed in absorbance Similarly the Main
Panel button on the top bar of the Absorbance Panel will bring the Main Panel to the top forspectra collection and display in transmittancereflectance
34 Top Menu ControlsSecondary controls that cannot be accessed via the top bar buttons can be found in the menucontrols at the top of the screen Each active InfraSpec menu function will be explained in detailbelow Please refer the Igor Pro manual for more information on the disabled Igor menus
341 The InfraSpec Menu
3411 Show MainAbsorbance Panel
These selections either select the Main Panel or the Absorbance Panel as the top windowsimilar to the button control Main Panel and Abs Panel
3412 Open ManualThis menu selection will open this pdf manual
3413 Version InfoThis menu selection will open a panel that displays the current version and date along withupdate information
3414 QuitQuits the InfraSpec Program Note that any unsaved spectra in the current experiment will bedeleted
342 Tools Menu
3421 Select SpectraOpens the Spectra Selector panel just as the top menu button Sel Traces does SeeSection 3333 for more information
8132019 InfraSpec Manual
httpslidepdfcomreaderfullinfraspec-manual 1852
3422 Select BackgroundOpens the Background Select Panel as shown in Figure 11 below This panel allows theoption to either display the selected background on the with the Display button on the currenttop graph window or select a background as the currently active background by using theSelect button This will make all subsequent sample collections use this background untilanother is chosen or a new background is run This is not necessary under normal
circumstances
Figure 11 Select Background Panel
3423 Start Continuous ScanningThis menu item begins continuous scans The display will show a spectrum referenced to thecurrent background which is updated in real time This is useful for qualitative analysis ofsamples that may change in concentration or chemical composition
3424 Start Test ScansStarts instrument test scans Each raw data scan coming from the spectrometer will bedisplayed in the graph window of the Main Panel This is useful for troubleshooting anddiscerning weak or non-functioning pixels In addition this function may be used for qualitativeprocess monitoring
343 The Display Menu
3431 Autoscale Both Axes Autoscales top graph window to both axes This is the same function as the Autoscale buttonon the top control bar under the Display heading
3432 Autoscale X Autoscales the X axis only
3433 Autoscale Y Autoscales the Y axis only
3434 Autoscale Y from Zero Autoscales the Y axis from zero to the maximum of all displayed spectra
8132019 InfraSpec Manual
httpslidepdfcomreaderfullinfraspec-manual 1952
3435 Set ScaleOpens the Axis Scaling panel for manual scale setting This is the same function as the SetScale button on the top control bar under the Display heading
3436 Copy Graph as PictureCopies the current top graph as a picture into the clipboard for pasting into other programs
This will only copy the graph portion of the top panel and is useful for presenting data Notethat a graph panel must be currently on top to use this function
344 The InfraSpec Setup Menu
3441 Setup PanelOpens the Setup Panel See Section 5 for more information on the Setup Panel
3442 ShowHide Igor MenusEnables or Disables the Igor Menus By default the Igor menus are disabled See the Igor Promanual for more information on these menu items
3443 Correct Screen Resolution After display settings have been changed in the computer running the InfraSpec program suchas after an external monitor is connected to a laptop it may be necessary to select this functionin order to redraw the program windows to the correct size for the new screen resolution
3444 Show Command History WindowShows the Igor Pro command window for manual entry of commands See the Igor Promanual for more information
3445 Restore Factory Default SettingsRestores the default settings for the InfraSpec program This should only be used if there areproblems with settings or if a new spectrometer is attached and the settings must be
completely reset
35 CursorsOn the bottom of the Main and Absorbance Windows a white bar contains the two cursors that canbe used for identifying points on a spectrum called the A and B cursors In order to activate a cursoruse the mouse to drag the circle A cursor or square B cursor onto a trace on the graph The whitebar will give X and Y coordinates as well as information about the distance between the two cursors ifrelevant
Cursors are also used in the Absorbance window for selecting areas and peaks for spectralprocessing See Section 4 for more information about the processing functions that use cursors
8132019 InfraSpec Manual
httpslidepdfcomreaderfullinfraspec-manual 2052
4 The Absorbance Panel
41 IntroductionThe Absorbance Panel is similar in many aspects to the Main panel A top control bar contains mostof the same functions as those in the Main Panel with the exception that the Collect heading isreplaced by an Analyze heading
The graph window displays spectra in absorbance rather than the transmissionreflectance spectradisplayed in the Main Panel See Figure 12 below
The Analyze heading contains controls that process and analyze selected spectra in the experimentNote that absorbance spectra reside separately from the transmissionreflectance spectra so anyspectral processing can be undone by using the Restore button in the Select Spectra Panel (seeSection 3333)
Figure 12 The Absorbance Panel
42 The Analyze HeadingThis heading is where all spectral processing and analysis takes place The functions that can beused are Compare Baseline Correction Peak and Area Difference Spectra Quantitative AnalysisTo select a function click the checkbox next to the function name and a panel to the right of the
Analyze
421 CompareSelecting the Compare checkbox will open the menu controls shown in Figure 13 This functionallows a comparison between a reference and any amount of other spectra as chosen by selectingspectra on the right hand side of the graph After selecting the spectra and reference to comparepress the Compare button to bring up the comparison table shown in Figure 14 below
8132019 InfraSpec Manual
httpslidepdfcomreaderfullinfraspec-manual 2152
Figure 13 Comparison Panel
Figure 14 Comparison Table
The table shown in Figure 13 contains 3 calculations which gauge the closeness of the selectedspectrum and the reference spectrum Each calculation is a subtraction after variouspreprocessing Each will be explained belowNote In the following formulas A=[a1a2 an ] ie lower case symbols are scalars upper casesymbols are vectors (spectra) See for example ldquoChemometricsrdquo Sharaf Illman and KiowalskiWiley 1986
4211 Subtraction FitCalculates the point by point subtraction and squares the sum
F=sum(R-A)2
Where F is the Subtraction Fit value R is the Reference spectrum and A is the comparisonspectrum
4212 Mean Center Subtraction FitCalculates the point by point subtraction and squares the sum after the spectra have beenmean centered If the mean of the absorbance spectrum is ā then
ā=1nsumai
8132019 InfraSpec Manual
httpslidepdfcomreaderfullinfraspec-manual 2252
Where ai is an individual pixel absorbance value and n is the number of data points (pixels)The mean centered spectrum is then defined as
A=A- ā
Where A is the mean centered comparison spectrum and A is the original comparison
spectrum The resulting Mean Center Subtraction Fit G is calculated as
G=sum(R-A)2
Where R is the mean centered reference spectrum
4213 Mean Centered Unit Variance Subtraction FitCalculates the mean centered spectrum similar to 4212 and then autoscales this result bydividing the resulting mean centered spectrum by the variance of the spectrum The variance
s is defined as
s2=
1n-1sum(ai-ā)
2
The resulting variance is then divided by the mean centered spectrum as follows
A=(A- e)s
Where A is the mean centered unit variance comparison spectrum The mean centered unitvariance fit H can then be calculated as
H=sum(R-A)2
Where R is the mean centered unit variance reference spectrum
422 Baseline CorrectionSelecting the Baseline Correction check box will open the baseline correction tools shown inFigure 15 below These functions are useful for removing artifacts from spectra
Figure 15 Baseline Correction Controls
To baseline correct spectra ensure that the desired spectra are displayed in the absorbancepanel graph window Then place cursors onto a displayed spectrum and press the IncludebuttonThe range that has been chosen will be highlighted yellow on the graph panel Alternatively arange can be manually entered using the Range entry boxes To clear all selected regions press
8132019 InfraSpec Manual
httpslidepdfcomreaderfullinfraspec-manual 2352
the Clear Region button To exclude only part of a region place the cursors on the desiredregion to exclude and press the Exclude button The excluded region will no longer behighlighted in yellowOnce a desired region has been selected the Force Reg to Zero or Baseline Correct can bepressed to complete the baseline correction Force Reg to Zero shifts the entire spectrum sothat the average value of the selected region is zero Baseline Correct calculates a linear fit
across the selected region and then shifts the spectrum so that the calculated fit line has zeroslope and intercept
423 Peak and AreaSelecting the Peak and Area checkbox will open the baseline correction panel shown in Figure16 below This function calculates the peak location peak absorbance value and area of aselected region
Figure 16 Peak and Area Controls
In order to calculate the peak and area values first display the desired spectra to be analyzed onthe absorbance graph window Then select a region using the cursors at the bottom of the screenor alternatively use the manual range entry boxes Once the desired region is selected press theInclude button The selected region will be highlighted in yellow To clear the region press theClear Region button
Once the desired region has been selected and included the Peak and Area of Region buttoncan be pressed in order to bring up the table shown in Figure 17 below This table includes thepeak location peak absorbance value and the area of the selected region along with analysis
details The data from this table can be copied and pasted into another program for furtherprocessing
Figure 17 Peak and Area Table
424 Difference SpectraSelecting the Difference Spectra checkbox will open the difference spectra controls shown inFigure 18 These functions are useful for subtracting one spectrum from another In order to
8132019 InfraSpec Manual
httpslidepdfcomreaderfullinfraspec-manual 2452
difference spectra first choose a reference spectra or minuend This is the spectrum that will besubtracted from the sample spectrum
Next choose the sample spectrum or subtrahend Once both spectra have been chosen thesubtraction slider can be used to choose the correct subtraction weight The subtraction weight isthe percent of the reference spectrum that is subtracted from the sample spectrum As the slider
is moved the resulting difference spectrum is displayed in the graph window Additionally thesubtraction weight can be entered manually in the entry box or adjusted with the up and downarrows to the right of the entry box
Note that the original spectra are not affected by generating a difference spectrum Differencespectra are separate entities and can be displayed in the absorbance window much likeabsorbance spectra Difference spectra take the name of the sample spectrum with _diffappended at the end of the name
Figure 18 Difference Spectra Controls
425 Quantitative AnalysisSelecting the Quantitative Analysis checkbox opens the controls shown in Figure 19 Thesefunctions allow quantitative analysis within the standard program In order to use these functionsat least one calibration must be created See Section 55 for information on how to generate acalibration Note that a simplified quantitative analysis program allows for quantitative analysis byuntrained personnel See Section 62 for more information on the simplified quantitative analysisprogram
Figure 19 Quantitative Analysis Controls
In order to quantitatively analyze spectra in the current experiment first choose a calibration orcalibrations to analyze for Up to eight calibrations can be analyzed at the same time Once thedesired calibrations are selected select the spectra to be analyzed using the list box to the right
8132019 InfraSpec Manual
httpslidepdfcomreaderfullinfraspec-manual 2552
All or no spectra can be selected using the Sel All and Sel None buttons below the list boxMake sure that the spectra to be analyzed are appropriate for the calibration selected to ensurecorrect quantitative values
After selecting calibrations and spectra to be analyzed press the Analyze button This will bringup a table similar to that shown in Figure 20 Each spectrum name is displayed and the resulting
concentrations for each calibration are shown in the appropriate column The data from this tablecan be copied and pasted into another program for further analysis
Figure 20 Quantitative Analysis Table
8132019 InfraSpec Manual
httpslidepdfcomreaderfullinfraspec-manual 2652
5 The Setup Panel
51 IntroductionThe setup panel accessed either from the Setup button under the Experiment heading in the mainand absorbance windows or from the Setup Panel menu item under the InfraSpec Setup menucontains all of the functions for setting up and customizing the InfraSpec program In additionCalibrations can be generated and Libraries for Materials Verification can be built This sectiondescribes all of the setup options available
The setup panel contains several tabs with different controls in each along with a set of buttons atthe bottom that are available in every tab Each tab will be explained separately below
52 Bottom ButtonsThe buttons found at the bottom of the setup panel are available in every tab of the setup panel andare shown in Figure 21 below These buttons are used for saving the changes that have been madein the setup panel The changes can be either saved for use only in the current experiment using the
Save For This Session button or saved as the default setup so that every experiment will use thecurrent settings with the Save Setup as Default button
Figure 21 Bottom Setup Panel Buttons
521 Save For This Session ButtonThis button allows temporary changes to be made to a current experiment without affecting the
default values for subsequent experiments This option is useful for changing a setting for aspecific experiment such as adjusting the number of scans or changing the x-axis units Whenthis button is pressed the setup panel is closed and the values changed in the setup panel willtake effect for the current experiment
522 Save Setup as Default ButtonThis button allows permanent changes to be made to the setup values This is useful for the initialsetup of the spectrometer or for changes that will be used many times When this button ispressed the setup panel will close and all subsequent experiments will use the settings chosen asdefault settings
523 Revert to Default SetupThis button reverts all settings to the default values as chosen the last time the Save Setup asDefault button was pressed This is useful to change back many settings made temporarily Inaddition it is useful to revert to the default setting if problems are occurring that may be due tochanges in the Setup Panel
524 Cancel ButtonThis button closes the Setup Panel and cancels any changes made to the setup panel since it wasopened Note that calibrations are left unchanged by the Cancel button
8132019 InfraSpec Manual
httpslidepdfcomreaderfullinfraspec-manual 2752
53 General TabThis tab contains basic setup controls for the spectrometer and experiment The controls shown inFigure 22 will be displayed when this tab is selected or the Setup Panel is first opened
Figure 22 General Setup Tab
531 Experiment Setup HeadingThis heading contains controls used for the setup of the InfraSpec program and experiment Eachcontrol is explained below
5311 of ScansThis control selects the number of scans that a background and sample spectrum will beaveraged from The higher the number of scans the lower the resulting spectral noise Eachscan takes approximately 15 seconds so a setting of 40 scans will allow a spectrum to becompleted in approximately 1 minute 40 Scans is recommended for most applications
5312 Max Bkgd AgeThis option selects the maximum age of a background scan In the standard program awarning will pop up once the background has expired however the user may still run aspectrum using the expired background In the simplified Quantitative Analysis and MaterialsVerification programs the user must run a new background the current background hasexpired This setting can be set to off as well to never warn that the background has expired
5313 X UnitsThis control selects the units used for the X-axis either microm (microns) or cm-1 (wavenumber)
5314 InterpolationThis control selects whether the spectra displayed are interpolated The interpolation is donevia a cubic spline algorithm The number of points in an interpolated spectrum is 1280
8132019 InfraSpec Manual
httpslidepdfcomreaderfullinfraspec-manual 2852
5315 Crosstalk CorrectionCrosstalk correction is a proprietary correction algorithm that attempts to eliminate crosstalkbetween pixels due to incorrect illumination from imperfectly collimated source light as well asfrom thermal crosstalk between pixels The result is an increase in apparent resolution Thisshould be used for qualitative analysis where the most spectral detail is desired It is notrecommended for quantitative analysis or materials verification
5316 Ask to SampleThis option allows the selection of an extra step before sampling or running a background Ifthis is set to ON when the Sample or Background button are pressed a pop up will ask if theuser is ready to run a new spectrum This prevents an accidental spectrum or backgroundfrom occurring When the selection is set to OFF a background or sample spectrum willimmediately begin after the correct button is pressed
5317 Trace TagsTrace tags will appear on the Main panel and Absorbance panel when a spectrum is clicked inthe graph pane The tag can show the sample name of the spectrum clicked by setting thetrace tags option to ldquoNotes Onlyrdquo or it can show details spectrum information by setting theoption to ldquoDetailedrdquo The tags can also be turned off here
5318 Save FolderThis setting selects the default folder to be opened when a spectrum is saved or loaded IfInfraSpec_Data is selected every time the Save Spectra or Load Spectra button ispressed the InfraSpec_Data folder will be the start folder in the saveload dialog If LastFolder Used is selected the folder that was last navigated to on a load or save will be the startfolder in the saveload dialog
5319 CompanyThis control sets the company that is using the spectrometer This name is reported in log filesand reports
53110 AddressThis control sets the company address for the company using the spectrometer This addressis reported in log files and reports
53111 OperatorThis control sets the company address for the company using the spectrometer This name isreported in log files and reports
532 Spectrometer Setup HeadingThis heading contains controls used for the setup of the InfraSpec spectrometer hardware Eachcontrol is explained below
5321 microm at First and Last PixelThe wavelength values located at the back of the instrument should be entered here Thisensures that the spectra collected will have the correct x-units
5322 Sample StageThis allows the selection of the sample stage type either ATR or Transmission This ensuresthat the y axis contains the correct units and that the crosstalk correction values areappropriate for the sample stage of the selected spectrometer
8132019 InfraSpec Manual
httpslidepdfcomreaderfullinfraspec-manual 2952
5323 Serial PortThis setting selects the current serial port that the InfraSpec is connected to If thespectrometer is connected correctly and the program does not recognize the spectrometer theserial port may be incorrectly set Use this setting to change the serial port and then use theConnect Spectrometer menu item under the InfraSpec Setup menu to connect thespectrometer This can also be used to select between different instruments if multiple
spectrometers are connected to the same computer
54 The System TabThe controls shown in Figure 23 will be displayed when the System tab is selected This tabcontains setup controls for program startup and logging
Figure 23 System Setup Tab
541 Startup HeadingThese functions control how the program starts depending on whether the Quantitative Analysis orMaterials Verification programs will be used See Section 6 for more information on theQuantitative Analysis and Materials Verification simplified programs
5411 Startup Options PanelIf this control is set to ON a startup panel will appear at startup rather than the standardprogram starting immediately On this panel there are buttons that allow the user to choosewhether to start the program in the standard mode or a simplified mode (quantitative analysis
or materials verification) In order to have a selection for a simplified program appear in thestartup panel check the box next to the simplified program desired When the program isrestarted a button choice will allow the user to start the program in the selected simplifiedmode
5412 PasswordIf the Sys Setup control is set to ON then a password entry box will appear at the startuppanel This allows an administrator to set up the simplified programs and limit the use of theinstrument to the simplified programs unless an administrator password is used The password
8132019 InfraSpec Manual
httpslidepdfcomreaderfullinfraspec-manual 3052
can be set by pressing the SetChange Password button Note that the default password isblank
5413 Data LogThese functions adjust how the InfraSpec program logs data in the simplified program Bydefault every spectrum is logged in the standard InfraSpec format Data log files can be
opened in the standard program just like normal spectra Information about the log file such asconcentration or materials verification data can be accessed in the standard program throughthe spectra info box that appears when the Sel Traces button is pressed and a spectrum ishighlighted in the list
In addition to setting the Data Logging to ON or OFF two other options exist First theoption ASK allows the user of the simplified program to decide whether or not to save a logfile ASK w note also allows the user to decide whether or not to save a log file and alsoallows the user to enter notes about the data that was obtained These notes are accessiblethought the spectra info box as described in the previous paragraph More information on thefunctions of the data log can be found in Section 6 with regards to their operation within thesimplified programs
55 The Calibration TabThe controls shown in Figure 24 will be displayed when the Calibration tab is selected This tabcontains functions which allow the generation of calibrations for use in quantitative analysis Up toeight different calibrations can be generated separately There could be for example 8 differentconstituents of the same material to be measured or 8 separate calibrations of different materialsQuantitative analysis can be done in one of two ways First it can be done in a simplified programdedicated to quantitative analysis See Section 62 for more information Second it can be done inthe absorbance panel under the analysis heading See Section 427 for more information
Calibrations are generated using the Calibration Wizard described in Section 552
Figure 24 The Calibration Setup Tab
8132019 InfraSpec Manual
httpslidepdfcomreaderfullinfraspec-manual 3152
551 Current Calibrations Saving and Loading CalibrationsThe current loaded calibrations are shown in the middle of the Setup Panel in the Calibration tabThese are the calibrations that can be used in the current experiment Calibrations can be savedand loaded one at a time by using the appropriate button below the current calibrations Thismakes it possible to use any number of calibrations for the InfraSpec although only 8 can bepresent in the program at any given time Up to eight calibrations can be loaded into the
program however only 4 can be displayed simultaneously in the simplified program (See Section62 for more information)
552 Creating a CalibrationIn order to begin a calibration press a calibration button at the bottom of the setup panelUsually if only one calibration is desired calibration 1 is used Pressing the calibration button willbring up the Calibration Wizard shown in Figure 25 Clicking Next continues to the next stepClicking Back return you to a previous step and Cancel will close the wizard without savingany calibration
Figure 25 Calibration Wizard Step 1
5521 Calibration Wizard Step 1On the first step of the Calibration Wizard there is a button that allows the user to reset thecurrent calibration Pressing this button will completely clear the calibration data for theselected calibration Note that this will permanently delete the selected calibrationStep 1 also asks to choose the type of calibration desired
A standard calibration uses peak or area measurements in combination with baseline
correction to generate a calibration curve PLS or Partial Least Squares regressioncalibrations use a more complicated mathematical approach to the calibration This type ofcalibration can generate better results especially if the desired measurement peak containsinterferences or cannot be calculated well with a typical area measurement
Due to the complicated nature of this type of calibration please contact Wilks Enterprise Inc ifa PLS type calibration is desired The standard calibration steps will be described firstfollowing with the PLS calibration steps Note that Steps 1 and 2 are the same for both types ofcalibrations Click Next to continue
8132019 InfraSpec Manual
httpslidepdfcomreaderfullinfraspec-manual 3252
5522 Calibration Wizard Step 2The second step of the Calibration Wizard can be found in Figure 26 below Enter the name ofthe calibration to be measured along with the units of the measurement In addition specifythe precision of the measurement This is the number of significant digits that the final result
will be rounded to
Figure 26 Calibration Wizard Step 2
5523 Calibration Wizard Step 3 (Standard)The third step of the calibration wizard is shown in Figure 27 Enter the type of calibrationeither Area of Region or Peak Value If area of region is used enter the wavelength range
that the area measurement is to be calculated from If peak value is used enter the peak valueto be used for the calibration
Figure 27 Calibration Wizard Step 3 (Standard)
8132019 InfraSpec Manual
httpslidepdfcomreaderfullinfraspec-manual 3352
5524 Calibration Wizard Step 4 (Standard)The fourth step of the Calibration Wizard can be found in Figure 28 In this step choose thebaseline correction and enter the ranges that the correction will be calculated on For baselinecorrection two ranges are required For force region to zero one range is needed If a singlepoint is desired enter the sample value for start and end values See Section 422 for moreinformation on baseline correction
In addition interpolation and crosstalk correction for the calibration can be selected here Thiswill select the corrections to be done before a spectrum is analyzed In most casesinterpolation should be left on and crosstalk correction should be left off See Section 531 formore information on interpolation and crosstalk correction
Figure 28 Calibration Wizard Step 4 (standard)
5525 Calibration Wizard Step 5 (Standard)The fifth step of the Calibration Wizard can be found in Figure 29 In this step spectra arechosen to use as calibration spectra To add a calibration spectrum press the Add CalibrationSpectra button A list will appear containing all the spectra in the current experiment Choosethe desired spectra and press the Select located below the list The wizard will prompt you toenter a concentration value for each selection
Once a concentration values is entered press Continue A graph of the chosen spectracorrected using the baseline corrected values entered in step 4 of the wizard will appearCursors on the graph denote the area or peak value to be used for the calibration This graph
allows for a final check to make sure the spectrum and area regions are correct
The wizard will ask whether this spectrum is correct Click OK and the area or peak valuewill be automatically calculated and entered into the table shown on the calibration wizardpanel along with the concentration and sample and file name information In addition a pointwill be plotted on the graph of concentration vs area or concentration vs peak heightContinue adding calibration spectra in this manner until all have been entered Once this hasbeen completed click Next to go to the next step
8132019 InfraSpec Manual
httpslidepdfcomreaderfullinfraspec-manual 3452
If data points are incorrect or need to be removed highlight the point or points on the table andclick Remove Sel From Table The selected points will be removed from the table and thegraph to the right
Figure 29 Calibration Wizard Step 5 (Standard)
5526 Calibration Wizard Step 6 (Standard)The sixth step of the calibration wizard can be found in Figure 30 In this step the calibrationcurve is specified This curve will be used to calculate concentration values for this calibrationFirst choose the fit type either Linear Linear w Zero Intercept or Exponentialrdquo ldquoDoubleExponentialrdquo ldquoCubic Splinerdquo and ldquo2
nd Deg Polynomialrdquo
Once the fit type has been selected press the Generate Fit Curve button The desired fit willbe displayed on the graph and information about the fit can be found in the lower right sectionof the graph RMSE stands for Root Mean Squared Error and is a goodness of fit measurethat can be used to compare different calibration fits
If the fit is incorrect it can be removed with the Clear Fit Curve button Once the desired fithas been placed on the graph click Next to continue If you are unsure which curve functionto use contact Wilks Enterprise Inc for assistance
It is also possible to ldquoCross Validaterdquo the fit by pressing the ldquoCross Validaterdquo button In order touse this feature first select the number of calibration points to leave out This should be equalto the number of replicates of the same concentration entered in Step 5 previously When
ldquoCross Validaterdquo is pressed the program will leave out each successive concentration level andgenerate a fit curve without a given concentration level The fit curve generated will be used topredict the value(s) of the left out calibration points This allows a more robust prediction of theperformance of the calibration curve It is possible to omit the endpoints in the cross validationby checking the appropriate checkbox Since curve fitting works best interpolating theendpoints will include more error as the calibration curve must extrapolate in order to predictthese values
8132019 InfraSpec Manual
httpslidepdfcomreaderfullinfraspec-manual 3552
Figure 30 Calibration Wizard Step 6 (Standard)
5527 Calibration Wizard Step 7The next calibration step is shown in Figure 31 In this step further calibration options arechosen Passfail ranges can be set and calibrations can be set to only run separate of othercalibrations Options in this step will affect only the Quantitative Analysis Simple ProgramSee Section 62 for more information on this program
The passfail range option allows a calibration to not only print a concentration but alsoindicate whether a sample is within preset limits In order to use the pass fail ranges firstselect the passfail range to ldquoONrdquo or ldquoON with no numeric datardquo The latter option will displayonly passfail indication and no numeric concentration will be displayed in the Quantitative
Analysis Simple Program
After passfail range has been turned on select the concentrations for low failure low passhigh failure and high pass results If a sample concentration is below the low failure point orabove the high failure point the result will indicate a failure If the sample concentration isbetween the low pass and high pass point the result will indicate a pass If the sampleconcentration lies between the low failure and low pass or high failure and high pass amarginal result will be indicated This will usually mean that the result should be verified withanother sample or another method
In addition to the passfail range option this step also contains an option to set the calibrationto run separate of other calibrations This is usually necessary when a special background isrequired for an analysis If this option is set to ldquoyesrdquo then this calibration will not be allowed torun simultaneously with other calibrations in the Quantitative Analysis Simple Program
8132019 InfraSpec Manual
httpslidepdfcomreaderfullinfraspec-manual 3652
Figure 31 Calibration Wizard Step 7
5528 Calibration Wizard Step 8This is the final calibration step which is shown in Figure 32 below This step informs the userthat the Calibration is complete No further action is required Press the Save Calibrationbutton to exit the calibration wizard and save all changes The calibration will appear in theCalibration Tab as shown in Figure 24
Figure 32 Calibration Wizard Step 8
553 PLS CalibrationsIn addition to the standard calibration the InfraSpec program allows for a Partial Least Squares(PLS) type of calibration These calibrations are many times more robust especially if there areinterferences close to the desired measurement region The InfraSpec software does notsupport generating PLS calibrations directly within the program Instead Wilks Enterprise Inccan be contacted to help facilitate this type of calibration Wilks Enterprise Inc can provide the
8132019 InfraSpec Manual
httpslidepdfcomreaderfullinfraspec-manual 3752
calibration files needed to complete the PLS calibration wizard In addition advanced users cangenerate calibration files using third party software Contact Wilks Enterprise Inc for moreinformationNote Steps 1 2 7 and 8 are the same as for the standard calibrations so they are omittedbelow See Section 552 for information on these steps
5531 Calibration Wizard Step 3 (PLS)The PLS Calibration Wizard Step 3 can be found in Figure 33 below In this step the Slope
Array (denoted B) is loaded Click Choose Calibration File to navigate to the file given byWilks Enterprise Inc or generated on third party software If the correct file is chosen thecalibration point numbers will appear in the table to the right The intercept value should alsoappear the correct location
Figure 33 Calibration Wizard Step 3 (PLS)
5532 Calibration Wizard Step 4 (PLS)The PLS Calibration Wizard Step 4 can be found in Figure 34 below In this step choose anypretreatment to be done on the spectra before calculation Currently only mean centering issupported however future versions of the program may contain more pretreatment optionsSelect the pretreatment type if any click Next to continue Note that the final Step 6 is theSame as Step 7 of the standard calibration
8132019 InfraSpec Manual
httpslidepdfcomreaderfullinfraspec-manual 3852
Figure 34 Calibration Wizard Step 5 (PLS)
56 Simplified Program TabThis tab contains settings that affect the Materials Verification Simplified program mode Figure 35below shows the setup of this tab
Figure 35 Simplified Program Setup Tab
561 Materials Verification Setup
This group of controls affects the Materials Verification Simplified Program only See Section 63for more information on the Materials Verification Simplified Program
5611 Largest Acceptable Deviation ValueThis control sets the largest deviation allowed that still will result in a pass This result isdirectly related to the Match Method below The deviation value is the value that would beobtained by running a spectral comparison in the standard program The Compare function isuseful in deciding what this value should be set to by comparing spectra from a standardspectrum (See Section 421 for more information on spectral comparison) This value is set to
8132019 InfraSpec Manual
httpslidepdfcomreaderfullinfraspec-manual 3952
70 on the percentage passfail scale so that values above this level are failing and valuesbelow are passing
5612 Match MethodThis control sets the method that the materials verification will use to match a data spectrumwith the reference The match methods are described in detail in Section 421 Note that the
match method chosen affects the largest acceptable deviation value since this value willchange depending on the match method used
5613 Range LimitsIf the Range Limits control is set to ON entry boxes will appear that allow a start and endrange for the verification to work on This allows for a verification to be done on a part of thespectrum that is of interest instead of the whole spectrum
5614 No Sample ThresholdThis control if set to ON uses the variance of a data spectrum that has just been acquired totest whether there is a sample placed on the spectrometer If no sample is detected a warningwill appear and the match calculation will not proceed This is useful for preventing falseverification failures due to a user mistake of not putting sample on
The Threshold value is the sensitivity The default value of 100 is roughly a mediumsensitivity but this value may need to be changed depending on the type of materials to beverified If a false no sample report is given in the simplified program this number should beset to a lower value If a sample is not placed on the crystal and a no sample report is not
displayed in the simplified program then this number should be set to a higher value
562 Simplified Program SetupThese controls affect the Quantitative Analysis and Materials Verification simplified programsonly Each control is explained below See Sections 6 and 7 for more information on thesimplified programs
5621 Barcode ScannerSetting this control to ON makes another step in the simplified programs that asks for abarcode to be scanned in or entered manually This is useful if samples to be processedcontain a barcode as an identifier The barcode number will be saved in the spectrum note forthe log file which can be accessed in the standard program through the Spectrum Info panelonce the log file has been loaded into the experiment This panel is accessed by pressing theSel Traces button and clicking on the desired spectrum
5622 Help FilesThe simplified programs have a Help button which can be clicked by the user in order to bringup pertinent information to aid the user in using the instrument This help file can be anyMicrosoft Word text or Adobe pdf file The default file is this manual however manyapplications may require specific instructions If this is the case press Change Help File A
dialog will allow you to navigate to the correct help file Once the help file has been selectedthe directory to the help file will be displayed below the button
57 Verif Library TabThis tab allows the user to create modify and save different libraries used for materials verificationFigure 36 shows the Verification Library Tab below The current library is the library that will be usedby the Materials Verification simplified program The window on the left shows the spectra currently
8132019 InfraSpec Manual
httpslidepdfcomreaderfullinfraspec-manual 4052
contained in the library There is no limit to the number of spectra that can be added to the librarySpectra contained in this library are the spectra that a user in the simplified program will have thechoice of selecting as the reference material for verification If only one spectrum is contained in thelibrary the user of the simplified program will not have to choose a reference material Libraries canbe saved and reloaded as needed but the current loaded library will be the only active library in theMaterials Verification simplified program Each of the button controls on the tab will be explained
below
Figure 36 Verif Library Setup Tab
571 Add to LibraryClicking the Add to Library button will change the controls to library addition controls shown inFigure 37 below On the left side there is a list of spectra in the current experiment To add a
spectrum to the current library select the spectra desired from the list and click the Add button A dialog will ask for a name entry This allows spectra in the library to have a different namethan that of the spectrum used in the current experimentOnce all desired spectra have been added to the library clicking the Back button will return tothe normal library controls
Figure 37 Verif Library Addition Controls
8132019 InfraSpec Manual
httpslidepdfcomreaderfullinfraspec-manual 4152
572 Delete SelThis button will delete a spectrum from the library Select all the spectra to be delete and clickthis button to permanently delete the spectra from the current library
573 Load LibraryThis button will load a saved library into the current library Note that any spectra in the current
library before the load will still reside in the library In other words the spectra from the loadedlibrary will be added to the current library When this button is pressed a dialog will allow theuser to navigate to a library file
574 Save LibraryWhen this button is pressed a dialog will appear that allows the entry of a name for saving alibrary Note that the saving a library is different than saving the current library A saved librarywill not be loaded during the startup of the InfraSpec program In order to save the current libraryas the default press the Save as Default bottom button After this has been done the currentlibrary will be loaded on each InfraSpec program load including in the simplified program mode
8132019 InfraSpec Manual
httpslidepdfcomreaderfullinfraspec-manual 4252
6 Simplified Programs for Non-Technical Operators
61 IntroductionThe InfraSpec program allows for the use of the InfraSpec spectrometer by non-technical operatorsthrough the use of simplified programs containing minimal controls and steps Following the simplesteps allows for a fast and easy analysis using the InfraSpec spectrometer In many cases theseprograms are used daily and the standard program is simply used to set up the instrument Inaddition it is possible to have Wilks Enterprise Inc set up a simplified program in advance so that noset-up is required before use Contact Wilks Enterprise Inc for more informationThe two simplified programs available are Quantitative Analysis which is used to get a quantitativemeasure of up to four calibrations in a single run and materials verification which allows non-technical operators to easily test incoming shipments and verify the material is correct Each will beexplained below
611 Notes on BackgroundsIn both simplified programs running new backgrounds can be done at any time using the
Background button However the background can also be set to expire after a preset amountof time (see Section 5312) Once the background has expired users of the simplifiedprograms will have to run a new background before continuing If it is desired that the user run anew background after each sample then setting the maximum background age to 1 minute andusing at least 40 scans will ensure that the user will be prompted to do soIn addition the background quality can be checked with the ldquocheck backgroundrdquo button SeeSection 3312 for more information on the background checker In the simplified programs thecheck background button will display a number once completed If the number is greater than10 or less than -10 then the sample crystal should be thoroughly cleaned and the backgroundcheck re-run If the number is not within +- 10 on the second attempt it is recommended that anew background be run
62 Quantitative Analysis Simplified ProgramThe Quantitative analysis program allows for up to four calibrations to be measured in a samplesimultaneously by non-technical operators In order to set up a quantitative analysis simplifiedprogram first a calibration must be generated See Section 55 for more information on setting up acalibration Next in order to be able to access the quantitative analysis program the startup optionspanel must be selected and set to display the Quantitative Analysis button See Section 541 formore information Once InfraSpec program has been set up for the Quantitative Analysis SimplifiedProgram restart the InfraSpec Program and click the Quantitative Analysis program to start Thesteps involved in getting a quantitative result will be explained below
621 Step 1 Choose a CalibrationWhen the program first starts the screen shown in Figure 38 will be present The upper righthand side of the screen will contain information about what steps need to be taken to analyze a
sample Before acquriring spectra the calibrations to be used for analysis must be chosenClicking Choose Calibration will make the panel shown in Figure 39 appear Select at least oneand up to four calibrations to analyze and click OK Other calibrations can be chosen at anytime by selecting the Choose Calibrations button on the left side of the screen Note that while8 calibrations can be present in memory only 4 can be chosen to be analyzed and displayed atany given time Some calibrations may be set to run separately of other calibrations so thesecannot be selected with other calibrations
8132019 InfraSpec Manual
httpslidepdfcomreaderfullinfraspec-manual 4352
Figure 38 Quantitative Analysis Startup Screen
Figure 39 Choose Calibrations Panel
622 Step 2 Run a Background After choosing calibrations a background must be run in order to continue The sample button
will not be active until a valid background has been acquired Press the Background button torun a background See Section 3311 for more information on backgrounds A graphicaldisplay will show the background acquisition progress as shown in Figure 40 Pressing the StopScans button will reset back to Figure 38 without finishing the background acquisition Once thebackground has completed the default screen will return as shown in Figure 38 except that theRun Sample button will now be active
8132019 InfraSpec Manual
httpslidepdfcomreaderfullinfraspec-manual 4452
Figure 40 Background Acquisition623 Step 3 Run a SampleOnce a background has been acquired place a sample on the spectrometer fully covering thecrystal or place a sealed cell cuvette or IR card into a transmission model See section 3312for more information on placing a sample on the spectrometer Cover the sample with thesupplied plastic cover or optional stainless steel cover Once the sample has been placed on thespectrometer press the Run Sample button to begin sample acquisition If the barcodescanner option is selected the user will be prompted to scan a barcode or enter thebarcodesample ID number Otherwise the acquisition will begin and a screen similar to Figure40 will appear as the acquisition proceeds Once the spectrum has been acquired a screensimilar to Figure 41 will appear All selected calibrations (up to four) will be displayed in greyboxes with the calibration name and concentration
Figure 41 Sample Concentration Display
6231 Data LoggingNote OptionIf ASK is selected in the Data Log setup found in Section 5413 the Accept Results buttonwill be present at the bottom of the screen The log file for the current sample will not be saved
8132019 InfraSpec Manual
httpslidepdfcomreaderfullinfraspec-manual 4552
until this button is pressed This allows the user to disregard data that was taken erroneouslyNote that if the Accept Results button is not pressed no log file will be saved
If the data log setup is set to ASK wNote (see Section 5413) The note entry box will bedisplayed as well This allows for entry of explanations sample namesconcentrations or othercomments to be appended to the data log file To retrieve the notes open a log file in the
standard program and press the Sel Traces button Select the log spectrum that containsthe desired note and the Spectrum Info box will appear This box will contain the notesentered in the Simplified Programs
If the Run Sample or Run Background button is pressed before accepting the currentresults a warning will appear asking the user whether they really want to run a newsamplebackground without accepting the current results Once the Accept Results buttonhas been pressed it will become disabled and the notes entry box will disappear
6232 PassFail OptionIn addition to displaying the concentration it is also possible to display passfailmarginal data
See Section 5527 for more information on setting the passfail limits If this option is set theresult will be displayed as red (fail) yellow (marginal) or green (pass) as shown in Figure 42below In addition the passfail result will be displayed The concentration may or may not bedisplayed along with the passfail result depending on the options set Example results withthis option set are shown in Figure 42
Figure 42 PassFail Display Examples
8132019 InfraSpec Manual
httpslidepdfcomreaderfullinfraspec-manual 4652
624 Help and Exit buttonsPressing the Help button will open the help file either a pdf or text document as chosen in theSimple Program setup (see Section 5622) The default help file is this manual The ability tochoose a help file allows administrators to provide specific information for the analysis that theuser will be running
Pressing the Exit button will return the user to the startup screen
625 Reportrdquo Button A report button is provided to allow a user to print or save reports that include detailed data fromthe current sample or general data from any number of past samples When the button ispressed the window shown in Figure 43 will appear Pressing the Print Report button will printthe selected report automatically using the default printer for the computer Pressing SaveReport button will save the report a file
Figure 43 Generate Report Window
6251 Single Detail ReportIf a single report of the current sample is desired select Single Detail Report This report willcontain the information shown in Figure 44 below If the report is saved with the Save Reportbutton this file will be saved as an Adobe Acrobat pdf file
8132019 InfraSpec Manual
httpslidepdfcomreaderfullinfraspec-manual 4752
Figure 44 Detail Report Example
6252 Date Range ReportIf a report of past samples is required select the Date Range Report option Selectionmenus will appear that allow the selection of the date range specified Any log files located inthe current log folder that were created within the selected date range will be included in thereport An example of a date range report can be found in Figure 45 If the Date RangeReport is selected to be saved it will be saved as a comma separated value file that can beopened with Microsoft Excel or any other spreadsheet program
Figure 45 Date Range Report Example
8132019 InfraSpec Manual
httpslidepdfcomreaderfullinfraspec-manual 4852
63 Materials Verification Simplified ProgramThe Materials Verification simplified program can be used to verify that the correct material has beenreceived from a shipping depot or lab Any application where a known sample must be verified to bethe correct material can utilize this simplified program
In order to use this simplified program a materials library of a least one sample spectrum must be
created first See Section 57 for more information In addition other setup parameters must beentered See Section 5 for more details on the setup parameters used for the Materials VerificationSimplified Program The steps involved in verifying a material can be found below
631 Step 1 Run a BackgroundWhen the program first starts the screen shown in Figure 46 will be present The user will beprompted to run a background All buttons except the Run Background button will be disabledClick the Run Background button to acquire a background The background will begin a graphwill denote the background progress as shown in Figure 47 Pressing Stop Scans will halt theacquisition and no background will be saved
Figure 46 Materials Verification Startup Screen
Figure 47 Materials Verification Background Acquisition
8132019 InfraSpec Manual
httpslidepdfcomreaderfullinfraspec-manual 4952
632 Step 2 Choose a Material After a background has been acquired press the Choose Material button to bring up the screenshown in Figure 48 Select the material type from the library list and then press Select Ascreen will display the material to be verified as shown in Figure 49
Figure 48 Choose Material Screen
Figure 49 Ready to Verify Screen
633 Step 3 Run a Sample After a selecting the material to verify place a sample on the spectrometer and click RunSample Sample acquisition will begin and a graph will display progress Once the sample hasbeen acquired and verified a screen similar to either Figure 50 or Figure 51 depending onwhether the sample was verified or not will appear
The green or red box will state whether the material was verified and in addition will give detailsabout the spectral match The Match Method is the method that was used to verify the materialeither subtraction mean centered subtraction or mean centered unit variance subtraction
8132019 InfraSpec Manual
httpslidepdfcomreaderfullinfraspec-manual 5052
The Largest Acceptable Deviation Value is the highest deviation value that will still give a verifiedresult This is set by the administrator in the setup panel (see Section 561) The Percent Matchis a closeness of fit parameter based on the deviation value and largest acceptable deviationvalue The largest acceptable deviation value is set to a percent match of 70 percent and adeviation value of zero (perfect fit) is set to 100 This makes any value below the largest
acceptable deviation value have a passing grade of 70 or above Values above the largestacceptable deviation value will have a failing grade below 70 In addition to this scale theactual deviation value found is printed as well
Depending on the settings chosen for data logging the Accept Results button may be presentIf so this button must be pressed in order to save a log file This prevents undesired resultsstemming from operator mistakes etc from being saved as a log file In addition a notes areamay be present that allows the entry of notes about the sample Once the Accept Resultsbutton has been pressed it will become disabled and the note entry box will disappear
Figure 50 Material Verified Screen
Figure 51 Material Not Verified Screen
8132019 InfraSpec Manual
httpslidepdfcomreaderfullinfraspec-manual 5152
7 Spectrometer Specifications
Dimensions 275rdquo x 60rdquo x 65rdquo 7 cm x 1525 cm x 165 cm
Weight 30 lbs 14 kg ( total with standard ATR plate )
PC Interface RS-232 or USB
Power Requirements 12V DC 20 amps
Power Supply Universal ACDC converter type (supplied as standard)
Detectivity D 10 Hz 15-10 (cmHz)
W
Suggested Temp Operating Range 15oC - 60oC
Humidity 0 ndash 98 relative humidity (non-condensing)
Detector Array 128 Pixel linear pyroelectric array
Standard Spectral Ranges 25-5 983221m (2000-400 cm-1
) 53-108 983221m (1890-925 cm-1)
)7-14 983221m (1430-710 cm
-1))
Resolution 25 cm-1
ATR Crystal Material Cubic Zirconia Zinc Selenide or Zinc Sulfide
ATR Surface Size 50 x 16 mm
of Reflections 10
8132019 InfraSpec Manual
httpslidepdfcomreaderfullinfraspec-manual 5252
8 Service and Technical Support
Your InfraSpecreg VFA-IR Spectrometer may have been purchased either directly from Wilks Enterprise or
from a local dealer or representative In cases of any difficulties or problems associated with operation
you are recommended to contact your local representative or dealer first If the analyzer was purchaseddirect or if there are problems that are unanswered by the local representative or you have a technicalquestion relative to the operation of the instrument or relative to the analysis please contact WilksEnterprise at the contact address provided below
Customer Services DepartmentWilks Enterprise Inc25 Van Zant StreetSuite 8FEast Norwalk CT 06855
Telephone (203) 855-9136FAX (203) 838-9868E-mail techWilksIRcom
Service and Repair
During the warranty period Wilks Enterprise Inc offers free factory service for all failures that occur fromnormal instrument usage The user is only required to cover the cost of shipping the instrument to the factory After the warranty period the user is required to cover the factoryrsquos cost of servicing plus all shipping chargesNormal one week turnaround is offered for all InfraSpec instruments that are returned to the factory forservice For users requiring faster service times Wilks Enterprise also offers an advance replacementprogram that can respond to a userrsquos needs with instrument replacement typically in less than 24 hours Forextended service contracts advanced replacement programs factory service charges please contact WilksEnterprise Inc for details
Please note As we get feedback from our customers we will upgrade the software and the manual and send updates Your
comments and suggestions will be greatly appreciated For comments software updates or manual updates please send your email information to infowilksIRcom and note that you want to be put on the InfraSpecCustomer list

8132019 InfraSpec Manual
httpslidepdfcomreaderfullinfraspec-manual 1352
is covering the whole crystal completely and then press the Sample button In addition ifpowders are used with an ATR sample stage the powders must be finely ground and a weightmay need to be used in order to get good crystal contact
Note Excessive weight or pressure on the ATR crystal can crack or damage the crystalContact Wilks Enterprise Inc if you are unsure as to how much pressure to apply to the
crystal Wilks Enterprise is not responsible for damage to the crystal by the customer (seeenclosed warranty)
For the transmission version fill the sealed cell cuvette or IR card according to manufacturersspecifications and place into the sample holder
While acquiring a sample spectrum the graph will show the current average spectrum for thenumber of scans acquired so far as shown in Figure 7 Note that the sample acquisition can bestopped at any time by pressing the Stop Scans button which appears to the right of theCollect heading during acquisition If this button is pressed no sample is savedOnce sample acquisition has completed a dialog will allow the entry of a spectrum name Thisname must be unique and not contain or + and must have 1-22 characters After thespectrum name is entered the spectrum will appear on the graph along with a legend which
shows the spectrum name Spectrum names must always be in quotes in this entry box
Figure 7 Sample Acquisition
332 The Experiment GroupThis heading contains the Save Spectra Load Spectra New Exp and Setup buttonsThese controls allow you to load InfraSpec spectra into the current experiment save spectra in avariety of formats start a new experiment and adjust the settings for the InfraSpec program
3321 Saving SpectraThe Save Spectra panel shown in figure 8 below can be accessed by pressing the SaveSpectra button There are two basic file types to save a spectrum or group of spectra in theInfraSpec program InfraSpec type spectra and text spectra Both will be explained below
8132019 InfraSpec Manual
httpslidepdfcomreaderfullinfraspec-manual 1452
8132019 InfraSpec Manual
httpslidepdfcomreaderfullinfraspec-manual 1552
Figure 9 Save as Text Panel
3322 Loading Spectra
Spectra can be loaded into the InfraSpec program if they are in the InfraSpec format To loadspectra press the Load Spectra button and select the file to load After selecting the file thespectra within the file will be displayed in the graph area The loaded spectra will now be partof the current experiment
3323 Starting a New ExperimentIn order to clear all data spectra and temporary settings a New Experiment may be startedThis is done by selecting the New Exp buttonNote Starting a new experiment will permanently delete all spectra that have not been savedin the current experiment
3324 Experiment SetupPressing the Setup button will access all of the setup options for the spectrometer and
program Please refer to Section 5 for more information on the setup panel
333 The Display GroupThis group of controls contains functions for displaying spectra in various formats and scaling theviewable area of the graph In addition the Absorbance Panel can be accessed via thesecontrols (see Section 4 for more information on the Absorbance Panel
3331 The Autoscale ButtonThe autoscale button scales the spectra in the current top window so that every trace on thegraph is entirely visible This is the default view for the graph window
3332 The Set Scale Button
The Set Scale button sets the x and y scale of the graph using the Axis Scaling Panel shownin Figure 11 below After the numbers are entered for the scaling Press OK to set the graphwindow to the selected scale or Cancel to return to the previous scale
3333 The Sel Traces ButtonThe Sel Traces button brings up the Select Spectra panel as shown in Figure 10 Severaloptions can be accessed from this panel including displaying spectra displaying spectra as atable deleting spectra renaming spectra and restoring processed spectra Each will beexplained below If a spectrum is clicked in the spectral list box a spectrum info panel will
8132019 InfraSpec Manual
httpslidepdfcomreaderfullinfraspec-manual 1652
appear to the left of the Select Spectra panel This panel displays information about thecurrent spectrum
1 Displaying SpectraThe Display button control displays the selected spectra on the current top window (either theMain Panel or the Absorbance Panel) Spectra that are not selected will be removed from the
graph window if they were previously displayed
2 Displaying Spectra as a TableThe Table button will display the selected spectra in a table format This table can be copiedinto spreadsheets or other programs for further processing or displaying The format of thedata is dependent on the current top window and x scaling For instance if the Main Panel isdisplayed and the x scaling is wavelength the table will display an x column in wavelength anda y column in reflectancetransmittance
3 Deleting Spectra from the experimentThe Delete button deletes spectra from the current experiment Deleting absorbance spectrawill delete transmissionreflectance spectra as well and vice versa Note Spectra that havenot previously been saved will be permanently deleted
4 Renaming SpectraThe Rename button renames spectra and their corresponding absorbance and differencespectra will be renamed as well The new name must be unique and not contain or + andmust have 1-22 characters
5 Adjusting the Spectrum Scale (Main panel only)The Adj Scale button will adjust the wavelength limits of the selected spectra This is usefulin cases where the current scale is not correct or is inaccurate
6 Restoring Processed Spectra (Absorbance panel only)The Restore button will restore any processed spectra in the Absorbance Panel Note thatthis button will only appear in the Select Spectra panel if the Absorbance Window is on topRestoring spectra will permanently remove any baseline corrections that have been done onthe spectra
7 Averaging Spectra (Absorbance panel only)The Average button will make an average of any selected absorbance spectra It is possibleto select a
6 Closing the Select Spectra PanelPressing the Done button or the X box in the upper right of the window will close the paneland return the current top window
8132019 InfraSpec Manual
httpslidepdfcomreaderfullinfraspec-manual 1752
Figure 10 Select Spectra Panel
3334 The Abs PanelMain Panel ButtonThe Abs Panel button on the top bar of the Main Panel will bring the Absorbance Panel tothe top so that spectra can be viewed and processed in absorbance Similarly the Main
Panel button on the top bar of the Absorbance Panel will bring the Main Panel to the top forspectra collection and display in transmittancereflectance
34 Top Menu ControlsSecondary controls that cannot be accessed via the top bar buttons can be found in the menucontrols at the top of the screen Each active InfraSpec menu function will be explained in detailbelow Please refer the Igor Pro manual for more information on the disabled Igor menus
341 The InfraSpec Menu
3411 Show MainAbsorbance Panel
These selections either select the Main Panel or the Absorbance Panel as the top windowsimilar to the button control Main Panel and Abs Panel
3412 Open ManualThis menu selection will open this pdf manual
3413 Version InfoThis menu selection will open a panel that displays the current version and date along withupdate information
3414 QuitQuits the InfraSpec Program Note that any unsaved spectra in the current experiment will bedeleted
342 Tools Menu
3421 Select SpectraOpens the Spectra Selector panel just as the top menu button Sel Traces does SeeSection 3333 for more information
8132019 InfraSpec Manual
httpslidepdfcomreaderfullinfraspec-manual 1852
3422 Select BackgroundOpens the Background Select Panel as shown in Figure 11 below This panel allows theoption to either display the selected background on the with the Display button on the currenttop graph window or select a background as the currently active background by using theSelect button This will make all subsequent sample collections use this background untilanother is chosen or a new background is run This is not necessary under normal
circumstances
Figure 11 Select Background Panel
3423 Start Continuous ScanningThis menu item begins continuous scans The display will show a spectrum referenced to thecurrent background which is updated in real time This is useful for qualitative analysis ofsamples that may change in concentration or chemical composition
3424 Start Test ScansStarts instrument test scans Each raw data scan coming from the spectrometer will bedisplayed in the graph window of the Main Panel This is useful for troubleshooting anddiscerning weak or non-functioning pixels In addition this function may be used for qualitativeprocess monitoring
343 The Display Menu
3431 Autoscale Both Axes Autoscales top graph window to both axes This is the same function as the Autoscale buttonon the top control bar under the Display heading
3432 Autoscale X Autoscales the X axis only
3433 Autoscale Y Autoscales the Y axis only
3434 Autoscale Y from Zero Autoscales the Y axis from zero to the maximum of all displayed spectra
8132019 InfraSpec Manual
httpslidepdfcomreaderfullinfraspec-manual 1952
3435 Set ScaleOpens the Axis Scaling panel for manual scale setting This is the same function as the SetScale button on the top control bar under the Display heading
3436 Copy Graph as PictureCopies the current top graph as a picture into the clipboard for pasting into other programs
This will only copy the graph portion of the top panel and is useful for presenting data Notethat a graph panel must be currently on top to use this function
344 The InfraSpec Setup Menu
3441 Setup PanelOpens the Setup Panel See Section 5 for more information on the Setup Panel
3442 ShowHide Igor MenusEnables or Disables the Igor Menus By default the Igor menus are disabled See the Igor Promanual for more information on these menu items
3443 Correct Screen Resolution After display settings have been changed in the computer running the InfraSpec program suchas after an external monitor is connected to a laptop it may be necessary to select this functionin order to redraw the program windows to the correct size for the new screen resolution
3444 Show Command History WindowShows the Igor Pro command window for manual entry of commands See the Igor Promanual for more information
3445 Restore Factory Default SettingsRestores the default settings for the InfraSpec program This should only be used if there areproblems with settings or if a new spectrometer is attached and the settings must be
completely reset
35 CursorsOn the bottom of the Main and Absorbance Windows a white bar contains the two cursors that canbe used for identifying points on a spectrum called the A and B cursors In order to activate a cursoruse the mouse to drag the circle A cursor or square B cursor onto a trace on the graph The whitebar will give X and Y coordinates as well as information about the distance between the two cursors ifrelevant
Cursors are also used in the Absorbance window for selecting areas and peaks for spectralprocessing See Section 4 for more information about the processing functions that use cursors
8132019 InfraSpec Manual
httpslidepdfcomreaderfullinfraspec-manual 2052
4 The Absorbance Panel
41 IntroductionThe Absorbance Panel is similar in many aspects to the Main panel A top control bar contains mostof the same functions as those in the Main Panel with the exception that the Collect heading isreplaced by an Analyze heading
The graph window displays spectra in absorbance rather than the transmissionreflectance spectradisplayed in the Main Panel See Figure 12 below
The Analyze heading contains controls that process and analyze selected spectra in the experimentNote that absorbance spectra reside separately from the transmissionreflectance spectra so anyspectral processing can be undone by using the Restore button in the Select Spectra Panel (seeSection 3333)
Figure 12 The Absorbance Panel
42 The Analyze HeadingThis heading is where all spectral processing and analysis takes place The functions that can beused are Compare Baseline Correction Peak and Area Difference Spectra Quantitative AnalysisTo select a function click the checkbox next to the function name and a panel to the right of the
Analyze
421 CompareSelecting the Compare checkbox will open the menu controls shown in Figure 13 This functionallows a comparison between a reference and any amount of other spectra as chosen by selectingspectra on the right hand side of the graph After selecting the spectra and reference to comparepress the Compare button to bring up the comparison table shown in Figure 14 below
8132019 InfraSpec Manual
httpslidepdfcomreaderfullinfraspec-manual 2152
Figure 13 Comparison Panel
Figure 14 Comparison Table
The table shown in Figure 13 contains 3 calculations which gauge the closeness of the selectedspectrum and the reference spectrum Each calculation is a subtraction after variouspreprocessing Each will be explained belowNote In the following formulas A=[a1a2 an ] ie lower case symbols are scalars upper casesymbols are vectors (spectra) See for example ldquoChemometricsrdquo Sharaf Illman and KiowalskiWiley 1986
4211 Subtraction FitCalculates the point by point subtraction and squares the sum
F=sum(R-A)2
Where F is the Subtraction Fit value R is the Reference spectrum and A is the comparisonspectrum
4212 Mean Center Subtraction FitCalculates the point by point subtraction and squares the sum after the spectra have beenmean centered If the mean of the absorbance spectrum is ā then
ā=1nsumai
8132019 InfraSpec Manual
httpslidepdfcomreaderfullinfraspec-manual 2252
Where ai is an individual pixel absorbance value and n is the number of data points (pixels)The mean centered spectrum is then defined as
A=A- ā
Where A is the mean centered comparison spectrum and A is the original comparison
spectrum The resulting Mean Center Subtraction Fit G is calculated as
G=sum(R-A)2
Where R is the mean centered reference spectrum
4213 Mean Centered Unit Variance Subtraction FitCalculates the mean centered spectrum similar to 4212 and then autoscales this result bydividing the resulting mean centered spectrum by the variance of the spectrum The variance
s is defined as
s2=
1n-1sum(ai-ā)
2
The resulting variance is then divided by the mean centered spectrum as follows
A=(A- e)s
Where A is the mean centered unit variance comparison spectrum The mean centered unitvariance fit H can then be calculated as
H=sum(R-A)2
Where R is the mean centered unit variance reference spectrum
422 Baseline CorrectionSelecting the Baseline Correction check box will open the baseline correction tools shown inFigure 15 below These functions are useful for removing artifacts from spectra
Figure 15 Baseline Correction Controls
To baseline correct spectra ensure that the desired spectra are displayed in the absorbancepanel graph window Then place cursors onto a displayed spectrum and press the IncludebuttonThe range that has been chosen will be highlighted yellow on the graph panel Alternatively arange can be manually entered using the Range entry boxes To clear all selected regions press
8132019 InfraSpec Manual
httpslidepdfcomreaderfullinfraspec-manual 2352
the Clear Region button To exclude only part of a region place the cursors on the desiredregion to exclude and press the Exclude button The excluded region will no longer behighlighted in yellowOnce a desired region has been selected the Force Reg to Zero or Baseline Correct can bepressed to complete the baseline correction Force Reg to Zero shifts the entire spectrum sothat the average value of the selected region is zero Baseline Correct calculates a linear fit
across the selected region and then shifts the spectrum so that the calculated fit line has zeroslope and intercept
423 Peak and AreaSelecting the Peak and Area checkbox will open the baseline correction panel shown in Figure16 below This function calculates the peak location peak absorbance value and area of aselected region
Figure 16 Peak and Area Controls
In order to calculate the peak and area values first display the desired spectra to be analyzed onthe absorbance graph window Then select a region using the cursors at the bottom of the screenor alternatively use the manual range entry boxes Once the desired region is selected press theInclude button The selected region will be highlighted in yellow To clear the region press theClear Region button
Once the desired region has been selected and included the Peak and Area of Region buttoncan be pressed in order to bring up the table shown in Figure 17 below This table includes thepeak location peak absorbance value and the area of the selected region along with analysis
details The data from this table can be copied and pasted into another program for furtherprocessing
Figure 17 Peak and Area Table
424 Difference SpectraSelecting the Difference Spectra checkbox will open the difference spectra controls shown inFigure 18 These functions are useful for subtracting one spectrum from another In order to
8132019 InfraSpec Manual
httpslidepdfcomreaderfullinfraspec-manual 2452
difference spectra first choose a reference spectra or minuend This is the spectrum that will besubtracted from the sample spectrum
Next choose the sample spectrum or subtrahend Once both spectra have been chosen thesubtraction slider can be used to choose the correct subtraction weight The subtraction weight isthe percent of the reference spectrum that is subtracted from the sample spectrum As the slider
is moved the resulting difference spectrum is displayed in the graph window Additionally thesubtraction weight can be entered manually in the entry box or adjusted with the up and downarrows to the right of the entry box
Note that the original spectra are not affected by generating a difference spectrum Differencespectra are separate entities and can be displayed in the absorbance window much likeabsorbance spectra Difference spectra take the name of the sample spectrum with _diffappended at the end of the name
Figure 18 Difference Spectra Controls
425 Quantitative AnalysisSelecting the Quantitative Analysis checkbox opens the controls shown in Figure 19 Thesefunctions allow quantitative analysis within the standard program In order to use these functionsat least one calibration must be created See Section 55 for information on how to generate acalibration Note that a simplified quantitative analysis program allows for quantitative analysis byuntrained personnel See Section 62 for more information on the simplified quantitative analysisprogram
Figure 19 Quantitative Analysis Controls
In order to quantitatively analyze spectra in the current experiment first choose a calibration orcalibrations to analyze for Up to eight calibrations can be analyzed at the same time Once thedesired calibrations are selected select the spectra to be analyzed using the list box to the right
8132019 InfraSpec Manual
httpslidepdfcomreaderfullinfraspec-manual 2552
All or no spectra can be selected using the Sel All and Sel None buttons below the list boxMake sure that the spectra to be analyzed are appropriate for the calibration selected to ensurecorrect quantitative values
After selecting calibrations and spectra to be analyzed press the Analyze button This will bringup a table similar to that shown in Figure 20 Each spectrum name is displayed and the resulting
concentrations for each calibration are shown in the appropriate column The data from this tablecan be copied and pasted into another program for further analysis
Figure 20 Quantitative Analysis Table
8132019 InfraSpec Manual
httpslidepdfcomreaderfullinfraspec-manual 2652
5 The Setup Panel
51 IntroductionThe setup panel accessed either from the Setup button under the Experiment heading in the mainand absorbance windows or from the Setup Panel menu item under the InfraSpec Setup menucontains all of the functions for setting up and customizing the InfraSpec program In additionCalibrations can be generated and Libraries for Materials Verification can be built This sectiondescribes all of the setup options available
The setup panel contains several tabs with different controls in each along with a set of buttons atthe bottom that are available in every tab Each tab will be explained separately below
52 Bottom ButtonsThe buttons found at the bottom of the setup panel are available in every tab of the setup panel andare shown in Figure 21 below These buttons are used for saving the changes that have been madein the setup panel The changes can be either saved for use only in the current experiment using the
Save For This Session button or saved as the default setup so that every experiment will use thecurrent settings with the Save Setup as Default button
Figure 21 Bottom Setup Panel Buttons
521 Save For This Session ButtonThis button allows temporary changes to be made to a current experiment without affecting the
default values for subsequent experiments This option is useful for changing a setting for aspecific experiment such as adjusting the number of scans or changing the x-axis units Whenthis button is pressed the setup panel is closed and the values changed in the setup panel willtake effect for the current experiment
522 Save Setup as Default ButtonThis button allows permanent changes to be made to the setup values This is useful for the initialsetup of the spectrometer or for changes that will be used many times When this button ispressed the setup panel will close and all subsequent experiments will use the settings chosen asdefault settings
523 Revert to Default SetupThis button reverts all settings to the default values as chosen the last time the Save Setup asDefault button was pressed This is useful to change back many settings made temporarily Inaddition it is useful to revert to the default setting if problems are occurring that may be due tochanges in the Setup Panel
524 Cancel ButtonThis button closes the Setup Panel and cancels any changes made to the setup panel since it wasopened Note that calibrations are left unchanged by the Cancel button
8132019 InfraSpec Manual
httpslidepdfcomreaderfullinfraspec-manual 2752
53 General TabThis tab contains basic setup controls for the spectrometer and experiment The controls shown inFigure 22 will be displayed when this tab is selected or the Setup Panel is first opened
Figure 22 General Setup Tab
531 Experiment Setup HeadingThis heading contains controls used for the setup of the InfraSpec program and experiment Eachcontrol is explained below
5311 of ScansThis control selects the number of scans that a background and sample spectrum will beaveraged from The higher the number of scans the lower the resulting spectral noise Eachscan takes approximately 15 seconds so a setting of 40 scans will allow a spectrum to becompleted in approximately 1 minute 40 Scans is recommended for most applications
5312 Max Bkgd AgeThis option selects the maximum age of a background scan In the standard program awarning will pop up once the background has expired however the user may still run aspectrum using the expired background In the simplified Quantitative Analysis and MaterialsVerification programs the user must run a new background the current background hasexpired This setting can be set to off as well to never warn that the background has expired
5313 X UnitsThis control selects the units used for the X-axis either microm (microns) or cm-1 (wavenumber)
5314 InterpolationThis control selects whether the spectra displayed are interpolated The interpolation is donevia a cubic spline algorithm The number of points in an interpolated spectrum is 1280
8132019 InfraSpec Manual
httpslidepdfcomreaderfullinfraspec-manual 2852
5315 Crosstalk CorrectionCrosstalk correction is a proprietary correction algorithm that attempts to eliminate crosstalkbetween pixels due to incorrect illumination from imperfectly collimated source light as well asfrom thermal crosstalk between pixels The result is an increase in apparent resolution Thisshould be used for qualitative analysis where the most spectral detail is desired It is notrecommended for quantitative analysis or materials verification
5316 Ask to SampleThis option allows the selection of an extra step before sampling or running a background Ifthis is set to ON when the Sample or Background button are pressed a pop up will ask if theuser is ready to run a new spectrum This prevents an accidental spectrum or backgroundfrom occurring When the selection is set to OFF a background or sample spectrum willimmediately begin after the correct button is pressed
5317 Trace TagsTrace tags will appear on the Main panel and Absorbance panel when a spectrum is clicked inthe graph pane The tag can show the sample name of the spectrum clicked by setting thetrace tags option to ldquoNotes Onlyrdquo or it can show details spectrum information by setting theoption to ldquoDetailedrdquo The tags can also be turned off here
5318 Save FolderThis setting selects the default folder to be opened when a spectrum is saved or loaded IfInfraSpec_Data is selected every time the Save Spectra or Load Spectra button ispressed the InfraSpec_Data folder will be the start folder in the saveload dialog If LastFolder Used is selected the folder that was last navigated to on a load or save will be the startfolder in the saveload dialog
5319 CompanyThis control sets the company that is using the spectrometer This name is reported in log filesand reports
53110 AddressThis control sets the company address for the company using the spectrometer This addressis reported in log files and reports
53111 OperatorThis control sets the company address for the company using the spectrometer This name isreported in log files and reports
532 Spectrometer Setup HeadingThis heading contains controls used for the setup of the InfraSpec spectrometer hardware Eachcontrol is explained below
5321 microm at First and Last PixelThe wavelength values located at the back of the instrument should be entered here Thisensures that the spectra collected will have the correct x-units
5322 Sample StageThis allows the selection of the sample stage type either ATR or Transmission This ensuresthat the y axis contains the correct units and that the crosstalk correction values areappropriate for the sample stage of the selected spectrometer
8132019 InfraSpec Manual
httpslidepdfcomreaderfullinfraspec-manual 2952
5323 Serial PortThis setting selects the current serial port that the InfraSpec is connected to If thespectrometer is connected correctly and the program does not recognize the spectrometer theserial port may be incorrectly set Use this setting to change the serial port and then use theConnect Spectrometer menu item under the InfraSpec Setup menu to connect thespectrometer This can also be used to select between different instruments if multiple
spectrometers are connected to the same computer
54 The System TabThe controls shown in Figure 23 will be displayed when the System tab is selected This tabcontains setup controls for program startup and logging
Figure 23 System Setup Tab
541 Startup HeadingThese functions control how the program starts depending on whether the Quantitative Analysis orMaterials Verification programs will be used See Section 6 for more information on theQuantitative Analysis and Materials Verification simplified programs
5411 Startup Options PanelIf this control is set to ON a startup panel will appear at startup rather than the standardprogram starting immediately On this panel there are buttons that allow the user to choosewhether to start the program in the standard mode or a simplified mode (quantitative analysis
or materials verification) In order to have a selection for a simplified program appear in thestartup panel check the box next to the simplified program desired When the program isrestarted a button choice will allow the user to start the program in the selected simplifiedmode
5412 PasswordIf the Sys Setup control is set to ON then a password entry box will appear at the startuppanel This allows an administrator to set up the simplified programs and limit the use of theinstrument to the simplified programs unless an administrator password is used The password
8132019 InfraSpec Manual
httpslidepdfcomreaderfullinfraspec-manual 3052
can be set by pressing the SetChange Password button Note that the default password isblank
5413 Data LogThese functions adjust how the InfraSpec program logs data in the simplified program Bydefault every spectrum is logged in the standard InfraSpec format Data log files can be
opened in the standard program just like normal spectra Information about the log file such asconcentration or materials verification data can be accessed in the standard program throughthe spectra info box that appears when the Sel Traces button is pressed and a spectrum ishighlighted in the list
In addition to setting the Data Logging to ON or OFF two other options exist First theoption ASK allows the user of the simplified program to decide whether or not to save a logfile ASK w note also allows the user to decide whether or not to save a log file and alsoallows the user to enter notes about the data that was obtained These notes are accessiblethought the spectra info box as described in the previous paragraph More information on thefunctions of the data log can be found in Section 6 with regards to their operation within thesimplified programs
55 The Calibration TabThe controls shown in Figure 24 will be displayed when the Calibration tab is selected This tabcontains functions which allow the generation of calibrations for use in quantitative analysis Up toeight different calibrations can be generated separately There could be for example 8 differentconstituents of the same material to be measured or 8 separate calibrations of different materialsQuantitative analysis can be done in one of two ways First it can be done in a simplified programdedicated to quantitative analysis See Section 62 for more information Second it can be done inthe absorbance panel under the analysis heading See Section 427 for more information
Calibrations are generated using the Calibration Wizard described in Section 552
Figure 24 The Calibration Setup Tab
8132019 InfraSpec Manual
httpslidepdfcomreaderfullinfraspec-manual 3152
551 Current Calibrations Saving and Loading CalibrationsThe current loaded calibrations are shown in the middle of the Setup Panel in the Calibration tabThese are the calibrations that can be used in the current experiment Calibrations can be savedand loaded one at a time by using the appropriate button below the current calibrations Thismakes it possible to use any number of calibrations for the InfraSpec although only 8 can bepresent in the program at any given time Up to eight calibrations can be loaded into the
program however only 4 can be displayed simultaneously in the simplified program (See Section62 for more information)
552 Creating a CalibrationIn order to begin a calibration press a calibration button at the bottom of the setup panelUsually if only one calibration is desired calibration 1 is used Pressing the calibration button willbring up the Calibration Wizard shown in Figure 25 Clicking Next continues to the next stepClicking Back return you to a previous step and Cancel will close the wizard without savingany calibration
Figure 25 Calibration Wizard Step 1
5521 Calibration Wizard Step 1On the first step of the Calibration Wizard there is a button that allows the user to reset thecurrent calibration Pressing this button will completely clear the calibration data for theselected calibration Note that this will permanently delete the selected calibrationStep 1 also asks to choose the type of calibration desired
A standard calibration uses peak or area measurements in combination with baseline
correction to generate a calibration curve PLS or Partial Least Squares regressioncalibrations use a more complicated mathematical approach to the calibration This type ofcalibration can generate better results especially if the desired measurement peak containsinterferences or cannot be calculated well with a typical area measurement
Due to the complicated nature of this type of calibration please contact Wilks Enterprise Inc ifa PLS type calibration is desired The standard calibration steps will be described firstfollowing with the PLS calibration steps Note that Steps 1 and 2 are the same for both types ofcalibrations Click Next to continue
8132019 InfraSpec Manual
httpslidepdfcomreaderfullinfraspec-manual 3252
5522 Calibration Wizard Step 2The second step of the Calibration Wizard can be found in Figure 26 below Enter the name ofthe calibration to be measured along with the units of the measurement In addition specifythe precision of the measurement This is the number of significant digits that the final result
will be rounded to
Figure 26 Calibration Wizard Step 2
5523 Calibration Wizard Step 3 (Standard)The third step of the calibration wizard is shown in Figure 27 Enter the type of calibrationeither Area of Region or Peak Value If area of region is used enter the wavelength range
that the area measurement is to be calculated from If peak value is used enter the peak valueto be used for the calibration
Figure 27 Calibration Wizard Step 3 (Standard)
8132019 InfraSpec Manual
httpslidepdfcomreaderfullinfraspec-manual 3352
5524 Calibration Wizard Step 4 (Standard)The fourth step of the Calibration Wizard can be found in Figure 28 In this step choose thebaseline correction and enter the ranges that the correction will be calculated on For baselinecorrection two ranges are required For force region to zero one range is needed If a singlepoint is desired enter the sample value for start and end values See Section 422 for moreinformation on baseline correction
In addition interpolation and crosstalk correction for the calibration can be selected here Thiswill select the corrections to be done before a spectrum is analyzed In most casesinterpolation should be left on and crosstalk correction should be left off See Section 531 formore information on interpolation and crosstalk correction
Figure 28 Calibration Wizard Step 4 (standard)
5525 Calibration Wizard Step 5 (Standard)The fifth step of the Calibration Wizard can be found in Figure 29 In this step spectra arechosen to use as calibration spectra To add a calibration spectrum press the Add CalibrationSpectra button A list will appear containing all the spectra in the current experiment Choosethe desired spectra and press the Select located below the list The wizard will prompt you toenter a concentration value for each selection
Once a concentration values is entered press Continue A graph of the chosen spectracorrected using the baseline corrected values entered in step 4 of the wizard will appearCursors on the graph denote the area or peak value to be used for the calibration This graph
allows for a final check to make sure the spectrum and area regions are correct
The wizard will ask whether this spectrum is correct Click OK and the area or peak valuewill be automatically calculated and entered into the table shown on the calibration wizardpanel along with the concentration and sample and file name information In addition a pointwill be plotted on the graph of concentration vs area or concentration vs peak heightContinue adding calibration spectra in this manner until all have been entered Once this hasbeen completed click Next to go to the next step
8132019 InfraSpec Manual
httpslidepdfcomreaderfullinfraspec-manual 3452
If data points are incorrect or need to be removed highlight the point or points on the table andclick Remove Sel From Table The selected points will be removed from the table and thegraph to the right
Figure 29 Calibration Wizard Step 5 (Standard)
5526 Calibration Wizard Step 6 (Standard)The sixth step of the calibration wizard can be found in Figure 30 In this step the calibrationcurve is specified This curve will be used to calculate concentration values for this calibrationFirst choose the fit type either Linear Linear w Zero Intercept or Exponentialrdquo ldquoDoubleExponentialrdquo ldquoCubic Splinerdquo and ldquo2
nd Deg Polynomialrdquo
Once the fit type has been selected press the Generate Fit Curve button The desired fit willbe displayed on the graph and information about the fit can be found in the lower right sectionof the graph RMSE stands for Root Mean Squared Error and is a goodness of fit measurethat can be used to compare different calibration fits
If the fit is incorrect it can be removed with the Clear Fit Curve button Once the desired fithas been placed on the graph click Next to continue If you are unsure which curve functionto use contact Wilks Enterprise Inc for assistance
It is also possible to ldquoCross Validaterdquo the fit by pressing the ldquoCross Validaterdquo button In order touse this feature first select the number of calibration points to leave out This should be equalto the number of replicates of the same concentration entered in Step 5 previously When
ldquoCross Validaterdquo is pressed the program will leave out each successive concentration level andgenerate a fit curve without a given concentration level The fit curve generated will be used topredict the value(s) of the left out calibration points This allows a more robust prediction of theperformance of the calibration curve It is possible to omit the endpoints in the cross validationby checking the appropriate checkbox Since curve fitting works best interpolating theendpoints will include more error as the calibration curve must extrapolate in order to predictthese values
8132019 InfraSpec Manual
httpslidepdfcomreaderfullinfraspec-manual 3552
Figure 30 Calibration Wizard Step 6 (Standard)
5527 Calibration Wizard Step 7The next calibration step is shown in Figure 31 In this step further calibration options arechosen Passfail ranges can be set and calibrations can be set to only run separate of othercalibrations Options in this step will affect only the Quantitative Analysis Simple ProgramSee Section 62 for more information on this program
The passfail range option allows a calibration to not only print a concentration but alsoindicate whether a sample is within preset limits In order to use the pass fail ranges firstselect the passfail range to ldquoONrdquo or ldquoON with no numeric datardquo The latter option will displayonly passfail indication and no numeric concentration will be displayed in the Quantitative
Analysis Simple Program
After passfail range has been turned on select the concentrations for low failure low passhigh failure and high pass results If a sample concentration is below the low failure point orabove the high failure point the result will indicate a failure If the sample concentration isbetween the low pass and high pass point the result will indicate a pass If the sampleconcentration lies between the low failure and low pass or high failure and high pass amarginal result will be indicated This will usually mean that the result should be verified withanother sample or another method
In addition to the passfail range option this step also contains an option to set the calibrationto run separate of other calibrations This is usually necessary when a special background isrequired for an analysis If this option is set to ldquoyesrdquo then this calibration will not be allowed torun simultaneously with other calibrations in the Quantitative Analysis Simple Program
8132019 InfraSpec Manual
httpslidepdfcomreaderfullinfraspec-manual 3652
Figure 31 Calibration Wizard Step 7
5528 Calibration Wizard Step 8This is the final calibration step which is shown in Figure 32 below This step informs the userthat the Calibration is complete No further action is required Press the Save Calibrationbutton to exit the calibration wizard and save all changes The calibration will appear in theCalibration Tab as shown in Figure 24
Figure 32 Calibration Wizard Step 8
553 PLS CalibrationsIn addition to the standard calibration the InfraSpec program allows for a Partial Least Squares(PLS) type of calibration These calibrations are many times more robust especially if there areinterferences close to the desired measurement region The InfraSpec software does notsupport generating PLS calibrations directly within the program Instead Wilks Enterprise Inccan be contacted to help facilitate this type of calibration Wilks Enterprise Inc can provide the
8132019 InfraSpec Manual
httpslidepdfcomreaderfullinfraspec-manual 3752
calibration files needed to complete the PLS calibration wizard In addition advanced users cangenerate calibration files using third party software Contact Wilks Enterprise Inc for moreinformationNote Steps 1 2 7 and 8 are the same as for the standard calibrations so they are omittedbelow See Section 552 for information on these steps
5531 Calibration Wizard Step 3 (PLS)The PLS Calibration Wizard Step 3 can be found in Figure 33 below In this step the Slope
Array (denoted B) is loaded Click Choose Calibration File to navigate to the file given byWilks Enterprise Inc or generated on third party software If the correct file is chosen thecalibration point numbers will appear in the table to the right The intercept value should alsoappear the correct location
Figure 33 Calibration Wizard Step 3 (PLS)
5532 Calibration Wizard Step 4 (PLS)The PLS Calibration Wizard Step 4 can be found in Figure 34 below In this step choose anypretreatment to be done on the spectra before calculation Currently only mean centering issupported however future versions of the program may contain more pretreatment optionsSelect the pretreatment type if any click Next to continue Note that the final Step 6 is theSame as Step 7 of the standard calibration
8132019 InfraSpec Manual
httpslidepdfcomreaderfullinfraspec-manual 3852
Figure 34 Calibration Wizard Step 5 (PLS)
56 Simplified Program TabThis tab contains settings that affect the Materials Verification Simplified program mode Figure 35below shows the setup of this tab
Figure 35 Simplified Program Setup Tab
561 Materials Verification Setup
This group of controls affects the Materials Verification Simplified Program only See Section 63for more information on the Materials Verification Simplified Program
5611 Largest Acceptable Deviation ValueThis control sets the largest deviation allowed that still will result in a pass This result isdirectly related to the Match Method below The deviation value is the value that would beobtained by running a spectral comparison in the standard program The Compare function isuseful in deciding what this value should be set to by comparing spectra from a standardspectrum (See Section 421 for more information on spectral comparison) This value is set to
8132019 InfraSpec Manual
httpslidepdfcomreaderfullinfraspec-manual 3952
70 on the percentage passfail scale so that values above this level are failing and valuesbelow are passing
5612 Match MethodThis control sets the method that the materials verification will use to match a data spectrumwith the reference The match methods are described in detail in Section 421 Note that the
match method chosen affects the largest acceptable deviation value since this value willchange depending on the match method used
5613 Range LimitsIf the Range Limits control is set to ON entry boxes will appear that allow a start and endrange for the verification to work on This allows for a verification to be done on a part of thespectrum that is of interest instead of the whole spectrum
5614 No Sample ThresholdThis control if set to ON uses the variance of a data spectrum that has just been acquired totest whether there is a sample placed on the spectrometer If no sample is detected a warningwill appear and the match calculation will not proceed This is useful for preventing falseverification failures due to a user mistake of not putting sample on
The Threshold value is the sensitivity The default value of 100 is roughly a mediumsensitivity but this value may need to be changed depending on the type of materials to beverified If a false no sample report is given in the simplified program this number should beset to a lower value If a sample is not placed on the crystal and a no sample report is not
displayed in the simplified program then this number should be set to a higher value
562 Simplified Program SetupThese controls affect the Quantitative Analysis and Materials Verification simplified programsonly Each control is explained below See Sections 6 and 7 for more information on thesimplified programs
5621 Barcode ScannerSetting this control to ON makes another step in the simplified programs that asks for abarcode to be scanned in or entered manually This is useful if samples to be processedcontain a barcode as an identifier The barcode number will be saved in the spectrum note forthe log file which can be accessed in the standard program through the Spectrum Info panelonce the log file has been loaded into the experiment This panel is accessed by pressing theSel Traces button and clicking on the desired spectrum
5622 Help FilesThe simplified programs have a Help button which can be clicked by the user in order to bringup pertinent information to aid the user in using the instrument This help file can be anyMicrosoft Word text or Adobe pdf file The default file is this manual however manyapplications may require specific instructions If this is the case press Change Help File A
dialog will allow you to navigate to the correct help file Once the help file has been selectedthe directory to the help file will be displayed below the button
57 Verif Library TabThis tab allows the user to create modify and save different libraries used for materials verificationFigure 36 shows the Verification Library Tab below The current library is the library that will be usedby the Materials Verification simplified program The window on the left shows the spectra currently
8132019 InfraSpec Manual
httpslidepdfcomreaderfullinfraspec-manual 4052
contained in the library There is no limit to the number of spectra that can be added to the librarySpectra contained in this library are the spectra that a user in the simplified program will have thechoice of selecting as the reference material for verification If only one spectrum is contained in thelibrary the user of the simplified program will not have to choose a reference material Libraries canbe saved and reloaded as needed but the current loaded library will be the only active library in theMaterials Verification simplified program Each of the button controls on the tab will be explained
below
Figure 36 Verif Library Setup Tab
571 Add to LibraryClicking the Add to Library button will change the controls to library addition controls shown inFigure 37 below On the left side there is a list of spectra in the current experiment To add a
spectrum to the current library select the spectra desired from the list and click the Add button A dialog will ask for a name entry This allows spectra in the library to have a different namethan that of the spectrum used in the current experimentOnce all desired spectra have been added to the library clicking the Back button will return tothe normal library controls
Figure 37 Verif Library Addition Controls
8132019 InfraSpec Manual
httpslidepdfcomreaderfullinfraspec-manual 4152
572 Delete SelThis button will delete a spectrum from the library Select all the spectra to be delete and clickthis button to permanently delete the spectra from the current library
573 Load LibraryThis button will load a saved library into the current library Note that any spectra in the current
library before the load will still reside in the library In other words the spectra from the loadedlibrary will be added to the current library When this button is pressed a dialog will allow theuser to navigate to a library file
574 Save LibraryWhen this button is pressed a dialog will appear that allows the entry of a name for saving alibrary Note that the saving a library is different than saving the current library A saved librarywill not be loaded during the startup of the InfraSpec program In order to save the current libraryas the default press the Save as Default bottom button After this has been done the currentlibrary will be loaded on each InfraSpec program load including in the simplified program mode
8132019 InfraSpec Manual
httpslidepdfcomreaderfullinfraspec-manual 4252
6 Simplified Programs for Non-Technical Operators
61 IntroductionThe InfraSpec program allows for the use of the InfraSpec spectrometer by non-technical operatorsthrough the use of simplified programs containing minimal controls and steps Following the simplesteps allows for a fast and easy analysis using the InfraSpec spectrometer In many cases theseprograms are used daily and the standard program is simply used to set up the instrument Inaddition it is possible to have Wilks Enterprise Inc set up a simplified program in advance so that noset-up is required before use Contact Wilks Enterprise Inc for more informationThe two simplified programs available are Quantitative Analysis which is used to get a quantitativemeasure of up to four calibrations in a single run and materials verification which allows non-technical operators to easily test incoming shipments and verify the material is correct Each will beexplained below
611 Notes on BackgroundsIn both simplified programs running new backgrounds can be done at any time using the
Background button However the background can also be set to expire after a preset amountof time (see Section 5312) Once the background has expired users of the simplifiedprograms will have to run a new background before continuing If it is desired that the user run anew background after each sample then setting the maximum background age to 1 minute andusing at least 40 scans will ensure that the user will be prompted to do soIn addition the background quality can be checked with the ldquocheck backgroundrdquo button SeeSection 3312 for more information on the background checker In the simplified programs thecheck background button will display a number once completed If the number is greater than10 or less than -10 then the sample crystal should be thoroughly cleaned and the backgroundcheck re-run If the number is not within +- 10 on the second attempt it is recommended that anew background be run
62 Quantitative Analysis Simplified ProgramThe Quantitative analysis program allows for up to four calibrations to be measured in a samplesimultaneously by non-technical operators In order to set up a quantitative analysis simplifiedprogram first a calibration must be generated See Section 55 for more information on setting up acalibration Next in order to be able to access the quantitative analysis program the startup optionspanel must be selected and set to display the Quantitative Analysis button See Section 541 formore information Once InfraSpec program has been set up for the Quantitative Analysis SimplifiedProgram restart the InfraSpec Program and click the Quantitative Analysis program to start Thesteps involved in getting a quantitative result will be explained below
621 Step 1 Choose a CalibrationWhen the program first starts the screen shown in Figure 38 will be present The upper righthand side of the screen will contain information about what steps need to be taken to analyze a
sample Before acquriring spectra the calibrations to be used for analysis must be chosenClicking Choose Calibration will make the panel shown in Figure 39 appear Select at least oneand up to four calibrations to analyze and click OK Other calibrations can be chosen at anytime by selecting the Choose Calibrations button on the left side of the screen Note that while8 calibrations can be present in memory only 4 can be chosen to be analyzed and displayed atany given time Some calibrations may be set to run separately of other calibrations so thesecannot be selected with other calibrations
8132019 InfraSpec Manual
httpslidepdfcomreaderfullinfraspec-manual 4352
Figure 38 Quantitative Analysis Startup Screen
Figure 39 Choose Calibrations Panel
622 Step 2 Run a Background After choosing calibrations a background must be run in order to continue The sample button
will not be active until a valid background has been acquired Press the Background button torun a background See Section 3311 for more information on backgrounds A graphicaldisplay will show the background acquisition progress as shown in Figure 40 Pressing the StopScans button will reset back to Figure 38 without finishing the background acquisition Once thebackground has completed the default screen will return as shown in Figure 38 except that theRun Sample button will now be active
8132019 InfraSpec Manual
httpslidepdfcomreaderfullinfraspec-manual 4452
Figure 40 Background Acquisition623 Step 3 Run a SampleOnce a background has been acquired place a sample on the spectrometer fully covering thecrystal or place a sealed cell cuvette or IR card into a transmission model See section 3312for more information on placing a sample on the spectrometer Cover the sample with thesupplied plastic cover or optional stainless steel cover Once the sample has been placed on thespectrometer press the Run Sample button to begin sample acquisition If the barcodescanner option is selected the user will be prompted to scan a barcode or enter thebarcodesample ID number Otherwise the acquisition will begin and a screen similar to Figure40 will appear as the acquisition proceeds Once the spectrum has been acquired a screensimilar to Figure 41 will appear All selected calibrations (up to four) will be displayed in greyboxes with the calibration name and concentration
Figure 41 Sample Concentration Display
6231 Data LoggingNote OptionIf ASK is selected in the Data Log setup found in Section 5413 the Accept Results buttonwill be present at the bottom of the screen The log file for the current sample will not be saved
8132019 InfraSpec Manual
httpslidepdfcomreaderfullinfraspec-manual 4552
until this button is pressed This allows the user to disregard data that was taken erroneouslyNote that if the Accept Results button is not pressed no log file will be saved
If the data log setup is set to ASK wNote (see Section 5413) The note entry box will bedisplayed as well This allows for entry of explanations sample namesconcentrations or othercomments to be appended to the data log file To retrieve the notes open a log file in the
standard program and press the Sel Traces button Select the log spectrum that containsthe desired note and the Spectrum Info box will appear This box will contain the notesentered in the Simplified Programs
If the Run Sample or Run Background button is pressed before accepting the currentresults a warning will appear asking the user whether they really want to run a newsamplebackground without accepting the current results Once the Accept Results buttonhas been pressed it will become disabled and the notes entry box will disappear
6232 PassFail OptionIn addition to displaying the concentration it is also possible to display passfailmarginal data
See Section 5527 for more information on setting the passfail limits If this option is set theresult will be displayed as red (fail) yellow (marginal) or green (pass) as shown in Figure 42below In addition the passfail result will be displayed The concentration may or may not bedisplayed along with the passfail result depending on the options set Example results withthis option set are shown in Figure 42
Figure 42 PassFail Display Examples
8132019 InfraSpec Manual
httpslidepdfcomreaderfullinfraspec-manual 4652
624 Help and Exit buttonsPressing the Help button will open the help file either a pdf or text document as chosen in theSimple Program setup (see Section 5622) The default help file is this manual The ability tochoose a help file allows administrators to provide specific information for the analysis that theuser will be running
Pressing the Exit button will return the user to the startup screen
625 Reportrdquo Button A report button is provided to allow a user to print or save reports that include detailed data fromthe current sample or general data from any number of past samples When the button ispressed the window shown in Figure 43 will appear Pressing the Print Report button will printthe selected report automatically using the default printer for the computer Pressing SaveReport button will save the report a file
Figure 43 Generate Report Window
6251 Single Detail ReportIf a single report of the current sample is desired select Single Detail Report This report willcontain the information shown in Figure 44 below If the report is saved with the Save Reportbutton this file will be saved as an Adobe Acrobat pdf file
8132019 InfraSpec Manual
httpslidepdfcomreaderfullinfraspec-manual 4752
Figure 44 Detail Report Example
6252 Date Range ReportIf a report of past samples is required select the Date Range Report option Selectionmenus will appear that allow the selection of the date range specified Any log files located inthe current log folder that were created within the selected date range will be included in thereport An example of a date range report can be found in Figure 45 If the Date RangeReport is selected to be saved it will be saved as a comma separated value file that can beopened with Microsoft Excel or any other spreadsheet program
Figure 45 Date Range Report Example
8132019 InfraSpec Manual
httpslidepdfcomreaderfullinfraspec-manual 4852
63 Materials Verification Simplified ProgramThe Materials Verification simplified program can be used to verify that the correct material has beenreceived from a shipping depot or lab Any application where a known sample must be verified to bethe correct material can utilize this simplified program
In order to use this simplified program a materials library of a least one sample spectrum must be
created first See Section 57 for more information In addition other setup parameters must beentered See Section 5 for more details on the setup parameters used for the Materials VerificationSimplified Program The steps involved in verifying a material can be found below
631 Step 1 Run a BackgroundWhen the program first starts the screen shown in Figure 46 will be present The user will beprompted to run a background All buttons except the Run Background button will be disabledClick the Run Background button to acquire a background The background will begin a graphwill denote the background progress as shown in Figure 47 Pressing Stop Scans will halt theacquisition and no background will be saved
Figure 46 Materials Verification Startup Screen
Figure 47 Materials Verification Background Acquisition
8132019 InfraSpec Manual
httpslidepdfcomreaderfullinfraspec-manual 4952
632 Step 2 Choose a Material After a background has been acquired press the Choose Material button to bring up the screenshown in Figure 48 Select the material type from the library list and then press Select Ascreen will display the material to be verified as shown in Figure 49
Figure 48 Choose Material Screen
Figure 49 Ready to Verify Screen
633 Step 3 Run a Sample After a selecting the material to verify place a sample on the spectrometer and click RunSample Sample acquisition will begin and a graph will display progress Once the sample hasbeen acquired and verified a screen similar to either Figure 50 or Figure 51 depending onwhether the sample was verified or not will appear
The green or red box will state whether the material was verified and in addition will give detailsabout the spectral match The Match Method is the method that was used to verify the materialeither subtraction mean centered subtraction or mean centered unit variance subtraction
8132019 InfraSpec Manual
httpslidepdfcomreaderfullinfraspec-manual 5052
The Largest Acceptable Deviation Value is the highest deviation value that will still give a verifiedresult This is set by the administrator in the setup panel (see Section 561) The Percent Matchis a closeness of fit parameter based on the deviation value and largest acceptable deviationvalue The largest acceptable deviation value is set to a percent match of 70 percent and adeviation value of zero (perfect fit) is set to 100 This makes any value below the largest
acceptable deviation value have a passing grade of 70 or above Values above the largestacceptable deviation value will have a failing grade below 70 In addition to this scale theactual deviation value found is printed as well
Depending on the settings chosen for data logging the Accept Results button may be presentIf so this button must be pressed in order to save a log file This prevents undesired resultsstemming from operator mistakes etc from being saved as a log file In addition a notes areamay be present that allows the entry of notes about the sample Once the Accept Resultsbutton has been pressed it will become disabled and the note entry box will disappear
Figure 50 Material Verified Screen
Figure 51 Material Not Verified Screen
8132019 InfraSpec Manual
httpslidepdfcomreaderfullinfraspec-manual 5152
7 Spectrometer Specifications
Dimensions 275rdquo x 60rdquo x 65rdquo 7 cm x 1525 cm x 165 cm
Weight 30 lbs 14 kg ( total with standard ATR plate )
PC Interface RS-232 or USB
Power Requirements 12V DC 20 amps
Power Supply Universal ACDC converter type (supplied as standard)
Detectivity D 10 Hz 15-10 (cmHz)
W
Suggested Temp Operating Range 15oC - 60oC
Humidity 0 ndash 98 relative humidity (non-condensing)
Detector Array 128 Pixel linear pyroelectric array
Standard Spectral Ranges 25-5 983221m (2000-400 cm-1
) 53-108 983221m (1890-925 cm-1)
)7-14 983221m (1430-710 cm
-1))
Resolution 25 cm-1
ATR Crystal Material Cubic Zirconia Zinc Selenide or Zinc Sulfide
ATR Surface Size 50 x 16 mm
of Reflections 10
8132019 InfraSpec Manual
httpslidepdfcomreaderfullinfraspec-manual 5252
8 Service and Technical Support
Your InfraSpecreg VFA-IR Spectrometer may have been purchased either directly from Wilks Enterprise or
from a local dealer or representative In cases of any difficulties or problems associated with operation
you are recommended to contact your local representative or dealer first If the analyzer was purchaseddirect or if there are problems that are unanswered by the local representative or you have a technicalquestion relative to the operation of the instrument or relative to the analysis please contact WilksEnterprise at the contact address provided below
Customer Services DepartmentWilks Enterprise Inc25 Van Zant StreetSuite 8FEast Norwalk CT 06855
Telephone (203) 855-9136FAX (203) 838-9868E-mail techWilksIRcom
Service and Repair
During the warranty period Wilks Enterprise Inc offers free factory service for all failures that occur fromnormal instrument usage The user is only required to cover the cost of shipping the instrument to the factory After the warranty period the user is required to cover the factoryrsquos cost of servicing plus all shipping chargesNormal one week turnaround is offered for all InfraSpec instruments that are returned to the factory forservice For users requiring faster service times Wilks Enterprise also offers an advance replacementprogram that can respond to a userrsquos needs with instrument replacement typically in less than 24 hours Forextended service contracts advanced replacement programs factory service charges please contact WilksEnterprise Inc for details
Please note As we get feedback from our customers we will upgrade the software and the manual and send updates Your
comments and suggestions will be greatly appreciated For comments software updates or manual updates please send your email information to infowilksIRcom and note that you want to be put on the InfraSpecCustomer list
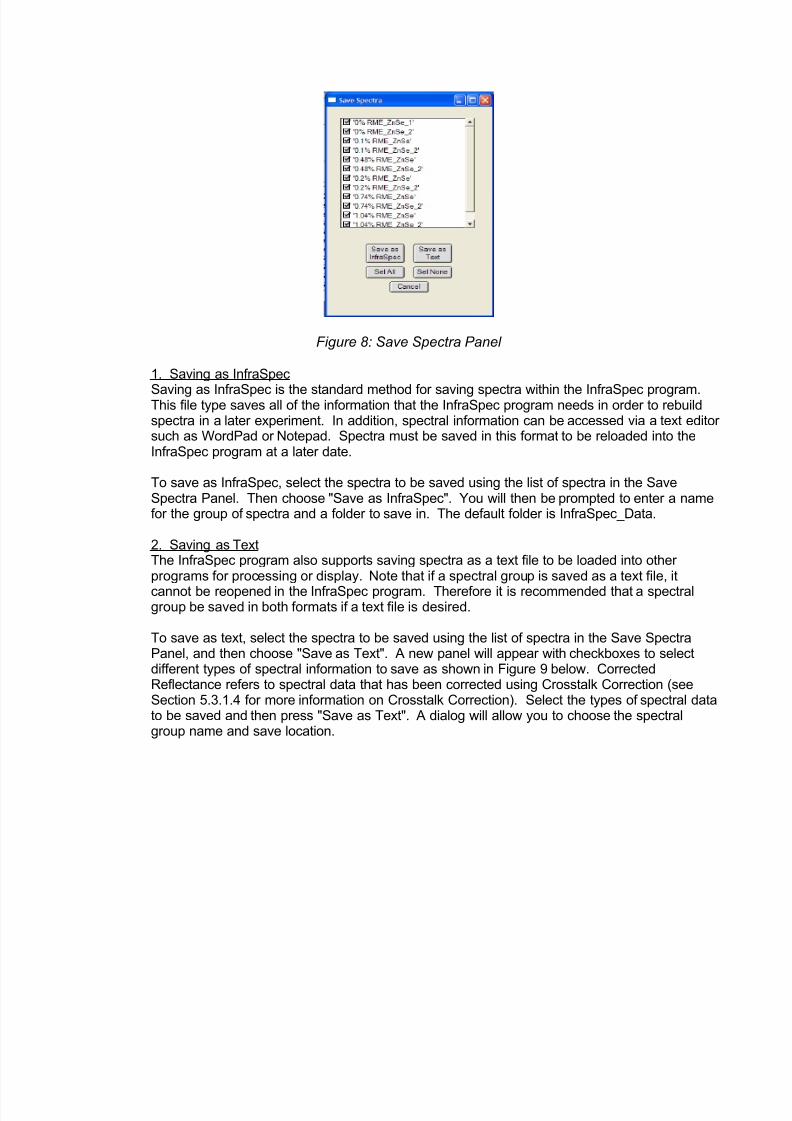
8132019 InfraSpec Manual
httpslidepdfcomreaderfullinfraspec-manual 1952
3435 Set ScaleOpens the Axis Scaling panel for manual scale setting This is the same function as the SetScale button on the top control bar under the Display heading
3436 Copy Graph as PictureCopies the current top graph as a picture into the clipboard for pasting into other programs
This will only copy the graph portion of the top panel and is useful for presenting data Notethat a graph panel must be currently on top to use this function
344 The InfraSpec Setup Menu
3441 Setup PanelOpens the Setup Panel See Section 5 for more information on the Setup Panel
3442 ShowHide Igor MenusEnables or Disables the Igor Menus By default the Igor menus are disabled See the Igor Promanual for more information on these menu items
3443 Correct Screen Resolution After display settings have been changed in the computer running the InfraSpec program suchas after an external monitor is connected to a laptop it may be necessary to select this functionin order to redraw the program windows to the correct size for the new screen resolution
3444 Show Command History WindowShows the Igor Pro command window for manual entry of commands See the Igor Promanual for more information
3445 Restore Factory Default SettingsRestores the default settings for the InfraSpec program This should only be used if there areproblems with settings or if a new spectrometer is attached and the settings must be
completely reset
35 CursorsOn the bottom of the Main and Absorbance Windows a white bar contains the two cursors that canbe used for identifying points on a spectrum called the A and B cursors In order to activate a cursoruse the mouse to drag the circle A cursor or square B cursor onto a trace on the graph The whitebar will give X and Y coordinates as well as information about the distance between the two cursors ifrelevant
Cursors are also used in the Absorbance window for selecting areas and peaks for spectralprocessing See Section 4 for more information about the processing functions that use cursors
8132019 InfraSpec Manual
httpslidepdfcomreaderfullinfraspec-manual 2052
4 The Absorbance Panel
41 IntroductionThe Absorbance Panel is similar in many aspects to the Main panel A top control bar contains mostof the same functions as those in the Main Panel with the exception that the Collect heading isreplaced by an Analyze heading
The graph window displays spectra in absorbance rather than the transmissionreflectance spectradisplayed in the Main Panel See Figure 12 below
The Analyze heading contains controls that process and analyze selected spectra in the experimentNote that absorbance spectra reside separately from the transmissionreflectance spectra so anyspectral processing can be undone by using the Restore button in the Select Spectra Panel (seeSection 3333)
Figure 12 The Absorbance Panel
42 The Analyze HeadingThis heading is where all spectral processing and analysis takes place The functions that can beused are Compare Baseline Correction Peak and Area Difference Spectra Quantitative AnalysisTo select a function click the checkbox next to the function name and a panel to the right of the
Analyze
421 CompareSelecting the Compare checkbox will open the menu controls shown in Figure 13 This functionallows a comparison between a reference and any amount of other spectra as chosen by selectingspectra on the right hand side of the graph After selecting the spectra and reference to comparepress the Compare button to bring up the comparison table shown in Figure 14 below
8132019 InfraSpec Manual
httpslidepdfcomreaderfullinfraspec-manual 2152
Figure 13 Comparison Panel
Figure 14 Comparison Table
The table shown in Figure 13 contains 3 calculations which gauge the closeness of the selectedspectrum and the reference spectrum Each calculation is a subtraction after variouspreprocessing Each will be explained belowNote In the following formulas A=[a1a2 an ] ie lower case symbols are scalars upper casesymbols are vectors (spectra) See for example ldquoChemometricsrdquo Sharaf Illman and KiowalskiWiley 1986
4211 Subtraction FitCalculates the point by point subtraction and squares the sum
F=sum(R-A)2
Where F is the Subtraction Fit value R is the Reference spectrum and A is the comparisonspectrum
4212 Mean Center Subtraction FitCalculates the point by point subtraction and squares the sum after the spectra have beenmean centered If the mean of the absorbance spectrum is ā then
ā=1nsumai
8132019 InfraSpec Manual
httpslidepdfcomreaderfullinfraspec-manual 2252
Where ai is an individual pixel absorbance value and n is the number of data points (pixels)The mean centered spectrum is then defined as
A=A- ā
Where A is the mean centered comparison spectrum and A is the original comparison
spectrum The resulting Mean Center Subtraction Fit G is calculated as
G=sum(R-A)2
Where R is the mean centered reference spectrum
4213 Mean Centered Unit Variance Subtraction FitCalculates the mean centered spectrum similar to 4212 and then autoscales this result bydividing the resulting mean centered spectrum by the variance of the spectrum The variance
s is defined as
s2=
1n-1sum(ai-ā)
2
The resulting variance is then divided by the mean centered spectrum as follows
A=(A- e)s
Where A is the mean centered unit variance comparison spectrum The mean centered unitvariance fit H can then be calculated as
H=sum(R-A)2
Where R is the mean centered unit variance reference spectrum
422 Baseline CorrectionSelecting the Baseline Correction check box will open the baseline correction tools shown inFigure 15 below These functions are useful for removing artifacts from spectra
Figure 15 Baseline Correction Controls
To baseline correct spectra ensure that the desired spectra are displayed in the absorbancepanel graph window Then place cursors onto a displayed spectrum and press the IncludebuttonThe range that has been chosen will be highlighted yellow on the graph panel Alternatively arange can be manually entered using the Range entry boxes To clear all selected regions press
8132019 InfraSpec Manual
httpslidepdfcomreaderfullinfraspec-manual 2352
the Clear Region button To exclude only part of a region place the cursors on the desiredregion to exclude and press the Exclude button The excluded region will no longer behighlighted in yellowOnce a desired region has been selected the Force Reg to Zero or Baseline Correct can bepressed to complete the baseline correction Force Reg to Zero shifts the entire spectrum sothat the average value of the selected region is zero Baseline Correct calculates a linear fit
across the selected region and then shifts the spectrum so that the calculated fit line has zeroslope and intercept
423 Peak and AreaSelecting the Peak and Area checkbox will open the baseline correction panel shown in Figure16 below This function calculates the peak location peak absorbance value and area of aselected region
Figure 16 Peak and Area Controls
In order to calculate the peak and area values first display the desired spectra to be analyzed onthe absorbance graph window Then select a region using the cursors at the bottom of the screenor alternatively use the manual range entry boxes Once the desired region is selected press theInclude button The selected region will be highlighted in yellow To clear the region press theClear Region button
Once the desired region has been selected and included the Peak and Area of Region buttoncan be pressed in order to bring up the table shown in Figure 17 below This table includes thepeak location peak absorbance value and the area of the selected region along with analysis
details The data from this table can be copied and pasted into another program for furtherprocessing
Figure 17 Peak and Area Table
424 Difference SpectraSelecting the Difference Spectra checkbox will open the difference spectra controls shown inFigure 18 These functions are useful for subtracting one spectrum from another In order to
8132019 InfraSpec Manual
httpslidepdfcomreaderfullinfraspec-manual 2452
difference spectra first choose a reference spectra or minuend This is the spectrum that will besubtracted from the sample spectrum
Next choose the sample spectrum or subtrahend Once both spectra have been chosen thesubtraction slider can be used to choose the correct subtraction weight The subtraction weight isthe percent of the reference spectrum that is subtracted from the sample spectrum As the slider
is moved the resulting difference spectrum is displayed in the graph window Additionally thesubtraction weight can be entered manually in the entry box or adjusted with the up and downarrows to the right of the entry box
Note that the original spectra are not affected by generating a difference spectrum Differencespectra are separate entities and can be displayed in the absorbance window much likeabsorbance spectra Difference spectra take the name of the sample spectrum with _diffappended at the end of the name
Figure 18 Difference Spectra Controls
425 Quantitative AnalysisSelecting the Quantitative Analysis checkbox opens the controls shown in Figure 19 Thesefunctions allow quantitative analysis within the standard program In order to use these functionsat least one calibration must be created See Section 55 for information on how to generate acalibration Note that a simplified quantitative analysis program allows for quantitative analysis byuntrained personnel See Section 62 for more information on the simplified quantitative analysisprogram
Figure 19 Quantitative Analysis Controls
In order to quantitatively analyze spectra in the current experiment first choose a calibration orcalibrations to analyze for Up to eight calibrations can be analyzed at the same time Once thedesired calibrations are selected select the spectra to be analyzed using the list box to the right
8132019 InfraSpec Manual
httpslidepdfcomreaderfullinfraspec-manual 2552
All or no spectra can be selected using the Sel All and Sel None buttons below the list boxMake sure that the spectra to be analyzed are appropriate for the calibration selected to ensurecorrect quantitative values
After selecting calibrations and spectra to be analyzed press the Analyze button This will bringup a table similar to that shown in Figure 20 Each spectrum name is displayed and the resulting
concentrations for each calibration are shown in the appropriate column The data from this tablecan be copied and pasted into another program for further analysis
Figure 20 Quantitative Analysis Table
8132019 InfraSpec Manual
httpslidepdfcomreaderfullinfraspec-manual 2652
5 The Setup Panel
51 IntroductionThe setup panel accessed either from the Setup button under the Experiment heading in the mainand absorbance windows or from the Setup Panel menu item under the InfraSpec Setup menucontains all of the functions for setting up and customizing the InfraSpec program In additionCalibrations can be generated and Libraries for Materials Verification can be built This sectiondescribes all of the setup options available
The setup panel contains several tabs with different controls in each along with a set of buttons atthe bottom that are available in every tab Each tab will be explained separately below
52 Bottom ButtonsThe buttons found at the bottom of the setup panel are available in every tab of the setup panel andare shown in Figure 21 below These buttons are used for saving the changes that have been madein the setup panel The changes can be either saved for use only in the current experiment using the
Save For This Session button or saved as the default setup so that every experiment will use thecurrent settings with the Save Setup as Default button
Figure 21 Bottom Setup Panel Buttons
521 Save For This Session ButtonThis button allows temporary changes to be made to a current experiment without affecting the
default values for subsequent experiments This option is useful for changing a setting for aspecific experiment such as adjusting the number of scans or changing the x-axis units Whenthis button is pressed the setup panel is closed and the values changed in the setup panel willtake effect for the current experiment
522 Save Setup as Default ButtonThis button allows permanent changes to be made to the setup values This is useful for the initialsetup of the spectrometer or for changes that will be used many times When this button ispressed the setup panel will close and all subsequent experiments will use the settings chosen asdefault settings
523 Revert to Default SetupThis button reverts all settings to the default values as chosen the last time the Save Setup asDefault button was pressed This is useful to change back many settings made temporarily Inaddition it is useful to revert to the default setting if problems are occurring that may be due tochanges in the Setup Panel
524 Cancel ButtonThis button closes the Setup Panel and cancels any changes made to the setup panel since it wasopened Note that calibrations are left unchanged by the Cancel button
8132019 InfraSpec Manual
httpslidepdfcomreaderfullinfraspec-manual 2752
53 General TabThis tab contains basic setup controls for the spectrometer and experiment The controls shown inFigure 22 will be displayed when this tab is selected or the Setup Panel is first opened
Figure 22 General Setup Tab
531 Experiment Setup HeadingThis heading contains controls used for the setup of the InfraSpec program and experiment Eachcontrol is explained below
5311 of ScansThis control selects the number of scans that a background and sample spectrum will beaveraged from The higher the number of scans the lower the resulting spectral noise Eachscan takes approximately 15 seconds so a setting of 40 scans will allow a spectrum to becompleted in approximately 1 minute 40 Scans is recommended for most applications
5312 Max Bkgd AgeThis option selects the maximum age of a background scan In the standard program awarning will pop up once the background has expired however the user may still run aspectrum using the expired background In the simplified Quantitative Analysis and MaterialsVerification programs the user must run a new background the current background hasexpired This setting can be set to off as well to never warn that the background has expired
5313 X UnitsThis control selects the units used for the X-axis either microm (microns) or cm-1 (wavenumber)
5314 InterpolationThis control selects whether the spectra displayed are interpolated The interpolation is donevia a cubic spline algorithm The number of points in an interpolated spectrum is 1280
8132019 InfraSpec Manual
httpslidepdfcomreaderfullinfraspec-manual 2852
5315 Crosstalk CorrectionCrosstalk correction is a proprietary correction algorithm that attempts to eliminate crosstalkbetween pixels due to incorrect illumination from imperfectly collimated source light as well asfrom thermal crosstalk between pixels The result is an increase in apparent resolution Thisshould be used for qualitative analysis where the most spectral detail is desired It is notrecommended for quantitative analysis or materials verification
5316 Ask to SampleThis option allows the selection of an extra step before sampling or running a background Ifthis is set to ON when the Sample or Background button are pressed a pop up will ask if theuser is ready to run a new spectrum This prevents an accidental spectrum or backgroundfrom occurring When the selection is set to OFF a background or sample spectrum willimmediately begin after the correct button is pressed
5317 Trace TagsTrace tags will appear on the Main panel and Absorbance panel when a spectrum is clicked inthe graph pane The tag can show the sample name of the spectrum clicked by setting thetrace tags option to ldquoNotes Onlyrdquo or it can show details spectrum information by setting theoption to ldquoDetailedrdquo The tags can also be turned off here
5318 Save FolderThis setting selects the default folder to be opened when a spectrum is saved or loaded IfInfraSpec_Data is selected every time the Save Spectra or Load Spectra button ispressed the InfraSpec_Data folder will be the start folder in the saveload dialog If LastFolder Used is selected the folder that was last navigated to on a load or save will be the startfolder in the saveload dialog
5319 CompanyThis control sets the company that is using the spectrometer This name is reported in log filesand reports
53110 AddressThis control sets the company address for the company using the spectrometer This addressis reported in log files and reports
53111 OperatorThis control sets the company address for the company using the spectrometer This name isreported in log files and reports
532 Spectrometer Setup HeadingThis heading contains controls used for the setup of the InfraSpec spectrometer hardware Eachcontrol is explained below
5321 microm at First and Last PixelThe wavelength values located at the back of the instrument should be entered here Thisensures that the spectra collected will have the correct x-units
5322 Sample StageThis allows the selection of the sample stage type either ATR or Transmission This ensuresthat the y axis contains the correct units and that the crosstalk correction values areappropriate for the sample stage of the selected spectrometer
8132019 InfraSpec Manual
httpslidepdfcomreaderfullinfraspec-manual 2952
5323 Serial PortThis setting selects the current serial port that the InfraSpec is connected to If thespectrometer is connected correctly and the program does not recognize the spectrometer theserial port may be incorrectly set Use this setting to change the serial port and then use theConnect Spectrometer menu item under the InfraSpec Setup menu to connect thespectrometer This can also be used to select between different instruments if multiple
spectrometers are connected to the same computer
54 The System TabThe controls shown in Figure 23 will be displayed when the System tab is selected This tabcontains setup controls for program startup and logging
Figure 23 System Setup Tab
541 Startup HeadingThese functions control how the program starts depending on whether the Quantitative Analysis orMaterials Verification programs will be used See Section 6 for more information on theQuantitative Analysis and Materials Verification simplified programs
5411 Startup Options PanelIf this control is set to ON a startup panel will appear at startup rather than the standardprogram starting immediately On this panel there are buttons that allow the user to choosewhether to start the program in the standard mode or a simplified mode (quantitative analysis
or materials verification) In order to have a selection for a simplified program appear in thestartup panel check the box next to the simplified program desired When the program isrestarted a button choice will allow the user to start the program in the selected simplifiedmode
5412 PasswordIf the Sys Setup control is set to ON then a password entry box will appear at the startuppanel This allows an administrator to set up the simplified programs and limit the use of theinstrument to the simplified programs unless an administrator password is used The password
8132019 InfraSpec Manual
httpslidepdfcomreaderfullinfraspec-manual 3052
can be set by pressing the SetChange Password button Note that the default password isblank
5413 Data LogThese functions adjust how the InfraSpec program logs data in the simplified program Bydefault every spectrum is logged in the standard InfraSpec format Data log files can be
opened in the standard program just like normal spectra Information about the log file such asconcentration or materials verification data can be accessed in the standard program throughthe spectra info box that appears when the Sel Traces button is pressed and a spectrum ishighlighted in the list
In addition to setting the Data Logging to ON or OFF two other options exist First theoption ASK allows the user of the simplified program to decide whether or not to save a logfile ASK w note also allows the user to decide whether or not to save a log file and alsoallows the user to enter notes about the data that was obtained These notes are accessiblethought the spectra info box as described in the previous paragraph More information on thefunctions of the data log can be found in Section 6 with regards to their operation within thesimplified programs
55 The Calibration TabThe controls shown in Figure 24 will be displayed when the Calibration tab is selected This tabcontains functions which allow the generation of calibrations for use in quantitative analysis Up toeight different calibrations can be generated separately There could be for example 8 differentconstituents of the same material to be measured or 8 separate calibrations of different materialsQuantitative analysis can be done in one of two ways First it can be done in a simplified programdedicated to quantitative analysis See Section 62 for more information Second it can be done inthe absorbance panel under the analysis heading See Section 427 for more information
Calibrations are generated using the Calibration Wizard described in Section 552
Figure 24 The Calibration Setup Tab
8132019 InfraSpec Manual
httpslidepdfcomreaderfullinfraspec-manual 3152
551 Current Calibrations Saving and Loading CalibrationsThe current loaded calibrations are shown in the middle of the Setup Panel in the Calibration tabThese are the calibrations that can be used in the current experiment Calibrations can be savedand loaded one at a time by using the appropriate button below the current calibrations Thismakes it possible to use any number of calibrations for the InfraSpec although only 8 can bepresent in the program at any given time Up to eight calibrations can be loaded into the
program however only 4 can be displayed simultaneously in the simplified program (See Section62 for more information)
552 Creating a CalibrationIn order to begin a calibration press a calibration button at the bottom of the setup panelUsually if only one calibration is desired calibration 1 is used Pressing the calibration button willbring up the Calibration Wizard shown in Figure 25 Clicking Next continues to the next stepClicking Back return you to a previous step and Cancel will close the wizard without savingany calibration
Figure 25 Calibration Wizard Step 1
5521 Calibration Wizard Step 1On the first step of the Calibration Wizard there is a button that allows the user to reset thecurrent calibration Pressing this button will completely clear the calibration data for theselected calibration Note that this will permanently delete the selected calibrationStep 1 also asks to choose the type of calibration desired
A standard calibration uses peak or area measurements in combination with baseline
correction to generate a calibration curve PLS or Partial Least Squares regressioncalibrations use a more complicated mathematical approach to the calibration This type ofcalibration can generate better results especially if the desired measurement peak containsinterferences or cannot be calculated well with a typical area measurement
Due to the complicated nature of this type of calibration please contact Wilks Enterprise Inc ifa PLS type calibration is desired The standard calibration steps will be described firstfollowing with the PLS calibration steps Note that Steps 1 and 2 are the same for both types ofcalibrations Click Next to continue
8132019 InfraSpec Manual
httpslidepdfcomreaderfullinfraspec-manual 3252
5522 Calibration Wizard Step 2The second step of the Calibration Wizard can be found in Figure 26 below Enter the name ofthe calibration to be measured along with the units of the measurement In addition specifythe precision of the measurement This is the number of significant digits that the final result
will be rounded to
Figure 26 Calibration Wizard Step 2
5523 Calibration Wizard Step 3 (Standard)The third step of the calibration wizard is shown in Figure 27 Enter the type of calibrationeither Area of Region or Peak Value If area of region is used enter the wavelength range
that the area measurement is to be calculated from If peak value is used enter the peak valueto be used for the calibration
Figure 27 Calibration Wizard Step 3 (Standard)
8132019 InfraSpec Manual
httpslidepdfcomreaderfullinfraspec-manual 3352
5524 Calibration Wizard Step 4 (Standard)The fourth step of the Calibration Wizard can be found in Figure 28 In this step choose thebaseline correction and enter the ranges that the correction will be calculated on For baselinecorrection two ranges are required For force region to zero one range is needed If a singlepoint is desired enter the sample value for start and end values See Section 422 for moreinformation on baseline correction
In addition interpolation and crosstalk correction for the calibration can be selected here Thiswill select the corrections to be done before a spectrum is analyzed In most casesinterpolation should be left on and crosstalk correction should be left off See Section 531 formore information on interpolation and crosstalk correction
Figure 28 Calibration Wizard Step 4 (standard)
5525 Calibration Wizard Step 5 (Standard)The fifth step of the Calibration Wizard can be found in Figure 29 In this step spectra arechosen to use as calibration spectra To add a calibration spectrum press the Add CalibrationSpectra button A list will appear containing all the spectra in the current experiment Choosethe desired spectra and press the Select located below the list The wizard will prompt you toenter a concentration value for each selection
Once a concentration values is entered press Continue A graph of the chosen spectracorrected using the baseline corrected values entered in step 4 of the wizard will appearCursors on the graph denote the area or peak value to be used for the calibration This graph
allows for a final check to make sure the spectrum and area regions are correct
The wizard will ask whether this spectrum is correct Click OK and the area or peak valuewill be automatically calculated and entered into the table shown on the calibration wizardpanel along with the concentration and sample and file name information In addition a pointwill be plotted on the graph of concentration vs area or concentration vs peak heightContinue adding calibration spectra in this manner until all have been entered Once this hasbeen completed click Next to go to the next step
8132019 InfraSpec Manual
httpslidepdfcomreaderfullinfraspec-manual 3452
If data points are incorrect or need to be removed highlight the point or points on the table andclick Remove Sel From Table The selected points will be removed from the table and thegraph to the right
Figure 29 Calibration Wizard Step 5 (Standard)
5526 Calibration Wizard Step 6 (Standard)The sixth step of the calibration wizard can be found in Figure 30 In this step the calibrationcurve is specified This curve will be used to calculate concentration values for this calibrationFirst choose the fit type either Linear Linear w Zero Intercept or Exponentialrdquo ldquoDoubleExponentialrdquo ldquoCubic Splinerdquo and ldquo2
nd Deg Polynomialrdquo
Once the fit type has been selected press the Generate Fit Curve button The desired fit willbe displayed on the graph and information about the fit can be found in the lower right sectionof the graph RMSE stands for Root Mean Squared Error and is a goodness of fit measurethat can be used to compare different calibration fits
If the fit is incorrect it can be removed with the Clear Fit Curve button Once the desired fithas been placed on the graph click Next to continue If you are unsure which curve functionto use contact Wilks Enterprise Inc for assistance
It is also possible to ldquoCross Validaterdquo the fit by pressing the ldquoCross Validaterdquo button In order touse this feature first select the number of calibration points to leave out This should be equalto the number of replicates of the same concentration entered in Step 5 previously When
ldquoCross Validaterdquo is pressed the program will leave out each successive concentration level andgenerate a fit curve without a given concentration level The fit curve generated will be used topredict the value(s) of the left out calibration points This allows a more robust prediction of theperformance of the calibration curve It is possible to omit the endpoints in the cross validationby checking the appropriate checkbox Since curve fitting works best interpolating theendpoints will include more error as the calibration curve must extrapolate in order to predictthese values
8132019 InfraSpec Manual
httpslidepdfcomreaderfullinfraspec-manual 3552
Figure 30 Calibration Wizard Step 6 (Standard)
5527 Calibration Wizard Step 7The next calibration step is shown in Figure 31 In this step further calibration options arechosen Passfail ranges can be set and calibrations can be set to only run separate of othercalibrations Options in this step will affect only the Quantitative Analysis Simple ProgramSee Section 62 for more information on this program
The passfail range option allows a calibration to not only print a concentration but alsoindicate whether a sample is within preset limits In order to use the pass fail ranges firstselect the passfail range to ldquoONrdquo or ldquoON with no numeric datardquo The latter option will displayonly passfail indication and no numeric concentration will be displayed in the Quantitative
Analysis Simple Program
After passfail range has been turned on select the concentrations for low failure low passhigh failure and high pass results If a sample concentration is below the low failure point orabove the high failure point the result will indicate a failure If the sample concentration isbetween the low pass and high pass point the result will indicate a pass If the sampleconcentration lies between the low failure and low pass or high failure and high pass amarginal result will be indicated This will usually mean that the result should be verified withanother sample or another method
In addition to the passfail range option this step also contains an option to set the calibrationto run separate of other calibrations This is usually necessary when a special background isrequired for an analysis If this option is set to ldquoyesrdquo then this calibration will not be allowed torun simultaneously with other calibrations in the Quantitative Analysis Simple Program
8132019 InfraSpec Manual
httpslidepdfcomreaderfullinfraspec-manual 3652
Figure 31 Calibration Wizard Step 7
5528 Calibration Wizard Step 8This is the final calibration step which is shown in Figure 32 below This step informs the userthat the Calibration is complete No further action is required Press the Save Calibrationbutton to exit the calibration wizard and save all changes The calibration will appear in theCalibration Tab as shown in Figure 24
Figure 32 Calibration Wizard Step 8
553 PLS CalibrationsIn addition to the standard calibration the InfraSpec program allows for a Partial Least Squares(PLS) type of calibration These calibrations are many times more robust especially if there areinterferences close to the desired measurement region The InfraSpec software does notsupport generating PLS calibrations directly within the program Instead Wilks Enterprise Inccan be contacted to help facilitate this type of calibration Wilks Enterprise Inc can provide the
8132019 InfraSpec Manual
httpslidepdfcomreaderfullinfraspec-manual 3752
calibration files needed to complete the PLS calibration wizard In addition advanced users cangenerate calibration files using third party software Contact Wilks Enterprise Inc for moreinformationNote Steps 1 2 7 and 8 are the same as for the standard calibrations so they are omittedbelow See Section 552 for information on these steps
5531 Calibration Wizard Step 3 (PLS)The PLS Calibration Wizard Step 3 can be found in Figure 33 below In this step the Slope
Array (denoted B) is loaded Click Choose Calibration File to navigate to the file given byWilks Enterprise Inc or generated on third party software If the correct file is chosen thecalibration point numbers will appear in the table to the right The intercept value should alsoappear the correct location
Figure 33 Calibration Wizard Step 3 (PLS)
5532 Calibration Wizard Step 4 (PLS)The PLS Calibration Wizard Step 4 can be found in Figure 34 below In this step choose anypretreatment to be done on the spectra before calculation Currently only mean centering issupported however future versions of the program may contain more pretreatment optionsSelect the pretreatment type if any click Next to continue Note that the final Step 6 is theSame as Step 7 of the standard calibration
8132019 InfraSpec Manual
httpslidepdfcomreaderfullinfraspec-manual 3852
Figure 34 Calibration Wizard Step 5 (PLS)
56 Simplified Program TabThis tab contains settings that affect the Materials Verification Simplified program mode Figure 35below shows the setup of this tab
Figure 35 Simplified Program Setup Tab
561 Materials Verification Setup
This group of controls affects the Materials Verification Simplified Program only See Section 63for more information on the Materials Verification Simplified Program
5611 Largest Acceptable Deviation ValueThis control sets the largest deviation allowed that still will result in a pass This result isdirectly related to the Match Method below The deviation value is the value that would beobtained by running a spectral comparison in the standard program The Compare function isuseful in deciding what this value should be set to by comparing spectra from a standardspectrum (See Section 421 for more information on spectral comparison) This value is set to
8132019 InfraSpec Manual
httpslidepdfcomreaderfullinfraspec-manual 3952
70 on the percentage passfail scale so that values above this level are failing and valuesbelow are passing
5612 Match MethodThis control sets the method that the materials verification will use to match a data spectrumwith the reference The match methods are described in detail in Section 421 Note that the
match method chosen affects the largest acceptable deviation value since this value willchange depending on the match method used
5613 Range LimitsIf the Range Limits control is set to ON entry boxes will appear that allow a start and endrange for the verification to work on This allows for a verification to be done on a part of thespectrum that is of interest instead of the whole spectrum
5614 No Sample ThresholdThis control if set to ON uses the variance of a data spectrum that has just been acquired totest whether there is a sample placed on the spectrometer If no sample is detected a warningwill appear and the match calculation will not proceed This is useful for preventing falseverification failures due to a user mistake of not putting sample on
The Threshold value is the sensitivity The default value of 100 is roughly a mediumsensitivity but this value may need to be changed depending on the type of materials to beverified If a false no sample report is given in the simplified program this number should beset to a lower value If a sample is not placed on the crystal and a no sample report is not
displayed in the simplified program then this number should be set to a higher value
562 Simplified Program SetupThese controls affect the Quantitative Analysis and Materials Verification simplified programsonly Each control is explained below See Sections 6 and 7 for more information on thesimplified programs
5621 Barcode ScannerSetting this control to ON makes another step in the simplified programs that asks for abarcode to be scanned in or entered manually This is useful if samples to be processedcontain a barcode as an identifier The barcode number will be saved in the spectrum note forthe log file which can be accessed in the standard program through the Spectrum Info panelonce the log file has been loaded into the experiment This panel is accessed by pressing theSel Traces button and clicking on the desired spectrum
5622 Help FilesThe simplified programs have a Help button which can be clicked by the user in order to bringup pertinent information to aid the user in using the instrument This help file can be anyMicrosoft Word text or Adobe pdf file The default file is this manual however manyapplications may require specific instructions If this is the case press Change Help File A
dialog will allow you to navigate to the correct help file Once the help file has been selectedthe directory to the help file will be displayed below the button
57 Verif Library TabThis tab allows the user to create modify and save different libraries used for materials verificationFigure 36 shows the Verification Library Tab below The current library is the library that will be usedby the Materials Verification simplified program The window on the left shows the spectra currently
8132019 InfraSpec Manual
httpslidepdfcomreaderfullinfraspec-manual 4052
contained in the library There is no limit to the number of spectra that can be added to the librarySpectra contained in this library are the spectra that a user in the simplified program will have thechoice of selecting as the reference material for verification If only one spectrum is contained in thelibrary the user of the simplified program will not have to choose a reference material Libraries canbe saved and reloaded as needed but the current loaded library will be the only active library in theMaterials Verification simplified program Each of the button controls on the tab will be explained
below
Figure 36 Verif Library Setup Tab
571 Add to LibraryClicking the Add to Library button will change the controls to library addition controls shown inFigure 37 below On the left side there is a list of spectra in the current experiment To add a
spectrum to the current library select the spectra desired from the list and click the Add button A dialog will ask for a name entry This allows spectra in the library to have a different namethan that of the spectrum used in the current experimentOnce all desired spectra have been added to the library clicking the Back button will return tothe normal library controls
Figure 37 Verif Library Addition Controls
8132019 InfraSpec Manual
httpslidepdfcomreaderfullinfraspec-manual 4152
572 Delete SelThis button will delete a spectrum from the library Select all the spectra to be delete and clickthis button to permanently delete the spectra from the current library
573 Load LibraryThis button will load a saved library into the current library Note that any spectra in the current
library before the load will still reside in the library In other words the spectra from the loadedlibrary will be added to the current library When this button is pressed a dialog will allow theuser to navigate to a library file
574 Save LibraryWhen this button is pressed a dialog will appear that allows the entry of a name for saving alibrary Note that the saving a library is different than saving the current library A saved librarywill not be loaded during the startup of the InfraSpec program In order to save the current libraryas the default press the Save as Default bottom button After this has been done the currentlibrary will be loaded on each InfraSpec program load including in the simplified program mode
8132019 InfraSpec Manual
httpslidepdfcomreaderfullinfraspec-manual 4252
6 Simplified Programs for Non-Technical Operators
61 IntroductionThe InfraSpec program allows for the use of the InfraSpec spectrometer by non-technical operatorsthrough the use of simplified programs containing minimal controls and steps Following the simplesteps allows for a fast and easy analysis using the InfraSpec spectrometer In many cases theseprograms are used daily and the standard program is simply used to set up the instrument Inaddition it is possible to have Wilks Enterprise Inc set up a simplified program in advance so that noset-up is required before use Contact Wilks Enterprise Inc for more informationThe two simplified programs available are Quantitative Analysis which is used to get a quantitativemeasure of up to four calibrations in a single run and materials verification which allows non-technical operators to easily test incoming shipments and verify the material is correct Each will beexplained below
611 Notes on BackgroundsIn both simplified programs running new backgrounds can be done at any time using the
Background button However the background can also be set to expire after a preset amountof time (see Section 5312) Once the background has expired users of the simplifiedprograms will have to run a new background before continuing If it is desired that the user run anew background after each sample then setting the maximum background age to 1 minute andusing at least 40 scans will ensure that the user will be prompted to do soIn addition the background quality can be checked with the ldquocheck backgroundrdquo button SeeSection 3312 for more information on the background checker In the simplified programs thecheck background button will display a number once completed If the number is greater than10 or less than -10 then the sample crystal should be thoroughly cleaned and the backgroundcheck re-run If the number is not within +- 10 on the second attempt it is recommended that anew background be run
62 Quantitative Analysis Simplified ProgramThe Quantitative analysis program allows for up to four calibrations to be measured in a samplesimultaneously by non-technical operators In order to set up a quantitative analysis simplifiedprogram first a calibration must be generated See Section 55 for more information on setting up acalibration Next in order to be able to access the quantitative analysis program the startup optionspanel must be selected and set to display the Quantitative Analysis button See Section 541 formore information Once InfraSpec program has been set up for the Quantitative Analysis SimplifiedProgram restart the InfraSpec Program and click the Quantitative Analysis program to start Thesteps involved in getting a quantitative result will be explained below
621 Step 1 Choose a CalibrationWhen the program first starts the screen shown in Figure 38 will be present The upper righthand side of the screen will contain information about what steps need to be taken to analyze a
sample Before acquriring spectra the calibrations to be used for analysis must be chosenClicking Choose Calibration will make the panel shown in Figure 39 appear Select at least oneand up to four calibrations to analyze and click OK Other calibrations can be chosen at anytime by selecting the Choose Calibrations button on the left side of the screen Note that while8 calibrations can be present in memory only 4 can be chosen to be analyzed and displayed atany given time Some calibrations may be set to run separately of other calibrations so thesecannot be selected with other calibrations
8132019 InfraSpec Manual
httpslidepdfcomreaderfullinfraspec-manual 4352
Figure 38 Quantitative Analysis Startup Screen
Figure 39 Choose Calibrations Panel
622 Step 2 Run a Background After choosing calibrations a background must be run in order to continue The sample button
will not be active until a valid background has been acquired Press the Background button torun a background See Section 3311 for more information on backgrounds A graphicaldisplay will show the background acquisition progress as shown in Figure 40 Pressing the StopScans button will reset back to Figure 38 without finishing the background acquisition Once thebackground has completed the default screen will return as shown in Figure 38 except that theRun Sample button will now be active
8132019 InfraSpec Manual
httpslidepdfcomreaderfullinfraspec-manual 4452
Figure 40 Background Acquisition623 Step 3 Run a SampleOnce a background has been acquired place a sample on the spectrometer fully covering thecrystal or place a sealed cell cuvette or IR card into a transmission model See section 3312for more information on placing a sample on the spectrometer Cover the sample with thesupplied plastic cover or optional stainless steel cover Once the sample has been placed on thespectrometer press the Run Sample button to begin sample acquisition If the barcodescanner option is selected the user will be prompted to scan a barcode or enter thebarcodesample ID number Otherwise the acquisition will begin and a screen similar to Figure40 will appear as the acquisition proceeds Once the spectrum has been acquired a screensimilar to Figure 41 will appear All selected calibrations (up to four) will be displayed in greyboxes with the calibration name and concentration
Figure 41 Sample Concentration Display
6231 Data LoggingNote OptionIf ASK is selected in the Data Log setup found in Section 5413 the Accept Results buttonwill be present at the bottom of the screen The log file for the current sample will not be saved
8132019 InfraSpec Manual
httpslidepdfcomreaderfullinfraspec-manual 4552
until this button is pressed This allows the user to disregard data that was taken erroneouslyNote that if the Accept Results button is not pressed no log file will be saved
If the data log setup is set to ASK wNote (see Section 5413) The note entry box will bedisplayed as well This allows for entry of explanations sample namesconcentrations or othercomments to be appended to the data log file To retrieve the notes open a log file in the
standard program and press the Sel Traces button Select the log spectrum that containsthe desired note and the Spectrum Info box will appear This box will contain the notesentered in the Simplified Programs
If the Run Sample or Run Background button is pressed before accepting the currentresults a warning will appear asking the user whether they really want to run a newsamplebackground without accepting the current results Once the Accept Results buttonhas been pressed it will become disabled and the notes entry box will disappear
6232 PassFail OptionIn addition to displaying the concentration it is also possible to display passfailmarginal data
See Section 5527 for more information on setting the passfail limits If this option is set theresult will be displayed as red (fail) yellow (marginal) or green (pass) as shown in Figure 42below In addition the passfail result will be displayed The concentration may or may not bedisplayed along with the passfail result depending on the options set Example results withthis option set are shown in Figure 42
Figure 42 PassFail Display Examples
8132019 InfraSpec Manual
httpslidepdfcomreaderfullinfraspec-manual 4652
624 Help and Exit buttonsPressing the Help button will open the help file either a pdf or text document as chosen in theSimple Program setup (see Section 5622) The default help file is this manual The ability tochoose a help file allows administrators to provide specific information for the analysis that theuser will be running
Pressing the Exit button will return the user to the startup screen
625 Reportrdquo Button A report button is provided to allow a user to print or save reports that include detailed data fromthe current sample or general data from any number of past samples When the button ispressed the window shown in Figure 43 will appear Pressing the Print Report button will printthe selected report automatically using the default printer for the computer Pressing SaveReport button will save the report a file
Figure 43 Generate Report Window
6251 Single Detail ReportIf a single report of the current sample is desired select Single Detail Report This report willcontain the information shown in Figure 44 below If the report is saved with the Save Reportbutton this file will be saved as an Adobe Acrobat pdf file
8132019 InfraSpec Manual
httpslidepdfcomreaderfullinfraspec-manual 4752
Figure 44 Detail Report Example
6252 Date Range ReportIf a report of past samples is required select the Date Range Report option Selectionmenus will appear that allow the selection of the date range specified Any log files located inthe current log folder that were created within the selected date range will be included in thereport An example of a date range report can be found in Figure 45 If the Date RangeReport is selected to be saved it will be saved as a comma separated value file that can beopened with Microsoft Excel or any other spreadsheet program
Figure 45 Date Range Report Example
8132019 InfraSpec Manual
httpslidepdfcomreaderfullinfraspec-manual 4852
63 Materials Verification Simplified ProgramThe Materials Verification simplified program can be used to verify that the correct material has beenreceived from a shipping depot or lab Any application where a known sample must be verified to bethe correct material can utilize this simplified program
In order to use this simplified program a materials library of a least one sample spectrum must be
created first See Section 57 for more information In addition other setup parameters must beentered See Section 5 for more details on the setup parameters used for the Materials VerificationSimplified Program The steps involved in verifying a material can be found below
631 Step 1 Run a BackgroundWhen the program first starts the screen shown in Figure 46 will be present The user will beprompted to run a background All buttons except the Run Background button will be disabledClick the Run Background button to acquire a background The background will begin a graphwill denote the background progress as shown in Figure 47 Pressing Stop Scans will halt theacquisition and no background will be saved
Figure 46 Materials Verification Startup Screen
Figure 47 Materials Verification Background Acquisition
8132019 InfraSpec Manual
httpslidepdfcomreaderfullinfraspec-manual 4952
632 Step 2 Choose a Material After a background has been acquired press the Choose Material button to bring up the screenshown in Figure 48 Select the material type from the library list and then press Select Ascreen will display the material to be verified as shown in Figure 49
Figure 48 Choose Material Screen
Figure 49 Ready to Verify Screen
633 Step 3 Run a Sample After a selecting the material to verify place a sample on the spectrometer and click RunSample Sample acquisition will begin and a graph will display progress Once the sample hasbeen acquired and verified a screen similar to either Figure 50 or Figure 51 depending onwhether the sample was verified or not will appear
The green or red box will state whether the material was verified and in addition will give detailsabout the spectral match The Match Method is the method that was used to verify the materialeither subtraction mean centered subtraction or mean centered unit variance subtraction
8132019 InfraSpec Manual
httpslidepdfcomreaderfullinfraspec-manual 5052
The Largest Acceptable Deviation Value is the highest deviation value that will still give a verifiedresult This is set by the administrator in the setup panel (see Section 561) The Percent Matchis a closeness of fit parameter based on the deviation value and largest acceptable deviationvalue The largest acceptable deviation value is set to a percent match of 70 percent and adeviation value of zero (perfect fit) is set to 100 This makes any value below the largest
acceptable deviation value have a passing grade of 70 or above Values above the largestacceptable deviation value will have a failing grade below 70 In addition to this scale theactual deviation value found is printed as well
Depending on the settings chosen for data logging the Accept Results button may be presentIf so this button must be pressed in order to save a log file This prevents undesired resultsstemming from operator mistakes etc from being saved as a log file In addition a notes areamay be present that allows the entry of notes about the sample Once the Accept Resultsbutton has been pressed it will become disabled and the note entry box will disappear
Figure 50 Material Verified Screen
Figure 51 Material Not Verified Screen
8132019 InfraSpec Manual
httpslidepdfcomreaderfullinfraspec-manual 5152
7 Spectrometer Specifications
Dimensions 275rdquo x 60rdquo x 65rdquo 7 cm x 1525 cm x 165 cm
Weight 30 lbs 14 kg ( total with standard ATR plate )
PC Interface RS-232 or USB
Power Requirements 12V DC 20 amps
Power Supply Universal ACDC converter type (supplied as standard)
Detectivity D 10 Hz 15-10 (cmHz)
W
Suggested Temp Operating Range 15oC - 60oC
Humidity 0 ndash 98 relative humidity (non-condensing)
Detector Array 128 Pixel linear pyroelectric array
Standard Spectral Ranges 25-5 983221m (2000-400 cm-1
) 53-108 983221m (1890-925 cm-1)
)7-14 983221m (1430-710 cm
-1))
Resolution 25 cm-1
ATR Crystal Material Cubic Zirconia Zinc Selenide or Zinc Sulfide
ATR Surface Size 50 x 16 mm
of Reflections 10
8132019 InfraSpec Manual
httpslidepdfcomreaderfullinfraspec-manual 5252
8 Service and Technical Support
Your InfraSpecreg VFA-IR Spectrometer may have been purchased either directly from Wilks Enterprise or
from a local dealer or representative In cases of any difficulties or problems associated with operation
you are recommended to contact your local representative or dealer first If the analyzer was purchaseddirect or if there are problems that are unanswered by the local representative or you have a technicalquestion relative to the operation of the instrument or relative to the analysis please contact WilksEnterprise at the contact address provided below
Customer Services DepartmentWilks Enterprise Inc25 Van Zant StreetSuite 8FEast Norwalk CT 06855
Telephone (203) 855-9136FAX (203) 838-9868E-mail techWilksIRcom
Service and Repair
During the warranty period Wilks Enterprise Inc offers free factory service for all failures that occur fromnormal instrument usage The user is only required to cover the cost of shipping the instrument to the factory After the warranty period the user is required to cover the factoryrsquos cost of servicing plus all shipping chargesNormal one week turnaround is offered for all InfraSpec instruments that are returned to the factory forservice For users requiring faster service times Wilks Enterprise also offers an advance replacementprogram that can respond to a userrsquos needs with instrument replacement typically in less than 24 hours Forextended service contracts advanced replacement programs factory service charges please contact WilksEnterprise Inc for details
Please note As we get feedback from our customers we will upgrade the software and the manual and send updates Your
comments and suggestions will be greatly appreciated For comments software updates or manual updates please send your email information to infowilksIRcom and note that you want to be put on the InfraSpecCustomer list
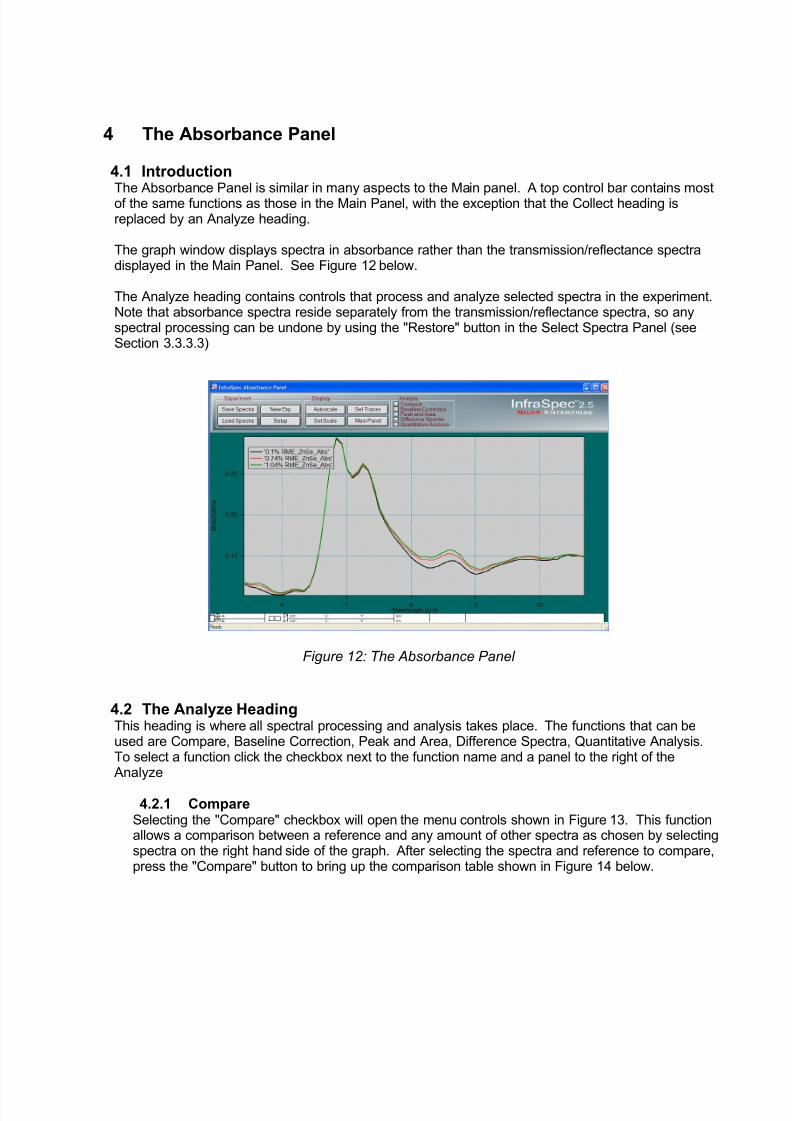
8132019 InfraSpec Manual
httpslidepdfcomreaderfullinfraspec-manual 2352
the Clear Region button To exclude only part of a region place the cursors on the desiredregion to exclude and press the Exclude button The excluded region will no longer behighlighted in yellowOnce a desired region has been selected the Force Reg to Zero or Baseline Correct can bepressed to complete the baseline correction Force Reg to Zero shifts the entire spectrum sothat the average value of the selected region is zero Baseline Correct calculates a linear fit
across the selected region and then shifts the spectrum so that the calculated fit line has zeroslope and intercept
423 Peak and AreaSelecting the Peak and Area checkbox will open the baseline correction panel shown in Figure16 below This function calculates the peak location peak absorbance value and area of aselected region
Figure 16 Peak and Area Controls
In order to calculate the peak and area values first display the desired spectra to be analyzed onthe absorbance graph window Then select a region using the cursors at the bottom of the screenor alternatively use the manual range entry boxes Once the desired region is selected press theInclude button The selected region will be highlighted in yellow To clear the region press theClear Region button
Once the desired region has been selected and included the Peak and Area of Region buttoncan be pressed in order to bring up the table shown in Figure 17 below This table includes thepeak location peak absorbance value and the area of the selected region along with analysis
details The data from this table can be copied and pasted into another program for furtherprocessing
Figure 17 Peak and Area Table
424 Difference SpectraSelecting the Difference Spectra checkbox will open the difference spectra controls shown inFigure 18 These functions are useful for subtracting one spectrum from another In order to
8132019 InfraSpec Manual
httpslidepdfcomreaderfullinfraspec-manual 2452
difference spectra first choose a reference spectra or minuend This is the spectrum that will besubtracted from the sample spectrum
Next choose the sample spectrum or subtrahend Once both spectra have been chosen thesubtraction slider can be used to choose the correct subtraction weight The subtraction weight isthe percent of the reference spectrum that is subtracted from the sample spectrum As the slider
is moved the resulting difference spectrum is displayed in the graph window Additionally thesubtraction weight can be entered manually in the entry box or adjusted with the up and downarrows to the right of the entry box
Note that the original spectra are not affected by generating a difference spectrum Differencespectra are separate entities and can be displayed in the absorbance window much likeabsorbance spectra Difference spectra take the name of the sample spectrum with _diffappended at the end of the name
Figure 18 Difference Spectra Controls
425 Quantitative AnalysisSelecting the Quantitative Analysis checkbox opens the controls shown in Figure 19 Thesefunctions allow quantitative analysis within the standard program In order to use these functionsat least one calibration must be created See Section 55 for information on how to generate acalibration Note that a simplified quantitative analysis program allows for quantitative analysis byuntrained personnel See Section 62 for more information on the simplified quantitative analysisprogram
Figure 19 Quantitative Analysis Controls
In order to quantitatively analyze spectra in the current experiment first choose a calibration orcalibrations to analyze for Up to eight calibrations can be analyzed at the same time Once thedesired calibrations are selected select the spectra to be analyzed using the list box to the right
8132019 InfraSpec Manual
httpslidepdfcomreaderfullinfraspec-manual 2552
All or no spectra can be selected using the Sel All and Sel None buttons below the list boxMake sure that the spectra to be analyzed are appropriate for the calibration selected to ensurecorrect quantitative values
After selecting calibrations and spectra to be analyzed press the Analyze button This will bringup a table similar to that shown in Figure 20 Each spectrum name is displayed and the resulting
concentrations for each calibration are shown in the appropriate column The data from this tablecan be copied and pasted into another program for further analysis
Figure 20 Quantitative Analysis Table
8132019 InfraSpec Manual
httpslidepdfcomreaderfullinfraspec-manual 2652
5 The Setup Panel
51 IntroductionThe setup panel accessed either from the Setup button under the Experiment heading in the mainand absorbance windows or from the Setup Panel menu item under the InfraSpec Setup menucontains all of the functions for setting up and customizing the InfraSpec program In additionCalibrations can be generated and Libraries for Materials Verification can be built This sectiondescribes all of the setup options available
The setup panel contains several tabs with different controls in each along with a set of buttons atthe bottom that are available in every tab Each tab will be explained separately below
52 Bottom ButtonsThe buttons found at the bottom of the setup panel are available in every tab of the setup panel andare shown in Figure 21 below These buttons are used for saving the changes that have been madein the setup panel The changes can be either saved for use only in the current experiment using the
Save For This Session button or saved as the default setup so that every experiment will use thecurrent settings with the Save Setup as Default button
Figure 21 Bottom Setup Panel Buttons
521 Save For This Session ButtonThis button allows temporary changes to be made to a current experiment without affecting the
default values for subsequent experiments This option is useful for changing a setting for aspecific experiment such as adjusting the number of scans or changing the x-axis units Whenthis button is pressed the setup panel is closed and the values changed in the setup panel willtake effect for the current experiment
522 Save Setup as Default ButtonThis button allows permanent changes to be made to the setup values This is useful for the initialsetup of the spectrometer or for changes that will be used many times When this button ispressed the setup panel will close and all subsequent experiments will use the settings chosen asdefault settings
523 Revert to Default SetupThis button reverts all settings to the default values as chosen the last time the Save Setup asDefault button was pressed This is useful to change back many settings made temporarily Inaddition it is useful to revert to the default setting if problems are occurring that may be due tochanges in the Setup Panel
524 Cancel ButtonThis button closes the Setup Panel and cancels any changes made to the setup panel since it wasopened Note that calibrations are left unchanged by the Cancel button
8132019 InfraSpec Manual
httpslidepdfcomreaderfullinfraspec-manual 2752
53 General TabThis tab contains basic setup controls for the spectrometer and experiment The controls shown inFigure 22 will be displayed when this tab is selected or the Setup Panel is first opened
Figure 22 General Setup Tab
531 Experiment Setup HeadingThis heading contains controls used for the setup of the InfraSpec program and experiment Eachcontrol is explained below
5311 of ScansThis control selects the number of scans that a background and sample spectrum will beaveraged from The higher the number of scans the lower the resulting spectral noise Eachscan takes approximately 15 seconds so a setting of 40 scans will allow a spectrum to becompleted in approximately 1 minute 40 Scans is recommended for most applications
5312 Max Bkgd AgeThis option selects the maximum age of a background scan In the standard program awarning will pop up once the background has expired however the user may still run aspectrum using the expired background In the simplified Quantitative Analysis and MaterialsVerification programs the user must run a new background the current background hasexpired This setting can be set to off as well to never warn that the background has expired
5313 X UnitsThis control selects the units used for the X-axis either microm (microns) or cm-1 (wavenumber)
5314 InterpolationThis control selects whether the spectra displayed are interpolated The interpolation is donevia a cubic spline algorithm The number of points in an interpolated spectrum is 1280
8132019 InfraSpec Manual
httpslidepdfcomreaderfullinfraspec-manual 2852
5315 Crosstalk CorrectionCrosstalk correction is a proprietary correction algorithm that attempts to eliminate crosstalkbetween pixels due to incorrect illumination from imperfectly collimated source light as well asfrom thermal crosstalk between pixels The result is an increase in apparent resolution Thisshould be used for qualitative analysis where the most spectral detail is desired It is notrecommended for quantitative analysis or materials verification
5316 Ask to SampleThis option allows the selection of an extra step before sampling or running a background Ifthis is set to ON when the Sample or Background button are pressed a pop up will ask if theuser is ready to run a new spectrum This prevents an accidental spectrum or backgroundfrom occurring When the selection is set to OFF a background or sample spectrum willimmediately begin after the correct button is pressed
5317 Trace TagsTrace tags will appear on the Main panel and Absorbance panel when a spectrum is clicked inthe graph pane The tag can show the sample name of the spectrum clicked by setting thetrace tags option to ldquoNotes Onlyrdquo or it can show details spectrum information by setting theoption to ldquoDetailedrdquo The tags can also be turned off here
5318 Save FolderThis setting selects the default folder to be opened when a spectrum is saved or loaded IfInfraSpec_Data is selected every time the Save Spectra or Load Spectra button ispressed the InfraSpec_Data folder will be the start folder in the saveload dialog If LastFolder Used is selected the folder that was last navigated to on a load or save will be the startfolder in the saveload dialog
5319 CompanyThis control sets the company that is using the spectrometer This name is reported in log filesand reports
53110 AddressThis control sets the company address for the company using the spectrometer This addressis reported in log files and reports
53111 OperatorThis control sets the company address for the company using the spectrometer This name isreported in log files and reports
532 Spectrometer Setup HeadingThis heading contains controls used for the setup of the InfraSpec spectrometer hardware Eachcontrol is explained below
5321 microm at First and Last PixelThe wavelength values located at the back of the instrument should be entered here Thisensures that the spectra collected will have the correct x-units
5322 Sample StageThis allows the selection of the sample stage type either ATR or Transmission This ensuresthat the y axis contains the correct units and that the crosstalk correction values areappropriate for the sample stage of the selected spectrometer
8132019 InfraSpec Manual
httpslidepdfcomreaderfullinfraspec-manual 2952
5323 Serial PortThis setting selects the current serial port that the InfraSpec is connected to If thespectrometer is connected correctly and the program does not recognize the spectrometer theserial port may be incorrectly set Use this setting to change the serial port and then use theConnect Spectrometer menu item under the InfraSpec Setup menu to connect thespectrometer This can also be used to select between different instruments if multiple
spectrometers are connected to the same computer
54 The System TabThe controls shown in Figure 23 will be displayed when the System tab is selected This tabcontains setup controls for program startup and logging
Figure 23 System Setup Tab
541 Startup HeadingThese functions control how the program starts depending on whether the Quantitative Analysis orMaterials Verification programs will be used See Section 6 for more information on theQuantitative Analysis and Materials Verification simplified programs
5411 Startup Options PanelIf this control is set to ON a startup panel will appear at startup rather than the standardprogram starting immediately On this panel there are buttons that allow the user to choosewhether to start the program in the standard mode or a simplified mode (quantitative analysis
or materials verification) In order to have a selection for a simplified program appear in thestartup panel check the box next to the simplified program desired When the program isrestarted a button choice will allow the user to start the program in the selected simplifiedmode
5412 PasswordIf the Sys Setup control is set to ON then a password entry box will appear at the startuppanel This allows an administrator to set up the simplified programs and limit the use of theinstrument to the simplified programs unless an administrator password is used The password
8132019 InfraSpec Manual
httpslidepdfcomreaderfullinfraspec-manual 3052
can be set by pressing the SetChange Password button Note that the default password isblank
5413 Data LogThese functions adjust how the InfraSpec program logs data in the simplified program Bydefault every spectrum is logged in the standard InfraSpec format Data log files can be
opened in the standard program just like normal spectra Information about the log file such asconcentration or materials verification data can be accessed in the standard program throughthe spectra info box that appears when the Sel Traces button is pressed and a spectrum ishighlighted in the list
In addition to setting the Data Logging to ON or OFF two other options exist First theoption ASK allows the user of the simplified program to decide whether or not to save a logfile ASK w note also allows the user to decide whether or not to save a log file and alsoallows the user to enter notes about the data that was obtained These notes are accessiblethought the spectra info box as described in the previous paragraph More information on thefunctions of the data log can be found in Section 6 with regards to their operation within thesimplified programs
55 The Calibration TabThe controls shown in Figure 24 will be displayed when the Calibration tab is selected This tabcontains functions which allow the generation of calibrations for use in quantitative analysis Up toeight different calibrations can be generated separately There could be for example 8 differentconstituents of the same material to be measured or 8 separate calibrations of different materialsQuantitative analysis can be done in one of two ways First it can be done in a simplified programdedicated to quantitative analysis See Section 62 for more information Second it can be done inthe absorbance panel under the analysis heading See Section 427 for more information
Calibrations are generated using the Calibration Wizard described in Section 552
Figure 24 The Calibration Setup Tab
8132019 InfraSpec Manual
httpslidepdfcomreaderfullinfraspec-manual 3152
551 Current Calibrations Saving and Loading CalibrationsThe current loaded calibrations are shown in the middle of the Setup Panel in the Calibration tabThese are the calibrations that can be used in the current experiment Calibrations can be savedand loaded one at a time by using the appropriate button below the current calibrations Thismakes it possible to use any number of calibrations for the InfraSpec although only 8 can bepresent in the program at any given time Up to eight calibrations can be loaded into the
program however only 4 can be displayed simultaneously in the simplified program (See Section62 for more information)
552 Creating a CalibrationIn order to begin a calibration press a calibration button at the bottom of the setup panelUsually if only one calibration is desired calibration 1 is used Pressing the calibration button willbring up the Calibration Wizard shown in Figure 25 Clicking Next continues to the next stepClicking Back return you to a previous step and Cancel will close the wizard without savingany calibration
Figure 25 Calibration Wizard Step 1
5521 Calibration Wizard Step 1On the first step of the Calibration Wizard there is a button that allows the user to reset thecurrent calibration Pressing this button will completely clear the calibration data for theselected calibration Note that this will permanently delete the selected calibrationStep 1 also asks to choose the type of calibration desired
A standard calibration uses peak or area measurements in combination with baseline
correction to generate a calibration curve PLS or Partial Least Squares regressioncalibrations use a more complicated mathematical approach to the calibration This type ofcalibration can generate better results especially if the desired measurement peak containsinterferences or cannot be calculated well with a typical area measurement
Due to the complicated nature of this type of calibration please contact Wilks Enterprise Inc ifa PLS type calibration is desired The standard calibration steps will be described firstfollowing with the PLS calibration steps Note that Steps 1 and 2 are the same for both types ofcalibrations Click Next to continue
8132019 InfraSpec Manual
httpslidepdfcomreaderfullinfraspec-manual 3252
5522 Calibration Wizard Step 2The second step of the Calibration Wizard can be found in Figure 26 below Enter the name ofthe calibration to be measured along with the units of the measurement In addition specifythe precision of the measurement This is the number of significant digits that the final result
will be rounded to
Figure 26 Calibration Wizard Step 2
5523 Calibration Wizard Step 3 (Standard)The third step of the calibration wizard is shown in Figure 27 Enter the type of calibrationeither Area of Region or Peak Value If area of region is used enter the wavelength range
that the area measurement is to be calculated from If peak value is used enter the peak valueto be used for the calibration
Figure 27 Calibration Wizard Step 3 (Standard)
8132019 InfraSpec Manual
httpslidepdfcomreaderfullinfraspec-manual 3352
5524 Calibration Wizard Step 4 (Standard)The fourth step of the Calibration Wizard can be found in Figure 28 In this step choose thebaseline correction and enter the ranges that the correction will be calculated on For baselinecorrection two ranges are required For force region to zero one range is needed If a singlepoint is desired enter the sample value for start and end values See Section 422 for moreinformation on baseline correction
In addition interpolation and crosstalk correction for the calibration can be selected here Thiswill select the corrections to be done before a spectrum is analyzed In most casesinterpolation should be left on and crosstalk correction should be left off See Section 531 formore information on interpolation and crosstalk correction
Figure 28 Calibration Wizard Step 4 (standard)
5525 Calibration Wizard Step 5 (Standard)The fifth step of the Calibration Wizard can be found in Figure 29 In this step spectra arechosen to use as calibration spectra To add a calibration spectrum press the Add CalibrationSpectra button A list will appear containing all the spectra in the current experiment Choosethe desired spectra and press the Select located below the list The wizard will prompt you toenter a concentration value for each selection
Once a concentration values is entered press Continue A graph of the chosen spectracorrected using the baseline corrected values entered in step 4 of the wizard will appearCursors on the graph denote the area or peak value to be used for the calibration This graph
allows for a final check to make sure the spectrum and area regions are correct
The wizard will ask whether this spectrum is correct Click OK and the area or peak valuewill be automatically calculated and entered into the table shown on the calibration wizardpanel along with the concentration and sample and file name information In addition a pointwill be plotted on the graph of concentration vs area or concentration vs peak heightContinue adding calibration spectra in this manner until all have been entered Once this hasbeen completed click Next to go to the next step
8132019 InfraSpec Manual
httpslidepdfcomreaderfullinfraspec-manual 3452
If data points are incorrect or need to be removed highlight the point or points on the table andclick Remove Sel From Table The selected points will be removed from the table and thegraph to the right
Figure 29 Calibration Wizard Step 5 (Standard)
5526 Calibration Wizard Step 6 (Standard)The sixth step of the calibration wizard can be found in Figure 30 In this step the calibrationcurve is specified This curve will be used to calculate concentration values for this calibrationFirst choose the fit type either Linear Linear w Zero Intercept or Exponentialrdquo ldquoDoubleExponentialrdquo ldquoCubic Splinerdquo and ldquo2
nd Deg Polynomialrdquo
Once the fit type has been selected press the Generate Fit Curve button The desired fit willbe displayed on the graph and information about the fit can be found in the lower right sectionof the graph RMSE stands for Root Mean Squared Error and is a goodness of fit measurethat can be used to compare different calibration fits
If the fit is incorrect it can be removed with the Clear Fit Curve button Once the desired fithas been placed on the graph click Next to continue If you are unsure which curve functionto use contact Wilks Enterprise Inc for assistance
It is also possible to ldquoCross Validaterdquo the fit by pressing the ldquoCross Validaterdquo button In order touse this feature first select the number of calibration points to leave out This should be equalto the number of replicates of the same concentration entered in Step 5 previously When
ldquoCross Validaterdquo is pressed the program will leave out each successive concentration level andgenerate a fit curve without a given concentration level The fit curve generated will be used topredict the value(s) of the left out calibration points This allows a more robust prediction of theperformance of the calibration curve It is possible to omit the endpoints in the cross validationby checking the appropriate checkbox Since curve fitting works best interpolating theendpoints will include more error as the calibration curve must extrapolate in order to predictthese values
8132019 InfraSpec Manual
httpslidepdfcomreaderfullinfraspec-manual 3552
Figure 30 Calibration Wizard Step 6 (Standard)
5527 Calibration Wizard Step 7The next calibration step is shown in Figure 31 In this step further calibration options arechosen Passfail ranges can be set and calibrations can be set to only run separate of othercalibrations Options in this step will affect only the Quantitative Analysis Simple ProgramSee Section 62 for more information on this program
The passfail range option allows a calibration to not only print a concentration but alsoindicate whether a sample is within preset limits In order to use the pass fail ranges firstselect the passfail range to ldquoONrdquo or ldquoON with no numeric datardquo The latter option will displayonly passfail indication and no numeric concentration will be displayed in the Quantitative
Analysis Simple Program
After passfail range has been turned on select the concentrations for low failure low passhigh failure and high pass results If a sample concentration is below the low failure point orabove the high failure point the result will indicate a failure If the sample concentration isbetween the low pass and high pass point the result will indicate a pass If the sampleconcentration lies between the low failure and low pass or high failure and high pass amarginal result will be indicated This will usually mean that the result should be verified withanother sample or another method
In addition to the passfail range option this step also contains an option to set the calibrationto run separate of other calibrations This is usually necessary when a special background isrequired for an analysis If this option is set to ldquoyesrdquo then this calibration will not be allowed torun simultaneously with other calibrations in the Quantitative Analysis Simple Program
8132019 InfraSpec Manual
httpslidepdfcomreaderfullinfraspec-manual 3652
Figure 31 Calibration Wizard Step 7
5528 Calibration Wizard Step 8This is the final calibration step which is shown in Figure 32 below This step informs the userthat the Calibration is complete No further action is required Press the Save Calibrationbutton to exit the calibration wizard and save all changes The calibration will appear in theCalibration Tab as shown in Figure 24
Figure 32 Calibration Wizard Step 8
553 PLS CalibrationsIn addition to the standard calibration the InfraSpec program allows for a Partial Least Squares(PLS) type of calibration These calibrations are many times more robust especially if there areinterferences close to the desired measurement region The InfraSpec software does notsupport generating PLS calibrations directly within the program Instead Wilks Enterprise Inccan be contacted to help facilitate this type of calibration Wilks Enterprise Inc can provide the
8132019 InfraSpec Manual
httpslidepdfcomreaderfullinfraspec-manual 3752
calibration files needed to complete the PLS calibration wizard In addition advanced users cangenerate calibration files using third party software Contact Wilks Enterprise Inc for moreinformationNote Steps 1 2 7 and 8 are the same as for the standard calibrations so they are omittedbelow See Section 552 for information on these steps
5531 Calibration Wizard Step 3 (PLS)The PLS Calibration Wizard Step 3 can be found in Figure 33 below In this step the Slope
Array (denoted B) is loaded Click Choose Calibration File to navigate to the file given byWilks Enterprise Inc or generated on third party software If the correct file is chosen thecalibration point numbers will appear in the table to the right The intercept value should alsoappear the correct location
Figure 33 Calibration Wizard Step 3 (PLS)
5532 Calibration Wizard Step 4 (PLS)The PLS Calibration Wizard Step 4 can be found in Figure 34 below In this step choose anypretreatment to be done on the spectra before calculation Currently only mean centering issupported however future versions of the program may contain more pretreatment optionsSelect the pretreatment type if any click Next to continue Note that the final Step 6 is theSame as Step 7 of the standard calibration
8132019 InfraSpec Manual
httpslidepdfcomreaderfullinfraspec-manual 3852
Figure 34 Calibration Wizard Step 5 (PLS)
56 Simplified Program TabThis tab contains settings that affect the Materials Verification Simplified program mode Figure 35below shows the setup of this tab
Figure 35 Simplified Program Setup Tab
561 Materials Verification Setup
This group of controls affects the Materials Verification Simplified Program only See Section 63for more information on the Materials Verification Simplified Program
5611 Largest Acceptable Deviation ValueThis control sets the largest deviation allowed that still will result in a pass This result isdirectly related to the Match Method below The deviation value is the value that would beobtained by running a spectral comparison in the standard program The Compare function isuseful in deciding what this value should be set to by comparing spectra from a standardspectrum (See Section 421 for more information on spectral comparison) This value is set to
8132019 InfraSpec Manual
httpslidepdfcomreaderfullinfraspec-manual 3952
70 on the percentage passfail scale so that values above this level are failing and valuesbelow are passing
5612 Match MethodThis control sets the method that the materials verification will use to match a data spectrumwith the reference The match methods are described in detail in Section 421 Note that the
match method chosen affects the largest acceptable deviation value since this value willchange depending on the match method used
5613 Range LimitsIf the Range Limits control is set to ON entry boxes will appear that allow a start and endrange for the verification to work on This allows for a verification to be done on a part of thespectrum that is of interest instead of the whole spectrum
5614 No Sample ThresholdThis control if set to ON uses the variance of a data spectrum that has just been acquired totest whether there is a sample placed on the spectrometer If no sample is detected a warningwill appear and the match calculation will not proceed This is useful for preventing falseverification failures due to a user mistake of not putting sample on
The Threshold value is the sensitivity The default value of 100 is roughly a mediumsensitivity but this value may need to be changed depending on the type of materials to beverified If a false no sample report is given in the simplified program this number should beset to a lower value If a sample is not placed on the crystal and a no sample report is not
displayed in the simplified program then this number should be set to a higher value
562 Simplified Program SetupThese controls affect the Quantitative Analysis and Materials Verification simplified programsonly Each control is explained below See Sections 6 and 7 for more information on thesimplified programs
5621 Barcode ScannerSetting this control to ON makes another step in the simplified programs that asks for abarcode to be scanned in or entered manually This is useful if samples to be processedcontain a barcode as an identifier The barcode number will be saved in the spectrum note forthe log file which can be accessed in the standard program through the Spectrum Info panelonce the log file has been loaded into the experiment This panel is accessed by pressing theSel Traces button and clicking on the desired spectrum
5622 Help FilesThe simplified programs have a Help button which can be clicked by the user in order to bringup pertinent information to aid the user in using the instrument This help file can be anyMicrosoft Word text or Adobe pdf file The default file is this manual however manyapplications may require specific instructions If this is the case press Change Help File A
dialog will allow you to navigate to the correct help file Once the help file has been selectedthe directory to the help file will be displayed below the button
57 Verif Library TabThis tab allows the user to create modify and save different libraries used for materials verificationFigure 36 shows the Verification Library Tab below The current library is the library that will be usedby the Materials Verification simplified program The window on the left shows the spectra currently
8132019 InfraSpec Manual
httpslidepdfcomreaderfullinfraspec-manual 4052
contained in the library There is no limit to the number of spectra that can be added to the librarySpectra contained in this library are the spectra that a user in the simplified program will have thechoice of selecting as the reference material for verification If only one spectrum is contained in thelibrary the user of the simplified program will not have to choose a reference material Libraries canbe saved and reloaded as needed but the current loaded library will be the only active library in theMaterials Verification simplified program Each of the button controls on the tab will be explained
below
Figure 36 Verif Library Setup Tab
571 Add to LibraryClicking the Add to Library button will change the controls to library addition controls shown inFigure 37 below On the left side there is a list of spectra in the current experiment To add a
spectrum to the current library select the spectra desired from the list and click the Add button A dialog will ask for a name entry This allows spectra in the library to have a different namethan that of the spectrum used in the current experimentOnce all desired spectra have been added to the library clicking the Back button will return tothe normal library controls
Figure 37 Verif Library Addition Controls
8132019 InfraSpec Manual
httpslidepdfcomreaderfullinfraspec-manual 4152
572 Delete SelThis button will delete a spectrum from the library Select all the spectra to be delete and clickthis button to permanently delete the spectra from the current library
573 Load LibraryThis button will load a saved library into the current library Note that any spectra in the current
library before the load will still reside in the library In other words the spectra from the loadedlibrary will be added to the current library When this button is pressed a dialog will allow theuser to navigate to a library file
574 Save LibraryWhen this button is pressed a dialog will appear that allows the entry of a name for saving alibrary Note that the saving a library is different than saving the current library A saved librarywill not be loaded during the startup of the InfraSpec program In order to save the current libraryas the default press the Save as Default bottom button After this has been done the currentlibrary will be loaded on each InfraSpec program load including in the simplified program mode
8132019 InfraSpec Manual
httpslidepdfcomreaderfullinfraspec-manual 4252
6 Simplified Programs for Non-Technical Operators
61 IntroductionThe InfraSpec program allows for the use of the InfraSpec spectrometer by non-technical operatorsthrough the use of simplified programs containing minimal controls and steps Following the simplesteps allows for a fast and easy analysis using the InfraSpec spectrometer In many cases theseprograms are used daily and the standard program is simply used to set up the instrument Inaddition it is possible to have Wilks Enterprise Inc set up a simplified program in advance so that noset-up is required before use Contact Wilks Enterprise Inc for more informationThe two simplified programs available are Quantitative Analysis which is used to get a quantitativemeasure of up to four calibrations in a single run and materials verification which allows non-technical operators to easily test incoming shipments and verify the material is correct Each will beexplained below
611 Notes on BackgroundsIn both simplified programs running new backgrounds can be done at any time using the
Background button However the background can also be set to expire after a preset amountof time (see Section 5312) Once the background has expired users of the simplifiedprograms will have to run a new background before continuing If it is desired that the user run anew background after each sample then setting the maximum background age to 1 minute andusing at least 40 scans will ensure that the user will be prompted to do soIn addition the background quality can be checked with the ldquocheck backgroundrdquo button SeeSection 3312 for more information on the background checker In the simplified programs thecheck background button will display a number once completed If the number is greater than10 or less than -10 then the sample crystal should be thoroughly cleaned and the backgroundcheck re-run If the number is not within +- 10 on the second attempt it is recommended that anew background be run
62 Quantitative Analysis Simplified ProgramThe Quantitative analysis program allows for up to four calibrations to be measured in a samplesimultaneously by non-technical operators In order to set up a quantitative analysis simplifiedprogram first a calibration must be generated See Section 55 for more information on setting up acalibration Next in order to be able to access the quantitative analysis program the startup optionspanel must be selected and set to display the Quantitative Analysis button See Section 541 formore information Once InfraSpec program has been set up for the Quantitative Analysis SimplifiedProgram restart the InfraSpec Program and click the Quantitative Analysis program to start Thesteps involved in getting a quantitative result will be explained below
621 Step 1 Choose a CalibrationWhen the program first starts the screen shown in Figure 38 will be present The upper righthand side of the screen will contain information about what steps need to be taken to analyze a
sample Before acquriring spectra the calibrations to be used for analysis must be chosenClicking Choose Calibration will make the panel shown in Figure 39 appear Select at least oneand up to four calibrations to analyze and click OK Other calibrations can be chosen at anytime by selecting the Choose Calibrations button on the left side of the screen Note that while8 calibrations can be present in memory only 4 can be chosen to be analyzed and displayed atany given time Some calibrations may be set to run separately of other calibrations so thesecannot be selected with other calibrations
8132019 InfraSpec Manual
httpslidepdfcomreaderfullinfraspec-manual 4352
Figure 38 Quantitative Analysis Startup Screen
Figure 39 Choose Calibrations Panel
622 Step 2 Run a Background After choosing calibrations a background must be run in order to continue The sample button
will not be active until a valid background has been acquired Press the Background button torun a background See Section 3311 for more information on backgrounds A graphicaldisplay will show the background acquisition progress as shown in Figure 40 Pressing the StopScans button will reset back to Figure 38 without finishing the background acquisition Once thebackground has completed the default screen will return as shown in Figure 38 except that theRun Sample button will now be active
8132019 InfraSpec Manual
httpslidepdfcomreaderfullinfraspec-manual 4452
Figure 40 Background Acquisition623 Step 3 Run a SampleOnce a background has been acquired place a sample on the spectrometer fully covering thecrystal or place a sealed cell cuvette or IR card into a transmission model See section 3312for more information on placing a sample on the spectrometer Cover the sample with thesupplied plastic cover or optional stainless steel cover Once the sample has been placed on thespectrometer press the Run Sample button to begin sample acquisition If the barcodescanner option is selected the user will be prompted to scan a barcode or enter thebarcodesample ID number Otherwise the acquisition will begin and a screen similar to Figure40 will appear as the acquisition proceeds Once the spectrum has been acquired a screensimilar to Figure 41 will appear All selected calibrations (up to four) will be displayed in greyboxes with the calibration name and concentration
Figure 41 Sample Concentration Display
6231 Data LoggingNote OptionIf ASK is selected in the Data Log setup found in Section 5413 the Accept Results buttonwill be present at the bottom of the screen The log file for the current sample will not be saved
8132019 InfraSpec Manual
httpslidepdfcomreaderfullinfraspec-manual 4552
until this button is pressed This allows the user to disregard data that was taken erroneouslyNote that if the Accept Results button is not pressed no log file will be saved
If the data log setup is set to ASK wNote (see Section 5413) The note entry box will bedisplayed as well This allows for entry of explanations sample namesconcentrations or othercomments to be appended to the data log file To retrieve the notes open a log file in the
standard program and press the Sel Traces button Select the log spectrum that containsthe desired note and the Spectrum Info box will appear This box will contain the notesentered in the Simplified Programs
If the Run Sample or Run Background button is pressed before accepting the currentresults a warning will appear asking the user whether they really want to run a newsamplebackground without accepting the current results Once the Accept Results buttonhas been pressed it will become disabled and the notes entry box will disappear
6232 PassFail OptionIn addition to displaying the concentration it is also possible to display passfailmarginal data
See Section 5527 for more information on setting the passfail limits If this option is set theresult will be displayed as red (fail) yellow (marginal) or green (pass) as shown in Figure 42below In addition the passfail result will be displayed The concentration may or may not bedisplayed along with the passfail result depending on the options set Example results withthis option set are shown in Figure 42
Figure 42 PassFail Display Examples
8132019 InfraSpec Manual
httpslidepdfcomreaderfullinfraspec-manual 4652
624 Help and Exit buttonsPressing the Help button will open the help file either a pdf or text document as chosen in theSimple Program setup (see Section 5622) The default help file is this manual The ability tochoose a help file allows administrators to provide specific information for the analysis that theuser will be running
Pressing the Exit button will return the user to the startup screen
625 Reportrdquo Button A report button is provided to allow a user to print or save reports that include detailed data fromthe current sample or general data from any number of past samples When the button ispressed the window shown in Figure 43 will appear Pressing the Print Report button will printthe selected report automatically using the default printer for the computer Pressing SaveReport button will save the report a file
Figure 43 Generate Report Window
6251 Single Detail ReportIf a single report of the current sample is desired select Single Detail Report This report willcontain the information shown in Figure 44 below If the report is saved with the Save Reportbutton this file will be saved as an Adobe Acrobat pdf file
8132019 InfraSpec Manual
httpslidepdfcomreaderfullinfraspec-manual 4752
Figure 44 Detail Report Example
6252 Date Range ReportIf a report of past samples is required select the Date Range Report option Selectionmenus will appear that allow the selection of the date range specified Any log files located inthe current log folder that were created within the selected date range will be included in thereport An example of a date range report can be found in Figure 45 If the Date RangeReport is selected to be saved it will be saved as a comma separated value file that can beopened with Microsoft Excel or any other spreadsheet program
Figure 45 Date Range Report Example
8132019 InfraSpec Manual
httpslidepdfcomreaderfullinfraspec-manual 4852
63 Materials Verification Simplified ProgramThe Materials Verification simplified program can be used to verify that the correct material has beenreceived from a shipping depot or lab Any application where a known sample must be verified to bethe correct material can utilize this simplified program
In order to use this simplified program a materials library of a least one sample spectrum must be
created first See Section 57 for more information In addition other setup parameters must beentered See Section 5 for more details on the setup parameters used for the Materials VerificationSimplified Program The steps involved in verifying a material can be found below
631 Step 1 Run a BackgroundWhen the program first starts the screen shown in Figure 46 will be present The user will beprompted to run a background All buttons except the Run Background button will be disabledClick the Run Background button to acquire a background The background will begin a graphwill denote the background progress as shown in Figure 47 Pressing Stop Scans will halt theacquisition and no background will be saved
Figure 46 Materials Verification Startup Screen
Figure 47 Materials Verification Background Acquisition
8132019 InfraSpec Manual
httpslidepdfcomreaderfullinfraspec-manual 4952
632 Step 2 Choose a Material After a background has been acquired press the Choose Material button to bring up the screenshown in Figure 48 Select the material type from the library list and then press Select Ascreen will display the material to be verified as shown in Figure 49
Figure 48 Choose Material Screen
Figure 49 Ready to Verify Screen
633 Step 3 Run a Sample After a selecting the material to verify place a sample on the spectrometer and click RunSample Sample acquisition will begin and a graph will display progress Once the sample hasbeen acquired and verified a screen similar to either Figure 50 or Figure 51 depending onwhether the sample was verified or not will appear
The green or red box will state whether the material was verified and in addition will give detailsabout the spectral match The Match Method is the method that was used to verify the materialeither subtraction mean centered subtraction or mean centered unit variance subtraction
8132019 InfraSpec Manual
httpslidepdfcomreaderfullinfraspec-manual 5052
The Largest Acceptable Deviation Value is the highest deviation value that will still give a verifiedresult This is set by the administrator in the setup panel (see Section 561) The Percent Matchis a closeness of fit parameter based on the deviation value and largest acceptable deviationvalue The largest acceptable deviation value is set to a percent match of 70 percent and adeviation value of zero (perfect fit) is set to 100 This makes any value below the largest
acceptable deviation value have a passing grade of 70 or above Values above the largestacceptable deviation value will have a failing grade below 70 In addition to this scale theactual deviation value found is printed as well
Depending on the settings chosen for data logging the Accept Results button may be presentIf so this button must be pressed in order to save a log file This prevents undesired resultsstemming from operator mistakes etc from being saved as a log file In addition a notes areamay be present that allows the entry of notes about the sample Once the Accept Resultsbutton has been pressed it will become disabled and the note entry box will disappear
Figure 50 Material Verified Screen
Figure 51 Material Not Verified Screen
8132019 InfraSpec Manual
httpslidepdfcomreaderfullinfraspec-manual 5152
7 Spectrometer Specifications
Dimensions 275rdquo x 60rdquo x 65rdquo 7 cm x 1525 cm x 165 cm
Weight 30 lbs 14 kg ( total with standard ATR plate )
PC Interface RS-232 or USB
Power Requirements 12V DC 20 amps
Power Supply Universal ACDC converter type (supplied as standard)
Detectivity D 10 Hz 15-10 (cmHz)
W
Suggested Temp Operating Range 15oC - 60oC
Humidity 0 ndash 98 relative humidity (non-condensing)
Detector Array 128 Pixel linear pyroelectric array
Standard Spectral Ranges 25-5 983221m (2000-400 cm-1
) 53-108 983221m (1890-925 cm-1)
)7-14 983221m (1430-710 cm
-1))
Resolution 25 cm-1
ATR Crystal Material Cubic Zirconia Zinc Selenide or Zinc Sulfide
ATR Surface Size 50 x 16 mm
of Reflections 10
8132019 InfraSpec Manual
httpslidepdfcomreaderfullinfraspec-manual 5252
8 Service and Technical Support
Your InfraSpecreg VFA-IR Spectrometer may have been purchased either directly from Wilks Enterprise or
from a local dealer or representative In cases of any difficulties or problems associated with operation
you are recommended to contact your local representative or dealer first If the analyzer was purchaseddirect or if there are problems that are unanswered by the local representative or you have a technicalquestion relative to the operation of the instrument or relative to the analysis please contact WilksEnterprise at the contact address provided below
Customer Services DepartmentWilks Enterprise Inc25 Van Zant StreetSuite 8FEast Norwalk CT 06855
Telephone (203) 855-9136FAX (203) 838-9868E-mail techWilksIRcom
Service and Repair
During the warranty period Wilks Enterprise Inc offers free factory service for all failures that occur fromnormal instrument usage The user is only required to cover the cost of shipping the instrument to the factory After the warranty period the user is required to cover the factoryrsquos cost of servicing plus all shipping chargesNormal one week turnaround is offered for all InfraSpec instruments that are returned to the factory forservice For users requiring faster service times Wilks Enterprise also offers an advance replacementprogram that can respond to a userrsquos needs with instrument replacement typically in less than 24 hours Forextended service contracts advanced replacement programs factory service charges please contact WilksEnterprise Inc for details
Please note As we get feedback from our customers we will upgrade the software and the manual and send updates Your
comments and suggestions will be greatly appreciated For comments software updates or manual updates please send your email information to infowilksIRcom and note that you want to be put on the InfraSpecCustomer list
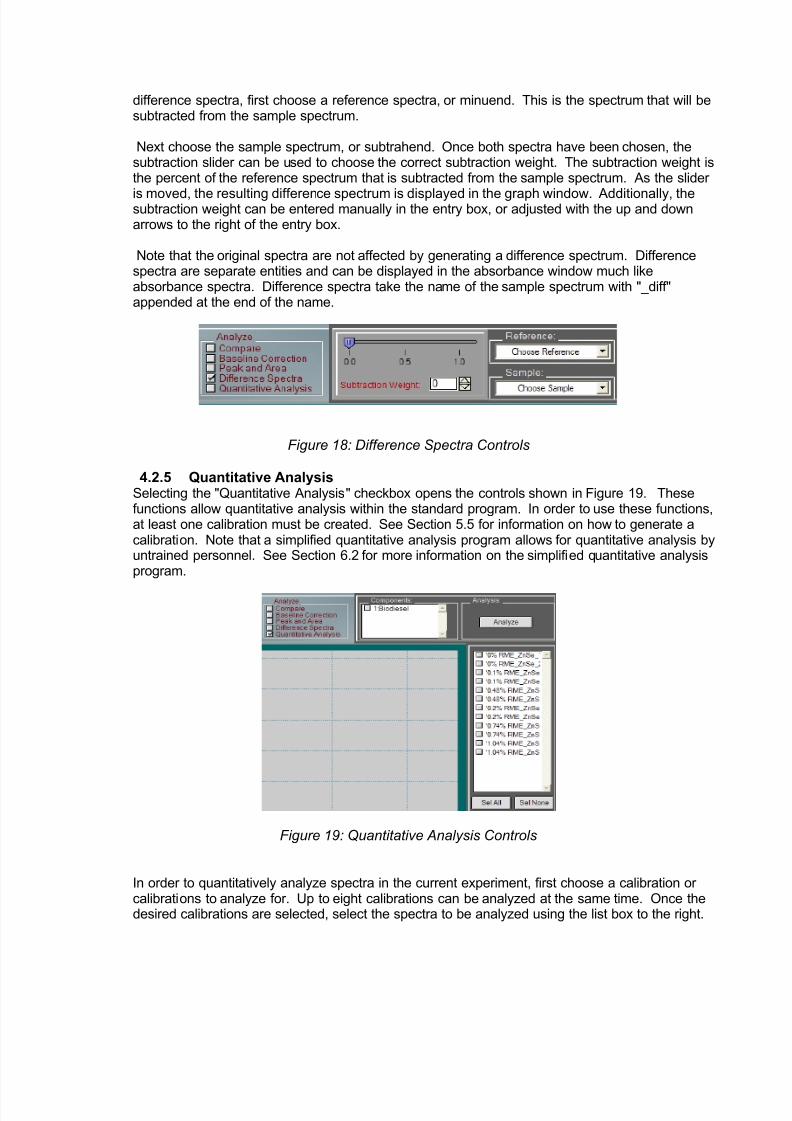
8132019 InfraSpec Manual
httpslidepdfcomreaderfullinfraspec-manual 3052
can be set by pressing the SetChange Password button Note that the default password isblank
5413 Data LogThese functions adjust how the InfraSpec program logs data in the simplified program Bydefault every spectrum is logged in the standard InfraSpec format Data log files can be
opened in the standard program just like normal spectra Information about the log file such asconcentration or materials verification data can be accessed in the standard program throughthe spectra info box that appears when the Sel Traces button is pressed and a spectrum ishighlighted in the list
In addition to setting the Data Logging to ON or OFF two other options exist First theoption ASK allows the user of the simplified program to decide whether or not to save a logfile ASK w note also allows the user to decide whether or not to save a log file and alsoallows the user to enter notes about the data that was obtained These notes are accessiblethought the spectra info box as described in the previous paragraph More information on thefunctions of the data log can be found in Section 6 with regards to their operation within thesimplified programs
55 The Calibration TabThe controls shown in Figure 24 will be displayed when the Calibration tab is selected This tabcontains functions which allow the generation of calibrations for use in quantitative analysis Up toeight different calibrations can be generated separately There could be for example 8 differentconstituents of the same material to be measured or 8 separate calibrations of different materialsQuantitative analysis can be done in one of two ways First it can be done in a simplified programdedicated to quantitative analysis See Section 62 for more information Second it can be done inthe absorbance panel under the analysis heading See Section 427 for more information
Calibrations are generated using the Calibration Wizard described in Section 552
Figure 24 The Calibration Setup Tab
8132019 InfraSpec Manual
httpslidepdfcomreaderfullinfraspec-manual 3152
551 Current Calibrations Saving and Loading CalibrationsThe current loaded calibrations are shown in the middle of the Setup Panel in the Calibration tabThese are the calibrations that can be used in the current experiment Calibrations can be savedand loaded one at a time by using the appropriate button below the current calibrations Thismakes it possible to use any number of calibrations for the InfraSpec although only 8 can bepresent in the program at any given time Up to eight calibrations can be loaded into the
program however only 4 can be displayed simultaneously in the simplified program (See Section62 for more information)
552 Creating a CalibrationIn order to begin a calibration press a calibration button at the bottom of the setup panelUsually if only one calibration is desired calibration 1 is used Pressing the calibration button willbring up the Calibration Wizard shown in Figure 25 Clicking Next continues to the next stepClicking Back return you to a previous step and Cancel will close the wizard without savingany calibration
Figure 25 Calibration Wizard Step 1
5521 Calibration Wizard Step 1On the first step of the Calibration Wizard there is a button that allows the user to reset thecurrent calibration Pressing this button will completely clear the calibration data for theselected calibration Note that this will permanently delete the selected calibrationStep 1 also asks to choose the type of calibration desired
A standard calibration uses peak or area measurements in combination with baseline
correction to generate a calibration curve PLS or Partial Least Squares regressioncalibrations use a more complicated mathematical approach to the calibration This type ofcalibration can generate better results especially if the desired measurement peak containsinterferences or cannot be calculated well with a typical area measurement
Due to the complicated nature of this type of calibration please contact Wilks Enterprise Inc ifa PLS type calibration is desired The standard calibration steps will be described firstfollowing with the PLS calibration steps Note that Steps 1 and 2 are the same for both types ofcalibrations Click Next to continue
8132019 InfraSpec Manual
httpslidepdfcomreaderfullinfraspec-manual 3252
5522 Calibration Wizard Step 2The second step of the Calibration Wizard can be found in Figure 26 below Enter the name ofthe calibration to be measured along with the units of the measurement In addition specifythe precision of the measurement This is the number of significant digits that the final result
will be rounded to
Figure 26 Calibration Wizard Step 2
5523 Calibration Wizard Step 3 (Standard)The third step of the calibration wizard is shown in Figure 27 Enter the type of calibrationeither Area of Region or Peak Value If area of region is used enter the wavelength range
that the area measurement is to be calculated from If peak value is used enter the peak valueto be used for the calibration
Figure 27 Calibration Wizard Step 3 (Standard)
8132019 InfraSpec Manual
httpslidepdfcomreaderfullinfraspec-manual 3352
5524 Calibration Wizard Step 4 (Standard)The fourth step of the Calibration Wizard can be found in Figure 28 In this step choose thebaseline correction and enter the ranges that the correction will be calculated on For baselinecorrection two ranges are required For force region to zero one range is needed If a singlepoint is desired enter the sample value for start and end values See Section 422 for moreinformation on baseline correction
In addition interpolation and crosstalk correction for the calibration can be selected here Thiswill select the corrections to be done before a spectrum is analyzed In most casesinterpolation should be left on and crosstalk correction should be left off See Section 531 formore information on interpolation and crosstalk correction
Figure 28 Calibration Wizard Step 4 (standard)
5525 Calibration Wizard Step 5 (Standard)The fifth step of the Calibration Wizard can be found in Figure 29 In this step spectra arechosen to use as calibration spectra To add a calibration spectrum press the Add CalibrationSpectra button A list will appear containing all the spectra in the current experiment Choosethe desired spectra and press the Select located below the list The wizard will prompt you toenter a concentration value for each selection
Once a concentration values is entered press Continue A graph of the chosen spectracorrected using the baseline corrected values entered in step 4 of the wizard will appearCursors on the graph denote the area or peak value to be used for the calibration This graph
allows for a final check to make sure the spectrum and area regions are correct
The wizard will ask whether this spectrum is correct Click OK and the area or peak valuewill be automatically calculated and entered into the table shown on the calibration wizardpanel along with the concentration and sample and file name information In addition a pointwill be plotted on the graph of concentration vs area or concentration vs peak heightContinue adding calibration spectra in this manner until all have been entered Once this hasbeen completed click Next to go to the next step
8132019 InfraSpec Manual
httpslidepdfcomreaderfullinfraspec-manual 3452
If data points are incorrect or need to be removed highlight the point or points on the table andclick Remove Sel From Table The selected points will be removed from the table and thegraph to the right
Figure 29 Calibration Wizard Step 5 (Standard)
5526 Calibration Wizard Step 6 (Standard)The sixth step of the calibration wizard can be found in Figure 30 In this step the calibrationcurve is specified This curve will be used to calculate concentration values for this calibrationFirst choose the fit type either Linear Linear w Zero Intercept or Exponentialrdquo ldquoDoubleExponentialrdquo ldquoCubic Splinerdquo and ldquo2
nd Deg Polynomialrdquo
Once the fit type has been selected press the Generate Fit Curve button The desired fit willbe displayed on the graph and information about the fit can be found in the lower right sectionof the graph RMSE stands for Root Mean Squared Error and is a goodness of fit measurethat can be used to compare different calibration fits
If the fit is incorrect it can be removed with the Clear Fit Curve button Once the desired fithas been placed on the graph click Next to continue If you are unsure which curve functionto use contact Wilks Enterprise Inc for assistance
It is also possible to ldquoCross Validaterdquo the fit by pressing the ldquoCross Validaterdquo button In order touse this feature first select the number of calibration points to leave out This should be equalto the number of replicates of the same concentration entered in Step 5 previously When
ldquoCross Validaterdquo is pressed the program will leave out each successive concentration level andgenerate a fit curve without a given concentration level The fit curve generated will be used topredict the value(s) of the left out calibration points This allows a more robust prediction of theperformance of the calibration curve It is possible to omit the endpoints in the cross validationby checking the appropriate checkbox Since curve fitting works best interpolating theendpoints will include more error as the calibration curve must extrapolate in order to predictthese values
8132019 InfraSpec Manual
httpslidepdfcomreaderfullinfraspec-manual 3552
Figure 30 Calibration Wizard Step 6 (Standard)
5527 Calibration Wizard Step 7The next calibration step is shown in Figure 31 In this step further calibration options arechosen Passfail ranges can be set and calibrations can be set to only run separate of othercalibrations Options in this step will affect only the Quantitative Analysis Simple ProgramSee Section 62 for more information on this program
The passfail range option allows a calibration to not only print a concentration but alsoindicate whether a sample is within preset limits In order to use the pass fail ranges firstselect the passfail range to ldquoONrdquo or ldquoON with no numeric datardquo The latter option will displayonly passfail indication and no numeric concentration will be displayed in the Quantitative
Analysis Simple Program
After passfail range has been turned on select the concentrations for low failure low passhigh failure and high pass results If a sample concentration is below the low failure point orabove the high failure point the result will indicate a failure If the sample concentration isbetween the low pass and high pass point the result will indicate a pass If the sampleconcentration lies between the low failure and low pass or high failure and high pass amarginal result will be indicated This will usually mean that the result should be verified withanother sample or another method
In addition to the passfail range option this step also contains an option to set the calibrationto run separate of other calibrations This is usually necessary when a special background isrequired for an analysis If this option is set to ldquoyesrdquo then this calibration will not be allowed torun simultaneously with other calibrations in the Quantitative Analysis Simple Program
8132019 InfraSpec Manual
httpslidepdfcomreaderfullinfraspec-manual 3652
Figure 31 Calibration Wizard Step 7
5528 Calibration Wizard Step 8This is the final calibration step which is shown in Figure 32 below This step informs the userthat the Calibration is complete No further action is required Press the Save Calibrationbutton to exit the calibration wizard and save all changes The calibration will appear in theCalibration Tab as shown in Figure 24
Figure 32 Calibration Wizard Step 8
553 PLS CalibrationsIn addition to the standard calibration the InfraSpec program allows for a Partial Least Squares(PLS) type of calibration These calibrations are many times more robust especially if there areinterferences close to the desired measurement region The InfraSpec software does notsupport generating PLS calibrations directly within the program Instead Wilks Enterprise Inccan be contacted to help facilitate this type of calibration Wilks Enterprise Inc can provide the
8132019 InfraSpec Manual
httpslidepdfcomreaderfullinfraspec-manual 3752
calibration files needed to complete the PLS calibration wizard In addition advanced users cangenerate calibration files using third party software Contact Wilks Enterprise Inc for moreinformationNote Steps 1 2 7 and 8 are the same as for the standard calibrations so they are omittedbelow See Section 552 for information on these steps
5531 Calibration Wizard Step 3 (PLS)The PLS Calibration Wizard Step 3 can be found in Figure 33 below In this step the Slope
Array (denoted B) is loaded Click Choose Calibration File to navigate to the file given byWilks Enterprise Inc or generated on third party software If the correct file is chosen thecalibration point numbers will appear in the table to the right The intercept value should alsoappear the correct location
Figure 33 Calibration Wizard Step 3 (PLS)
5532 Calibration Wizard Step 4 (PLS)The PLS Calibration Wizard Step 4 can be found in Figure 34 below In this step choose anypretreatment to be done on the spectra before calculation Currently only mean centering issupported however future versions of the program may contain more pretreatment optionsSelect the pretreatment type if any click Next to continue Note that the final Step 6 is theSame as Step 7 of the standard calibration
8132019 InfraSpec Manual
httpslidepdfcomreaderfullinfraspec-manual 3852
Figure 34 Calibration Wizard Step 5 (PLS)
56 Simplified Program TabThis tab contains settings that affect the Materials Verification Simplified program mode Figure 35below shows the setup of this tab
Figure 35 Simplified Program Setup Tab
561 Materials Verification Setup
This group of controls affects the Materials Verification Simplified Program only See Section 63for more information on the Materials Verification Simplified Program
5611 Largest Acceptable Deviation ValueThis control sets the largest deviation allowed that still will result in a pass This result isdirectly related to the Match Method below The deviation value is the value that would beobtained by running a spectral comparison in the standard program The Compare function isuseful in deciding what this value should be set to by comparing spectra from a standardspectrum (See Section 421 for more information on spectral comparison) This value is set to
8132019 InfraSpec Manual
httpslidepdfcomreaderfullinfraspec-manual 3952
70 on the percentage passfail scale so that values above this level are failing and valuesbelow are passing
5612 Match MethodThis control sets the method that the materials verification will use to match a data spectrumwith the reference The match methods are described in detail in Section 421 Note that the
match method chosen affects the largest acceptable deviation value since this value willchange depending on the match method used
5613 Range LimitsIf the Range Limits control is set to ON entry boxes will appear that allow a start and endrange for the verification to work on This allows for a verification to be done on a part of thespectrum that is of interest instead of the whole spectrum
5614 No Sample ThresholdThis control if set to ON uses the variance of a data spectrum that has just been acquired totest whether there is a sample placed on the spectrometer If no sample is detected a warningwill appear and the match calculation will not proceed This is useful for preventing falseverification failures due to a user mistake of not putting sample on
The Threshold value is the sensitivity The default value of 100 is roughly a mediumsensitivity but this value may need to be changed depending on the type of materials to beverified If a false no sample report is given in the simplified program this number should beset to a lower value If a sample is not placed on the crystal and a no sample report is not
displayed in the simplified program then this number should be set to a higher value
562 Simplified Program SetupThese controls affect the Quantitative Analysis and Materials Verification simplified programsonly Each control is explained below See Sections 6 and 7 for more information on thesimplified programs
5621 Barcode ScannerSetting this control to ON makes another step in the simplified programs that asks for abarcode to be scanned in or entered manually This is useful if samples to be processedcontain a barcode as an identifier The barcode number will be saved in the spectrum note forthe log file which can be accessed in the standard program through the Spectrum Info panelonce the log file has been loaded into the experiment This panel is accessed by pressing theSel Traces button and clicking on the desired spectrum
5622 Help FilesThe simplified programs have a Help button which can be clicked by the user in order to bringup pertinent information to aid the user in using the instrument This help file can be anyMicrosoft Word text or Adobe pdf file The default file is this manual however manyapplications may require specific instructions If this is the case press Change Help File A
dialog will allow you to navigate to the correct help file Once the help file has been selectedthe directory to the help file will be displayed below the button
57 Verif Library TabThis tab allows the user to create modify and save different libraries used for materials verificationFigure 36 shows the Verification Library Tab below The current library is the library that will be usedby the Materials Verification simplified program The window on the left shows the spectra currently
8132019 InfraSpec Manual
httpslidepdfcomreaderfullinfraspec-manual 4052
contained in the library There is no limit to the number of spectra that can be added to the librarySpectra contained in this library are the spectra that a user in the simplified program will have thechoice of selecting as the reference material for verification If only one spectrum is contained in thelibrary the user of the simplified program will not have to choose a reference material Libraries canbe saved and reloaded as needed but the current loaded library will be the only active library in theMaterials Verification simplified program Each of the button controls on the tab will be explained
below
Figure 36 Verif Library Setup Tab
571 Add to LibraryClicking the Add to Library button will change the controls to library addition controls shown inFigure 37 below On the left side there is a list of spectra in the current experiment To add a
spectrum to the current library select the spectra desired from the list and click the Add button A dialog will ask for a name entry This allows spectra in the library to have a different namethan that of the spectrum used in the current experimentOnce all desired spectra have been added to the library clicking the Back button will return tothe normal library controls
Figure 37 Verif Library Addition Controls
8132019 InfraSpec Manual
httpslidepdfcomreaderfullinfraspec-manual 4152
572 Delete SelThis button will delete a spectrum from the library Select all the spectra to be delete and clickthis button to permanently delete the spectra from the current library
573 Load LibraryThis button will load a saved library into the current library Note that any spectra in the current
library before the load will still reside in the library In other words the spectra from the loadedlibrary will be added to the current library When this button is pressed a dialog will allow theuser to navigate to a library file
574 Save LibraryWhen this button is pressed a dialog will appear that allows the entry of a name for saving alibrary Note that the saving a library is different than saving the current library A saved librarywill not be loaded during the startup of the InfraSpec program In order to save the current libraryas the default press the Save as Default bottom button After this has been done the currentlibrary will be loaded on each InfraSpec program load including in the simplified program mode
8132019 InfraSpec Manual
httpslidepdfcomreaderfullinfraspec-manual 4252
6 Simplified Programs for Non-Technical Operators
61 IntroductionThe InfraSpec program allows for the use of the InfraSpec spectrometer by non-technical operatorsthrough the use of simplified programs containing minimal controls and steps Following the simplesteps allows for a fast and easy analysis using the InfraSpec spectrometer In many cases theseprograms are used daily and the standard program is simply used to set up the instrument Inaddition it is possible to have Wilks Enterprise Inc set up a simplified program in advance so that noset-up is required before use Contact Wilks Enterprise Inc for more informationThe two simplified programs available are Quantitative Analysis which is used to get a quantitativemeasure of up to four calibrations in a single run and materials verification which allows non-technical operators to easily test incoming shipments and verify the material is correct Each will beexplained below
611 Notes on BackgroundsIn both simplified programs running new backgrounds can be done at any time using the
Background button However the background can also be set to expire after a preset amountof time (see Section 5312) Once the background has expired users of the simplifiedprograms will have to run a new background before continuing If it is desired that the user run anew background after each sample then setting the maximum background age to 1 minute andusing at least 40 scans will ensure that the user will be prompted to do soIn addition the background quality can be checked with the ldquocheck backgroundrdquo button SeeSection 3312 for more information on the background checker In the simplified programs thecheck background button will display a number once completed If the number is greater than10 or less than -10 then the sample crystal should be thoroughly cleaned and the backgroundcheck re-run If the number is not within +- 10 on the second attempt it is recommended that anew background be run
62 Quantitative Analysis Simplified ProgramThe Quantitative analysis program allows for up to four calibrations to be measured in a samplesimultaneously by non-technical operators In order to set up a quantitative analysis simplifiedprogram first a calibration must be generated See Section 55 for more information on setting up acalibration Next in order to be able to access the quantitative analysis program the startup optionspanel must be selected and set to display the Quantitative Analysis button See Section 541 formore information Once InfraSpec program has been set up for the Quantitative Analysis SimplifiedProgram restart the InfraSpec Program and click the Quantitative Analysis program to start Thesteps involved in getting a quantitative result will be explained below
621 Step 1 Choose a CalibrationWhen the program first starts the screen shown in Figure 38 will be present The upper righthand side of the screen will contain information about what steps need to be taken to analyze a
sample Before acquriring spectra the calibrations to be used for analysis must be chosenClicking Choose Calibration will make the panel shown in Figure 39 appear Select at least oneand up to four calibrations to analyze and click OK Other calibrations can be chosen at anytime by selecting the Choose Calibrations button on the left side of the screen Note that while8 calibrations can be present in memory only 4 can be chosen to be analyzed and displayed atany given time Some calibrations may be set to run separately of other calibrations so thesecannot be selected with other calibrations
8132019 InfraSpec Manual
httpslidepdfcomreaderfullinfraspec-manual 4352
Figure 38 Quantitative Analysis Startup Screen
Figure 39 Choose Calibrations Panel
622 Step 2 Run a Background After choosing calibrations a background must be run in order to continue The sample button
will not be active until a valid background has been acquired Press the Background button torun a background See Section 3311 for more information on backgrounds A graphicaldisplay will show the background acquisition progress as shown in Figure 40 Pressing the StopScans button will reset back to Figure 38 without finishing the background acquisition Once thebackground has completed the default screen will return as shown in Figure 38 except that theRun Sample button will now be active
8132019 InfraSpec Manual
httpslidepdfcomreaderfullinfraspec-manual 4452
Figure 40 Background Acquisition623 Step 3 Run a SampleOnce a background has been acquired place a sample on the spectrometer fully covering thecrystal or place a sealed cell cuvette or IR card into a transmission model See section 3312for more information on placing a sample on the spectrometer Cover the sample with thesupplied plastic cover or optional stainless steel cover Once the sample has been placed on thespectrometer press the Run Sample button to begin sample acquisition If the barcodescanner option is selected the user will be prompted to scan a barcode or enter thebarcodesample ID number Otherwise the acquisition will begin and a screen similar to Figure40 will appear as the acquisition proceeds Once the spectrum has been acquired a screensimilar to Figure 41 will appear All selected calibrations (up to four) will be displayed in greyboxes with the calibration name and concentration
Figure 41 Sample Concentration Display
6231 Data LoggingNote OptionIf ASK is selected in the Data Log setup found in Section 5413 the Accept Results buttonwill be present at the bottom of the screen The log file for the current sample will not be saved
8132019 InfraSpec Manual
httpslidepdfcomreaderfullinfraspec-manual 4552
until this button is pressed This allows the user to disregard data that was taken erroneouslyNote that if the Accept Results button is not pressed no log file will be saved
If the data log setup is set to ASK wNote (see Section 5413) The note entry box will bedisplayed as well This allows for entry of explanations sample namesconcentrations or othercomments to be appended to the data log file To retrieve the notes open a log file in the
standard program and press the Sel Traces button Select the log spectrum that containsthe desired note and the Spectrum Info box will appear This box will contain the notesentered in the Simplified Programs
If the Run Sample or Run Background button is pressed before accepting the currentresults a warning will appear asking the user whether they really want to run a newsamplebackground without accepting the current results Once the Accept Results buttonhas been pressed it will become disabled and the notes entry box will disappear
6232 PassFail OptionIn addition to displaying the concentration it is also possible to display passfailmarginal data
See Section 5527 for more information on setting the passfail limits If this option is set theresult will be displayed as red (fail) yellow (marginal) or green (pass) as shown in Figure 42below In addition the passfail result will be displayed The concentration may or may not bedisplayed along with the passfail result depending on the options set Example results withthis option set are shown in Figure 42
Figure 42 PassFail Display Examples
8132019 InfraSpec Manual
httpslidepdfcomreaderfullinfraspec-manual 4652
624 Help and Exit buttonsPressing the Help button will open the help file either a pdf or text document as chosen in theSimple Program setup (see Section 5622) The default help file is this manual The ability tochoose a help file allows administrators to provide specific information for the analysis that theuser will be running
Pressing the Exit button will return the user to the startup screen
625 Reportrdquo Button A report button is provided to allow a user to print or save reports that include detailed data fromthe current sample or general data from any number of past samples When the button ispressed the window shown in Figure 43 will appear Pressing the Print Report button will printthe selected report automatically using the default printer for the computer Pressing SaveReport button will save the report a file
Figure 43 Generate Report Window
6251 Single Detail ReportIf a single report of the current sample is desired select Single Detail Report This report willcontain the information shown in Figure 44 below If the report is saved with the Save Reportbutton this file will be saved as an Adobe Acrobat pdf file
8132019 InfraSpec Manual
httpslidepdfcomreaderfullinfraspec-manual 4752
Figure 44 Detail Report Example
6252 Date Range ReportIf a report of past samples is required select the Date Range Report option Selectionmenus will appear that allow the selection of the date range specified Any log files located inthe current log folder that were created within the selected date range will be included in thereport An example of a date range report can be found in Figure 45 If the Date RangeReport is selected to be saved it will be saved as a comma separated value file that can beopened with Microsoft Excel or any other spreadsheet program
Figure 45 Date Range Report Example
8132019 InfraSpec Manual
httpslidepdfcomreaderfullinfraspec-manual 4852
63 Materials Verification Simplified ProgramThe Materials Verification simplified program can be used to verify that the correct material has beenreceived from a shipping depot or lab Any application where a known sample must be verified to bethe correct material can utilize this simplified program
In order to use this simplified program a materials library of a least one sample spectrum must be
created first See Section 57 for more information In addition other setup parameters must beentered See Section 5 for more details on the setup parameters used for the Materials VerificationSimplified Program The steps involved in verifying a material can be found below
631 Step 1 Run a BackgroundWhen the program first starts the screen shown in Figure 46 will be present The user will beprompted to run a background All buttons except the Run Background button will be disabledClick the Run Background button to acquire a background The background will begin a graphwill denote the background progress as shown in Figure 47 Pressing Stop Scans will halt theacquisition and no background will be saved
Figure 46 Materials Verification Startup Screen
Figure 47 Materials Verification Background Acquisition
8132019 InfraSpec Manual
httpslidepdfcomreaderfullinfraspec-manual 4952
632 Step 2 Choose a Material After a background has been acquired press the Choose Material button to bring up the screenshown in Figure 48 Select the material type from the library list and then press Select Ascreen will display the material to be verified as shown in Figure 49
Figure 48 Choose Material Screen
Figure 49 Ready to Verify Screen
633 Step 3 Run a Sample After a selecting the material to verify place a sample on the spectrometer and click RunSample Sample acquisition will begin and a graph will display progress Once the sample hasbeen acquired and verified a screen similar to either Figure 50 or Figure 51 depending onwhether the sample was verified or not will appear
The green or red box will state whether the material was verified and in addition will give detailsabout the spectral match The Match Method is the method that was used to verify the materialeither subtraction mean centered subtraction or mean centered unit variance subtraction
8132019 InfraSpec Manual
httpslidepdfcomreaderfullinfraspec-manual 5052
The Largest Acceptable Deviation Value is the highest deviation value that will still give a verifiedresult This is set by the administrator in the setup panel (see Section 561) The Percent Matchis a closeness of fit parameter based on the deviation value and largest acceptable deviationvalue The largest acceptable deviation value is set to a percent match of 70 percent and adeviation value of zero (perfect fit) is set to 100 This makes any value below the largest
acceptable deviation value have a passing grade of 70 or above Values above the largestacceptable deviation value will have a failing grade below 70 In addition to this scale theactual deviation value found is printed as well
Depending on the settings chosen for data logging the Accept Results button may be presentIf so this button must be pressed in order to save a log file This prevents undesired resultsstemming from operator mistakes etc from being saved as a log file In addition a notes areamay be present that allows the entry of notes about the sample Once the Accept Resultsbutton has been pressed it will become disabled and the note entry box will disappear
Figure 50 Material Verified Screen
Figure 51 Material Not Verified Screen
8132019 InfraSpec Manual
httpslidepdfcomreaderfullinfraspec-manual 5152
7 Spectrometer Specifications
Dimensions 275rdquo x 60rdquo x 65rdquo 7 cm x 1525 cm x 165 cm
Weight 30 lbs 14 kg ( total with standard ATR plate )
PC Interface RS-232 or USB
Power Requirements 12V DC 20 amps
Power Supply Universal ACDC converter type (supplied as standard)
Detectivity D 10 Hz 15-10 (cmHz)
W
Suggested Temp Operating Range 15oC - 60oC
Humidity 0 ndash 98 relative humidity (non-condensing)
Detector Array 128 Pixel linear pyroelectric array
Standard Spectral Ranges 25-5 983221m (2000-400 cm-1
) 53-108 983221m (1890-925 cm-1)
)7-14 983221m (1430-710 cm
-1))
Resolution 25 cm-1
ATR Crystal Material Cubic Zirconia Zinc Selenide or Zinc Sulfide
ATR Surface Size 50 x 16 mm
of Reflections 10
8132019 InfraSpec Manual
httpslidepdfcomreaderfullinfraspec-manual 5252
8 Service and Technical Support
Your InfraSpecreg VFA-IR Spectrometer may have been purchased either directly from Wilks Enterprise or
from a local dealer or representative In cases of any difficulties or problems associated with operation
you are recommended to contact your local representative or dealer first If the analyzer was purchaseddirect or if there are problems that are unanswered by the local representative or you have a technicalquestion relative to the operation of the instrument or relative to the analysis please contact WilksEnterprise at the contact address provided below
Customer Services DepartmentWilks Enterprise Inc25 Van Zant StreetSuite 8FEast Norwalk CT 06855
Telephone (203) 855-9136FAX (203) 838-9868E-mail techWilksIRcom
Service and Repair
During the warranty period Wilks Enterprise Inc offers free factory service for all failures that occur fromnormal instrument usage The user is only required to cover the cost of shipping the instrument to the factory After the warranty period the user is required to cover the factoryrsquos cost of servicing plus all shipping chargesNormal one week turnaround is offered for all InfraSpec instruments that are returned to the factory forservice For users requiring faster service times Wilks Enterprise also offers an advance replacementprogram that can respond to a userrsquos needs with instrument replacement typically in less than 24 hours Forextended service contracts advanced replacement programs factory service charges please contact WilksEnterprise Inc for details
Please note As we get feedback from our customers we will upgrade the software and the manual and send updates Your
comments and suggestions will be greatly appreciated For comments software updates or manual updates please send your email information to infowilksIRcom and note that you want to be put on the InfraSpecCustomer list
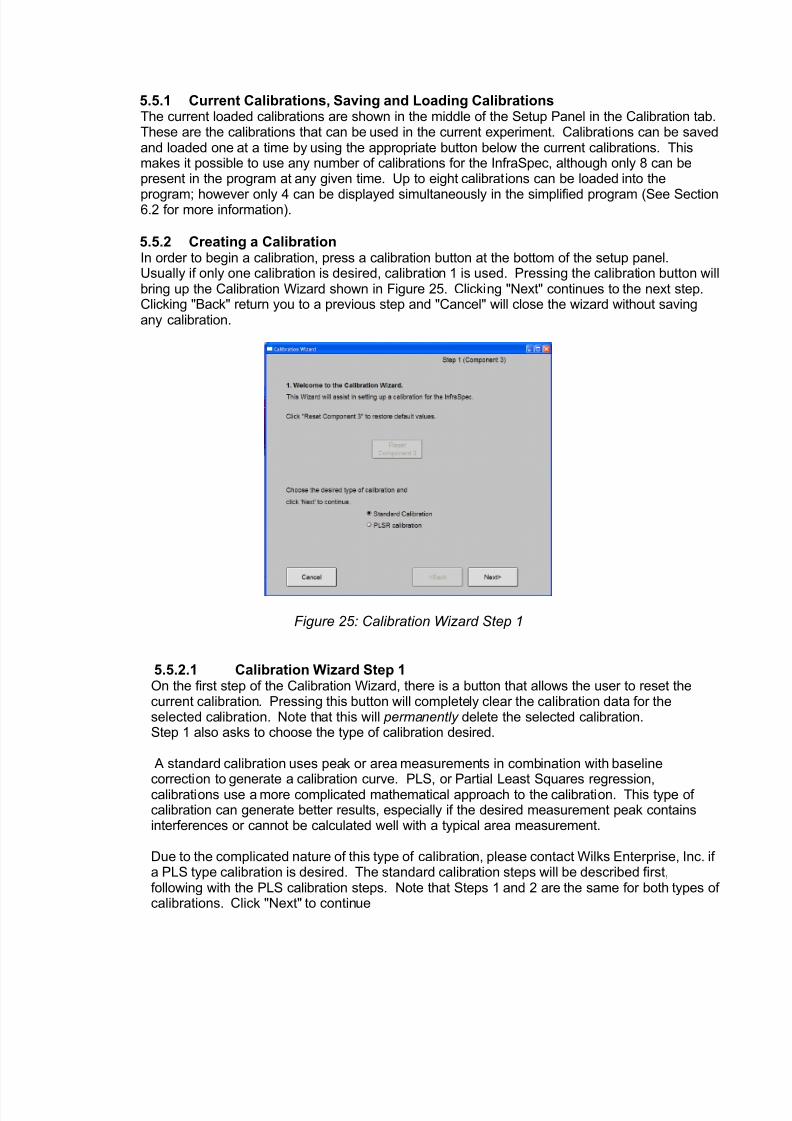
8132019 InfraSpec Manual
httpslidepdfcomreaderfullinfraspec-manual 4252
6 Simplified Programs for Non-Technical Operators
61 IntroductionThe InfraSpec program allows for the use of the InfraSpec spectrometer by non-technical operatorsthrough the use of simplified programs containing minimal controls and steps Following the simplesteps allows for a fast and easy analysis using the InfraSpec spectrometer In many cases theseprograms are used daily and the standard program is simply used to set up the instrument Inaddition it is possible to have Wilks Enterprise Inc set up a simplified program in advance so that noset-up is required before use Contact Wilks Enterprise Inc for more informationThe two simplified programs available are Quantitative Analysis which is used to get a quantitativemeasure of up to four calibrations in a single run and materials verification which allows non-technical operators to easily test incoming shipments and verify the material is correct Each will beexplained below
611 Notes on BackgroundsIn both simplified programs running new backgrounds can be done at any time using the
Background button However the background can also be set to expire after a preset amountof time (see Section 5312) Once the background has expired users of the simplifiedprograms will have to run a new background before continuing If it is desired that the user run anew background after each sample then setting the maximum background age to 1 minute andusing at least 40 scans will ensure that the user will be prompted to do soIn addition the background quality can be checked with the ldquocheck backgroundrdquo button SeeSection 3312 for more information on the background checker In the simplified programs thecheck background button will display a number once completed If the number is greater than10 or less than -10 then the sample crystal should be thoroughly cleaned and the backgroundcheck re-run If the number is not within +- 10 on the second attempt it is recommended that anew background be run
62 Quantitative Analysis Simplified ProgramThe Quantitative analysis program allows for up to four calibrations to be measured in a samplesimultaneously by non-technical operators In order to set up a quantitative analysis simplifiedprogram first a calibration must be generated See Section 55 for more information on setting up acalibration Next in order to be able to access the quantitative analysis program the startup optionspanel must be selected and set to display the Quantitative Analysis button See Section 541 formore information Once InfraSpec program has been set up for the Quantitative Analysis SimplifiedProgram restart the InfraSpec Program and click the Quantitative Analysis program to start Thesteps involved in getting a quantitative result will be explained below
621 Step 1 Choose a CalibrationWhen the program first starts the screen shown in Figure 38 will be present The upper righthand side of the screen will contain information about what steps need to be taken to analyze a
sample Before acquriring spectra the calibrations to be used for analysis must be chosenClicking Choose Calibration will make the panel shown in Figure 39 appear Select at least oneand up to four calibrations to analyze and click OK Other calibrations can be chosen at anytime by selecting the Choose Calibrations button on the left side of the screen Note that while8 calibrations can be present in memory only 4 can be chosen to be analyzed and displayed atany given time Some calibrations may be set to run separately of other calibrations so thesecannot be selected with other calibrations
8132019 InfraSpec Manual
httpslidepdfcomreaderfullinfraspec-manual 4352
Figure 38 Quantitative Analysis Startup Screen
Figure 39 Choose Calibrations Panel
622 Step 2 Run a Background After choosing calibrations a background must be run in order to continue The sample button
will not be active until a valid background has been acquired Press the Background button torun a background See Section 3311 for more information on backgrounds A graphicaldisplay will show the background acquisition progress as shown in Figure 40 Pressing the StopScans button will reset back to Figure 38 without finishing the background acquisition Once thebackground has completed the default screen will return as shown in Figure 38 except that theRun Sample button will now be active
8132019 InfraSpec Manual
httpslidepdfcomreaderfullinfraspec-manual 4452
Figure 40 Background Acquisition623 Step 3 Run a SampleOnce a background has been acquired place a sample on the spectrometer fully covering thecrystal or place a sealed cell cuvette or IR card into a transmission model See section 3312for more information on placing a sample on the spectrometer Cover the sample with thesupplied plastic cover or optional stainless steel cover Once the sample has been placed on thespectrometer press the Run Sample button to begin sample acquisition If the barcodescanner option is selected the user will be prompted to scan a barcode or enter thebarcodesample ID number Otherwise the acquisition will begin and a screen similar to Figure40 will appear as the acquisition proceeds Once the spectrum has been acquired a screensimilar to Figure 41 will appear All selected calibrations (up to four) will be displayed in greyboxes with the calibration name and concentration
Figure 41 Sample Concentration Display
6231 Data LoggingNote OptionIf ASK is selected in the Data Log setup found in Section 5413 the Accept Results buttonwill be present at the bottom of the screen The log file for the current sample will not be saved
8132019 InfraSpec Manual
httpslidepdfcomreaderfullinfraspec-manual 4552
until this button is pressed This allows the user to disregard data that was taken erroneouslyNote that if the Accept Results button is not pressed no log file will be saved
If the data log setup is set to ASK wNote (see Section 5413) The note entry box will bedisplayed as well This allows for entry of explanations sample namesconcentrations or othercomments to be appended to the data log file To retrieve the notes open a log file in the
standard program and press the Sel Traces button Select the log spectrum that containsthe desired note and the Spectrum Info box will appear This box will contain the notesentered in the Simplified Programs
If the Run Sample or Run Background button is pressed before accepting the currentresults a warning will appear asking the user whether they really want to run a newsamplebackground without accepting the current results Once the Accept Results buttonhas been pressed it will become disabled and the notes entry box will disappear
6232 PassFail OptionIn addition to displaying the concentration it is also possible to display passfailmarginal data
See Section 5527 for more information on setting the passfail limits If this option is set theresult will be displayed as red (fail) yellow (marginal) or green (pass) as shown in Figure 42below In addition the passfail result will be displayed The concentration may or may not bedisplayed along with the passfail result depending on the options set Example results withthis option set are shown in Figure 42
Figure 42 PassFail Display Examples
8132019 InfraSpec Manual
httpslidepdfcomreaderfullinfraspec-manual 4652
624 Help and Exit buttonsPressing the Help button will open the help file either a pdf or text document as chosen in theSimple Program setup (see Section 5622) The default help file is this manual The ability tochoose a help file allows administrators to provide specific information for the analysis that theuser will be running
Pressing the Exit button will return the user to the startup screen
625 Reportrdquo Button A report button is provided to allow a user to print or save reports that include detailed data fromthe current sample or general data from any number of past samples When the button ispressed the window shown in Figure 43 will appear Pressing the Print Report button will printthe selected report automatically using the default printer for the computer Pressing SaveReport button will save the report a file
Figure 43 Generate Report Window
6251 Single Detail ReportIf a single report of the current sample is desired select Single Detail Report This report willcontain the information shown in Figure 44 below If the report is saved with the Save Reportbutton this file will be saved as an Adobe Acrobat pdf file
8132019 InfraSpec Manual
httpslidepdfcomreaderfullinfraspec-manual 4752
Figure 44 Detail Report Example
6252 Date Range ReportIf a report of past samples is required select the Date Range Report option Selectionmenus will appear that allow the selection of the date range specified Any log files located inthe current log folder that were created within the selected date range will be included in thereport An example of a date range report can be found in Figure 45 If the Date RangeReport is selected to be saved it will be saved as a comma separated value file that can beopened with Microsoft Excel or any other spreadsheet program
Figure 45 Date Range Report Example
8132019 InfraSpec Manual
httpslidepdfcomreaderfullinfraspec-manual 4852
63 Materials Verification Simplified ProgramThe Materials Verification simplified program can be used to verify that the correct material has beenreceived from a shipping depot or lab Any application where a known sample must be verified to bethe correct material can utilize this simplified program
In order to use this simplified program a materials library of a least one sample spectrum must be
created first See Section 57 for more information In addition other setup parameters must beentered See Section 5 for more details on the setup parameters used for the Materials VerificationSimplified Program The steps involved in verifying a material can be found below
631 Step 1 Run a BackgroundWhen the program first starts the screen shown in Figure 46 will be present The user will beprompted to run a background All buttons except the Run Background button will be disabledClick the Run Background button to acquire a background The background will begin a graphwill denote the background progress as shown in Figure 47 Pressing Stop Scans will halt theacquisition and no background will be saved
Figure 46 Materials Verification Startup Screen
Figure 47 Materials Verification Background Acquisition
8132019 InfraSpec Manual
httpslidepdfcomreaderfullinfraspec-manual 4952
632 Step 2 Choose a Material After a background has been acquired press the Choose Material button to bring up the screenshown in Figure 48 Select the material type from the library list and then press Select Ascreen will display the material to be verified as shown in Figure 49
Figure 48 Choose Material Screen
Figure 49 Ready to Verify Screen
633 Step 3 Run a Sample After a selecting the material to verify place a sample on the spectrometer and click RunSample Sample acquisition will begin and a graph will display progress Once the sample hasbeen acquired and verified a screen similar to either Figure 50 or Figure 51 depending onwhether the sample was verified or not will appear
The green or red box will state whether the material was verified and in addition will give detailsabout the spectral match The Match Method is the method that was used to verify the materialeither subtraction mean centered subtraction or mean centered unit variance subtraction
8132019 InfraSpec Manual
httpslidepdfcomreaderfullinfraspec-manual 5052
The Largest Acceptable Deviation Value is the highest deviation value that will still give a verifiedresult This is set by the administrator in the setup panel (see Section 561) The Percent Matchis a closeness of fit parameter based on the deviation value and largest acceptable deviationvalue The largest acceptable deviation value is set to a percent match of 70 percent and adeviation value of zero (perfect fit) is set to 100 This makes any value below the largest
acceptable deviation value have a passing grade of 70 or above Values above the largestacceptable deviation value will have a failing grade below 70 In addition to this scale theactual deviation value found is printed as well
Depending on the settings chosen for data logging the Accept Results button may be presentIf so this button must be pressed in order to save a log file This prevents undesired resultsstemming from operator mistakes etc from being saved as a log file In addition a notes areamay be present that allows the entry of notes about the sample Once the Accept Resultsbutton has been pressed it will become disabled and the note entry box will disappear
Figure 50 Material Verified Screen
Figure 51 Material Not Verified Screen
8132019 InfraSpec Manual
httpslidepdfcomreaderfullinfraspec-manual 5152
7 Spectrometer Specifications
Dimensions 275rdquo x 60rdquo x 65rdquo 7 cm x 1525 cm x 165 cm
Weight 30 lbs 14 kg ( total with standard ATR plate )
PC Interface RS-232 or USB
Power Requirements 12V DC 20 amps
Power Supply Universal ACDC converter type (supplied as standard)
Detectivity D 10 Hz 15-10 (cmHz)
W
Suggested Temp Operating Range 15oC - 60oC
Humidity 0 ndash 98 relative humidity (non-condensing)
Detector Array 128 Pixel linear pyroelectric array
Standard Spectral Ranges 25-5 983221m (2000-400 cm-1
) 53-108 983221m (1890-925 cm-1)
)7-14 983221m (1430-710 cm
-1))
Resolution 25 cm-1
ATR Crystal Material Cubic Zirconia Zinc Selenide or Zinc Sulfide
ATR Surface Size 50 x 16 mm
of Reflections 10
8132019 InfraSpec Manual
httpslidepdfcomreaderfullinfraspec-manual 5252
8 Service and Technical Support
Your InfraSpecreg VFA-IR Spectrometer may have been purchased either directly from Wilks Enterprise or
from a local dealer or representative In cases of any difficulties or problems associated with operation
you are recommended to contact your local representative or dealer first If the analyzer was purchaseddirect or if there are problems that are unanswered by the local representative or you have a technicalquestion relative to the operation of the instrument or relative to the analysis please contact WilksEnterprise at the contact address provided below
Customer Services DepartmentWilks Enterprise Inc25 Van Zant StreetSuite 8FEast Norwalk CT 06855
Telephone (203) 855-9136FAX (203) 838-9868E-mail techWilksIRcom
Service and Repair
During the warranty period Wilks Enterprise Inc offers free factory service for all failures that occur fromnormal instrument usage The user is only required to cover the cost of shipping the instrument to the factory After the warranty period the user is required to cover the factoryrsquos cost of servicing plus all shipping chargesNormal one week turnaround is offered for all InfraSpec instruments that are returned to the factory forservice For users requiring faster service times Wilks Enterprise also offers an advance replacementprogram that can respond to a userrsquos needs with instrument replacement typically in less than 24 hours Forextended service contracts advanced replacement programs factory service charges please contact WilksEnterprise Inc for details
Please note As we get feedback from our customers we will upgrade the software and the manual and send updates Your
comments and suggestions will be greatly appreciated For comments software updates or manual updates please send your email information to infowilksIRcom and note that you want to be put on the InfraSpecCustomer list
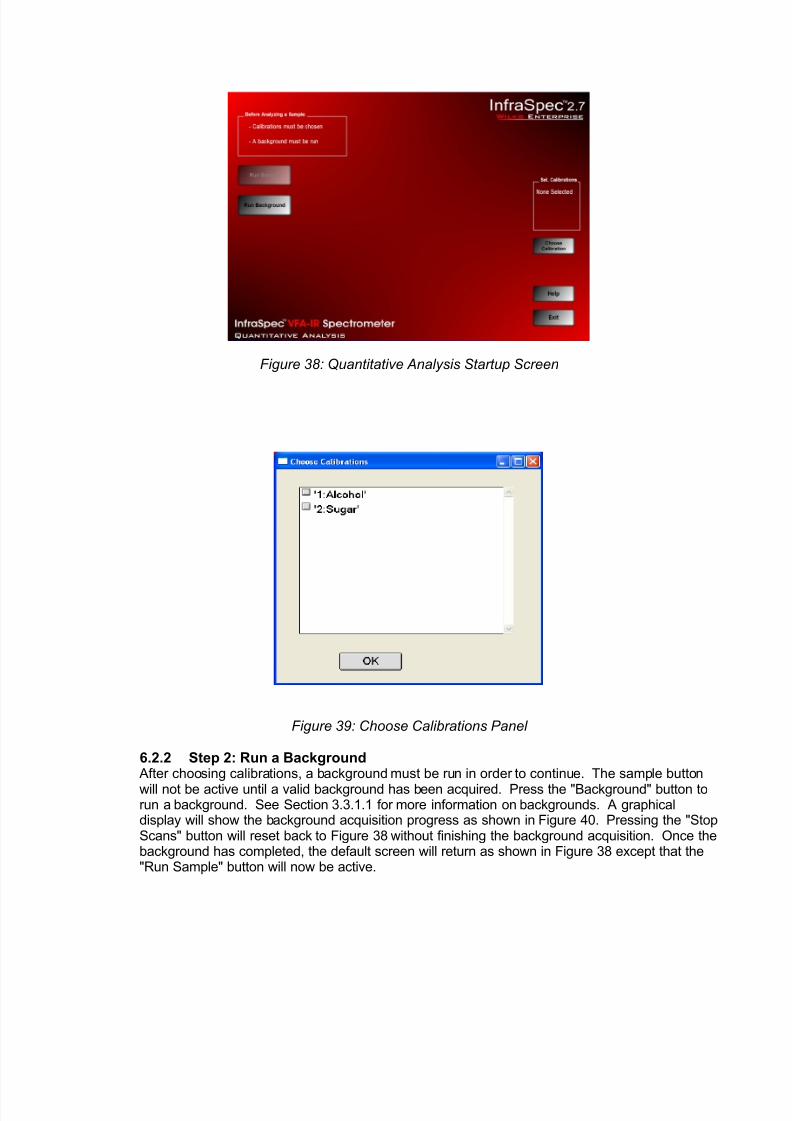
8132019 InfraSpec Manual
httpslidepdfcomreaderfullinfraspec-manual 4352
Figure 38 Quantitative Analysis Startup Screen
Figure 39 Choose Calibrations Panel
622 Step 2 Run a Background After choosing calibrations a background must be run in order to continue The sample button
will not be active until a valid background has been acquired Press the Background button torun a background See Section 3311 for more information on backgrounds A graphicaldisplay will show the background acquisition progress as shown in Figure 40 Pressing the StopScans button will reset back to Figure 38 without finishing the background acquisition Once thebackground has completed the default screen will return as shown in Figure 38 except that theRun Sample button will now be active
8132019 InfraSpec Manual
httpslidepdfcomreaderfullinfraspec-manual 4452
Figure 40 Background Acquisition623 Step 3 Run a SampleOnce a background has been acquired place a sample on the spectrometer fully covering thecrystal or place a sealed cell cuvette or IR card into a transmission model See section 3312for more information on placing a sample on the spectrometer Cover the sample with thesupplied plastic cover or optional stainless steel cover Once the sample has been placed on thespectrometer press the Run Sample button to begin sample acquisition If the barcodescanner option is selected the user will be prompted to scan a barcode or enter thebarcodesample ID number Otherwise the acquisition will begin and a screen similar to Figure40 will appear as the acquisition proceeds Once the spectrum has been acquired a screensimilar to Figure 41 will appear All selected calibrations (up to four) will be displayed in greyboxes with the calibration name and concentration
Figure 41 Sample Concentration Display
6231 Data LoggingNote OptionIf ASK is selected in the Data Log setup found in Section 5413 the Accept Results buttonwill be present at the bottom of the screen The log file for the current sample will not be saved
8132019 InfraSpec Manual
httpslidepdfcomreaderfullinfraspec-manual 4552
until this button is pressed This allows the user to disregard data that was taken erroneouslyNote that if the Accept Results button is not pressed no log file will be saved
If the data log setup is set to ASK wNote (see Section 5413) The note entry box will bedisplayed as well This allows for entry of explanations sample namesconcentrations or othercomments to be appended to the data log file To retrieve the notes open a log file in the
standard program and press the Sel Traces button Select the log spectrum that containsthe desired note and the Spectrum Info box will appear This box will contain the notesentered in the Simplified Programs
If the Run Sample or Run Background button is pressed before accepting the currentresults a warning will appear asking the user whether they really want to run a newsamplebackground without accepting the current results Once the Accept Results buttonhas been pressed it will become disabled and the notes entry box will disappear
6232 PassFail OptionIn addition to displaying the concentration it is also possible to display passfailmarginal data
See Section 5527 for more information on setting the passfail limits If this option is set theresult will be displayed as red (fail) yellow (marginal) or green (pass) as shown in Figure 42below In addition the passfail result will be displayed The concentration may or may not bedisplayed along with the passfail result depending on the options set Example results withthis option set are shown in Figure 42
Figure 42 PassFail Display Examples
8132019 InfraSpec Manual
httpslidepdfcomreaderfullinfraspec-manual 4652
624 Help and Exit buttonsPressing the Help button will open the help file either a pdf or text document as chosen in theSimple Program setup (see Section 5622) The default help file is this manual The ability tochoose a help file allows administrators to provide specific information for the analysis that theuser will be running
Pressing the Exit button will return the user to the startup screen
625 Reportrdquo Button A report button is provided to allow a user to print or save reports that include detailed data fromthe current sample or general data from any number of past samples When the button ispressed the window shown in Figure 43 will appear Pressing the Print Report button will printthe selected report automatically using the default printer for the computer Pressing SaveReport button will save the report a file
Figure 43 Generate Report Window
6251 Single Detail ReportIf a single report of the current sample is desired select Single Detail Report This report willcontain the information shown in Figure 44 below If the report is saved with the Save Reportbutton this file will be saved as an Adobe Acrobat pdf file
8132019 InfraSpec Manual
httpslidepdfcomreaderfullinfraspec-manual 4752
Figure 44 Detail Report Example
6252 Date Range ReportIf a report of past samples is required select the Date Range Report option Selectionmenus will appear that allow the selection of the date range specified Any log files located inthe current log folder that were created within the selected date range will be included in thereport An example of a date range report can be found in Figure 45 If the Date RangeReport is selected to be saved it will be saved as a comma separated value file that can beopened with Microsoft Excel or any other spreadsheet program
Figure 45 Date Range Report Example
8132019 InfraSpec Manual
httpslidepdfcomreaderfullinfraspec-manual 4852
63 Materials Verification Simplified ProgramThe Materials Verification simplified program can be used to verify that the correct material has beenreceived from a shipping depot or lab Any application where a known sample must be verified to bethe correct material can utilize this simplified program
In order to use this simplified program a materials library of a least one sample spectrum must be
created first See Section 57 for more information In addition other setup parameters must beentered See Section 5 for more details on the setup parameters used for the Materials VerificationSimplified Program The steps involved in verifying a material can be found below
631 Step 1 Run a BackgroundWhen the program first starts the screen shown in Figure 46 will be present The user will beprompted to run a background All buttons except the Run Background button will be disabledClick the Run Background button to acquire a background The background will begin a graphwill denote the background progress as shown in Figure 47 Pressing Stop Scans will halt theacquisition and no background will be saved
Figure 46 Materials Verification Startup Screen
Figure 47 Materials Verification Background Acquisition
8132019 InfraSpec Manual
httpslidepdfcomreaderfullinfraspec-manual 4952
632 Step 2 Choose a Material After a background has been acquired press the Choose Material button to bring up the screenshown in Figure 48 Select the material type from the library list and then press Select Ascreen will display the material to be verified as shown in Figure 49
Figure 48 Choose Material Screen
Figure 49 Ready to Verify Screen
633 Step 3 Run a Sample After a selecting the material to verify place a sample on the spectrometer and click RunSample Sample acquisition will begin and a graph will display progress Once the sample hasbeen acquired and verified a screen similar to either Figure 50 or Figure 51 depending onwhether the sample was verified or not will appear
The green or red box will state whether the material was verified and in addition will give detailsabout the spectral match The Match Method is the method that was used to verify the materialeither subtraction mean centered subtraction or mean centered unit variance subtraction
8132019 InfraSpec Manual
httpslidepdfcomreaderfullinfraspec-manual 5052
The Largest Acceptable Deviation Value is the highest deviation value that will still give a verifiedresult This is set by the administrator in the setup panel (see Section 561) The Percent Matchis a closeness of fit parameter based on the deviation value and largest acceptable deviationvalue The largest acceptable deviation value is set to a percent match of 70 percent and adeviation value of zero (perfect fit) is set to 100 This makes any value below the largest
acceptable deviation value have a passing grade of 70 or above Values above the largestacceptable deviation value will have a failing grade below 70 In addition to this scale theactual deviation value found is printed as well
Depending on the settings chosen for data logging the Accept Results button may be presentIf so this button must be pressed in order to save a log file This prevents undesired resultsstemming from operator mistakes etc from being saved as a log file In addition a notes areamay be present that allows the entry of notes about the sample Once the Accept Resultsbutton has been pressed it will become disabled and the note entry box will disappear
Figure 50 Material Verified Screen
Figure 51 Material Not Verified Screen
8132019 InfraSpec Manual
httpslidepdfcomreaderfullinfraspec-manual 5152
7 Spectrometer Specifications
Dimensions 275rdquo x 60rdquo x 65rdquo 7 cm x 1525 cm x 165 cm
Weight 30 lbs 14 kg ( total with standard ATR plate )
PC Interface RS-232 or USB
Power Requirements 12V DC 20 amps
Power Supply Universal ACDC converter type (supplied as standard)
Detectivity D 10 Hz 15-10 (cmHz)
W
Suggested Temp Operating Range 15oC - 60oC
Humidity 0 ndash 98 relative humidity (non-condensing)
Detector Array 128 Pixel linear pyroelectric array
Standard Spectral Ranges 25-5 983221m (2000-400 cm-1
) 53-108 983221m (1890-925 cm-1)
)7-14 983221m (1430-710 cm
-1))
Resolution 25 cm-1
ATR Crystal Material Cubic Zirconia Zinc Selenide or Zinc Sulfide
ATR Surface Size 50 x 16 mm
of Reflections 10
8132019 InfraSpec Manual
httpslidepdfcomreaderfullinfraspec-manual 5252
8 Service and Technical Support
Your InfraSpecreg VFA-IR Spectrometer may have been purchased either directly from Wilks Enterprise or
from a local dealer or representative In cases of any difficulties or problems associated with operation
you are recommended to contact your local representative or dealer first If the analyzer was purchaseddirect or if there are problems that are unanswered by the local representative or you have a technicalquestion relative to the operation of the instrument or relative to the analysis please contact WilksEnterprise at the contact address provided below
Customer Services DepartmentWilks Enterprise Inc25 Van Zant StreetSuite 8FEast Norwalk CT 06855
Telephone (203) 855-9136FAX (203) 838-9868E-mail techWilksIRcom
Service and Repair
During the warranty period Wilks Enterprise Inc offers free factory service for all failures that occur fromnormal instrument usage The user is only required to cover the cost of shipping the instrument to the factory After the warranty period the user is required to cover the factoryrsquos cost of servicing plus all shipping chargesNormal one week turnaround is offered for all InfraSpec instruments that are returned to the factory forservice For users requiring faster service times Wilks Enterprise also offers an advance replacementprogram that can respond to a userrsquos needs with instrument replacement typically in less than 24 hours Forextended service contracts advanced replacement programs factory service charges please contact WilksEnterprise Inc for details
Please note As we get feedback from our customers we will upgrade the software and the manual and send updates Your
comments and suggestions will be greatly appreciated For comments software updates or manual updates please send your email information to infowilksIRcom and note that you want to be put on the InfraSpecCustomer list
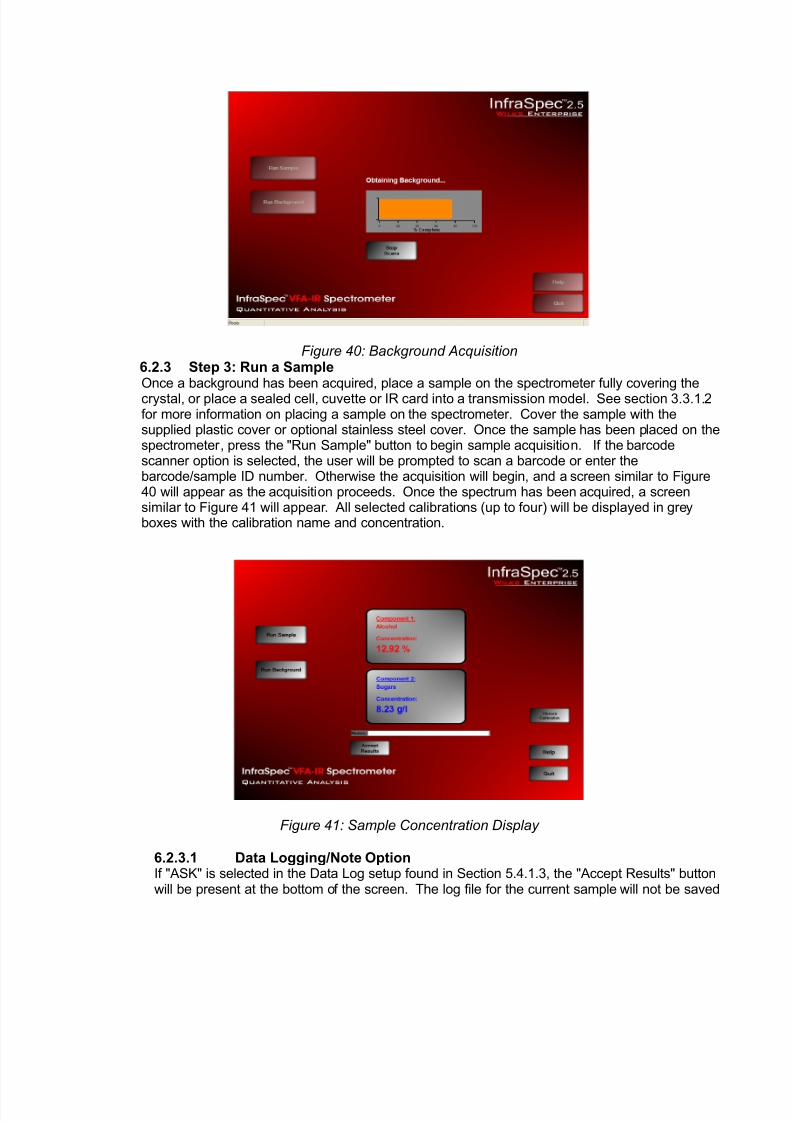
8132019 InfraSpec Manual
httpslidepdfcomreaderfullinfraspec-manual 4552
until this button is pressed This allows the user to disregard data that was taken erroneouslyNote that if the Accept Results button is not pressed no log file will be saved
If the data log setup is set to ASK wNote (see Section 5413) The note entry box will bedisplayed as well This allows for entry of explanations sample namesconcentrations or othercomments to be appended to the data log file To retrieve the notes open a log file in the
standard program and press the Sel Traces button Select the log spectrum that containsthe desired note and the Spectrum Info box will appear This box will contain the notesentered in the Simplified Programs
If the Run Sample or Run Background button is pressed before accepting the currentresults a warning will appear asking the user whether they really want to run a newsamplebackground without accepting the current results Once the Accept Results buttonhas been pressed it will become disabled and the notes entry box will disappear
6232 PassFail OptionIn addition to displaying the concentration it is also possible to display passfailmarginal data
See Section 5527 for more information on setting the passfail limits If this option is set theresult will be displayed as red (fail) yellow (marginal) or green (pass) as shown in Figure 42below In addition the passfail result will be displayed The concentration may or may not bedisplayed along with the passfail result depending on the options set Example results withthis option set are shown in Figure 42
Figure 42 PassFail Display Examples
8132019 InfraSpec Manual
httpslidepdfcomreaderfullinfraspec-manual 4652
624 Help and Exit buttonsPressing the Help button will open the help file either a pdf or text document as chosen in theSimple Program setup (see Section 5622) The default help file is this manual The ability tochoose a help file allows administrators to provide specific information for the analysis that theuser will be running
Pressing the Exit button will return the user to the startup screen
625 Reportrdquo Button A report button is provided to allow a user to print or save reports that include detailed data fromthe current sample or general data from any number of past samples When the button ispressed the window shown in Figure 43 will appear Pressing the Print Report button will printthe selected report automatically using the default printer for the computer Pressing SaveReport button will save the report a file
Figure 43 Generate Report Window
6251 Single Detail ReportIf a single report of the current sample is desired select Single Detail Report This report willcontain the information shown in Figure 44 below If the report is saved with the Save Reportbutton this file will be saved as an Adobe Acrobat pdf file
8132019 InfraSpec Manual
httpslidepdfcomreaderfullinfraspec-manual 4752
Figure 44 Detail Report Example
6252 Date Range ReportIf a report of past samples is required select the Date Range Report option Selectionmenus will appear that allow the selection of the date range specified Any log files located inthe current log folder that were created within the selected date range will be included in thereport An example of a date range report can be found in Figure 45 If the Date RangeReport is selected to be saved it will be saved as a comma separated value file that can beopened with Microsoft Excel or any other spreadsheet program
Figure 45 Date Range Report Example
8132019 InfraSpec Manual
httpslidepdfcomreaderfullinfraspec-manual 4852
63 Materials Verification Simplified ProgramThe Materials Verification simplified program can be used to verify that the correct material has beenreceived from a shipping depot or lab Any application where a known sample must be verified to bethe correct material can utilize this simplified program
In order to use this simplified program a materials library of a least one sample spectrum must be
created first See Section 57 for more information In addition other setup parameters must beentered See Section 5 for more details on the setup parameters used for the Materials VerificationSimplified Program The steps involved in verifying a material can be found below
631 Step 1 Run a BackgroundWhen the program first starts the screen shown in Figure 46 will be present The user will beprompted to run a background All buttons except the Run Background button will be disabledClick the Run Background button to acquire a background The background will begin a graphwill denote the background progress as shown in Figure 47 Pressing Stop Scans will halt theacquisition and no background will be saved
Figure 46 Materials Verification Startup Screen
Figure 47 Materials Verification Background Acquisition
8132019 InfraSpec Manual
httpslidepdfcomreaderfullinfraspec-manual 4952
632 Step 2 Choose a Material After a background has been acquired press the Choose Material button to bring up the screenshown in Figure 48 Select the material type from the library list and then press Select Ascreen will display the material to be verified as shown in Figure 49
Figure 48 Choose Material Screen
Figure 49 Ready to Verify Screen
633 Step 3 Run a Sample After a selecting the material to verify place a sample on the spectrometer and click RunSample Sample acquisition will begin and a graph will display progress Once the sample hasbeen acquired and verified a screen similar to either Figure 50 or Figure 51 depending onwhether the sample was verified or not will appear
The green or red box will state whether the material was verified and in addition will give detailsabout the spectral match The Match Method is the method that was used to verify the materialeither subtraction mean centered subtraction or mean centered unit variance subtraction
8132019 InfraSpec Manual
httpslidepdfcomreaderfullinfraspec-manual 5052
The Largest Acceptable Deviation Value is the highest deviation value that will still give a verifiedresult This is set by the administrator in the setup panel (see Section 561) The Percent Matchis a closeness of fit parameter based on the deviation value and largest acceptable deviationvalue The largest acceptable deviation value is set to a percent match of 70 percent and adeviation value of zero (perfect fit) is set to 100 This makes any value below the largest
acceptable deviation value have a passing grade of 70 or above Values above the largestacceptable deviation value will have a failing grade below 70 In addition to this scale theactual deviation value found is printed as well
Depending on the settings chosen for data logging the Accept Results button may be presentIf so this button must be pressed in order to save a log file This prevents undesired resultsstemming from operator mistakes etc from being saved as a log file In addition a notes areamay be present that allows the entry of notes about the sample Once the Accept Resultsbutton has been pressed it will become disabled and the note entry box will disappear
Figure 50 Material Verified Screen
Figure 51 Material Not Verified Screen
8132019 InfraSpec Manual
httpslidepdfcomreaderfullinfraspec-manual 5152
7 Spectrometer Specifications
Dimensions 275rdquo x 60rdquo x 65rdquo 7 cm x 1525 cm x 165 cm
Weight 30 lbs 14 kg ( total with standard ATR plate )
PC Interface RS-232 or USB
Power Requirements 12V DC 20 amps
Power Supply Universal ACDC converter type (supplied as standard)
Detectivity D 10 Hz 15-10 (cmHz)
W
Suggested Temp Operating Range 15oC - 60oC
Humidity 0 ndash 98 relative humidity (non-condensing)
Detector Array 128 Pixel linear pyroelectric array
Standard Spectral Ranges 25-5 983221m (2000-400 cm-1
) 53-108 983221m (1890-925 cm-1)
)7-14 983221m (1430-710 cm
-1))
Resolution 25 cm-1
ATR Crystal Material Cubic Zirconia Zinc Selenide or Zinc Sulfide
ATR Surface Size 50 x 16 mm
of Reflections 10
8132019 InfraSpec Manual
httpslidepdfcomreaderfullinfraspec-manual 5252
8 Service and Technical Support
Your InfraSpecreg VFA-IR Spectrometer may have been purchased either directly from Wilks Enterprise or
from a local dealer or representative In cases of any difficulties or problems associated with operation
you are recommended to contact your local representative or dealer first If the analyzer was purchaseddirect or if there are problems that are unanswered by the local representative or you have a technicalquestion relative to the operation of the instrument or relative to the analysis please contact WilksEnterprise at the contact address provided below
Customer Services DepartmentWilks Enterprise Inc25 Van Zant StreetSuite 8FEast Norwalk CT 06855
Telephone (203) 855-9136FAX (203) 838-9868E-mail techWilksIRcom
Service and Repair
During the warranty period Wilks Enterprise Inc offers free factory service for all failures that occur fromnormal instrument usage The user is only required to cover the cost of shipping the instrument to the factory After the warranty period the user is required to cover the factoryrsquos cost of servicing plus all shipping chargesNormal one week turnaround is offered for all InfraSpec instruments that are returned to the factory forservice For users requiring faster service times Wilks Enterprise also offers an advance replacementprogram that can respond to a userrsquos needs with instrument replacement typically in less than 24 hours Forextended service contracts advanced replacement programs factory service charges please contact WilksEnterprise Inc for details
Please note As we get feedback from our customers we will upgrade the software and the manual and send updates Your
comments and suggestions will be greatly appreciated For comments software updates or manual updates please send your email information to infowilksIRcom and note that you want to be put on the InfraSpecCustomer list
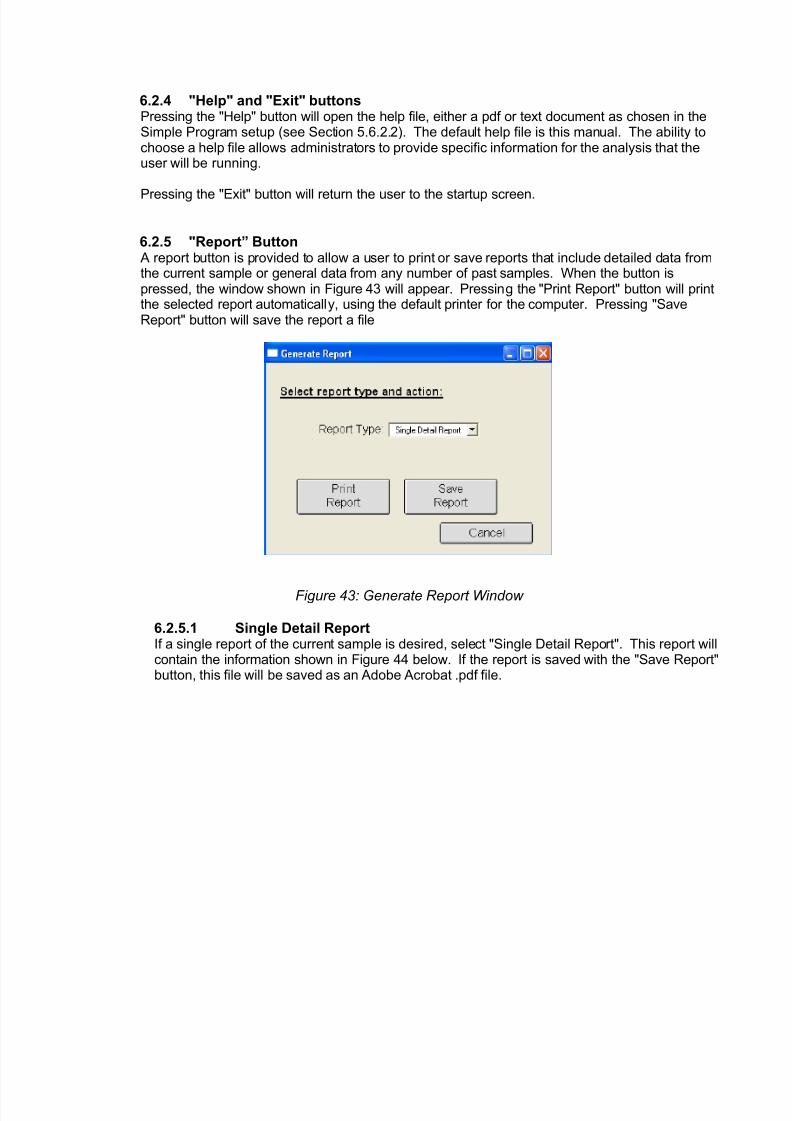
8132019 InfraSpec Manual
httpslidepdfcomreaderfullinfraspec-manual 5252
8 Service and Technical Support
Your InfraSpecreg VFA-IR Spectrometer may have been purchased either directly from Wilks Enterprise or
from a local dealer or representative In cases of any difficulties or problems associated with operation
you are recommended to contact your local representative or dealer first If the analyzer was purchaseddirect or if there are problems that are unanswered by the local representative or you have a technicalquestion relative to the operation of the instrument or relative to the analysis please contact WilksEnterprise at the contact address provided below
Customer Services DepartmentWilks Enterprise Inc25 Van Zant StreetSuite 8FEast Norwalk CT 06855
Telephone (203) 855-9136FAX (203) 838-9868E-mail techWilksIRcom
Service and Repair
During the warranty period Wilks Enterprise Inc offers free factory service for all failures that occur fromnormal instrument usage The user is only required to cover the cost of shipping the instrument to the factory After the warranty period the user is required to cover the factoryrsquos cost of servicing plus all shipping chargesNormal one week turnaround is offered for all InfraSpec instruments that are returned to the factory forservice For users requiring faster service times Wilks Enterprise also offers an advance replacementprogram that can respond to a userrsquos needs with instrument replacement typically in less than 24 hours Forextended service contracts advanced replacement programs factory service charges please contact WilksEnterprise Inc for details
Please note As we get feedback from our customers we will upgrade the software and the manual and send updates Your
comments and suggestions will be greatly appreciated For comments software updates or manual updates please send your email information to infowilksIRcom and note that you want to be put on the InfraSpecCustomer list