informational frictions, syndicate structure, and loan pricing: new evidence from international...
TRANSCRIPT

Informational Frictions, SyndicateStructure, and Loan Pricing: New Evidencefrom International Lending*
Sung C. BaeDepartment of Finance, Bowling Green State University
Byung-Uk Chong**College of Business Administration, University of Seoul
Yura KimCollege of Business Administration, University of Seoul
Received 30 September 2013; Accepted 19 December 2013
Abstract
We examine how syndicate structure affects loan pricing in international syndicated lending.
Using extensive syndicated loan data across 103 countries from 1982 to 2012, we find that
both measures of syndicate structure, the proportional number of lead arrangers, and the pro-
portion of loan amount retained by lead arrangers in syndication, are significantly negatively
related to loan risk premiums after controlling for contract and country characteristics. These
findings indicate that, under informational frictions, as the riskiness of a borrower increases,
the syndicate structure becomes more diversified in a way that lead arrangers and participating
banks share the loan amount and the associated credit risk in syndication. Hence, syndicate
participants collaboratively determine higher loan spreads to align higher compensation for
active commitments and greater risk sharing of participating banks in syndication. Our results
offer new evidence strongly supporting the diversified nature of syndicate structure but
contradicting the concentrated nature of syndicate structure prevailing in existing studies.
Keywords Syndicate structure; International syndicated lending; Loan risk premium; Infor-
mational frictions
JEL Classification: F31, F34, G15, G21
*Acknowledgments: The authors are grateful to Joong Ho Han, Ali Nejadmalayeri, an anon-
ymous referee of the Journal, and session participants at the 2013 FMA Annual Meetings and
the 8th International Conference on Asia-Pacific Financial Markets. Bae and Chong gratefully
acknowledge the financial support from the CBA Summer Research Grant at Bowling Green
State University and the 2012 Research Fund of the University of Seoul, respectively. The
usual disclaimer applies.
**Corresponding author: Byung-Uk Chong, College of Business Administration, University of
Seoul, 163 Seoulsiripdae-ro, Dongdaemun-gu, Seoul 130-743, Korea. Tel: +82-2-6490-2250,
Fax: +82-2-6490-2219, email: [email protected].
[Note: Correction added on 18 March 2014 after initial online publication on 12 March
2014. Byung-Uk Chong’s affiliation has been corrected to University of Seoul.]
Asia-Pacific Journal of Financial Studies (2014) 43, 124–155 doi:10.1111/ajfs.12042
124 © 2014 Korean Securities Association

1. Introduction
International corporate lending mainly takes the form of syndicated loans. A syndi-
cated loan is offered by a group of lenders jointly agreeing to provide financing to a
particular borrower. Over the past two decades, the syndicated corporate loan mar-
ket has become the most important and dominant source of global corporate
financing. This high growth trend reflects the key benefits that syndicated loans are
less expensive and more efficient to administer than traditional individual credit
lines.1
In syndicated lending, lead arrangers negotiate contract terms with a borrowing
firm and organize a syndicate with participating banks. In this process, a lead arran-
ger assumes a risky position as a lender by retaining a portion of the loan and acts
as the intermediary between the borrower and participating banks by allocating
remaining loan shares to the latter. This multi-party nature of syndicated lending,
in particular, the exclusive relationship between lead arrangers and a borrower and
the unobservability of lead arrangers’ screening and monitoring efforts, potentially
creates adverse selection and moral hazard problems that must be considered in
designing a syndicate structure and determining contract terms including loan
price.2 Indeed, Ivashina (2009) shows that the information asymmetry between the
lead arranger and other participating banks in the syndicate has a large economic
cost, accounting for approximately 4% of the total cost of credit. As noted in
Pichler and Wilhelm (2001), a syndicate structure is an organizational response to
the information asymmetry problem in the process of syndicate composition.
In this paper, we examine how syndicate structure and pricing of syndicate
loans are related in international syndicated lending. Under the environment of
information asymmetry on the riskiness of borrowing firms between lead arrang-
ers and participating banks, the syndicate structure will be determined primarily
by how the risk and return associated with the loan are shared among the syndi-
cate participants. The classical work of Leland and Pyle (1977) provides insight
on the information asymmetry problems between lenders and borrowers to
explain pricing and terms on debt contracts. When applying Leland and Pyle
(1977) to syndicated lending, lead arrangers may ex ante possess private informa-
tion about the borrower, not known to participating banks, by means of their
exclusive access to the borrower’s information. This environment creates an
adverse selection problem and demands a mechanism under which lead arrangers
are required to retain a portion of the loan that will vary with the severity of the
adverse selection problem.
1According to the Thomson Reuters Legal Advisory review, global syndicated lending for the first half
of 2013 reached US$1.93 trillion, representing an 18.5% increase from the first six months of 2012.2The price of a syndicated loan is typically composed of a benchmark reference interest rate
such as the London Inter-Bank Offered Rate (LIBOR) and the spread reflecting a borrowing
firm’s riskiness.
Syndicate Structure and Loan Pricing
© 2014 Korean Securities Association 125

A large body of studies has examined the issue of information asymmetry prob-
lems between lead arrangers and participating banks in syndicated lending (see, e.g.
Pennacchi,1988; Bolton and Scharfstein, 1996; Dennis and Mullineaux, 2000; Pichler
and Wilhelm, 2001; Lee and Mullineaux, 2004; Jones et al., 2005; Champagne and
Kryzanowski, 2007; Sufi, 2007; Ivashina, 2009; Panyagometh and Roberts, 2010).
For example, Pichler and Wilhelm (2001) develop a model where, in the presence
of information asymmetry among lenders, a syndicate led by lead arrangers is
Pareto-dominant over a leaderless syndicate. They argue that, in the relationship-
intensive investment banking industry, a lead arranger acts as a monitoring mecha-
nism that threatens other lenders (syndicate participants) who might shirk in their
monitoring efforts. These studies claim that lead arrangers have an exclusive access
to private information about a borrower, while participating banks rely on lead
arrangers to assess the riskiness of the borrower. Based on this premise, several
studies offer empirical evidence in support of the concentration nature of loan
syndication that as information frictions between lead arrangers and participating
banks deepen, a syndicate structure becomes more concentrated (see, e.g. Sufi,
2007).
It is reasonably expected, however, that the heightened credit risk exposure of a
lead arranger to a single borrower through the retention of a large loan share
restricts the diversification of the lead arranger’s loan portfolio. Pennacchi (1988)
and Gorton and Pennacchi (1995) show that diversification of credit risk is among
the main reasons for loan sales by lead arrangers. Furthermore, informational fric-
tions between lead arrangers and participating banks may create an environment
where the two parties negotiate and design the contract terms of a syndicated loan.
In this setting, the information lead arrangers possess on a borrower’s riskiness is
neither exclusive nor dominantly superior to that of participating banks, but the
latter also has access to the information on the borrower’s riskiness. This is possible
because in syndicated loan markets a small number of big players (lenders and
borrowers) repeatedly make large loan deals, and each lender can become either a
lead arranger or a participating bank in different loan deals with an identical
borrower (Cai et al., 2010).
The main issue to be explored in our paper is which type of syndicate structure
between concentrated and diversified lead arrangers will take under informational
frictions between lead arrangers and participating banks. In order to examine this
issue, we test two competing hypotheses, concentration hypothesis and diversifica-
tion hypothesis, using extensive firm- and contract-level syndicated loan data for
international lending. The evidence will offer new insights into syndicate partici-
pants’ behaviors in sharing information on the borrower, forming the syndicate,
and determining loan risk premiums for syndicate participants.
The two hypotheses are based on a different premise on the information asym-
metry between lead arrangers and participating banks. The concentration hypothesis
posits that lead arrangers possess private information on a borrower almost exclu-
sively and that, as the informational-friction problem deepens, other banks are less
S. C. Bae et al.
126 © 2014 Korean Securities Association

likely to participate in the syndicate. Accordingly, lead arrangers are compelled to
concentrate the syndicate structure by retaining more loan shares and hence higher
loan risk, which leads to higher loan risk premiums. In contrast, the diversification
hypothesis posits that both lead arrangers and participating banks possess informa-
tion, though different in quantity and/or quality, through which both can assess the
riskiness of the borrower. This information is made available to both parties owing
to their repeated loan deals with taking different positions between lead arranger
and participating bank. Hence, as the riskiness of a borrower increases, lead arrang-
ers and participating banks collaboratively determine the credit risk of the borrower
and negotiate the allocation of loan shares. In this setting, lead arrangers compen-
sate participating banks with higher risk premiums to seek their syndicate participa-
tion. In sum, the concentration (diversification) hypothesis postulates that a
concentrated (diversified) syndicate structure accompanies a higher loan risk
premium.
Employing over 8000 syndicated loan contracts made by US banks to borrowers
in 103 overseas countries during the January 1982 to June 2012 period, we find that
both measures of syndicate structure, the number of lead arrangers relative to the
total number of lenders in a syndicate, and the portion of a syndicated loan
retained by lead arrangers, are significantly negatively related to loan risk premiums.
This finding is consistent with the diversification hypothesis but contrary to the
concentration hypothesis. Undocumented in the existing literature, our evidence
strongly supports the diversification nature of the syndicate structure in interna-
tional loan markets but contradicts the concentration nature of the syndicate struc-
ture in the US domestic loan markets as documented in existing studies (see, e.g.
Sufi, 2007; Ivashina, 2009).
Our evidence of the strong negative effect of the syndicate structure (i.e. syndi-
cate concentration) on loan risk premium is also in accordance with the findings
in Angbazo et al. (1998) and Focarelli et al. (2008). These studies, however, inter-
pret the negative relationships between syndicate concentration and loan risk pre-
mium as they relate to the certification effect that greater loan shares of lead
arrangers provide a credible signal of borrower quality and thus alleviate informa-
tion asymmetry problems. In this setting, the determination of syndicate structure
is viewed mainly from the lead arranger’s initiative, and thus participating banks
are passive in forming the syndicate structure and the associated loan pricing. In
contrast, we view the negative relationship as attributable primarily to the strategic
interaction between lead arrangers and participating banks under the environment
of informational friction. We interpret the diversification nature of a syndicate
structure as an outcome of active and cooperative risk sharing by both parties in
the syndicate.
The remainder of our paper is organized as follows. Section 2 reviews syndi-
cated loan markets and the previous literature and develops testing hypotheses. Sec-
tion 3 describes data and conducts empirical analysis. Section 4 presents empirical
results. Section 5 provides a summary and conclusion.
Syndicate Structure and Loan Pricing
© 2014 Korean Securities Association 127

2. Background on Loan Syndication and Development of Hypotheses
2.1. Syndicated Loan Markets and Loan Syndication Process
The high growth trend in international syndicated lending implies that there exist
substantial economic and financial benefits for both lenders and borrowers. From
the perspective of relationship lending, all parties involved in syndicated loan con-
tracts such as lead arrangers, participating banks, and borrowing firms can build
stable and persistent relationships through syndicated loan deals, which are often
repeatedly made by the same borrowers and lenders, especially in the international
syndicated loan markets. For the borrowers, syndicated loans provide a relatively
easy and alternative access to large-scale financing compared to issuing corporate
bonds or stocks. In addition, the costs of syndicated loans at large are lower than
those of other financing sources due to higher competitiveness in syndicated loan
markets. Another benefit to borrowers is the flexibility in contract deals such as
currency selection, renewal of contract, and maturity. Moreover, syndicated loans
can be offered for a variety of purposes such as corporate control, project financing,
debt repayment, and so forth. For lenders, syndication allows flexible loan portfo-
lios. Lenders can either concentrate or diversify loan portfolios while sharing infor-
mation about borrowers through participating in syndication. Syndication also
helps banks cope with the regulation, which forbids excessive and concentrated
exposure to credit risk arising from repeated relationship lending.
Loan syndication is processed through three main phases. First, during the pre-
mandated phase, the borrower solicits competitive offers to arrange and manage the
syndication with one or more banks. The borrower chooses one or more lead
arrangers that are mandated to form a syndicate, and consequently negotiates a pre-
liminary loan agreement. Second, during the post-mandated phase, the lead arrang-
ers begin the syndication process. This involves drafting a preliminary loan contract
and preparing a documentation package for the potential syndicate participants,
called information memorandum. The memorandum contains information about
the borrower’s credit worthiness and loan contract terms and conditions. A road
show is then organized to present and discuss the content of the memorandum. In
the meantime, lead arrangers establish a timetable for commitments and closing,
formally invite participants, and determine loan allocations. Third, the last phase
takes place after completion of the contract and arrangement of syndicate structure,
when the loan becomes operational and binds the borrower and the syndicate par-
ticipants to the debt contract (see Godlewski, 2007, 2010; Standard & Poor’s, 2011).
2.2. Syndicate Structure and Informational Frictions
Before closing the contract, lead arrangers collect information on the borrower,
evaluate the riskiness of the borrower, and provide participating banks with infor-
mation and an evaluation of the borrower. If the private information collected by
the lead arranger(s) through due diligence or through previous lending relationships
cannot be credibly communicated to the participating banks, an adverse selection
S. C. Bae et al.
128 © 2014 Korean Securities Association

problem might arise. In other words, the lead arrangers may be inclined to syndi-
cate loans for unreliable, risky borrowers at the expense of participating banks
(Pichler and Wilhelm, 2001). After closing the contract, if the participating banks
delegate monitoring to the lead arrangers but their monitoring efforts are unobserv-
able, a moral hazard problem might arise. Lead arrangers may shirk from due dili-
gence of monitoring, as described by Holmstrom (1979), and a moral hazard
problem may intensify when the loan shares of lead arrangers are relatively small.
However, such opportunistic behavior of lead arrangers can also generate a rep-
utation risk ex post that may endanger the success of future syndications because
the syndicate is often repeated, as noted in Champagne and Kryzanowski (2007).
They find that banks repeat syndicate alliances with the same banks, and the lead
bank’s reputation contributes to syndicate composition and structure.
Several studies show evidence that in the existence of multiple lenders like syn-
dicated lending, lender composition and structure convey information asymmetry
between lenders and borrowers. These studies also investigate how to resolve agency
problems through the structuring of syndicates and designing of loan contract terms
and conditions. For example, a borrower with less information asymmetry is more
likely served with multiple syndicate lenders rather than a sole lender (Dennis and
Mullineaux, 2000).3 Bolton and Scharfstein (1996) argue that it becomes harder for
multiple lenders to reach a collective decision when a borrower is in financial dis-
tress, suggesting that a risky borrower ex ante is best served with a concentrated
syndicate. This is consistent with the findings of Jones et al. (2005) and Sufi (2007)
that lead arrangers hold a larger portion of loans and form a smaller number of
participating banks for more information-problematic loans. Similarly, Panyago-
meth and Roberts (2010) find that lead arrangers use privately obtained informa-
tion to credibly certify borrowers, rather than taking advantage of borrowers.4 Lee
and Mullineaux (2004) show that syndicates are usually smaller and more cohesive
when little information about the borrower is available, when credit risk is relatively
high, and/or when a loan is secured. By conducting cross-country analysis across 22
Western European and East Asian countries drawn from the DealScan database, Lin
et al. (2012) show that lead arrangers tend to structure syndicates that facilitate
enhanced due diligence and monitoring efforts when the control–ownership diver-
gence is large in borrower’s corporate governance. These syndicates are relatively
3Dennis and Mullineaux (2000) find that when a loan is relatively large, the borrower is a
publicly traded firm, and/or the lead arranger is relatively reputable, the loan is more likely
to be syndicated. They also find that the lead arrangers tend to hold larger shares of syndi-
cated loans with more severe information problems.4Panyagometh and Roberts (2010) use the change in Altman’s z-scores over time as a proxy
for the lead bank’s informational advantage over participating banks on the riskiness of the
borrowers and find that a potential increase in the Altman’s z-score on the borrower (i.e.
improvement in credit risk) is positively related to the loan portion allocated to participating
banks.
Syndicate Structure and Loan Pricing
© 2014 Korean Securities Association 129

concentrated and composed of domestic banks that are geographically close to the
borrowing firms and that have lending expertise related to the industries of the bor-
rowers. Ferreira and Matos (2012) show that banks are more likely to act as lead
arrangers when they have some links in the corporate governance of the borrowing
firm in the international syndicated loan market.
Information quality not only dictates the syndicate structure but also influences
the composition of top-level lead and co-lead banks. The presence of multiple spe-
cialized co-agents can mitigate potential agency conflicts between informed lead
arrangers and participating banks through strengthened screening and monitoring
(Franc�ois and Missonier-Piera, 2007). In selecting partners, lead arrangers are more
likely to choose co-agents with comparable lending expertise such as similar indus-
try specialization that would allow lead banks to allocate more shares to co-agents
(Cai et al., 2010). One can find such a similarity in the international loan market.
The syndicate structure of international corporate lending becomes more concen-
trated as the law enforcement of the borrowing firm’s country becomes stronger
(Godlewski, 2007). This is because the lead arrangers increase shares in syndication
as monitoring costs decrease due to stronger law enforcement in the borrower’s
country.
2.3. Syndicate Structure and Loan Risk Premium
The existing literature provides evidence that syndicates are structured to enhance
screening and monitoring efforts, which in turn affect the loan pricing mechanism.
We review these studies and develop two competing hypotheses regarding the test-
able relationship between the syndicate structure and the loan risk premium of a
loan contract.
2.3.1. Concentration hypothesis
In the framework of Holmstrom and Tirole (1997), lead arrangers have an incentive
to shirk due to the higher costs of monitoring efforts. The lack of monitoring is
typically aggravated, as the lead arranger’s monitoring efforts are not visible and the
lead arrangers retain a small portion of loans. Conversely, Sufi (2007) and Ivashina
(2009) show that a larger portion of the loan retained by the lead arrangers not
only signals a credible commitment in due diligence and ex post monitoring efforts,
but also provides a strong signal of borrower quality ex ante. In particular, Ivashina
(2009) conducts her analyses based on the assumption that the lead arrangers aim
to diversify syndicate structure to reduce risk while private information in the
hands of the lead arrangers that are not known to syndicate participants would trig-
ger the latter to demand a risk premium. Her results show that borrowing costs can
be effectively managed by controlling the share of the loan retained by the lead
arrangers. In this severe information asymmetry environment, lead arrangers would
attempt to diversify the syndicate structure by decreasing their shares as the infor-
mation problem deepens. Given the lack of information on the borrower, however,
participating banks are unwilling to participate in the syndicate by decreasing their
own loan shares in the syndicate. Accordingly, the lead arrangers are compelled to
S. C. Bae et al.
130 © 2014 Korean Securities Association

concentrate the syndicate structure and in return demand higher loan risk premi-
ums for their undiversified loan portfolios and increased credit risk.
Therefore, an increase in the loan shares retained by lead arrangers will increase
the loan spread required by the lead arrangers while this will reduce the loan spread
required by the participating banks. However, because only the lead arrangers have
the dominant initiative in designing loan contracts, as Ivashina (2009) argues, a
loan spread increases as the syndicate structure becomes concentrated. Based on
these discussions, we state the concentration hypothesis as follows:
Concentration hypothesis: A concentrated syndicate structure accompanies a higher
loan risk premium demanded by lead arrangers for their unshared (or less shared)
risk-taking in syndication under information asymmetry between lead arrangers and
participating banks. Hence, a positive relationship between measures of syndicate
concentration and loan risk premium is expected.
2.3.2. Diversification hypothesis
Cai et al. (2010) show that in syndicated loan markets, repeated transactions
between the same lenders and borrowers are frequently made, resulting in relation-
ship banking within a group of lenders and borrowers. In this environment, a len-
der can be either a lead arranger or a participating bank in different debt contracts
with an identical borrower. This implies that private information retained by the
lead arrangers may be transparent to participating banks to a certain extent, and
the lead arrangers are no longer in a superior position in owning private informa-
tion (Champagne and Kryzanowski, 2007). Hence, depending on the contents and
quality of information they possess, lead arrangers and participating banks may
strategically interact in determining their shares of exposure to risk and the return
commensurate with that risk, that is, the loan risk premium.
An important implication of these studies is that the informational frictions
between lead arrangers and participating banks may not always lead to a concen-
trated syndicate structure. Rather, if the appropriate compensation for risk-taking is
aligned in contract terms and conditions, especially in loan pricing, the strategic
interaction between lead arrangers and participating banks can lead to a diversified
syndicate structure.
As a competing hypothesis to the concentration hypothesis, we develop the
diversification hypothesis. Unlike the concentrated syndicate structure, where lead
arrangers possess private information but participating banks do not, the diversified
syndicate structure represents a situation where both lead arrangers and participat-
ing banks possess information on the borrowing firm’s riskiness, although the qual-
ity and content of information could be different between the two parties. As the
risk of the borrowing firm increases, lead arrangers and participating banks share
the loan shares and the associated credit risk in the syndicate, leading to a diversi-
fied syndicate structure. In this setting, lead arrangers agree to take a smaller share
of the syndicated loan while offering a higher risk premium to participating banks
to seek for their active commitments to the syndicate and compensate for their
Syndicate Structure and Loan Pricing
© 2014 Korean Securities Association 131
bearing additional risk in the syndicate. This discussion leads us to the diversifica-
tion hypothesis as follows:
Diversification hypothesis: A diversified syndicate structure accompanies a higher
loan risk premium demanded by participating banks for their active commitment
to syndicate and risk-sharing under informational frictions between lead arrangers
and participating banks. Hence, a negative relationship between measures of syndi-
cate concentration and the loan risk premium is expected.
It is worth noting that although the diversification hypothesis in our paper pre-
dicts the same negative relationship between measures of syndicate concentration
and loan risk premium as the certification effect in the studies of Angbazo et al.
(1998) and Focarelli et al. (2008), there is a distinctive difference between the diver-
sification hypothesis and the certification effect. Angbazo et al. (1998) report that
syndicated loans have lower loan risk premiums, which are further lowered by the
presence of a lead arranger who retains a large share. In their study, the negative
relationship between syndicate concentration and loan spread is attributed to the
certification effect that a large loan share of lead arrangers provides a credible signal
about the creditworthiness of a borrower and the due diligence in monitoring
responsibilities. This certification effect alleviates the screening and monitoring
problems in informationally opaque debt contracts and reduces the related loan risk
premium. Employing data from over 80 countries, Focarelli et al. (2008) show simi-
lar evidence in support of the certification effect.
These studies, however, explain the determination of syndicate structure and
contract terms mainly from the lead arrangers’ perspective. Hence, participating
banks are just passive in designing the syndicate structure and the associated loan
price. In this setting, active discretion in credit analysis is not exercised by partici-
pating banks and thus strategic risk sharing is not conducted by lead arrangers and
participating banks in a syndicate.
In contrast, the predicted negative relation in the diversification hypothesis
results primarily from the strategic interactions between lead arrangers and partici-
pating banks under the information friction environment. We interpret the diversi-
fied syndicate structure as an outcome of active commitments to the syndicate,
especially by participating banks. This becomes possible due to the repeated deals of
syndicated loan contracts with taking different positions of lead arranger and partic-
ipating bank.
3. Empirical Design
3.1. Regression Model and Measurement of Variables
For our analysis, we model the loan risk premium of a syndicated loan mainly as a
function of the loan’s syndicate structure. The dependent variable of Loan Risk Pre-
mium is measured by all-in-drawn spread added to LIBOR as reported in Loan
Pricing Corporation’s DealScan. The key test variable of syndicate structure is
S. C. Bae et al.
132 © 2014 Korean Securities Association

measured by two proxies: (i) the number of lead arrangers relative to the total
number of lenders, denoted as Number Concentration; and (ii) the loan amount
allocated to lead arrangers relative to the total loan amount, denoted as Amount
Concentration, both of which are manually collected from DealScan.5 It is worth
noting that Number Concentration has rarely been used as a measure of syndicate
structure in previous studies.6
We hypothesize that syndicate structure reflects the active commitments and
strategic interactions of all syndicate participants and test whether and how the syn-
dicate structure, the embracive representation of strategic interactions of all lenders
within a syndicate, affects the loan risk premium, the comprehensive device of
aligning risk-adjusted compensation to all parties in the syndicate, in the process of
designing loan contracts.7
Because the loan risk premium of a syndicated loan can be affected by factors
other than the syndicate structure, we employ several explanatory variables in the
loan risk premium regressions. Following the existing literature, we first include five
widely known debt-related factors of loan risk premium to control for the charac-
teristics of syndicated loan contracts: Maturity, Loan Size, Covenant, Collateral, and
Loan Purpose. Maturity is measured by the length of loan maturity in months. Loan
Size represents the size of loan facility in US dollars and enters the regressions as a
natural log form. Covenant is an indicator variable that equals 1 if a covenant is
required in a loan contract and 0 otherwise. Collateral is an indicator variable that
equals 1 if collateral is required in a loan contract and 0 otherwise. Loan Purpose
reveals important information on potential credit risk to lenders. We use four indi-
cator variables for the types of loan purpose; Corporate Purpose is equal to 1 if the
5In this paper, lead arrangers include agents, managers, arrangers, and co-agents in syndicated
loan contracts. See Ivashina (2009) for defining lead arrangers and participating banks from
DealScan.6Sufi (2007) uses various measures of syndicate structure such as total number of lenders,
total number of participating banks, the percentage of loan volume held by lead arrangers,
and the Herfindahl–Hirschman index. The use of total number of lenders as a measure of
syndicate structure may have some defects in that it cannot be fully independent from loan
and borrower characteristics such as loan size, loan purpose, and borrower riskiness. Hence,
the syndicate structure needs to be a measure standardized, for example, by the total number
of lenders and/or total loan amount, as in our paper. The use of the Herfindahl–Hirschman
index as a measure of syndicate structure in previous studies also poses some pitfalls mainly
because this index captures the loan volume of a pre-determined number of lead arrangers
(e.g. top three, four, etc.) and thus fails to consider the interactive determination of a syndi-
cate structure among lead arrangers and participating banks.7In investigating the effect of ownership structure on bank loan syndicate structure, Lin et al.
(2012) use various measures of syndicate structure such as amount kept by lead arrangers,
percentage of loan kept by lead arrangers, and the Herfindahl index of lenders’ share. Among
these, the percentage of loan kept by lead arrangers is similar to the measure of syndicate
structure, amount concentration, in our paper.
Syndicate Structure and Loan Pricing
© 2014 Korean Securities Association 133
purpose of the loan is corporate purpose and 0 otherwise; Debt Repayment is equal
to 1 if the purpose of the loan is debt repayment and 0 otherwise; Corporate Control
is equal to 1 if the purpose of the loan is corporate control and 0 otherwise; and
Project Finance is equal to 1 if the purpose of the loan is project finance and 0
otherwise.
We also employ four indicator variables of industry to control for the effect of
the borrower’s business sector on loan pricing; Manufacturing is equal to 1 if the
business sector is manufacturing and 0 otherwise; High-tech is equal to 1 if the
business sector is high-tech and 0 otherwise; Mining is equal to 1 if the business
sector is mining and 0 otherwise; and Services is equal to 1 if the business sector is
services and 0 otherwise.
Since international lending involves more aspects of risk such as macroeconomic
conditions and country characteristics in addition to the credit risk factors that
domestic lending faces, we take into account a wide range of determinants of the risk
premiums of international syndicated loans including potential cross-country differ-
ences in these characteristics. For this purpose, we include several variables repre-
senting macroeconomic conditions and the characteristics of borrowing firms’
countries: GDP Growth, Global Financial Crisis, OECD, foreign exchange rate volatil-
ity (FX Volatility), and a credit protection measure. GDP Growth is employed to
control for the aggregate demand for funds in the borrower’s country and measured
by the annual GDP growth rate of the borrower’s country. Global Financial Crisis is
included to control for the significant structural shift during the 2007–2008 global
financial crisis period and equal to 1 if a loan is offered during the crisis period and
0 otherwise. The global financial crisis period is from October 2007 to December
2008, and the non-crisis period is the remaining period.8 During the global financial
crisis of 2007–2008, global corporate debt markets were contracted substantially due
to the higher uncertainty of future economic growth, resulting in a higher risk aver-
sion and thus curtailing financing activities significantly for both lending institutions
and borrowing firms (Ivashina and Scharfstein, 2010). Santos (2011) also shows that
the bank-dependent borrowers were forced to pay a higher spread on loans issued
during the global financial crisis than during the pre-crisis period. OECD represents
a country’s membership to the Organization for Economic Cooperation and Devel-
opment (OECD) and is equal to 1 if a country belongs to the OECD and 0 other-
wise.9 FX Volatility is used to control for the volatility of a country’s exchange rate,
measured by the annual standard deviation of the daily exchange rate. Note that we
8Following De Haas and Van Horen (2010) and Godlewski (2010), we suppose that the glo-
bal financial crisis started in October 2007 rather than in August 2007 when the collapse of
the US subprime financial markets began. This choice for the start of the takes into account
an average of eight weeks’ time lag between starting loan negotiations and signing the deal.9The OECD was created for global development by 18 European countries and the USA and
Canada in 1960, and currently has 34 member countries, including many of the world’s most
advanced countries and emerging economies like Mexico, Chile, and Turkey.
S. C. Bae et al.
134 © 2014 Korean Securities Association

do not include the aggregate income level of each country, for example, GDP and
per capita GDP, as country characteristics because these variables are redundant in
the presence of GDP growth and the OECD indicator.
Previous studies show that the degree of country-level credit protection affects
credit decisions in international lending (La Porta et al., 1998; Djankov et al., 2007;
Qian and Strahan, 2007; Bae and Goyal, 2009). Godlewski (2007) further shows that
the degree of concentration in the syndicate structure of international corporate
lending depends largely on the strength of the law enforcement of the borrower’s
country. Following these studies, we use Country Credit Rating as a proxy variable
for a borrowing country’s credit protection measure, following Moody’s sovereign
ratings.
Putting all variables together, we estimate the following cross-sectional ordinary
least squares regression model to test two competing hypotheses of the concentra-
tion and diversification hypotheses:
Loan Risk Premiumi ¼ bþ b1Syndicate Structureþ b2Maturityi þ b3Loan Sizei
þ b4Covenanti þ b5Collaterali þ b6Loan Purposei þ b7Industryiþ b8GDP Growthi þ b9OECDi þ b10Global Financial Crisisiþ b11FX Volatilityi þ b12Country Credit Ratingi þ �i ð1Þ
where the key test variable is Syndicate Structure, which takes one of two proxy
variables, Number Concentration and Amount Concentration. The concentration
(diversification) hypothesis predicts a positive (negative) sign of the estimated
regression coefficient of Syndicate Structure. Loan Purpose is one of four indicator
variables of Corporate Purpose, Debt Repayment, Corporate Control, and Project
Finance. Industry is one of four indicator variables of Manufacturing, High-tech,
Mining, and Services. Table 1 presents brief definitions of variables employed in
the regression model.
It is worth noting that in estimating regression model (1), there may exist an
endogeneity problem between Loan Risk Premium and Syndicate Structure. Recog-
nizing the endogenous nature of such a regression, Ivashina (2009) attempts to
overcome this problem by using the instrumental variable approach, while Focarelli
et al. (2008) resolve a similar problem by employing a broad range of control vari-
ables which would have direct effects on the determination of the loan risk pre-
mium. Following Focarelli et al. (2008), we cope with this endogeneity problem by
employing control variables that cover a variety of factors affecting loan deals in
international syndicated lending.
3.2. Data and Sample Selection
We collect our sample of firm-level syndicated corporate loan contracts from
Thomson Reuters’ DealScan, a rich and unique database covering extensive interna-
tional syndicated loan contracts, during the period January 1982 to June 2012.
Syndicate Structure and Loan Pricing
© 2014 Korean Securities Association 135

We limit our sample to loan contracts offered by US banks in US dollars
because US banks cover the largest volume of syndicated loans primarily offered in
US dollars in international financial markets. In addition, by focusing on interna-
tional syndicated loans offered by US lenders, we attempt to investigate the behav-
ior of lenders with some uniform characteristics in offering loans to borrowing
firms in foreign countries. Although syndicated loans are sometimes priced by
prime rate and other benchmark interest rates than LIBOR, the majority of syndi-
cate deals are made in LIBOR as the base interest rate plus the risk premium to
reflect the riskiness of a borrower. Hence, we further limit our analysis to loan con-
tracts priced by LIBOR to maintain consistency across individual loan contracts.
We use the loan spread as the market price of syndicated corporate loans.
We collect from the DealScan database detailed characteristics of contract infor-
mation on corporate loan contacts such as benchmark reference interest rate, mar-
gin (spread), loan amount, debt maturity, loan purpose, security, and deal
Table 1 Definition of variables
Variables Definition
Dependent variable
Loan Risk Premium All-in-drawn spread added to LIBOR reported in DealScan
Test variable: Syndicate structure
Number Concentration Number of lead arrangers/Total number of lenders
Amount Concentration Shares of lead arrangers/Total loan amount
Control variables: Contract characteristics
Maturity Length of loan maturity in months
Loan Size Size of loan facility in US dollars (million)
Covenant 1 if covenant required in contract and 0 otherwise
Collateral 1 if collateral required in contract and 0 otherwise
Loan Purpose
Corporate Purpose 1 if loan purpose is corporate purpose and 0 otherwise
Debt Repayment 1 if loan purpose is debt repayment and 0 otherwise
Corporate Control 1 if loan purpose is corporate control and 0 otherwise
Project Finance 1 if loan purpose is project finance and 0 otherwise
Industry
Manufacturing 1 if business sector is manufacturing and 0 otherwise
High-tech 1 if business sector is high-tech and 0 otherwise
Mining 1 if business sector is mining and 0 otherwise
Services 1 if business sector is services and 0 otherwise
Control variables: Macroeconomic conditions and country characteristics
GDP Growth Annual GDP growth rate of borrower’s country
OECD 1 if borrower is in OECD country and 0 otherwise
Global Financial Crisis 1 if loan is offered during the crisis period and 0 otherwise
FX Volatility Annual standard deviation of daily exchange rate
Country Credit Rating Moody’s sovereign rating
S. C. Bae et al.
136 © 2014 Korean Securities Association

currency, along with borrower characteristics such as name, nationality, business
sector, and sales. We also obtain data for country and macroeconomic characteris-
tics from various sources including the World Development Indicators of the World
Bank, International Financial Statistics from the International Monetary Fund, and
the databases of the US Federal Reserve Bank.
Our final sample consists of 8257 syndicated loan contracts in 103 countries to
which at least one syndicate loan contract is offered by US banks over the sample
period. Table 2 reports the sample distributions of syndicated loan contracts across
103 countries. During our sample period, US banks made the largest number of
syndicated loans (1458) to borrowers in the UK, which represent about 17.7% of all
loans in the sample, followed by Canada (1028), France (639), Germany (555), and
the Netherlands (440).
4. Empirical Results
4.1. Descriptive Statistics
Table 3 reports descriptive statistics of several key variables for syndicated loan
deals across 103 countries in our sample. Note that the number of observations for
Amount Concentration is substantially smaller than that for Number Concentration
because a large number of syndicated loan contracts reported in the DealScan data-
base do not report the loan amount allocated to lenders in the syndicate. Also, the
number of observations for the variables varies due to missing data.
The average Number Concentration and Amount Concentration are 0.42 and
0.46, respectively. Hence, lead arrangers in syndicated loans offered to borrowers in
103 countries by US banks typically represent about 42% of total lenders and retain
about 46% of the total loan amount in the syndication. It is also shown that a typi-
cal syndicated loan in our sample carries a loan risk premium (all-in-drawn spread)
of 173.83 basis points or 1.7383% above LIBOR, has a maturity of 55.63 months,
and amounts to $698 million in size. A borrower’s country has on average an
annual GDP growth rate of 8% and a country credit rating of 18.53.10
4.2. Univariate Analysis
Panels A and B of Table 4 show the means and medians of loan risk premium clas-
sified by the levels of Number Concentration and Amount Concentration, respec-
tively, along with t- and z-statistics for the differences-in-means and medians tests.
With respect to the level of Number Concentration as reported in Panel A, borrow-
ing firms carry significantly higher loan risk premiums for syndicated loans with
low Number Concentration than for those with high Number Concentration (119.70
versus 104.90 bps). Similarly, with respect to the level of Amount Concentration as
reported in Panel B, higher loan risk premiums are associated with loans with low
Amount Concentration.
10The country credit rating of the borrower’s country ranges from 2 to 21 in our sample.
Syndicate Structure and Loan Pricing
© 2014 Korean Securities Association 137

Table 2 Distribution of sample syndicated loans by country
The sample includes syndicated loan contracts issued by US banks to borrowers in 103 countries during
1982–2012.
Country Frequent Percent Country Frequent Percent Country Freq. Percent
Andorra 2 0.02 Germany 555 6.72 Oman 9 0.11
Angola 2 0.02 Ghana 6 0.07 Other 5 0.06
Argentina 156 1.89 Greece 50 0.61 Panama 30 0.36
Australia 139 1.68 Guatemala 13 0.16 Paraguay 1 0.01
Austria 24 0.29 Honduras 4 0.05 Peru 33 0.40
Azerbaijan 9 0.11 Hong Kong 39 0.47 Philippines 4 0.05
Bahamas 15 0.18 Hungary 31 0.38 Poland 25 0.30
Bahrain 21 0.25 Iceland 15 0.18 Portugal 21 0.25
Bangladesh 2 0.02 India 43 0.52 Qatar 22 0.27
Barbados 7 0.08 Indonesia 12 0.15 Romania 14 0.17
Belgium 80 0.97 Ireland 98 1.19 Russia 197 2.39
Bermuda 212 2.57 Israel 14 0.17 Saudi
Arabia
26 0.31
Bolivia 3 0.04 Italy 167 2.02 Singapore 23 0.28
Brazil 238 2.88 Jamaica 4 0.05 Slovakia 10 0.12
British
Virgin
Islands
1 0.01 Japan 49 0.59 Slovenia 14 0.17
Bulgaria 1 0.01 Kazakhstan 50 0.61 South Africa 79 0.96
Cameroon 2 0.02 Korea (South) 30 0.36 Spain 231 2.80
Canada 1028 12.45 Kuwait 14 0.17 Sri Lanka 1 0.01
Cayman
Islands
18 0.22 Latvia 3 0.04 Sweden 109 1.32
Chile 134 1.62 Liberia 1 0.01 Switzerland 257 3.11
China 8 0.10 Lithuania 3 0.04 Taiwan 9 0.11
Colombia 58 0.70 Luxembourg 85 1.03 Tanzania 2 0.02
Congo 1 0.01 Macau 10 0.12 Thailand 1 0.01
Costa Rica 4 0.05 Malaysia 6 0.07 Trinidad
and
Tobago
8 0.10
Croatia 18 0.22 Malta 4 0.05 Tunisia 3 0.04
Cyprus 2 0.02 Mauritania 2 0.02 Turkey 282 3.42
Czech
Republic
17 0.21 Mexico 413 5.00 Ukraine 26 0.31
Denmark 62 0.75 Morocco 4 0.05 United
Arab
Emirates
38 0.46
Dominican
Republic
5 0.06 Netherlands 440 5.33 United
Kingdom
1458 17.66
S. C. Bae et al.
138 © 2014 Korean Securities Association

The results from the univariate analysis indicate that risk premiums on syndi-
cated loans are significantly negatively related to the levels of both measures of syn-
dicate structure, lending empirical support, though preliminary, for the
diversification hypothesis.
4.3. Correlation Analysis
Table 5 presents the Pearson correlation coefficients between key variables for the full
observations across all 103 countries. Among others, Loan Risk Premium (all-in-
drawn spread) is significantly (at the 1% level) negatively correlated with both mea-
sures of syndicate structure (Number Concentration and Amount Concentration), Loan
Size, OECD, and Country Credit Rating, but is significantly (at the 1% level) positively
correlated with contract characteristics such as Maturity, Covenant, and Collateral,
and macroeconomic conditions such as GDP Growth and Global Financial Crisis.
The negative and significant correlation coefficients between loan risk premium
and both measures of syndicate structure lend evidence in support of the diversifi-
cation hypothesis but are contradictory to the concentration hypothesis.
Table 2 (Continued)
Country Frequent Percent Country Frequent Percent Country Freq. Percent
Egypt 34 0.41 Netherlands
Antilles
3 0.04 Uruguay 9 0.11
El Salvador 6 0.07 New Zealand 6 0.07 Venezuela 26 0.31
Estonia 1 0.01 Nicaragua 2 0.02 Zimbabwe 2 0.02
Finland 74 0.90 Nigeria 1 0.01
France 639 7.74 Norway 82 0.99 Total 8257 100
Table 3 Descriptive statistics for full sample
The sample includes syndicated loan contracts issued by US banks to borrowers in 103 countries during
1982–2012. Number Concentration is the number of lead arrangers relative to the total number of lenders
in a syndicate. Amount Concentration is the shares of loan volume of lead arrangers relative to the loan
amount. Loan Risk Premium is all-in-drawn spread added to LIBOR reported in DealScan. GDP Growth
is measured by the annual growth rate of GDP. Country Credit Rating follows Moody’s sovereign ratings.
Variables Mean
Lower
quartile Median
Upper
quartile
No. of
observations
Number Concentration 0.42 0.14 0.36 0.67 8257
Amount Concentration 0.46 0.17 0.43 0.75 1398
Loan Risk Premium (bps) 173.83 50.00 140.00 250.00 8257
Maturity (months) 55.63 36.00 60.00 82.00 8257
Loan Size ($millions) 698.00 100.00 265.00 718.00 8257
GDP Growth 0.08 �0.23 0.00 0.27 7061
Country Credit Rating 18.53 19.00 21.00 21.00 6160
Syndicate Structure and Loan Pricing
© 2014 Korean Securities Association 139

4.4. Regression Estimates
Though preliminary, the results from the univariate analysis in Table 4 and the cor-
relation coefficient analysis in Table 5 highlight the negative and significant empiri-
cal relationship between syndicate structure and loan risk premium. We now
examine this relationship in a more rigorous regression analysis after controlling for
characteristics related to loan contracts and borrower’s countries.
Panels A and B of Table 6 present the regression estimates of Loan Risk Pre-
mium with Number Concentration and Amount Concentration as key test variables
of syndicate structure, respectively. Note that the number of observations in the
estimations with Amount Concentration in Panel B is substantially smaller than
that with Number Concentration in Panel A because many loan contracts in the
DealScan database do not report the loan amount allocated to lenders in the syn-
dicate.
Looking first at the variables representing loan contract characteristics, regres-
sion estimates of these variables in general carry the expected signs. As reported in
Panels A and B, Loan Risk Premium of a typical syndicated loan is significantly (at
least at the 5% level) positively related to Debt Maturity, Covenant, and Collateral,
and significantly (at the 1% level) negatively related to Loan Size, regardless of the
syndicate structure variable employed. Hence, the risk premium of a syndicated
loan increases with longer maturity and the existence of covenant and/or collateral,
while the loan risk premium declines with bigger loan size.
Table 4 Univariate analysis
The sample includes syndicated loan contracts issued by US banks to borrowers in 103 countries during
1982–2012. Number Concentration is the number of lead arrangers relative to the total number of lenders
in a syndicate. Amount Concentration is the shares of loan volume of lead arrangers relative to the loan
amount. Loan Risk Premium is all-in-drawn spread added to LIBOR reported in DealScan. GDP Growth
is measured by the annual growth rate of GDP. Country Credit Rating follows Moody’s sovereign ratings.
t- and z-statistics are for testing for differences in means and medians, respectively. ***, **, and * indi-
cate significance at the 1%, 5%, and 10% levels, respectively.
High NC Low NC
Mean (Median) Mean (Median) t-statistics z-statistics
Panel A: Based on Number Concentration (NC)
Number Concentration 0.686 (0.666) 0.162 (0.143) 150.00*** 78.74***
Loan Risk Premium 168.480 (125.000) 179.181 (150.000) 5.89*** 5.47***
No. of observations 4126 4131
Panel B: Based on Amount Concentration (AC)
Amount Concentration 0.742 (0.750) 0.183 (0.175) 66.94*** 32.38***
Loan Risk Premium 114.582 (70.000) 129.940 (87.500) 3.82*** 3.92***
No. of observations 699 699
S. C. Bae et al.
140 © 2014 Korean Securities Association

Table
5Correlationanalysisforkeyvariables
Thesampleincludes
syndicated
loan
contracts
issued
byUSbanks
toborrowersin
103countriesduring1982–2012.
SeeTable
1fordefinitionsofvariables.
***,**,and*indicatesignificance
atthe1%
,5%
,and10%
levels,respectively.
Variable
(1)
(2)
(3)
(4)
(5)
(6)
(7)
(8)
(9)
(10)
(11)
(12)
(1)All-in-drawn
Spread
1.000
(2)Number
Concentration
�0.046***
1.000
(3)Amount
Concentration
�0.111***
0.916***
1.000
(4)Maturity
0.250***
0.118***
0.084***
1.000
(5)LoanSize
�0.434***
0.078***
0.064***
�0.054***
1.000
(6)Covenant
0.063***
�0.116***
�0.167***
0.030***
0.018*
1.000
(7)Collateral
0.370***
0.038***
�0.033
0.181***
�0.122***
0.184***
1.000
(8)GDPGrowth
0.119***
0.055***
0.099***
0.042***
0.064***
�0.025**
0.151***
1.000
(9)OECD
�0.072***
�0.021**
0.035
0.120***
0.159***
�0.021**
0.012
�0.008
1.000
(10)
Country
Credit
Rating
�0.042***
�0.039***
�0.016
0.192***
0.233***
0.076***
0.093***
0.040***
�0.197***
1.000
(11)
Global
Financial
Crisis
0.034***
�0.000
�0.023
0.007
0.060***
0.021**
0.074***
0.291***
�0.010
0.065***
1.000
(12)
FXVolatility
�0.013
�0.018*
�0.022
�0.192***
�0.054***
�0.058***
0.001
0.040***
0.095***
�0.444***
0.047***
1.000
Syndicate Structure and Loan Pricing
© 2014 Korean Securities Association 141

Table
6Regressionestimates
ofloan
risk
premium
Thesample
includes
syndicated
loan
contracts
offered
byUSbanks
toforeignborrowingfirm
sin
103countriesduring1982–2012.
SeeTable
1forthedefinitionsof
variables.t-values
inparentheses
arecomputedusingrobust
standarderrors
forfirm
clusters.**
*,**,and*indicatesignificance
atthe1%
,5%
,and10%
levels,respec-
tively.
Variables
Dependentvariable:All-in-drawnspread
added
toLIBOR
Model
(1)
Model
(2)
Model
(3)
Model
(4)
Model
(5)
Model
(6)
Panel
A:Regressionestimates
ofLoanRiskPremium
withNumberConcentration
NumberConcentration
�0.105**
�0.127**
�0.177***
�0.179***
�0.144***
�0.147***
(�2.13)
(�2.47)
(�3.38)
(�3.38)
(�2.74)
(�2.79)
Maturity
0.230***
0.186***
0.197***
0.224***
0.186***
0.196***
(11.85)
(7.92)
(8.50)
(9.17)
(7.94)
(8.04)
LoanSize
�0.278***
�0.260***
�0.245***
�0.233***
�0.261***
�0.257***
(�23.92)
(�20.21)
(�19.31)
(�18.09)
(�20.27)
(�19.91)
Covenant
0.020
0.116**
0.128**
0.150***
0.127**
0.129**
(0.39)
(2.16)
(2.36)
(2.79)
(2.39)
(2.40)
Collateral
0.668***
0.503***
0.523***
0.521***
0.504***
0.507***
(20.69)
(13.99)
(14.21)
(13.91)
(14.04)
(13.98)
Corporate
Purpose
�0.251***
�0.257***
�0.265***
�0.249***
�0.242***
(�5.80)
(�5.84)
(�5.83)
(�5.74)
(�5.52)
DebtRepay
�0.354***
�0.365***
�0.363***
�0.355***
� 0.354***
(�7.47)
(�7.76)
(�7.61)
(�7.55)
(�7.49)
Corporate
Control
0.366***
0.386***
0.411***
0.365***
0.376***
(8.39)
(8.71)
(9.05)
(8.41)
(8.62)
Project
Finance
�0.018
�0.086
�0.110
�0.018
�0.008
(�0.23)
(�1.09)
(�1.44)
(�0.24)
(�0.10)
S. C. Bae et al.
142 © 2014 Korean Securities Association

Table
6(C
ontinued)
Variables
Dependentvariable:All-in-drawnspread
added
toLIBOR
Model
(1)
Model
(2)
Model
(3)
Model
(4)
Model
(5)
Model
(6)
Manufacturing
0.028
0.041
0.046
0.027
0.029
(0.64)
(0.94)
(1.03)
(0.62)
(0.66)
High-tech
�0.048
�0.035
�0.008
�0.058
�0.051
(�0.63)
(�0.46)
(�0.11)
(�0.77)
(�0.68)
Mining
�0.041
�0.054
�0.036
�0.042
�0.035
(�0.65)
(�0.85)
(�0.56)
(�0.68)
(�0.56)
Services
0.109**
0.150***
0.181***
0.116**
0.124**
(2.07)
(2.80)
(3.38)
(2.18)
(2.33)
GDPGrowth
0.177***
0.157***
0.164***
0.175***
0.167***
(5.49)
(4.88)
(5.02)
(5.30)
(5.15)
OECD
Dummy
�0.377***
(�6.58)
CountryCreditRating
�0.029***
(�6.55)
GlobalCrisisDummy
0.015
(0.27)
FXVolatility
0.000*
(1.89)
Constant
5.275***
5.473***
5.625***
5.635***
5.414***
5.342***
(54.29)
(46.22)
(47.80)
(43.72)
(47.67)
(44.89)
Observations
8257
6160
6160
6108
6160
6121
R-square
0.314
0.400
0.411
0.414
0.399
0.402
F-value
334.45***
144.73***
139.01***
137.92***
135.28***
136.03***
Syndicate Structure and Loan Pricing
© 2014 Korean Securities Association 143

Table
6(C
ontinued)
Variables
Dependentvariable:All-in-drawnspread
added
toLIBOR
Model
(1)
Model
(2)
Model
(3)
Model
(4)
Model
(5)
Model
(6)
Panel
B:Regressionestimates
ofLoanRiskPremium
withAmountConcentration
AmountConcentration
�0.217*
�0.150
�0.210*
�0.215*
�0.185
�0.204*
(�1.96)
(�1.38)
(�1.84)
(�1.88)
(�1.64)
(�1.79)
Maturity
0.111***
0.064
0.074
0.090*
0.069
0.092*
(2.76)
(1.34)
(1.52)
(1.75)
(1.41)
(1.82)
LoanSize
�0.215***
�0.218***
�0.216***
�0.211***
�0.224***
�0.214***
(�8.98)
(�8.28)
(�8.02)
(�7.82)
(�8.71)
(�8.04)
Covenant
0.127
0.250***
0.278***
0.302***
0.267***
0.283***
(1.52)
(2.69)
(2.97)
(3.20)
(2.90)
(2.96)
Collateral
0.717***
0.612***
0.609***
0.584***
0.600***
0.597***
(9.02)
(6.82)
(6.72)
(6.19)
(6.78)
(6.59)
Corporate
Purpose
�0.246***
�0.250***
�0.267***
�0.248***
�0.245***
(�2.75)
(�2.79)
(�2.95)
(�2.82)
(�2.73)
DebtRepayment
�0.301***
�0.303***
�0.321***
�0.290***
�0.306***
(�3.45)
(�3.51)
(�3.64)
(�3.37)
(�3.53)
Corporate
Control
0.392***
0.388***
0.382***
0.398***
0.399***
(3.08)
(3.11)
(2.93)
(3.22)
(3.21)
Project
Finance
0.121
0.116
0.094
0.095
0.119
(0.56)
(0.53)
(0.43)
(0.42)
(0.55)
Manufacturing
�0.007
�0.015
0.006
�0.002
�0.023
(�0.09)
(�0.17)
(0.07)
(�0.02)
(�0.27)
S. C. Bae et al.
144 © 2014 Korean Securities Association

Table
6(C
ontinued)
Variables
Dependentvariable:All-in-drawnspread
added
toLIBOR
Model
(1)
Model
(2)
Model
(3)
Model
(4)
Model
(5)
Model
(6)
High-tech
�0.045
�0.067
�0.032
�0.091
�0.065
(�0.30)
(�0.45)
(�0.21)
(�0.65)
(�0.44)
Mining
�0.024
�0.038
�0.008
�0.035
�0.002
(�0.18)
(�0.27)
(�0.06)
(�0.26)
(�0.02)
Services
�0.042
�0.027
0.002
�0.026
�0.026
(�0.29)
(�0.18)
(0.01)
(�0.17)
(�0.18)
GDPGrowth
0.072
0.063
0.078
0.035
0.063
(1.04)
(0.86)
(1.10)
(0.47)
(0.88)
OECD
Dummy
�0.072
(�0.62)
CountryCreditRating
�0.013*
(�1.66)
GlobalCrisisDummy
0.334***
(2.75)
FXVolatility
0.000***
(2.60)
Constant
5.141***
5.574***
5.462***
5.536***
5.432***
5.298***
(25.67)
(24.15)
(22.41)
(22.24)
(23.29)
(20.85)
Observations
1398
1044
1044
1010
1044
1036
R-square
0.266
0.334
0.331
0.341
0.336
0.332
F-value
65.30***
27.41***
26.02***
24.83***
25.74***
25.20***
Syndicate Structure and Loan Pricing
© 2014 Korean Securities Association 145

The positive effect of debt maturity on loan risk premium reflects the added
maturity risk premium for longer-term maturity loans. This finding is also in accor-
dance with Eichengreen and Moody (2003) and Flannery (1986) who indicate that
lenders’ monitoring efforts increase as the loan maturity lengthens. A longer matu-
rity loan is penalized with a higher risk premium charged by lenders because a bor-
rower is given longer to exercise moral hazard behaviors ex post the loan contract.
In a similar argument, a short-term debt is viewed as an effective tool to discipline
risky borrowers by forcing them to expose to refunding risk in a way that a risky
borrower may not be able to rollover the short-term debt as their short-term debt
expires more frequently than longer-term debt. Owing to the frequent requests for
renewal, short-term loans provide fewer opportunities to the agent bank to shirk on
monitoring (Dennis and Mullineaux, 2000). Frequent renewals of short-term debt
also require more monitoring by external screeners like credit rating agencies and
financial market participants upon new debt issuance (Guedes and Opler, 1996).
The positive regression coefficients of Loan Maturity in Panels A and B of Table 5
confirm the above argument.
The negative and significant relationship between loan size and loan risk pre-
mium is consistent with the findings in Altunbas and Gadanecz (2003), Eichengreen
and Moody (2003), and Kleimeier and Megginson (2000). The positive and signifi-
cant effect of Collateral (security-indicator) on loan risk premium is in line with Al-
tunbas and Gadanecz (2003), Berger and Udell (1990), Berger et al. (2011), and
Nini (2004). In particular, Berger and Udell (1990) find that the most risky borrow-
ers are required to pledge collateral.11
Regarding loan purpose, an important factor that lenders assess for potential
credit risk, Table 6 shows that while Corporate Purpose and Debt Repay are both sig-
nificantly (at the 1% level) negatively related to loan risk premium, Corporate Con-
trol is significantly (at the 1% level) positively related to loan risk premium. Hence,
syndicated loans for the purpose of corporate control, involving activities such as
LBOs and M&As, are associated with higher risk premiums compared to loans for
other loan purposes. These findings are in line with those in Altunbas and Gadan-
ecz (2003). It is also shown that borrowing firms belonging to the services industry
are associated with relatively high-risk premiums.
Examining the regression estimates of the variables representing country-related
characteristics, the loan risk premium is significantly positively related to GDP
Growth, Global Financial Crisis Dummy (only in Panel B), and FX Volatility, but is
significantly negatively related to OECD Dummy and Country Credit Rating.12 Thus,
borrowing firms in OECD countries and/or countries with a higher credit rating
enjoy lower debt costs, whereas borrowers in countries with a higher GDP growth
11In contrast, Besanko and Thakor (1987) argue that when borrowers have informational
advantages about their default probabilities, the least risky borrowers pledge collateral.12Owing to the high correlations among country-related variables as shown in Table 5, these
variables enter the regression models separately.
S. C. Bae et al.
146 © 2014 Korean Securities Association

(most likely non-OECD countries) and/or higher foreign exchange risk, bear higher
loan risk premiums. It is also shown that borrowing firms bear higher spreads in
international syndicated loan markets during the global financial crisis period than
during other periods.
Turning to the regression estimates of our key test variables of syndicate struc-
ture, Number Concentration, measured by the proportional number of lead arrang-
ers in a syndicate, carries a negative and significant (at the 1% level) regression
coefficient in all six regression models in Panel A. Similarly, though slightly weak,
Amount Concentration, measured by the proportional shares of loans of lead arrang-
ers, has a negative and significant (at the 10% level) regression coefficient in four of
six regression models in Panel B. Accordingly, both the relative number of lead
arrangers and the portion of a syndicate loan retained by lead arrangers have signif-
icant and negative effects on loan risk premium.
Combined, the regression results in Panels A and B of Table 6 provide strong evi-
dence supporting the diversification hypothesis that a diversified syndicate structure
is associated with a higher loan risk premium demanded by participating banks to
compensate for the severity of information asymmetry and the lack of the lead
arrangers’ commitment on a loan contract. Our regression results support the under-
lying premise of the diversification hypothesis that both lead arrangers and partici-
pating banks possess information through which they can assess the riskiness of the
borrowing firm as accurately as possible. Hence, as the riskiness of a borrowing firm
increases, the syndication structure becomes more diversified and diffused in a way
that lead arrangers and participating banks share the loan amounts and the associ-
ated credit risk in syndication, while at the same time the lead arrangers offer higher
risk premiums to the participating banks to seek their syndicate participation.
4.5. Robustness Tests
In order to ensure the robustness of our empirical results regarding tests of the two
hypotheses, we conduct additional tests. A limitation of the regression model (equa-
tion (1)) employed to test our two hypotheses is the lack of variables controlling
for borrowing firms’ financial characteristics, which may also affect the risk pre-
mium of a syndicated loan. As a way to estimate a regression model with a more
complete set of control variables that include borrowers’ financial information, we
first match borrowing firms in our original sample (collected from DealScan) with
firms in the Worldscope database during our sample period. We then collect the
financial information of the matched borrowing firms from the Worldscope database
including total assets as a measure of firm size, debt ratio as a measure of financial
leverage, return on assets (ROA) as a measure of profitability, and the ratio of fixed
assets to total assets as a measure of tangibility to construct a new set of sample
firms.13 This process significantly reduces the maximum number of observations to
13We employ each borrowing firm’s tangibility to control for its financing demand of large-
scale fixed assets, which in general require large funding (Almeida and Campello, 2007).
Syndicate Structure and Loan Pricing
© 2014 Korean Securities Association 147

1472 syndicated loans for the regression models with Number Concentration and
333 loans for those with Amount Concentration.
Panels A and B of Table 7 show the summary statistics and Pearson correlation
coefficients, respectively, of key variables including the four financial variables of
borrowing firms in the reduced sample. As shown in Panel A, a borrowing firm on
average has total assets of US$1040 million, a total debt to total assets ratio of 32%,
an ROA of 11%, and a tangibility ratio of 35%. It is further shown in Panel B that
loan risk premium is significantly positively correlated with Leverage and Tangibility
but is significantly negatively correlated with Firm Size and ROA. Hence, higher
loan spreads are in general associated with smaller, more leveraged, more tangible,
Table 7 Descriptive statistics for DealScan data merged with Worldscope data
The sample includes syndicated loan contracts offered by US banks to foreign borrowing firms whose
data are initially collected from DealScan and then matched with firms in the Worldscope database during
1982–2012. See Table 1 for definitions of variables. ***, **, and * indicate significance at the 1%, 5%,
and 10% levels, respectively.
Panel A: Summary statistics of key variables
Variables Mean
Lower
quartile Median
Higher
quartile
Number Concentration 0.38 0.13 0.30 0.63
Amount Concentration 0.48 0.17 0.50 0.79
All-in-drawn Spread (bps) 79.66 0.00 35.00 115.00
Maturity (months) 44.78 12.00 45.00 60.00
Loan Size ($millions) 910.05 136.16 365.78 1000.00
Firm Size ($millions)) 1040.00 28.97 890.91 5157.97
Leverage 0.32 0.21 0.31 0.42
ROA 0.11 0.07 0.11 0.15
Tangibility 0.35 0.12 0.32 0.54
GDP Growth 0.11 �0.19 0.00 0.30
Country Credit Rating 17.71 14.00 21.00 21.00
Panel B: Correlation coefficients of key variables
Variables (1) (2) (3) (4) (5) (6) (7)
(1) All-in-drawn Spread 1.00
(2) Number
Concentration
�0.18*** 1.00
(3) Amount
Concentration
�0.19*** 0.91*** 1.00
(4) Firm Size �0.34*** 0.06*** 0.04 1.00
(5) Leverage 0.26*** �0.01 0.05 �0.04** 1.00
(6) ROA �0.17*** 0.13*** 0.09* �0.07*** �0.06*** 1.00
(7) Tangibility 0.07*** �0.11*** �0.08* �0.08*** 0.19*** 0.28*** 1.00
S. C. Bae et al.
148 © 2014 Korean Securities Association

and less profitable borrowing firms. Most importantly, both Number Concentration
and Amount Concentration are significantly negatively correlated with loan risk pre-
mium, evidence in line with our earlier findings for the original full sample
reported in Table 4 and in support of the diversification hypothesis.
For the regression analysis, we estimate regression equation (1) by adding the
four financial variables as additional control variables and report the regression
results in Table 8. As in Table 6, Panels A and B report the regression estimates
with Number Concentration and Amount Concentration, respectively, as key test vari-
ables of syndicate structure. While the regression coefficients of a few control vari-
ables such as Maturity, Services, and FX Volatility lose their significance mainly due
to the reduced number of observations, the overall regression results for the control
variables representing the characteristics of loan contracts, loan purpose, industry,
and country are in general similar to those for the original full sample in terms of
signs and significance levels. Hence, we briefly discuss the regression estimates of
the four financial variables before reviewing the regression estimates of the two key
variables of syndicate structure.
Consistent with the correlation coefficients between financial variables and loan
spread as reported in Table 7, Firm Size and ROA carry negative and significant (at
the 1% level) regression coefficients in all six regression models, while Leverage has
positive and significant (at the 1% level) regression estimates in all six regression
models. Hence, these results offer evidence that borrowing firms’ financial charac-
teristics also play important roles in the determination of their loan spreads. The
negative relation of Firm Size with loan risk premium is mainly driven by the nega-
tive effect of firm size on the firm’s default risk (Dichev, 1998). In addition, firm
size is related to information asymmetry, and a larger firm is in general associated
with less adverse selection and moral hazard problems with lenders.
In robustness tests, the control variables of borrowing firms’ financial character-
istics are in general estimated as expected. Most importantly, the regression esti-
mates of Number Concentration are all negative and significant at the 1% level in all
six regression models in Panel A of Table 8. Similarly, the regression coefficients of
Amount Concentration are all negative and significant in two regression models in
Panel B, where several variables including Amount Concentration lose their signifi-
cance due to a substantially smaller number of observations (slightly more than
300). Though weaker than our earlier findings, the results in Table 8 provide con-
firmatory evidence that a more diversified (or a less concentrated) syndicate struc-
ture accompanies a higher loan spread, lending empirical support for the
diversification hypothesis.
5. Summary and Conclusions
We examine how lead arrangers and participating banks determine the syndicate
structure and how this syndicate structure affects the loan risk premium in the pro-
cess of designing international syndicated loan contracts. For this purpose, we
Syndicate Structure and Loan Pricing
© 2014 Korean Securities Association 149

Table 8 Regression estimates for DealScan data merged with Worldscope data
The sample includes syndicated loan contracts offered by US banks to foreign borrowing firms whose
data are initially collected from DealScan and then matched with firms in the Worldscope database during
1982–2012. See Table 1 for definitions of variables. t-values in parentheses are computed using robust
standard errors for firm clusters. ***, **, and * indicate significance at the 1%, 5%, and 10% levels,
respectively.
Variables
Dependent variable: All-in-drawn spread added to LIBOR
Model (1) Model (2) Model (3) Model (4) Model (5) Model (6)
Panel A: Regression estimates of Loan Risk Premium with Number Concentration
Number
Concentration
�0.234** �0.156 �0.228** �0.252** �0.202* �0.197*
(�2.08) (�1.30) (�2.01) (�2.14) (�1.76) (�1.71)
Maturity 0.061 0.050 0.049 0.099** 0.053 0.062
(1.50) (1.16) (1.15) (2.33) (1.24) (1.42)
Loan Size �0.232*** �0.230*** �0.195*** �0.152*** �0.237*** �0.233***
(�9.10) (�8.81) (�7.80) (�5.96) (�8.94) (�8.99)
Covenant 0.189* 0.190* 0.220* 0.262** 0.225** 0.233**
(1.91) (1.74) (1.96) (2.41) (2.08) (2.14)
Collateral 0.399*** 0.367*** 0.391*** 0.339*** 0.362*** 0.356***
(4.15) (3.65) (3.84) (3.16) (3.52) (3.44)
Corporate Purpose �0.192** �0.213** �0.172** �0.151* �0.213** �0.196**
(�2.38) (�2.59) (�2.08) (�1.77) (�2.58) (�2.32)
Debt Repay �0.387*** �0.370*** �0.347*** �0.318*** �0.389*** �0.379***
(�4.55) (�4.30) (�3.96) (�3.57) (�4.55) (�4.36)
Corporate Control 0.294** 0.285* 0.357** 0.428*** 0.285* 0.307**
(2.07) (1.93) (2.39) (2.84) (1.94) (2.07)
Project Finance 0.042 0.108 �0.011 0.047 0.075 0.082
(0.11) (0.26) (�0.03) (0.15) (0.18) (0.20)
Manufacturing 0.033 0.073 0.081 0.130 0.064 0.073
(0.36) (0.81) (0.89) (1.45) (0.69) (0.79)
High-tech �0.046 0.010 �0.003 0.108 �0.027 �0.016
(�0.39) (0.09) (�0.03) (0.91) (�0.24) (�0.13)
Mining 0.192 0.175 0.189* 0.303*** 0.196 0.203*
(1.65) (1.48) (1.65) (2.64) (1.65) (1.68)
Services 0.067 0.095 0.103 0.217 0.075 0.081
(0.54) (0.73) (0.82) (1.63) (0.58) (0.61)
Firm Size �0.057*** �0.054*** �0.075*** �0.086*** �0.061*** �0.060***
(�3.02) (�2.76) (�4.21) (�4.60) (�3.17) (�3.10)
Leverage 1.002*** 1.128*** 1.155*** 1.319*** 1.096*** 1.108***
(3.96) (4.31) (4.49) (5.11) (4.27) (4.23)
ROA �1.690*** �1.500*** �1.847*** �2.076*** �1.581*** �1.453***
(�3.43) (�3.01) (�3.70) (�4.24) (�3.13) (�2.85)
Tangibility 0.248 0.204 0.220 0.287* 0.243 0.251
(1.61) (1.28) (1.44) (1.91) (1.55) (1.55)
S. C. Bae et al.
150 © 2014 Korean Securities Association

Table 8 (Continued)
Variables
Dependent variable: All-in-drawn spread added to LIBOR
Model (1) Model (2) Model (3) Model (4) Model (5) Model (6)
GDP Growth 0.147** 0.144** 0.133** 0.175*** 0.155***
(2.54) (2.54) (2.31) (2.88) (2.70)
OECD Dummy �0.493***
(�4.23)
Country Credit
Rating
�0.050***
(�5.78)
Global Crisis
Dummy
�0.074
(�0.71)
FX Volatility 0.000
(0.97)
Constant 6.336*** 6.433*** 6.806*** 6.887*** 6.386*** 6.266***
(19.26) (18.93) (19.90) (17.82) (18.51) (17.73)
Observations 1472 1348 1348 1345 1348 1340
R-squared 0.403 0.412 0.430 0.444 0.409 0.408
F-value 34.41*** 30.44*** 30.39*** 29.42*** 30.23*** 30.97***
Panel B: Regression estimates of Loan Risk Premium with Amount Concentration
Amount
Concentration
�0.332* �0.241 �0.277 �0.357** �0.244 �0.266
(�1.87) (�1.27) (�1.55) (�2.06) (�1.39) (�1.49)
Maturity �0.040 �0.093 �0.089 �0.051 �0.080 �0.061
(�0.54) (�1.15) (�1.12) (�0.67) (�1.02) (�0.76)
Loan Size �0.203*** �0.197*** �0.196*** �0.112** �0.209*** �0.194***
(�4.87) (�4.63) (�4.26) (�2.36) (�5.13) (�4.58)
Covenant 0.383** 0.467** 0.473** 0.472** 0.487*** 0.486**
(2.16) (2.50) (2.52) (2.58) (2.68) (2.60)
Collateral 0.295* 0.291* 0.295* 0.235 0.259 0.290
(1.74) (1.67) (1.68) (1.37) (1.50) (1.64)
Corporate Purpose �0.247* �0.260* �0.262* �0.217 �0.272* �0.271*
(�1.79) (�1.75) (�1.71) (�1.47) (�1.85) (�1.82)
Debt Repayment �0.340** �0.340** �0.342** �0.296* �0.306* �0.362**
(�2.39) (�2.18) (�2.17) (�1.87) (�1.97) (�2.31)
Corporate Control �0.135 �0.229 �0.227 �0.165 �0.188 �0.219
(�0.34) (�0.54) (�0.54) (�0.42) (�0.45) (�0.52)
Project Finance 0.021 0.101 �0.009 0.032 0.064 0.068
(0.09) (0.22) (�0.02) (0.11) (0.13) (0.12)
Manufacturing �0.012 0.072 0.063 0.101 0.078 0.059
(�0.09) (0.47) (0.41) (0.68) (0.51) (0.38)
High-tech 0.071 0.156 0.143 0.295 0.168 0.139
(0.32) (0.72) (0.65) (1.32) (0.75) (0.62)
Syndicate Structure and Loan Pricing
© 2014 Korean Securities Association 151
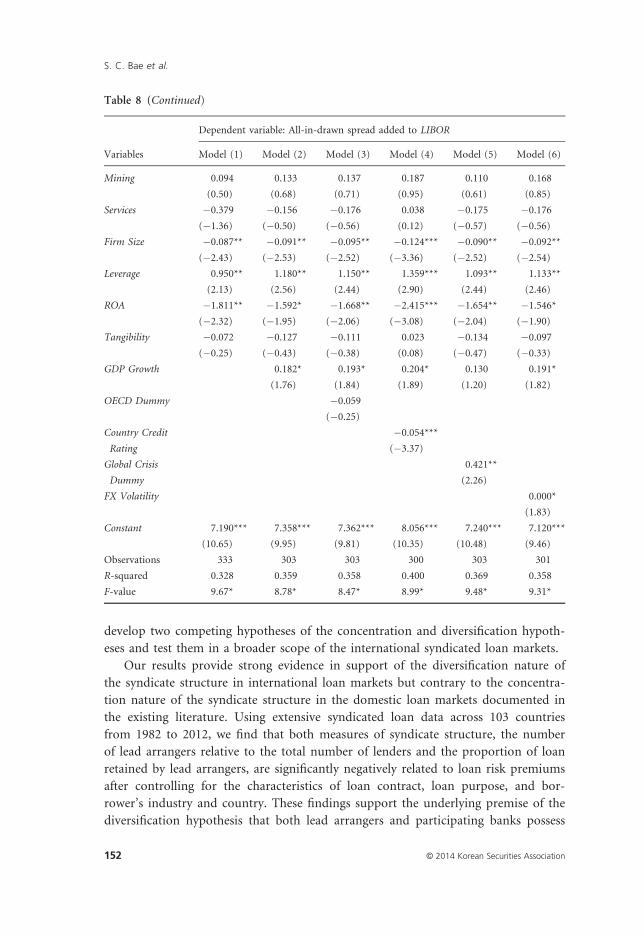
develop two competing hypotheses of the concentration and diversification hypoth-
eses and test them in a broader scope of the international syndicated loan markets.
Our results provide strong evidence in support of the diversification nature of
the syndicate structure in international loan markets but contrary to the concentra-
tion nature of the syndicate structure in the domestic loan markets documented in
the existing literature. Using extensive syndicated loan data across 103 countries
from 1982 to 2012, we find that both measures of syndicate structure, the number
of lead arrangers relative to the total number of lenders and the proportion of loan
retained by lead arrangers, are significantly negatively related to loan risk premiums
after controlling for the characteristics of loan contract, loan purpose, and bor-
rower’s industry and country. These findings support the underlying premise of the
diversification hypothesis that both lead arrangers and participating banks possess
Table 8 (Continued)
Variables
Dependent variable: All-in-drawn spread added to LIBOR
Model (1) Model (2) Model (3) Model (4) Model (5) Model (6)
Mining 0.094 0.133 0.137 0.187 0.110 0.168
(0.50) (0.68) (0.71) (0.95) (0.61) (0.85)
Services �0.379 �0.156 �0.176 0.038 �0.175 �0.176
(�1.36) (�0.50) (�0.56) (0.12) (�0.57) (�0.56)
Firm Size �0.087** �0.091** �0.095** �0.124*** �0.090** �0.092**
(�2.43) (�2.53) (�2.52) (�3.36) (�2.52) (�2.54)
Leverage 0.950** 1.180** 1.150** 1.359*** 1.093** 1.133**
(2.13) (2.56) (2.44) (2.90) (2.44) (2.46)
ROA �1.811** �1.592* �1.668** �2.415*** �1.654** �1.546*
(�2.32) (�1.95) (�2.06) (�3.08) (�2.04) (�1.90)
Tangibility �0.072 �0.127 �0.111 0.023 �0.134 �0.097
(�0.25) (�0.43) (�0.38) (0.08) (�0.47) (�0.33)
GDP Growth 0.182* 0.193* 0.204* 0.130 0.191*
(1.76) (1.84) (1.89) (1.20) (1.82)
OECD Dummy �0.059
(�0.25)
Country Credit
Rating
�0.054***
(�3.37)
Global Crisis
Dummy
0.421**
(2.26)
FX Volatility 0.000*
(1.83)
Constant 7.190*** 7.358*** 7.362*** 8.056*** 7.240*** 7.120***
(10.65) (9.95) (9.81) (10.35) (10.48) (9.46)
Observations 333 303 303 300 303 301
R-squared 0.328 0.359 0.358 0.400 0.369 0.358
F-value 9.67* 8.78* 8.47* 8.99* 9.48* 9.31*
S. C. Bae et al.
152 © 2014 Korean Securities Association

information through which they can assess the riskiness of the borrowing firm as
accurately as possible. Under informational frictions, as the riskiness of a borrowing
firm increases, the syndication structure becomes more diversified in a way that
lead arrangers and participating banks share the loan amounts and the associated
credit risk in syndication. Hence, the lead arrangers and participating banks collab-
oratively determine higher loan spreads to align higher compensation for participat-
ing banks’ active commitments and risk sharing in syndication.
References
Almeida, H., and M. Campello, 2007, Financial constraints, asset tangibility, and corporate
investment, Review of Financial Studies 20, pp. 1429–1460.
Altunbas, Y., and B. Gadanecz, 2003, Developing country economic structure and the pricing
of syndicated credits, BIS Working Papers No. 132.
Angbazo, L. A., J. Mei, and A. Saunders, 1998, Credit spreads in the market for highly
leveraged transactions loans, Journal of Banking and Finance 22, pp. 1249–1282.
Bae, K. H., and V. K. Goyal, 2009, Creditor rights, enforcement, and bank loans, Journal of
Finance 64, pp. 823–859.
Berger, A., and G. Udell, 1990, Collateral, loan quality, and bank risk, Journal of Monetary
Economics 25, pp. 21–42.
Berger, A. N., M. A. Espinosa-Vega, W. S. Frame, and N. H. Miller, 2011, Why do borrowers
pledge collateral? New empirical evidence on the role of asymmetric information, Journal
of Financial Intermediation 20, pp. 55–70.
Besanko, D., and A. Thakor, 1987, Collateral and rationing: Sorting equilibria in monopolistic
and competitive credit markets, International Economic Review 28, pp. 671–689.
Bolton, P., and D. Scharfstein, 1996, Optimal debt structure and the number of creditors,
Journal of Political Economy 104, pp. 1–25.
Cai, J., A. Saunders, and S. Steffen, 2010, Diversification or specialization? An analysis of
distance and collaboration in loan syndication networks, Working Paper. University of
Mannheim, Mannheim.
Champagne, C., and L. Kryzanowski, 2007, Are current syndicated allowances related to past
allowances? Journal of Banking and Finance 31, pp. 3145–3161.
De Haas, R., and N. Van Horen, 2010, The crisis as a wake-up call. Do banks increase
screening and monitoring during a financial crisis? EBRD Working Paper No. 117/DNB,
Working Paper No. 255, European Bank for Reconstruction and Development, London
and De Nederlandsche Bank, Amsterdam.
Dennis, S., and D. Mullineaux, 2000, Syndicated loans, Journal of Financial Intermediation 9,
pp. 404–426.
Dichev, I., 1998, Is the risk of bankruptcy a systematic risk? Journal of Finance 53, pp. 1131–
1147.
Djankov, S., C. McLeish, and A. Shleifer, 2007, Private credit in 129 countries, Journal of
Financial Economics 84, pp. 299–329.
Eichengreen, B., and A. Moody, 2003, Lending booms, reserves, and the sustainability of
short-term debt: Inferences from the pricing of syndicated bank loans, Journal of
Development Economics 63, pp. 5–44.
Syndicate Structure and Loan Pricing
© 2014 Korean Securities Association 153

Ferreira, M., and P. Matos, 2012, Universal banks and corporate control: Evidence from the
global syndicated loan market, Review of Financial Studies, 25, pp. 2703–2744.
Flannery, M., 1986, Asymmetric information and risky debt maturity choice, Journal of
Finance 41, pp. 19–37.
Focarelli, D., A. Pozzolo, and L. Casolaro, 2008, The pricing effect of certification on
syndicated loans, Journal of Monetary Economics 55, pp. 335–349.
Franc�ois, P., and F. Missonier-Piera, 2007, The agency structure of loan syndicates, Financial
Review 42, pp. 227–245.
Godlewski, C., 2007, The design of bank loan syndicates in emerging markets economies,
Working Paper, Laboratorie de Recherche en Gestion & Economie.
Godlewski, C., 2010, Banking environment and loan syndication structure: A cross-country
analysis, Applied Financial Economics 20, pp. 637–648.
Gorton, G., and G. Pennacchi, 1995, Banks and loan sales: marketing non-marketable assets,
Journal of Monetary Economics 35, pp. 389–411.
Guedes, J., and T. Opler, 1996, The determinants of the maturity of corporate debt issues,
Journal of Finance 51, pp. 1809–1833.
Holmstrom, B., 1979, Moral hazard and observability, Bell Journal of Economics 10, pp.
74–91.
Holmstrom, B., and J. Tirole, 1997, Financial intermediation, loanable funds, and the real
sector, Quarterly Journal of Economics 112, pp. 663–691.
Ivashina, V., 2009, Asymmetric information effects on loan spreads, Journal of Financial
Economics 92, pp. 300–319.
Ivashina, V., and D. Scharfstein, 2010, Bank lending during the financial crisis of 2008,
Journal of Financial Economics 97, pp. 319–338.
Jones, D., W. Lang, and P. Nigro, 2005, Agent behavior in bank loan syndications, Journal of
Financial Research 28, pp. 385–402.
Kleimeier, S., and W. L. Megginson, 2000, Are project finance loans different from other
syndicated credits?, Journal of Applied Corporate Finance 13, pp. 75–87.
La Porta, R., F. Lopez-de-Silanes, A. Shleifer, and R. Vishny, 1998, Law and finance, Journal
of Political Economy 106, pp. 1113–1155.
Lee, S., and D. Mullineaux, 2004, Monitoring, financial distress, and the structure of
commercial lending syndicates, Financial Management 33, pp. 107–130.
Leland, H., and H. Pyle, 1977, Informational asymmetries, financial structure, and financial
intermediation, Journal of Finance 32, pp. 371–387.
Lin, Chen, Y. Ma, P. Malatesta, and Y. Xuan, 2012, Corporate ownership structure and bank
loan syndicate structure, Journal Financial Economics 104, pp. 1–22.
Nini, G., 2004, The value of financial intermediaries: Empirical evidence from syndicated
loans to emerging market borrowers, International Finance Discussion Papers, Federal
Reserve Board.
Panyagometh, K., and G. Roberts, 2010, Do lead banks exploit syndicate participants?
Evidence from ex post risk, Financial Management 39, pp. 273–299.
Pennacchi, G., 1988, Loan sales and the cost of bank capital, Journal of Finance 43, pp.
375–396.
Pichler, P., and W. Wilhelm, 2001, A theory of the syndicate: Form follows function, Journal
of Finance 56, pp. 2237–2264.
S. C. Bae et al.
154 © 2014 Korean Securities Association

Qian, J., and P. Strahan, 2007, How laws and institutions shape financial contracts: The case
of bank loans, Journal of Finance 62, pp. 2803–2834.
Santos, J., 2011, Bank corporate loan pricing following the subprime crisis, Review of
Financial Studies 24, pp. 1916–1943.
Standard & Poor’s, 2011, A guide to the loan market (Sep) (Standard & Poor’s Financial
Services LLC., New York, NY).
Sufi, A., 2007, Information asymmetry and financing arrangements: Evidence from syndicated
loans, Journal of Finance 62, pp. 629–668.
Syndicate Structure and Loan Pricing
© 2014 Korean Securities Association 155