information to users umi - open...
TRANSCRIPT

Geomorphic response to late Quaternary tectonism: Coastalnorthern California, Mendocino triple junction region.
Item Type text; Dissertation-Reproduction (electronic)
Authors Merritts, Dorothy Jane.
Publisher The University of Arizona.
Rights Copyright © is held by the author. Digital access to this materialis made possible by the University Libraries, University of Arizona.Further transmission, reproduction or presentation (such aspublic display or performance) of protected items is prohibitedexcept with permission of the author.
Download date 07/06/2018 07:02:06
Link to Item http://hdl.handle.net/10150/184316

INFORMATION TO USERS
The most advanced technology has been used to photograph and reproduce this manuscript from the microfilm m.aster. UMI films the original text directly from the copy submitted. Thus, some dissertation copies are in typewriter face, while others may be from a computer printer.
In the unlikely event that the author did not send UMI a complete manuscript and there are missing pages, these will be noted. Also, if unauthorized copyrighted material had to be removed, a note will indicate the deletion.
Oversize materials (e.g., maps, drawings, charts) are reproduced by sectioning the original, beginning at the upper left-hand corner and continuing from left to right in equal sections with small overlaps. Each oversize page is available as one exposure on a standard 35 mm· slide or as a 17" x 23" black and white photographic print for an additional charge.
Photographs included in the original manuscript have been reproduced xerographically in this copy. 35 mm slides or 6" x 9" black and white photographic prints are available for any photographs or illustrations appearing in this copy for an additional charge. Contact UMI directly to order.
Accessing the World's Information since 1938
300 North Zeeb Road, Ann Arbor, M I 48106-1346 USA
.... __ .-._-- ._------------

_ ... _-- -.. _.,._----------------

Order Number 8809'112
Geomorphic response to late Quaternary tectonism: Coastal northern California, Mendocino triple junction region
Merritts, Dorothy Jane, Ph.D.
The University of Arizona, 1987
V·M·I 300 N. Zeeb Rd. Ann Arbor, MI 48106

-"- .. --- ... _------------_.-_._---

PLEASE NOTE:
In all cases this material has been filmed in the best possible way from the available copy. Problems encountered with this document have been identified here with a check mark-L.
1. Glossy photographs or pages v"
2. Colored illustrations, paper or print __ _
3. Photographs with dark background __
4. Illustrations are poor copy __ _
5. Pages with black marks, not original copy __
6. Print shows through as there is t~xt on both sides of page __ _
7. Indistinct, broken or small print on several pages __ _
8. Print exceeds margin requirements __
9. Tightly bound copy with print lost in spine __ _
10. Computer printout pElges with indistinct print __ _
11. Page(s) 45,49 ,.Iacking when material received, and not available from school or author.
12. Page(s) seem to be missing in numbering only as text follows.
13. Two pages numbered . Text follows.
14. Curling and wrinkled pages __
15. Dissertation contains pages with print at a slant, filrl1ed as received ___ _
16. Other ________________________________ ___
U·MI


GEOMORPHIC RESPONSE TO LATE QUATERNARY TECTONISM
COASTAL NORTHERN CALIFORNIA,
MENDOCINO TRIPLE JUNCTION REGION
by
Dorothy Jane Merritts
A Dissertation Submitted to the Faculty of the
DEPARTMENT OF GEOSCIENCES
In Partial Fulfillment of the Requirements For the Degree of
DOCTOR OF PHILOSOPHY
In the Graduate College
THE UNIVERSITY OF ARIZONA
1 987

THE UNIVERSITY OF ARIZONA GRADUATE COLLEGE
As members of the Final Examination Committee, we certify that we have read
the dissertation prepared by Dorothy J. Merritts
entitled Geomorphic Response to Late Quaternary Tectonism, Mendocino --~~~~------~------------~------~--------------------------
Triple Junction Region, Northern California
and recommend that it be accepted as fulfilling the dissertation requirement
for the Degree of Doctor of Philosophy in Geology
{ Date
Dat:.J~ ( , 81--Date l
Da~ .J-
Date J~ (:1/70
Final approval and acceptance of this dissertation is contingent upon the candidate's submission of the final copy of the dissertation to the Graduate College.
I hereby certify that I have read this dissertation prepared under my direction and recommend that it be accepted as fulfilling the dissertation requirement.
·1 7 ,~/tf97 Date

STATEMENT BY AUTHOR ,
This dissertation has been submitted in partial ~ul~illment o~ requirements for an advanced degree at The University of Arizona and is deposited in the University Library to be made available to borrowers under rules of the Library.
Brie~ quotations from this' dissertation are allowable without special permission, provided that accurate acknowledgment of source is made. Requests for per.ission for extended quotation from or reproduction of this manuscript in whole or in part may be granted by the head o~ the major department or the Dean o~ the Graduate College when in his or her judgment the proposed use of the material is in the interests of scholarship, In all other instances, however, permission must be obtained from the author.

PREFACE
The research presented here is far different than that found
in most dissertations, in that it represents a collaborative effort of
numerous scientists and students, and is an intertwining of three
projects. These projects are 1) documenting spatial and temporal
patterns of Quaternary uplift from analysis of emergent marine
terraces, 2) providing age constraint for marine terraces from the
establishment of a detailed soils chronosequence, and 3) determining
landscape response to variations in vertical deformation. Although the
writer is responsible for intertwining the multi-faceted approaches and
for writing the dissertation, the dissertation chapters are by no means
an individual effort.
Because of the interdisciplinary, collaborative nature of this
research, the structure of this dissertation is that of three research
projects. Each chapter consists of two parts: a summary prepared for
submittal to a scientific journal, and an appendix of chapter notes
that contain additional details about procedures, comments, and
ancillary discussions. Following an introduction to the text, Chapter
2 consists of the marine-terrace analysis; Chapter 3 consists of the
results of the soils chronosequence work; and Chapter 4 consists of the
analysis of fluvial response to tectonism. These journal articles,
presented here as chapters of a dissertation, have coauthors who
represent those scientists most closely involved with that particular
iii

iv
part of the research. The analysis of uplift rates estimated from
altitudinal spacings of emergent marine terraces was completed and will
be coauthored with the dissertation advisor, Dr. William B. Bull. The
soils chronosequence investigation was completed and will be coauthored
by the writer, and two others: Dr •. Oliver Chadwick (Ph.D., University
of Arizona) assisted in all soil site sele.ctions, descriptions, and
samplings; Dr. David Hendricks (professor, University of Arizona)
completed all laboratory analyses of the soil samples. Both Dr.
Chadwick and Dr. Hendricks assisted in interpretation of the results.
The analysis of geomorphic response to differential uplift is the
result of collaboration with another Ph.D. student in the Geosciences
Department, Kirk Vincent, and will be coauthored by him.
This structure is deemed most suitable to this dissertation not
only because it properly acknowledges the multi-faceted nature of the
research project, but also because it prevents unnecessary duplication
of presentation efforts. The chapters herein are in nearly final form
for journal submittal, and thus will not require tedious rewriting and
condensing of a larger manuscript. Furthermore, the results are
presented concisely, and additional information for understanding the
methods and results is presented as Appendices.

ACKNOWLEDGMENTS
The four primary collaborators in this project are the
coauthors listed above. Dr. William B. Bull, the dissertation advisor,
in addition to providing much advice and assistance in the marine
terrace analysis, has offered counsel and support for every aspect of
the dissertation project, from initial project and study area .
selection, to proposal-writing, data gathering, analysis, and
presentation of the results to the scientific community. The writer
wishes to express sincere thanks to Dr. Bull for his foresight,
attention to detail, and general expertise and wisdom characteristic of
an excellent advisor.
Dr. Oliver Chadwick and Dr. David Hendricks provided invaluable
support, and excellent professional wisdom, in their ability to see
beyond my own scope of the project--which was somewhat limited by
inexperience--and to generously offer their time and expertise to make
the soils chronosequence much more than a tool for the aims of this
research, and thus a substantial contribution to soil science and
geomorphology. The input of the fourth coauthor, Kirk Vincent, has
been exceptional. He has provided a tremendous amount of creative
ideas, or working hypotheses, with unique means of testing these
hypotheses. His efforts are appreciated mostly in the sense that he
has given generously of his own original ideas to promote scientific
understanding of landscape evolution and geomorphic response to
v
~- --~------~---

tectonism, and thus has made this research an example of truly open
scientific communication and exchange of ideas.
The advice of all members of the dissertation committee,
including Dr. Vic Baker, Dr. David Hendricks, Dr. Peter Coney, Dr.
George Davis, and Dr. Terry Wallace, is appreciated. Additional
advisory support was provided by Dr. John C. Tinsley of the u.s.
Geological Survey, who also gave generous input of his time and
expertise during all stages of the research. His efforts on behalf of
the writer to obtain funding and plan the fieldwork are especially
appreciated.
vi
Numerous people have provided additional help in developing
ideas, completing field and labwork, and analyzing and interpreting the
results. These are Ellen Wohl, Spence Smith, Phil Pearthree, Eric
Seksinsky, Dr. Daniel Yaalon, Dr. Randall Suthard, Julia Fonseca, Jim
O'Connor, Mary Ann McKittrick, Karen Demsey, Suzanne Fouty, Suzanne
Hecker, Keith Katzer, Steve Slaff, Esmeralda and Daniel Manandise,
David Steiner, Peter Kneupfer, and Kevin O'Day. The assistance of many
Humboldt professors and students, especially that of Dr. Raymond Burke
and Dr. Gary Carver, has added much to the quality of this project.
The advice of Dr. Harvey Kelsey, Western Washington Universitiy, has
aided the writer in identifying the most significant elements of the
data and results.
Many agencies provided financial, technical, and logistical
support. The writer gratefully acknowledges the financial assistance
of the National Science Foundation (Doctoral Dissertation Improvement
Grant' EAR-8405360), the U. S. Geological Survey (Graduate Intern
--------------------------------------------

vii
Program), the Geological Society of America (Robert K. Fahnestock
award), Sigma Xi (field-support grant), and the University of ArizoDa
Graduate College. Technical and logistical support was provided by the
U. S. Geological Survey and the Bureau of Land Management (DIM).
Drafting by Bruce Rogers, U. S. G. S., is especially appreciated.
Advice and support from Bruce DawsoD and other staff members of the BLM
were very useful. Carl Rittimann and Qther members of the Soil
Conservation Service staff at Fort Bragg, California, were especially
helpful with soil site selections and descriptions in the Mendocino
Fort Bragg area, and provided soil descriptions for several sites.
Dr. William Dietrich has given much support of a stimulating
and inquisitive nature. His assistance in presenting this work to the
geomorphic community at the Berkeley Gilbert Club meeting, December,
1986, was invaluable to my perceptions of geomorphic response to
tectonism. Attendees at the Gilbert Club meeting also assisted in
interpreting the results of the landscape analysis.
The support of Dr. Robert McLaughlin and Dr. Steve Ellen CU. S.
Geological Survey) has been invaluable. Dr. McLaughlin and Dr. Ellen
were instrumental in evaluating the initial premise of constant
lithologic conditions.

TABLE OF CONTENTS
LIST OF ILLUSTRATIONS
LIST OF TABLES
ABSTRACT ••• . . . . 1. INTRODUCTION
2. VARIATIONS IN QUA.TERNARY UPLIFT RATES WITH PASSAGE OF THE MENDOCINO TRIPLE JUNCTION •
Introduction • • • • • • • • • • • • • • Purpose • • • • • • • • .. .. .. .. .. .. Scope of the Paper • • . • • • • • Physiographic and Climatic Setting Seismotectonic and Geologic Setting
Uplift Rates Detet~ined from Emergent Marine Terraces .. .. .. .. .. .. .. . . . .. .. .. .. .. .. .. . .. ..
Altitudes of Formation of Marine Terraces. Uplift Rates in Northern California • • • • •
Previously Published Uplift Rates • • Inferred Uplift Rates from Undated Terraces
in Northern California • • • • • • • • Altitudinal Spacing Analysis • • • •
Discussion of Inferred Uplift Rates • • • • • • Comparison with Independent Age Control. • Geomorphic Bvidence for Variations in
Uplift Rates • • • • • • • • • • • • • • • Cross-checks Between Sites • • •
Mechanisms for Late Quaternary Uplift • Conclusions .. .. .. .. .. .. .. .. .. .. .. .. .. ..
2. SOILS CHRONOSEQUENCE ON UPLIFTED MARINE TERRACES NORTHERN CALIFORNIA • • • •
Introduction • • • • • Scope • • • • • • Site Physiography
viii
- ---------------------------
Page
xi
xv
xvii
I
5
5 7 8 8
10
13 14 15 15
18 20 46 47
50 50 53 57
60
60 64 65

TABLE OF CONTENTS--Continued
Climate • • • • • • • • • • Present Climate • • • • • • • • • • Pleistocene Climates • • •
Parent Material • • • • • • • • • • • Marine Terrace Platform and Soil Parent
Material Ages • • • • Vegetation • • • • • • • • • •
Investigative Approach •••• Soil Site Selections and Methods
Site Selections •••••••••••••• Descriptions of Soil Properties • • • • • • • •
Changes of Soil Characteristics with Depth • • . • • • • • • • • • • •
Soil Development and Time • • • • • • • • Time Related Properties • • • • • • •
Comparison of Cape Mendocino Chronosequence with Mendocino-Westport Soils Terrace Ages • • • • • • • • Vegetation • • • • • • • • • Site Selection • • . • • • • • • ••• Discussion of Fort Bragg Soil Properties
Comparison with Soils North of Cape Mendocino Conclusions . . . . . . . . . . . . . . . .
4. GEOMORPHIC RESPONSE TO LOW, INTERMEDIATE, AND HIGH
Page
65 65 69 69
70 72 72 74 74 75
78 B7 B7
91 94 94 95 102 107 108
RATES OF UPLIFT ••••••• •••• • 109
Introduction • • • • • • • • • • • 109 Objectives and Approach • • • 110 Scope of the Paper • • • • • •• 112
Background Information •••• • • • • • 113 Physiographic Setting • • • • • • • 113 Climatic Setting • • • • 116
Present Climate • • • • • 116 Pleistocene Climates • • • • • • • • • 118
Late Quaternary Uplift and Seismotectonic Setting • • • • • • • • • • • • • • 118 Plate Boundary Configurations • • • • 118 San Andreas Fault • • • • • • • 119 Spatial Variations in Quaternary
Uplift Rates • • • • • • • • 120 Temporal Variations in Quaternary
Uplift Rates • • • • • • • • • 123
--------------------------------
ix

TABLB OF CONTBNTS--Continued
Geologic Setting and Rock Resistance 0 0 0 0
Tectonostratigraphic Units 0 0 0 0
Rock Res is tance • 0 0 0 0 0 0 0 0 0 0 0
Determining Rock Mass Strength Rock-mass Brodibility 0 0 '0 • 0
Conceptual Reference Frames and Equilibrium Equilibrium . . . . . . . . . . . . . . .
Drainage Basin Geomorphology 0 0 0 0 0 0 0 0
The Matto1e River 0 0 • • • • • • • 0 0
Second and Third Order Coastal Drainage Basins . . . . . . . . . . . . . . . .
Network Ordering and Delimitation Measurement Methods 0 0 0 0 • 0
Analysis of Coastal Drainage Basin Morphometries • • • • • • • • Dimensional Analysis and Geometrical
Similari ty • • • • • 0 0 0 • • 0 0 0
Spatial Trends in Planimetric Morpho-logical Properties • • • 0 • 0 0 0
Spatial Trends in Channel Slopes Discussion of Morphological Analyses • 0 • •
Gradient Analysis and Time 0 0 0 0 0 0
Analysis of Tectonic Tilt • The Models 0 • • • • •
Discussion of Tilt Analysis • 0 0
Tilt Analysis and Geomorphic Processes • • 0 • • 0 0 •
Stream Gradient Index 0.... 0 0 0
Methods 0 0 0
Conclusions
APPENDIX A: Tectonic Setting (For Chapter 2) • • •
APPENDIX B: Soil Morphological Data (For Chapter 3)
APPENDIX C: Semi-logarithmic Stream Profiles with SL-Indices . • 0 •
REFERENCBS CITED . . . . . . . .
Page
123 123 125 126 127 128 129 130 130
132 133 135
139
139
144 147 149 151 153 153 160
161 162 163 167
171
174
178
181
--- ~ ~-~-- -~ ~ .
x

LIST OF ILLUSTRATIONS
Figure Page
2.1. Location map, tectonic setting, and published rates of uplift of the Mendocino triple junction (MTJ) region, coastal northern California.
2.2 Geologic setting of coastal northern California and locations of flights of marine terrace-remnants.
2.3. Aerial view of southern drainage. divide with marine terrace-remnants, Randall Creek.
2.4. Alternative inferred uplift rate diagrams derived from four different scenarios (a-d) of possible age assignments for terrace-remnants at Randall Creek.
2.5. Aerial view southeastward of Cabrillo Point.
2.6. Aerial view eastward of marine terrace flight surveyed at Bruhel Point.
2.7. Alternative inferred uplift rate diagrams derived from four different scenarios (a-d) of possib1e·age assignments for terrace-remnants at Bruhel Point.
2.8. Glacio-eustatic sea-level fluctuation curve for the past 350 ka, and topographic profile of emergent marine strandlines that would result from 0.3 mlka uniform uplift.
2.9. Alternative inferred uplift rate diagrams derived from two scenarios (a-b) of possible age assignments from complete flight of terrace-remnants at Randall Creek.
2.10. Aerial view eastward of terrace flight surveyed at Smith Gulch.
2.11. Topographic profile of terrace flight surveyed with electronic distance meter at Smith Gulch.
2.12. Inferred uplift rate diagram for Smith Gulch site, showing change in uplift rates at about 120 ka.
xi
6
9
22
24
28
29
31
33
36
39
40

xii
LIST OF ILLUSTRATIONS-Continued
Figure Page
2.13. Composite view of inferred uplift rate diagrams for eight 44 coastal transects.
2.14. Latest Pleistocene uplift rates plotted along a N300W 48 transect from near Fort Bragg (~120 km) to Cape Mendocino (2 km).
2.15. Pattern of deformation of marine terraces along a N300W 52 coastal transect from Cabrillo Point (-130 km) to Cape Mendocino (2 km) ••
3.1. Location map of coastal northern California, showing key 61 study areas.
3.2. Topography, terrace flights, and soil sites for key study 62 areas.
3.3. Aerial view eastward of Punta Gorda Coast. 67
3.4. Clay content with depth, Cape Mendocino-Punta Gorda soils. 79
3.5. Fed content with depth, Cape Mendocino-Punta Gorda soils. 80
3.6. Feo content with depth, Cape Mendocino-Punta Gorda soils. 81
3.7. AId content with depth, Cape Mendocino-Punta Gorda soils. 82
3.8. Ale content with depth, Cape Mendocino-Punta Gorda soils. 83
3.9. Organic carbon content with depth, Cape Mendocino-Punta 84 Gorda soils.
3.10. Trends in A-horizon properties with time for Cape Mendocino-Punta Gorda soils.
3.11. Trends in B-horizon properties with time for Cape Mendocino-Punta Gorda soils.
3.12. Total accumulated weight of clay with time for Cape Mendocino-Punta Gorda soils.
3.13. Clay content with depth, Mendocino-Westport soils.
------ -----------------------------------------------------------------
90
92
93
101

xiii
LIST OF ILLUSTRATIONS-oontinued
Figure Page
3.14. Fed content with depth, Mendocino-Westport soils. lOY.
3.15. Plots of maximum percentages of clay for soils at Cape 105 Mendocino-Punta Gorda, Mendocino-Westport, and Eureka (from Burke et al., 1986), and maximum percentages of Fed for soils at Cape Mendocino-Punta Gorda and Mendocino-Westport. '
3.16. Trend in maximum B-horizon thickness with time for Cape 106 Mendocino and Mendocino-Westport soils.
4.1. Location map, tectonic setting, and published rates of III uplift of the Mendocino triple junction (MTJ) region, coastal northern California.
4.2. Physiographic and geologic setting of coastal northern 114 California and locations of flights of marine terraceremnants used to determine inferred rates of uplift.
4.3. Offset strip map of major drainage basins along coastal 115 northern California.
4.4. Latest Pleistocene uplift rates plotted along a N300W 122 transect from near Fort Bragg (-120 km) to Cape Mendocino (-2 km).
4.5. Strath surfaces surveyed at 13 sites between Honeydew (48 131 km) and the river mouth (0 km).
4.6. Planimetric view of Big Flat Creek drainage network, and 134 two methods of designating stream orders.
4.7. Principles of dimensional analysis and geometrical l40 similarity (modified from Strahler, 1957).
4.8. Drainage density of first and second order subbasins for l45 each major coastal drainage basin, along a N300W transect from Fort Bragg (-120 km) to Cape Mendocino (",2 km).
4.9. Relation between first order subbasin drainage density and 146 maxtmu. drainage basin relief.

xiv
LIST OF ILLUSTRATIONS-Continued
Figure Page
4.10. Variations in mean values of first, second, and third order 148 channel slopes for each coastal drainage basin, plotted along a N300W coastal transect.
4.11. Incision analysis. 152
4.12. Schematic diagram of valley side tilt analysis. 155
4.13. Tilt analysis for first order channel slopes. 158
4.14. Three representative semi logarithmic stream profiles for 165 low- (DeHaven), intermediate- (Telegraph), and high-uplift (Fourmile) drainage basins.
B-1. Clay content with depth, Mendocino soils. 175
B-2. Fed content with depth, Mendocino soils. 176
C-l. Semi-logarithmic stream profiles, with SL-indices, for ten 179 3rd order coastal streams.

Table
2.1
LIST OF TABLES
Summary of published radiocarbon dates and uplift rates for late Quaternary marine terraces in the Cape Mendocino region.
Page
17
2.2. Altitudes and inferred uplift of terrace-remnants for four 25 correlations, a-d, for Randall Creek.
2.3. Altitudes and inferred uplift of each terrace for four 30 correlations, a-d, for Bruhel Point.
2.4. Altitudes and inferred uplift of complete flight of 37 terrace-remnants for Randall Creek.
2.5. Surveyed altitudes and inferred amounts of uplift for nine 43 coastal transects from Fort Bragg (Cabrillo Point) to Bear River.
3.1. General description of soil site characteristics for Cape 66 Mendocino-Punta Gorda and Mendocino-Westport soi!s •
. \'
3.2. Field descriptions of Cape Mendocino-Punta Gorda soil 76 properties.
3.3. Summary of laboratory properties of Cape Mendocino-Punta 77 Gorda soil properties.
3.4. Summary of soil properties that vary with time, Cape 88 Mendocino-Punta Gorda and Westport-Mendocino soils.
3.5. Field descriptions of Mendocino-Westport soil properties. 97
3.6. Summary of laboratory properties of Mendocino-Westport 99 soils.
4.1. Morphometric properties of coastal drainage basins, with 136 analysis of geometrical similarity.
4.2. Summary of channel slope data for coastal drainage basins. 138
4.3. Comparisons of three streams-for areas of low, intermediate, and high uplift-for geometrical similarity.
xv
142

xvi
LIST OF TABLES-Continued
Table Page
8-1. Complete sunanary of laboratory properties of Cape Mendocino- 177 Punta Gorda soils.

xvii
ABSTRACT
Different patterns of uniform-uplift periods associated with
passage of the Mendocino triple junction (MTJ) and a change in tectonic
regime are based on altudinal spacing analyses of nine flights of
marine terraces. Rates of uplift appear to increase from <1 m/ka to 4-
5 m/ka, with periods of most rapid upllft that are progressively
younger toward the triple junction. The MTJ was about 55 Ian to the
south at about 1 ma ago, where uplift has been uniform at about 1.3
m/ka during the last 300 ka. Maximum uplift of about 4 m/ka is
occurring 20-40 km south of the MTJ; prior to about 100-150 ka uplift
was slow, being only 0.2-0.5 m/ka. Ten km to the north of the MTJ,
accelerated uplift has occurred only during the last 60 ka.
Relative strength of soil development in sandy marine deposits
on five Pleistocene and Holocene (1.7 to 120 ka) marine terraces near
the MTJ is one basis for relative age estimates and correlation of
terrace soils. Organic carbon content in the upper 70 em of the soil
profile increases exponentially, and pH decreases exponentially; for
both properties steady state is attained by 40 ka. Whole profile
content of clay, total free iron oxyhydroxides (F~), and total free
and para-crystalline aluminum oxyhydroxides increase nearly linearly
until at least 120 ka. Comparison of these soils with four marine
terrace soils (103-405 ka) 100-120 km to the south indicates that
maximum percent values of clay and Fed increase exponentially, with xvii
---------1---i

xviii
highest values reached at about 120 ka.
Analysis of three-dimensional morphological properties of 25
coastal drainage basins that have evolved in areas of low «1 m/ka) ,
intermediate (1-3 m/ka), and high (>3 m/ka) rates of uplift near the
MTJ identified channel slopes as the best indicator of tectonism in the
landscape. Lower order tributaries reflect tectonically-controlled
differences best. The largest streams examined, of third order, are \
able to adjust to most base-level change and maintain their profile
form, whereas lower order streams farther upstream tend to accumulate
the effects of net base-level fall, and have steepest profiles in the
areas of highest uplift. Although first order streams are excellent
indicators of highest uplift rate areas and regional differential
tilting, they are less useful in distinguishing between low and
intermediate uplift rate areas. Analysis of the longitudinal profile
of the main trunk stream of 10 of the 25 drainage basins with the
stream-gradient index (Hack, 1957) was useful to broadly categorize
uplift rates, and to distinguish between low and intermediate uplift
rate streams.

CHAPTER I
INTRODUCTION
The northward migration of the Mendocino triple junction (MTJ),
northern California, provides an opportunity to examine uplift and
erosion of coastal mountains that have been subjected to accelerating
and then decelerating uplift rates. The selected study area (Fig. 2.1)
is a coastal section about 120 Ian long and 8 km wide, between Cape
Mendocino and Fort Bragg, in the vicinity of the MTJ. This area is
suitable for studying geomorphic response to varying uplift rates,
because climatic conditions and lithology (resistance to erosive
processes) are fairly constant, while rates of uplift, determined from
emergent marine terraces, span an order of magnitude--from 0.3 mlka (ka
= 1000 years before present; ky = 1000 years) 120 Ian south of the MTJ
at Fort Bragg, to 4 mlka near the MTJ (Kennedy, Lajoie, and Webmiller,
1982; Lajoie, Sarna-Wojcicki, and Ota, 1982; McLaughlin et al., 1983a).
The aims of this study are to define empirically the connection
between known intensities of uplift and resultant morphological
features of the landscape, and then to develop hypotheses that relate
landforms to crustal movements. Specific objectives are 1) to identify
the drainage basin morphologies that accompany different rates of
uplift,. 2) to identify the best indicators of tectonism in the
landscape, and 3) to quantify the interplay between processes of
upheaval and downcutting. The results of this research are especially
1

useful to geomorphological studies in areas of low or intermediate
uplift, where evidence of tectonic activity may be subtle. Because
none of the more commonly used features in tectonic applications of
geomorphology--such as fault scarps or fault-bounded mountain fronts-
are present in the field area, new tools were develo'ped, and tools used
in other geomorphic applications were modified and applied to tectonic
problems.
To achieve these goals and objectives, a database regarding
rock resistances, climatic conditions, and spatial and temporal
variations in Quaternary uplift rates for coastal northern California
is r.ritical. Much of this information was previously known, and
provided the basis for initial site selection. Lithologic and rock
resistance information were available from geologic mapping by Beutner
et a1. (1980) and Blake, J'ayko, and McLaughlin (1985), and from
geomorphic mapping of hillslope fora by Ellen (unpub. map; pers. comm.,
1986). Local climatological data were available from four climatic
stations that fringe the study area (National Oceanic and Atmospheric
Administration, National Climatic Data Center, local climatological
data summaries). Spatial variations in Quaternary uplift rates had
been identified previously from studies of dated Holocene and late
Pleistocene marine terraces, and ranged frOJB 0.3 mlka near Fort Bragg
(Kennedy et aI., 1982; Lajoie, unpub1. data, 1981, as cited by
McLaughlin et al., 1983a) , to at least I mlka 70 ka south of the triple
junction (Hagemann, 1982; McLaughlin et aI., 1983a) t to 4 mlka 40 kill
south of the MTJ at Big Flat, and to 2.8 mlka at the MTJ' (Lajoie et
a!., 1982).
2

Spatial and temporal variations in Quaternary uplift rates
appear to be related to migration of the MTJ. The triple junction is
the boundary between the North American, Pacific, and Gorda plates
(Fig. 2.1). It formed about 29 million years ago when part of the
ancestral spreading center of the Farallon (present-day Gorda) plate
was subducted beneath the North American plate, causing the North
American and Pacific plates to converge (Atwater, 1970; Dickinson and
Snyder, 1979b). Subduction of the Gorda plate has continued north of
the triple junction, while south of it right-lateral shear between the
Pacific and North American plates has developed into the San Andreas
transform boundary. As the Gorda plate moves northeastward relative to
the North American plate and is consumed, the length of the San Andreas
fault system increases and the position of the MTJ migrates northward
at the same rate as relative movement between the North American and
Pacific plates (-5.6 cm/yr).
Additional information regarding patterns of uplift was
obtained in this study from an analysis of altitudinal spacing of
flights of local marine-terrace remnants at numerous sites along the
coast between Fort Bragg and the MTJ, including some of the same sites
where terraces had been dated by previous workers. Estimated ages and
inferred uplift rates of these local terraces were obtained by
correlating the largely undated local t~rrace sequences with flights of
global marine terraces that have been dated elsewhere (methodology of
Bull and Cooper, 1986; Bull, 1985; sea-level fluctuation chronology of
Chappell, 1983). This analysis indicated that uplift rates estimated
from both altitudinal spacings of terraces and from previously dated
3

4
terraces define a distinct pattern of spatial variations in late
Quaternary «30 ka) uplift that resembles a broad asymmetric anticline.
The pattern of spatial variations of. uplift rates during the last 30 ka
is the basis for comparisons of geometric properties between drainage
basins presumed to have different rates of uplift.
Analysis of soil development in marine and eolian parent
material on a flight of marine terraces at the triple junction provides
a means of testing the consistency of other methods of estimating
terrace ages. Five soil sites for gently sloping marine terraces that
range in age from 1.7 ka (radiometric date of Lajoie, unpub. data) to
120-133 ka (estimated age from altitudinal spacing analysis of marine
terrace remnants) were described and sampled. Extensive laboratory
analysis of many properties, but primarily clay, iron and aluminum
oxides, pH, and organic carbon, indicate progressively stronger soil
development with increasing altitude, and similar degrees of soil
development on terraces estimated to be between 94 and 120-133 ka at
both Fort Bragg and Cape Mendocino.
-----~--- ------------------------------------~-

CHAPTER 2
VARIATIONS IN QUATERNARY UPLIFT RATES WITH PASSAGE OF THE MENDOCINO TRIPLE JUNCTION
Introduction
Some of the highest rates of uplift in the conterminus United
States during Holocene time are on the.w~stern margin of the North
American plate, along the strike-slip San Andreas transform boundary.
High rates of uplift are local" and anomalous, as typical rates along
most of the boundary are low, about 0.'3 mlka (l ka = one thousand years
before present; 1 ky = one thousand years) (Ku, T-L., and Kern, J.P.,
1974; Lajoie, 1986; Lajoie et aI, 1979a; Lajoie et aI, 1979b; MUhs,
1985). Where the San Andreas transform bends, conditions for local
instability and deformation are created. Such bending occurs in the
Transverse Ranges near Ventura, where rates of uplift determined from
raised marine terraces may be as high as 6.7 mlka during Holocene time
(Lajoie, Sarna-Wojcicki, and Ota, 1982), and as high as 10 mlka during
the past 40-60 ka (Lajoie and Sarna-Wojcicki, 1982).
The San Andreas transform makes another leftward bend at its
northern termination, the Mendocino triple junction (MTJ; Fig. 2.1).
Rates of uplift determined from studies of raised Holocene and late
Pleistocene marine terraces in this area span an order of magnitude,
from 0.3 mlka near Fort Bragg (Kennedy, Lajoie, and Wehmiller, 1982;
Lajoie, unpub. data, 1981, as cited by McLaughlin et a1., 1983a), to at
5

• ... .. o
"
~ t
~\ > t
.t ~~ t:=1\ ~ \
MendOcinO\:Xj 1
~ Cd
100km 'a
Shelter Cove (1.0 m/ka)
~
360~~~ __________________ ~ ______________________ ~~ 360
128 0 1240
Figure 2.1. Location map, tectonic setting, and published rates of uplift of the Mendocino triple junction (MTJ) region. The MTJ, shown in hachures, marks the juncture of the North American, Pacific, and Gorda plates.
6

least 1 m/ka farther north at Whale Gulch (Hagemann, 1982) and Shelter
Cove (Point Delgada) (McLaughlin et al., 1983a), to 4 m/ka just south
of the triple junction at Big Flat, and to 2.8 m/ka at the triple
junction at Cape Mendocino (Lajoie, Sarna-Wojcicki, and Ota, 1982).
Age control provided by marine-terrace time lines along the coastline
from Fort Bragg to Cape Mendocino provides an opportunity to assess
spatial and temporal variations in late Quaternary uplift rates that
have occurred as a result of migration of the MTJ.
Purpose
The primary goal of this paper is to infer the spatial and
temporal variations of uplift of the northern California coast between
Fort Bragg and Cape Mendocino. Previous rates of uplift for this
region were estimated from dating the lowest and youngest terraces;
however, one of the longer term ways of estimating uplift rates is
through studies of the numerous marine-terrace remnants that span
altitudes from near sea level to more than 600 m along many parts of
the coastline. Our principal method of estimating ages of marine
terraces centers about their distinctive spacing of inner-edge
altitudes in order to correlate thea to flights of global marine
terraces that have been dated elsewhere (methodology of Bull, 1985, and
Bull and Cooper 1986). These longer-term rates of uplift during the
last 340 ka are then compared with uplift rates based on radiometric
and amino-acid racemization age control for. terraces younger than 100
ka, for the same flights of terraces. Chronosequences of soils formed
on the marine terraces provide an additional element of internal
consistency, because systematic changes in soil characteristics occur
7
-------.--------------------------------------------------------------------------------

with increasing height above the sea, and terraces estimated to be of
similar ages at Fort Bragg and Cape Mendocino have similar strengths of
soil development (Merritts, Chadwick, and Hendricks, in preparation;
Chapter 3 of dissertation). All of the three above lines of evidence
are internally consistent within the study region, and suggest that low
uplift rates underwent a temporary acceleration with the passage of the
triple junction. This tectonic analysis lays the groundwork for a
corollary paper on geomorphic response, via drainage basin evolution
and channel adjustment, to different rates of uplift (Merritts and
Vincent, in preparation; Chapter 4 of dissertation).
Scope of the Paper
Before discussing the methodology and results of the marine
terrace altitudinal spacing analyses, the tectonic and structural
history of the MTJ region--known from studies in geophysics and
structural geology--is introduced. Then, sequences of marine-terrace
altitudes and assigned ages at different transects along the coast, and
the temporal and spatial patterns of inferred uplift rates are
discussed. These results are compared to independent estimates of
variable uplift rates. Finally, the variations in uplift rates will be
considered in relation to several tectonic models that have previously
been used to interpret deformation in this region.
Physiographic and Climatic Setting
The selected study area encompasses 120 km of the rugged
Coastal Ranges between Fort Bragg and Cape Mendocino (Fig. 2.2).
Parallel mountain ranges and major river valleys oriented north-
----------------------------------------------------------------------------
8

40" 30'
40" 00'
39° 30'
1248 30'
King Range Terrane
o ~~~~~~
':.':.-- ShaarZon. -;r4<-•• '" Ancestral MattoJe
JI(" Fold Axis
124° 30'
124° 00' 1238 3~'
40° 30' ..,,0 ==-===o:d'OM.
o '0 K .. -
40° 00'
39° 30'
.® 124° 00' 123° 30'
Figure 2.2. Geologic setting of coastal northern California and locations of flights of marine terrace-remnants. structural geology and boundary of the King Range terrane modified from Beutner et al. (1980). Prior locations of the MTJ are indicated at 1 ma and 2 ma, Site locations are Al)Cabrillo Point, A2)Bruhel Point, B)Kaluna Cliff, C)Randall Creek, D)Smith Gulch, B)McNutt Gulch, F)Singley Flat, G)Cape Ranch, and H)Bear River.
9

10
west-southeast follow the trend of the coastline. The inland boundary
of the narrow study area is the first drainage divide between streams
flowing west-southwest to the Pacific Ocean, and tributaries flowing
inland to larger river systems that flow along the major
northwest-trending valleys. Maximum relief along this divide increases
from 300 m near Fort Bragg to 1246 m in the central part of the King
Range, a prom~nent 60 km long range within the study area, and then
declines to altitudes of 250 m near the Bear River in the northern end
of the study area. A narrow continental shelf drops quickly to 200 m
below sea level within 6 to 13 km of the shoreline.
Climatic characteristics are stabilized by maritime influences,
and are typical of a Mediterranean climate. Most precipitation occurs
as rain during mild winters; summers are cool, foggy, and dry. Mean
annual precipitations are 165 em at Shelter Cove, 102 em at Fort Bragg,
and 100 em at Eureka (National Oceanic and Atmospheric Administration,
National Climatic Data Center, local climatological data summaries).
Temperatures vary little throughout the year; mean annual temperatures
are l20 C at Fort Bragg, l80C at Shelter Cove, and l40 C at Eureka.
Seismotectonic and Geologic Setting
The MTJ joins the North American, Pacific, and Gorda plates
(Fig. 2.1). It formed about 29 million years ago after part of the
ancestral spreading center of the Farallon (present-day Gorda) plate
was sub.ducted beneath the American plate, and the North American and
Pacific plates converged (Atwater, 1970; Dickinson and Snyder, 1979b).
Subduction of the Gorda plate has continued north of the triple
junction, while south of it right-lateral shear between the Pacific and

11
North American plates developed into the San Andreas transform
boundaryl. As the Gorda plate moves northeastward relative to the
North American plate and is consumed, the length of the San Andreas
fault system increases and the position of the MTJ migrates northward
(Atwater, 1970).
The entire region examined in this study is astride the San
Andreas transform boundary and the main trace of the San Andreas fault
(Fig. 2.2), which play key roles in interpreting rates and styles of
deformation in the region. However, despite some structural evidence
of Neogene right-lateral strain along the coast (Beutner and Hansen,
1975b), the location of the main branch of the present San Andreas
fault between Shelter Cove and Cape Mendocino is uncertain, and no
Quaternary surface ruptures are documented. Historically, the northern
termination of the San Andreas fault (north of Point Arena) has been
seismically quiet, and clearly active fault zones can not be delineated
from seismicity patterns (see Appendix A, Notes I and 2).
Several models of lithospheric adjustment to the change in
plate configuration associated with MTJ migration have been proposed
(see Appendix A, Note 3). Our data for late Quaternary uplift rates
are evaluated in terms of these models at the end of this article. At
a northward migration rate of 5.6 cm/yr, the position of the triple
junction has been within the 120 km study area during the past 2 mao
1 The San Andreas transform boundary is a plate boundary, and is distinguished from the San Andreas fault, which is a discrete fault within the system of subparallel faults that comprise the San Andreas transform boundary.

12
The location of the subducted south-facing Mendocino fracture zone
escarpment, at a depth of 8 km beneath Cape Mendocino, can be drawn
from aeromagnetic data (Griscom, 1980) and the position of deep seismic
focal mechanisms in the upper Gorda plate beneath the continent (Smith
and Knapp, 1980). The seismic data indicate a shallow-dipping (about
150 ) Benioff zone that increases in depth to 30 km at a distance of 50
km inland. Glazner and Schubert (1985) have modeled isostatic
adjustments of the overlying North American lithosphere to the 1.2-km
high escarpment, and determined that it might respond by flexural tilt,
with a slope of 0.50 to the north over a 70 to 120 km north-south
distance. In addition, south of the subducted Mendocino fracture zone,
the North American plate is sliding off relatively young, warm oceanic
crust and onto much hotter, less dense asthenospheric material associ
ated with the "slab window" created during extension of the San Andreas
transform boundary (Dickinson and Snyder, 1979a; Furlong, 1984).
Furlong (1984) has modeled mechanical vertical response of the
overlying lithosphere to such a change in thermal and density regimes.
Kelsey and Carver (manuscript in preparation) and Kelsey and
Cashman (1984) describe structural evidence between Fort Bragg and
Oregon for the timing of deformational events related to migration of
the MTJ. Their detailed analyses of faults and fault-related
structures indicate that transformation of the tectonic regime froa a
contraction~l, subduction-related domain to a translational, transform
style domain precedes arrival of the triple junction by 1-2 ma (ma = one million years before present; my = one million years). In
addition, they attribute east-west contraction immediately north of
--------- -----

13
Cape Mendocino to a change in relative motion of the Gorda plate 2.5-3
ma ago that resulted in internal deformation and subsequent coupling of
the southeastern corner of the Gorda-plate with the overriding North
American plate (Silver, 1971; Wilson, 1986). If the Gorda plate has
been the cause of contractional deformation in the overlying North
American plate since 3 ma, then a zone of deformation similar to that
existing north of the present MTJ probably existed farther south, in
conjunction with the MTJ's migratory path, for the past few million
years (Kelsey and Carver, in preparation).
Uplift Rates Determined from Emergent Marine Terraces
Our understanding of the tectonic history of complicated plate
boundaries can be enhanced by studies of Quaternary time-lines, such as
the inner edges of emergent shore platforms. These inner edges, or
shoreline angles, are interpreted as approximate indicators of paleo
sea levels. The record preserved in a flight of emergent shorelines
consists primarily of a tectonic component from the rising land mass,
and a glacio-eustatic component from an oscillatory ocean surface
(Bloom, 1980; Lajoie, 1986). Better absolute age control and,
consequently, increasingly more detailed records of sea-level
fluctuations for the past 350 ka, have improved our ability to identify
the tectonic components of such records. Marine terrace-surfaces have
been used to interpret rates and styles of deformation in numerous
studies along many plate boundaries in the CircumrPacific region (for
example, see summaries in Bloom, 1980; Ota, 1986; and Yonekura, 1983).
-~-"'~~-"------------------------------------

14
Altitudes of Formation of Marine Terraces
To estimate an uplift rate from a dated terrace, one must
correlate the present altitude of the shoreline platform's inner
edge--which approximates the former mean sea level--with the mean sea-
level altitude that existed at the time the platform was formed. Times
and altitudes of shore-platform and coral-reef formation appear to be
roughly synchronous in different parts of the world (Bloom et al.,
1974; stearns, 1976, 1984; Ku and Kern, 1974; Chappell and Veeh, 1978;
Chappell, 1983; Dodge et al., 1983), and were formed during sea-level
highstands. Times and altitudes of glacio-eustatic sea-level
highstands during the past 340 ka have been derived from
radiometrically dated coraline marine terraces on the Huon Peninsula,
New Guinea (Veeh and Chappell, 1970; Bloom et al., 1974; Chappell,
1983; Chappell and Shackleton, 1986), where rapid uplift has allowed
more marine terraces to be preserved than at most other sites in the
world. The complete record, exceptional preservation, and detailed age
control2 of the terraces establish New Guinea as a type area for first-
order correlation with flights of marine terraces elsewhere in the
world (Chappell, 1983; Bull, 1985; Lajoie, 1986).
The altitudes of sea-level highstands that formed the New
Guinea reef complexes were determined from consistent altitudes (6±4 m)
of the globally prominent 120-130 ka terrace on tectonically stable
coastlines in many parts of the world (Broecker and Thurber, 1965;
2234U/230Th radiometric age control for the coraline terraces is best for 133xl03 years and younger (±3 x 10³ years to 5 x 10³ years), and poorest for older than 214 x 103 years (±10 x 103 years to 15 x 103
years). Altitudes of formation are ±5 a.

15
Veeh, 1966; Ku et al., 1974; Stearns, 1976), and from the assumption of
uniform long-term uplift along individual stretches of the New Guinea
coast. The uniform uplift rate assumption was cross-checked by
comparing ratios of altitudes of dated marine terraces along different
parts of the Huon Peninsula (Bloom et al., 1974). Similar information
on ages and altitudes of past sea-level highstands has been obtained in
Barbados (Mesollela, 1969; S~einen et al., 1973), Japan (Machida,
1975), southern California (Ku and Kern, 1974; Hubs, 1983, 1985), Haiti
(Dodge et al., 1983), and Timor (Chappell and Veeh, 1978).
Uplift Rates in Northern California
Previously published uplift rates. A dearth of datable
materials, such as coral, has precluded development of a detailed
independent record of sea-level fluctuation for coastal northern
California, so past workers have used the New Guinea marine terrace
record to estimate uplift rates from dated terraces (e.g., McLaughlin
et al., 1983a). These workers assumed that times and positions of each
sea-level highstand were not significantly different throughout the
world, and that variations in the marine geoid (Morner, 1983) due to
gravitational or viscoelastic fluctuations have not seemed to
significantly affect the late Pleistocene sea-level record (McLaughlin
et al., 1983bj Lajoie, 1986). The difference between the present
altitude of a raised shoreline and its altitude of formation--as
obtained from the New Guinea sea-level fluctuation curve(Bloom et al.,
1974j Chappell, 1983; Chappell and Shackleton, 1986)--divided by the
terrace age, yields an uplift rate.

Table 2.1 summarizes all previously published uplift rates
obtained from radiocarbon and amino-acid racemization ages of organic
material within marine deposits overlying shore platforms between Fort
Bragg and Cape Mendocino. Holocene radiocarbon dates at Singley Flat
and Big Flat (Fig. 2.1) are from shell material and driftwood; late
Pleistocene radiocarbon dates at Point Delgada and Whale Gulch (9 km
south of Point Delgada) are from driftwood; and the late Pleistocene
date at Fort Bragg is an amino-acid racemization age of shell materi
al. From Fort Bragg to Big Flat--a distance of about 75 km--uplift
rates during the last 100 ky increase more than an order of magnitude,
from 0.3 mlka to 4.0 mlka (Fig. 2.1). From Big Flat northward,
Holocene uplift rates decrease from 4.0 mlka to 2.8 mlka at Singley
Flat.
16
North of Cape Mendocino, Holocene and late Pleistocene uplift
rates are much lower than those at the triple junction. Carver, Burke,
and Kelsey (1985, 1986) correlated marine terraces in the Humboldt Bay
area (20 km north of Cape Mendocino) by soil age clases, and estimated
inferred uplift rates that are generally less than 1 mlka from an
altitudinal spacing analysis. Their work also identified both broad,
asymetrical folding and thrust faulting of marine terrace surfaces, and
local tectonic subsidence, from the Bear River (Fig. 2.2) northward.
Farther north of the MTJ, near the California-Gregon border and in
Oregon, uplift rates along the Juan de Fuca subduction zone are
generally <1 mlka (Adams, 1984). An overview, then, of the change in
uplift rates along the western coast of the United States, from Fort
Bragg to Oregon, shows lowest uplift rates along the San Andreas

Table 2.1. Summary of published radiocarbon and amino acid racemization dates and uplift rates for late Quaternary marine terraces in the Fort Bragg-Gape Mendocino region.-
Location Feature Dated Uplift (from south to and elevation Material Dated Rate
north) _ Reference __ ab9vesea level Age, ka and_Method (m'ka)
Fort Bragg
Whale Gulch
Point Delgada
Big Flat
Cape Mendocino (Singley Flat)
McLaughlin et ai, 1983: reference to Lajoie, K.R., 1981, unpub. data; Kennedy et ai, 1982
Hagemann, 1982
McLaughlin et ai, 1983
Lajoie et ai, 1982a
Lajoie et ai, 1982a
Marine terrace deposits; inner edge platform 23 m
Marine terrace deposits; platform 15m
Marine terrace deposits; platform >7m
9 beach ridges, up to 30 m
8 marine terraces and beach ridges, up to 12 m
103 or 83
42 to >57
44,800±1,300
0.2-8.9
3.1-3.7
Molluscs, amino-acid racemization
Fossil wood debris Carbon-14
Fossil wood debris Carbon-14
Molluscs Carbon-14
Molluscs and driftwood Carbon-14
-0.3
>1.0(?)
>1.0 (?)
~.O
~.8
.... -..J

18
transform boundary (0.3 m/ka), higher rates along the Juan de Fuca
subduction zone boundary «1 m/ka), and highest rates at the transition
between the two, in the MTJ region (2.8-4 m/ka).
Inferred Uplift Rates from Undated Terraces in Northern California
It is frustrating not to be able to directly date the numerous
terrace-remnants that are preserved in coastal northern California.
Coral does not live in such cool waters and shells and organic matter
do not persist long in well-aerated acidic soils. In addition, such
materials generally occur in deposits overlying the marine platform and
thus are minimum ages of the terrace and must be used cautiously.
Holes bored into sandstone by pholad clams are found to altitudes of
>250 m, but shells generally are not present in the boreholes for
terraces older than 40 ka. An alternative method is needed to improve
estimates of terrace ages in lieu of datable material.
Bull (1985) and Bull and Cooper (1986) extended the method of
correlating sequences of terraces with assumed synchronous sea-level
highstands in order to examine flights of undated terraces in New
Zealand. Bull noted that "prior studies clearly suggest that entire
flights of marine terraces may be part of an overall population of
global marine terraces" (Bull, 1985, p. 3). If so, each uniform rate
of uplift will produce a unique altitudinal spacing and number of
terraces that can be used to infer both the ages of each terrace within
the flight and the overall uplift rate. This premise is the basis of
the following analysis.
Seven flights of terraces between Cabrillo Point and Cape
Mendocino were surveyed in this study (Fig. 2.2). Marine terrace

19
preservation varies widely throughout the region. Holocene terraces,
and older terraces in areas of very low uplift, are generally broad"
benches covered with beach gravels, eolian sands, and fluvial deposits.
In high uplift areas, prominent bedrock notches occur from sea level to
more than 600 m, although all but the lowest lack fossils, beach
gravels, and eolian sands. The most extensive and best preserved
terraces at high altitudes (>250 m) are those at Smith Gulch (Fig. 2.2,
site D). Broad, partially dissected bedrock platforms extend 5 km
southward from the mouth of the Mattole River. At most locations they
are covered with 2-6 m of marine and eolian deposits, and pholad
borings are common.
At each transect, terrace spacings were measured from sea level
with altimeters, hand levels, and an electronic distance meter, and
were corrected to altitudes using tidal information and benchmarks.
The accuracy of our surveys generally were within ±l m, but the
precision of determining inner edge altitudes commonly was ±3-6 m
because of ambiguities of defining the inner-edge position in the
field.
Landslides are common in the highly sheared rocks of humid
coastal northern California. We were concerned that landslides could
either destroy terrace remnants or could displace remnants of shore
platforms with overlying beach sands, thereby producing situationa
where surveyed altitudes of shore platforms would be anomalously low.
Landslides are especially abundant were steep escarpments are subject
to periodic basal erosion during sea-level highstands. Examples of
these types of complications were noted in the area. However, we

20
concluded that the terrain between ridgecrests was most susceptible to
landslides and earthflows, but that the ridgecrests generally
represented stable ground that has been subject to weathering and
fluvial erosion but not to landsliding.
An example of the lateral extent of ridgecrest benches that
have been formed during sea-level highstands and which have not
subsequently been displaced by landslides is illustrated by electronic
distance meter surveys of benches on two nearby ridgecrests. Surveys
were made in different years by different survey teams. Benches ranged
in degree of preservation from 100 m wide shore platforms capped with
beach sand to 4 m wide benches stripped of all cover bed stratigraphy.
Altitudes of Shore-Platform Inner Edges. in meters
Punta Gorda
III 123 165 173 100 239 251 274
Smith Gulch
III 125 162 174 187 241 252 271
Landslides are common on the steep slopes between these ridgecrests,
that are about 3 km apart. These types of data comparisons are highly
useful, not only for demonstrating lack of landslide displacement of
marine-terrace remnants, but also for confirming which benches have
sufficient lateral continuity to be considered remnants of marine
terraces.
Altitudinal Spacing Analysis. The procedures and assumptions
described by Bull (1985) were used to infer rates of uplift at each
transect from terrace altitude spacings. Individual terraces were

21
assigned ages, and thus altitudes of formation, based on the revised
New Guinea sea-level curve for the last 300,000 ka of Chappell (1983),
as tabulated by Bull (1985). Graphs were plotted of inferred uplift
(altitudes of local terraces minus their New Guinea altitudes of
formation) versus the inferred ages of the same global marine terraces.
Each graph represents an attempt to correlate local with global flights
of marine terraces. The correlations were then evaluated for the most
probable age assignments and uplift rates, based on any previously
known terrace ages and rates of uplift, the configuration of points on
the inferred uplift-rate plots, cross-checks with soil profile
development, and internal consistency between adjacent terrace
flights.
Three of the eight transects--Randall Creek, Bruhel Point, and
Smith Gulch (Fig. 2.2)--can be used to illustrate the methodology of
altitudinal spacing analysis in areas of high, low, and changing rates
of uplift. Randall Creek is perhaps the simplest example (Fig. 2.2,
site C). At this transect, altitudes of terraces preserved along the
southern drainage divide of the Randall Creek watershed (Fig. 2.3) were
surveyed with an altimeter, and altitudes of accordant notches on the
opposite side of the stream were obtained with a hand level. Fifteen
terrace-remnants between 30 m and 633 m above sea level were
identified. Most are accordant with matching benches on the opposite
side of Randall Creek or along the range front to the south. All are
bedrock benches, with no intact cover bed deposits. The altimeter
survey was tied into readings taken throughout the day at a benchmark 9
m above sea level at the mouth of Randall Creek, and also with two spot
-- -------------- --------

22
Figure 2.3, Aerial view of southern drainage divide, Randall Creek. In areas of high uplift rates, often the only remnants of marine platforms are bedrock nkotches and flat summits, as in this case. Arrows point to inner edges of 13 of the 15 bedrock benches surveyed (125-m and 543-m terrace-remnants can not be seen in this photo. Note that several notches are accordant with others along rangefront. Perimeter of large block-slide is indicated by dashed line.

altitudes on the transect and a benchmark on the highest terrace
surveyed.
23
Four possible correlations of the ten lowest terraces, at
altitudes of 30 through 420 m, are illustrated in Fig. 2.4 and T.able
2.2. Each terrace-remnant is assigned an age, then the difference
between its present altitude and the altitude of formation for its
assigned age yields inferred amounts of uplift (Table 2.2). A graph of
inferred uplift versus time is shown for each correlation attempt. In
the first case (Fig. 2.4a), each of the 10 terraces has been correlated
with one of the past 10 sea-level highstands from 6 ka to 103 ka. The
resulting inferred uplift rate diagram consists of a best-fit straight
line with a uniform slope that plots through the origin. The slope of
the line is the inferred uplift rate, 4.1 m/ka. Note, however, that if
each of the 10 points were connected, slopes would vary, because
individual uplift rates between times of terrace formation range from
3-6.5 m/ka; the longer-term rate of uplift determined by the. best-fit
line is an average uplift rate.
In the second case (Fig. 2.4b), each terrace-remnant is
assigned to the next older sea-level highstand. The resulting inferred
uplift diagram has much scatter about a best-fit line that does not go
through the origin. In order for this case to be correct, 70 m of
uplift must have occurred in the past 1 ka, and the Randall Creek coast
must have alternately raised and subsided. For example, the 262-m
terrace-remnant, shoWn with an arrow, has less net uplift than the next
younger terrace. Correlation 8 infers 6 m of subsidence between 83 and
---------------------------------------------------

500 500 (b)
400 .coo
300 300
200 200
100 100
E 0
~ 40 80 a 40
a. ~
" (d) e 500 500 .. III
:s 400 400
300 300
200 200
100 100
0 100 200 300 400 a .100 200 300 400
nme Be'ol1l Present, lea
Figure 2.4. Alternative inferred uplift rate diagrams derived from four different scenarios (a-d) of possible age assignments for terrace-remnants at Randall Creek. Ages and amounts of uplift are summarized in Table 2.2. Numbers beside curves are average uplift rates determined from linear regression analysis of each line seglDent.
24

Table 2.2. Altitudes (A, in m) and inferred uplift (U, in m) of each terrace-remnant for four correlations, a-d, for Randall Creek. Columns a-d correspond to Fig. 2.4a-2.4d.
NEW GUINEA MARINE TERRACES RANDALL CREEK TERRACES
Age, Altitude, (a) (Ul (Al (b) (Ul (Al (c) CUi (A) (d)
kll m (A) (U) 6 0 30 30 - - - - - -30 -42 72 114 30 72 - - - -40 -37 125 162 72 109 - - - -46 -37 143 180 125 162 - - - -57 -29 186 215 143 172 30 59 - -64 -26 235 261 186 212 72 98 - -76 -46 262 308 235 281 125 171 - -83 -13 323 336 262 275 143 156 30 43 94 -20 355 375 323 343 186 206 72 92 103 -10 420 430 355 365 235 245 125 135 120 6 - - 420 414 262 256 143 157 133 5 - - - - 323 318 186 183 176 -21 - - - - 355 276 235 256 202 -17 - - - - 420 437 262 279 214 -3 - - - - - - 323 326 242 -28 - - - - - - 355 383 286 -46 - - - - - - 420 466 305 ·27 - - - - - - - -320 4 - - - - - - - -336 4 - - - - - - - -
i
I
I
I
t\) U1

26
76 ka. Thus, this correlation requires erratic increases and decreases
in rates of uplift, and is highly unlikely.
In the third case (Fig. 2.4c), the lowest terrace-remnant (30-
m) is assigned an age of 57 ka, and each higher terrace a consecutively
older age. As in correlation B, this attempt produces erratic
increases and decreases in rates of uplift, with 42 m of subsidence
between 176 and 133 ka, and 15 m of subsidence between 83 and 76 ka.
This correlation does not result in a unique solution with uniform
uplift.
In correlation D (Fig. 2.4d), the ten lowest terraces are
assigned consecutive ages from 83 to 286 ka. Although the resultant
amounts of inferred uplift are not uniform between each terrace-Torming
interval, uplift is always positive, with no periods of net subsidence.
Scatter of individual data points about a best-fit line with a slope of
1.3 mlka indicates that short-term uplift during 20-ky periods is much
different than the long-term rate of uniTorm uplift. Most importantly,
this plot does not go through the origin, and requires that very little
uplift has occured in the past 83 ka.
The preferred inferred uplift rate diagram for the Randall
Creek transect is correlation A, because it produces a unique solution
with a uniform rate of uplift that plots close to the origin. All ten
terrace remnants are included in this correlation, and no global marine
terraces are missing. Above the highest terrace-altitude included in
these correlations, 420 m, the mountain Tront decreases in steepness.
This decrease suggests that the steeper basal part of the escarpment
has resulted Tram an acceleration of uplift rates. Altitudinal spacing
---------------------------------------------------------------------------------

analysis is complicated for these higher terraces because regression
lines cannot go through the origin in cases of nonuniform uplift, and
because some of the global marine terraces may be missing at higher
altitudes if uplift rates were indeed lower. The common and sometimes
difficult situation of using altiduinal spacing analyses along slowly
rising coastlines is considered in the next example, for the Bruhel
Point transect.
27
Prominent, broad terraces along the coast from Cabrillo Point
to Westport are well-known as the "Meniiocino staircase". The altitudes
of the six lowest terraces were surveyed from sea level with an
electronic distance meter at two transects, one south of Fort Bragg, at
Cabrillo Point (Fig. 2.2, site A-I; Fig. 2.5), and one north of Fort
Bragg, at Bruhel Point (Fig. 2.2, site A-2; Fig. 2.6). Survey data
indicate that the two flights of terraces are correlative. The inner
edge altitudes of all four terraces surveyed at Cabrillo Point are
within 2 m of the inner-edge altitudes at Bruhel Point, where an
additional terrace, at 88 m, was surveyed. Amino-acid racemization of
cool-water marine molluscan fauna from the 23-m terrace suggests a
correlation with the 83 or 103 ka New Guinea terraces (Kennedy et al.,
1982). This estimate provides guidelines for initial attempts at
correlating local terraces to global sea-level highstands.
Four possible inferred uplift-rate diagrams are generated in
Table 2.3 and Fig. 2.7a-7d for the Bruhel Point transect. In the first
case (Fig. 2.7a), each of the five terraces is assigned consecutive
ages from 46 to 83 ka. In the second case (Fig. 2.7b), each is
assigned consecutive ages from 64 through 103 ka, and in the third case

28
Figure 2.5. Aerial view southeastward of Cabrillo Point. In areas of low uplift, marine terraces are often broad, gently sloping surfaces separated from adjacent surfaces by low risers. Dashed lines indicate riser crestst Outer edge of 23-m surface is the coastal sea cliff, except where the 10-m platform is preserved. Arrows along the coast point to the highly weathered 10-m bedrock platform. This prominent surface also was surveyed at Mendocino Headlands 6 km to the south, and at site A2, at Bruhel Point

29
Figure 2.6. Aerial view eastward of marine terrace flight surveyed at Bruhel Point. Arrow in upper left of photo identifies the 10-m terrace. Lowest terrace in center of photo is the 22-m terrace. The outer edge of its tread is the coastline in the center of the photo. The next higher terrace, the 40-m terrace, is the lowest terrace preserved on the right side of the photo, thus its outer edge is the coastline, indicated by the dashed line. The outer edge of the 61-m terrace is also located with a dashed line. Arrow in upper right of photo points to a terrace-remnant at 88 m.

30
Table 2.3. Altitudes (A, in m) and inferred uplift (U, in m) of each terrace for four correlations, a-d, for Bruhel Point. Columns a-d correspond to Fig. 2.7a-2.7d.
M~t::NE GUI~,,-A TERRACES BRUHEl POINT TERRACES
Age, Altitude, (A) (.) (U) (A) (O) (U) (A) (e)
'lUI (A) (d)
lUI h m 6 0 - - - - - - - -30 -42 - - - - - - - -40 ·37 - - - - - - - -48 ·37 10 47 - - - - - -57 ·29 23 52 - - - - - -64 ·28 40 86 10 38 - . - -78 -46 61 107 23 89 - - - -63 ·13 88 101 40 63 - - 10 23 94 ·20 - - 61 61 - - - -103 ·10 - - 88 98 - - 23 33 120 6 - - - - 10 4 40 34 133 6 - - - - 23 18 - -176 ·21 - - - - 40 61 - -202 ·17 - - - - 81 78 - -214 ·3 - - - - 88 91 81 84 242 ·28 - - - - - - - -288 -46 - - - - - - - -306 ·27 - - - - - - - -320 4 - - - - - - 88 84 338 4 - - - - - - - -
------------------------- -,,-------

31
120 120
E 80 = 80
=a :;,
~ 40 40 J!! .5
0 0 0 80 120 0 80 120
120 120 (d)
E gi a 80
:;,
i J!! .5
40 40
0 0 40 80 200 240 80 180 240 320
Time B"fOl'e PreHnt, kII 11me Before Present, ka
Figure· 2.7. Alternative inferred uplift rate diagrams derived frOlll four different scenarios (a-d) of possible age BBsignments for terrace-remnants at Bruhel Point. Ages and amounts of uplift are summarized in Table 2.3. Numbers beside curves are average uplift rates determined from linear regression analysis of each line .. segment.

32
(Fig. 2.7c), from 120 through 214 ka. In correlations'A and B, long
,term uplift is not uniform, and the intersection of the regression line
with the time-axis requires that uplift decreased rapidly between the
time of the youngest assigned age and the present, as represented by
the origin, and is now 0 m/ka. In correlation C, the high correlation
between the data points and a best-fit line suggests a unique solution
of 0.9 mlka of uniform uplift. However, the plot intersects the time
axis at about 115 ka, and would require that uplift halted abruptly at
that time.
Before f~~ther discussion of these four correlation attempts, a
different type of plot--a prediction diagram--can be used to illustrate
the difficulty of using a marine terrace spacing analysis in a low
uplift rate area. Fewer terraces are preserved along slowly rising
coastal areas, because they are more likely to be reoccupied,
submerged, or destroyed by subsequent sea-level highstands. Fig. 2.8
can be viewed as a prediction diagram. The topographic profile on the
left is from the Bruhel Point survey data. For each sea-level
highstand, a line can be drawn upwards that would represent the moving
position of a terrace formed during that highstand, and then raised at
a given uniform rate of uplift through time.
An uplift rate of 0.3 mlka is used in Fig. 2.8, thus this
prediction diagram corresponds to the correlation attempt presented in
Fig. 2.7d. Solid lines on the right side of Fig. 2.8 represent sea
level highstands with preserved terraces, whereas dashed lines
represent terraces that are reoccupied or submerged during subsequent
highstands. Each line is parallel, and intersects the altitude-axis at
--~--.-.----.----.----------------------- _._.-.-

Figure 2.8. Glacio-eustatic sea-level fluctuation curve for the past 350 ka, and topographic profile of emergent marine strandlines that would result from 0.3 mlka uniform uplift. Times and altitudes of sea-level highstands are from Chappell (1983) and Bull (1985). Dashed lines represent marine strandlines that would be reoccupied or submerged during subsequent sea-level highstands.

Topographic Profile of Marine Terraces
L 2
Sea
~
Uplift
Altitude. m 150
100
~ -----K~ H -50 ~~~
-100
-150 0
Sea-Level RuctuaUon Curve
50 100 150 200 ·250 300
Time before present, ka
Figure 2.B. Glacio-eustatic sea-level fluctuation curve.
350
w w
34
a point that represents the present altitude of that terrace. For that
uplift rate, then, one can predict which sea-level highstands should be
represented by marine terraces, and one can predict the unique
altitudinal spacing of terraces for each uniform uplift rate. The
higher the rate of uplift, the more likely it is that a terrace will
rise above the level of subsequent highstands and thus be preserved;
thus, more terraces exist along tectonically active coastlines. For
example, the 30 ka terrace, which formed at 42 m below present sea
level, must be raised at least 1.B m/ka to survive inundation from the
present sea-level highstand. At 0.3 m/ka of uniform uplift, only six
terraces that formed during major interglacial sea-level highstands
(320-336, 214, 120-133, 103, B3, and 6 ka) are predicted to exist
today.
In areas of low uplift, where few terraces exist, a unique
solution with uniform uplift is not likely. In such an area,
independent age control is vital. Hence, cases A and B are the least
preferred because the 23-m terrace is assigned too young an age. Case
C is less preferred than case D, because of the abrupt halt in uplift
at 115 ka. Case D, in which the 23-m terrace is assigned an age of 103
ka that is consistent with the amino-acid age estimate, has fairly
uniform rates of uplift from 320 ka to the present, and all predicted
terraces exist. Although the b79t-fit line falls slightly above the
origin, it is closer.to the origin than in any of the other four cases.
Thus, Fig. 2.7d is considered the best correlation.
The five highest terrace altitudes at the Randall Creek
transect can be correlated with global sea-level highstands as if all
_._ .•.. _._._------------------------------

35
terraces are present (Fig. 2.9a, Table 2.4), or as if several terraces
are missing and only major sea-level highstands are represented, as in
the Bruhel Point example (Fig. 2.9b, Table 2.4). Both correlation
attempts result in possible solutions with two periods of uplift. Fig.
2.9a is a combination of 1) correlation A from Fig. 2.4a, in which the
first ten terrace remnants were assigned ages of the past 10 sea-level
highstands, and 2) correlation of the five highest terrace-remnants
with the next five older consecutive sea-level highstands. No terraces
are missing in this combined correlation, but uplift is not uniform, as
it changes from 1.B mlka between 214 and 103 ka to 4.1 mlka between 103
ka and the present. Fig. 2.9b is equally reasonable. In this
correlation, the 12 lowest terraces are assigned the same ages as in
Fig. 2.9a; now, however, the three highest terraces are correlated with
older interglacial highstands at 214, 305, and 320 ka. This
correlation also produces two straight lines, with a lower uniform
uplift rate of O.B mlka between 320 and 133 ka.
A third site, Smith Gulch (Fig. 2.2, site D), illustrates a
combination of the Randall Creek and Bruhel Point characteristics.
These two sites illustrated extreme examples of the marine terrace
spacing analysis method, one for high uplift rates, and the other for
low uplift rates, respectively. At Randall Creek, the best correlation
attempts (Fig. 2.9a and 2.9b) include 15 of the last 19 sea-level
highstands. In contrast, lower uplift rates result in many missing
terraces, and the preferred correlation for Bruhel Point (Fig. 2.7 and
2.B) includes only five of the past 19 sea-level highstands. At Smith
Gulch, the inferred uplift rate diagram resembles that for Bruhel Point
------------

36
(a) (b) 800 800
e 600 600
:e a. :;) 400 400 "a CD t:: CD - 200 200 .5
0 100 200 300 400 0 100 200 300 400
Time Before Present, ka
Figure 2.9. Alternative inferred uplift rate diagrams derived from two spenarios (a and b) of possible age assignments for complete flight of terrace-remnants at Randall Creek. Ages and amounts of uplift are summarized in Table 2.4. Numbers beside each curve are average uplift rates.

37
Table 2.4. Altitudes "(A, in m) and inferred uplift (U, in.) of each terrace for two correlations, a and b, for complete flight of terrace-remnants at Randall Creek. Columns a and b correspond to Fig. 2.9a and 2.9b.
NEW GUINEA MARINE TERRACES RANDALL CREEK TERRACES
Age, Altitude, (a) (b) ka m CA) CU) CA) CU) 6 0 30 30 30 72
30 -42 72 114 72 109 40 -37 125 162 125 162 46 -37 143 180 143 172 57 -29 186 215 186 212 64 -26 235 261 235 281 76 -46 262 308 262 275 83 -13 323 336 323 343 94 -20 355 375 355 365 103 -10 420 430 420 414 120 6 473 467 473 467 133 5 489 484 489 484 176 -21 543 564 - -202 -17 593 610 - -214 -3 633 636 543 546 242 -28 - - - -286 -46 - - - -305 -27 - - 593 620 320 4 - - 633 629 336 4 - - - -

38
for terraces above 250 m, and that for Randall Creek for terraces below
250 m.
A prominent change in landscape features at Smith Gulch occurs
at 250m (Fig. 2.10 and 2.11). Above this altitude, the topography
resembles the Fort Bragg coastline: broad, gently sloping marine
terraces separated by low risers step gradually upwards to more than
400 m in altitude, and can be traced for several km in a north-south
direction. Below 250 m, a steep escarpment drops abruptly seaward; the
sheerness of this face is interrupted along narrow interfluves by small
benches and notches, some with relict marine gravels perched on them.
A significant increase in uplift rates has occurred since the time of
formation of the lowest broad terrace at about 250 m. Major antecedent
drainages that dissect this landscape have responded to increased
uplift rates by rapid downcutting through the Franciscan bedrock,
dissecting the broad upland terraces and cutting steep-walled planar
inner gorges below upper, gentler slopes that lead downwards into
narrow, v-shaped valleys.
The Smith Gulch site is a key transect, as many terraces with
their cover bed strata are preserved, and exposures of inner-edges and
platforms are common. Accordant terrace levels on adjacent ridgecrests
were identified and surveyed, thus verifying the continuity of the
terraces and the estimates of their altitudes (Fig. 2.11). In
addition, it is the site of an ongoing study of soil development on six
terraces, and establishment of a soils chronosequence hased on
extensive laboratory analyses (Merritts, Chadwick, and Hendricks, in
preparation; Chapter 3 of dissertation). Soil characteristics show

39
Figure 2 10. Aerial view eastward of terrace flight surveyed at Smith Gulch. Arrows point to inner edges of surfaces of terrace-remnants.

-------------
E C .2 iii > CI>
W
300
200
100
EXPLANATION
~ B.drock Platfcr.
300
200
.... rln. Gravela 100 and aanda
a3 "aalgned aga, ka
o ~~ __ ~ ______ ~ ____ ~ ____ ~~ ____ ~ ____ ~ ______ ~~O o 0.2 0.4 0.6 0.8 1.0 1.2 1.4
Distance, km
Vertic. I Exaggerallon 3X
Figure 2.11. Topographic profile of terrace flight surveyed with electronic distance meter at Smith Gulch. Assigned ages are indicated above each terrace. The 83-ka and 94-ka terraces are projected from an adjacent ridge survey.
40

changes associated with increasing age for terraces that are
progressively higher.
41
The best correlation attempt for the Smith Gulch terraces is
shown in Fig. 2.12 and the data are listed in Table 2.5. The 10 lowest
terraces are correlated with the last 10 sea-level highstands prior to
6 ka. The resulting inferred uplift-rate curve is segmented. From 94
ka to 30 ka, 8 terrace-remnants fallon a straight line with a uniform
uplift-rate slope of 2.53 m/ka. Before 94 ka, uplift rates were much
lower. From 320 to 120 ka, uplift rates were about 0.2 m/ka,
comparable to those at Fort Bragg today, thus many terraces that were
formed during lower sea-level highstands are missing. From 133 to 94
ka, uplift rates increased to 1.4 m/ka. A more recent increase in
uplift seems to have occurred since 30 ka, as a line connecting the
origin and the 30-ka data point on Fig. 2.12 results in an uplift rate
of 4.0 m/ka. This rate agrees well with inferred uplift rates during
the last 100 ka at Randall Creek 20 km to the south (4.1 m/ka), and 29
km to the south at Big Flat (4.0-5.0 m/ka, radiometrically determined
Holocene rate).
Inferred uplift rate diagrams for eight sites are shown in a
composite coastline view in Fig. 2.13. This diagram allows a
comparison of spatial and temporal variations in uplift rates along the
coast from Fort Bragg to Cape Mendocino. Terrace altitudes, assigned
ages, and inferred amounts of uplift for all survey transects are
summarized in Table 2.5. The Randall Creek site has two possible
interpretations, Fig. 2.9a and 2.9b. Both have the same uplift history
for the past 103 ka, but different rates of low uplift prior to then.

42
400
E 300
~ 0.2
a. 1.4 :;)
200 'a ~ .. .! .s 100
160 240 320
Time Before Present, ka
Figure 2.12. Inferred uplift rate diagram for Smith Gulch site, showing change in uplift rates at about 120 ka. See Table 2.5 for assigned ages and amounts of inferred uplift. Numbers represent the slope of each segment, and are uplift rates in m/ka.

Table 2.5. Surveyed altitudes (A, in m) and inferred amounts of uplift (U, in m) for eight coastal transects from Bruhel Point to Cape Mendocino (Fig. 2.13). Amounts of uplift and assigned ages are those determined from the preferred inferred uplift rate diagrams.
NEW GUIN"A A If~ANIA IIAAI!lE A UARINE TERRACES Aal Alliludl S .. r RI •• r Co". Ranch Slnll"y _ Fl., IIcHull Gulch Smllh Gulch Randa/l Cr •• " Ka/uM CIIII Bruh., Polnr kl m A A. U (Alt U 6 0 13 13 - - -11 -11 30 -42 22 114 - - 42 84 40 -37 - - 54 III 7e 113 46 -37 70 107 78 113 112 1211 57 -211 112 121 101 130 112 141 114 -28 - - 1211 155 - -7e -46 - - 135 111 - -83 -13 123 138 - - 155 168 114 -20 - - 185 185 - -103 -10 141 151 "162 1112 170 160 120 8 182 158 203 Il17 - -133 5 - - - - - -171 -21 - - - - - -202 -17 - - 207 224 - -214 -3 - - - - 243 248 242 -28 - - - - - -2611 -411 - - - - - -305 -27 - - - - - -:: 4 238t 234 240 238 281 2511
• - - - - - -
tAititudea detam1lned from hand-le ... 1 survey; error:t2 m for each value. tAltirudes determined from altimeter; 8Il0l':1:1.5 m for each value.
A. (UI - -58 100 84 121 111 128 113 142 - -
135 181 175 168 - -
200 210 230 224 - -- -- -252 255 - -- -- -275 271 - -
,Altitudes determined from electronic cflStance meter; e/TOr ±O.2 m for er..ch value. tfAJtilUdea determined from 7.5' 1I)pDgraphic map spot altitude; 1l1OI':C2 m for each value.
A. U All U A. - - 30t 30 -
78' 120 72 114 -111 148 125 162 7 125 162 143 160 12 152 181 1611 215 45 174 200 235 261 57 187 233 262 308 -241 254 323 338 88 252 272 355 375 -271 281 420 430 121 2117 2111 473 487 147 303 2118 4811 484 160 - - - - 2011 - - - - 234 - - 043 548 0 - - - - 264 - - - - 325 - - - - 3511
S32t2 321:t2 833 11211 413 - - - - 420
"Tema IQI delllmlined ildeplndendy. from rIIIiameIrIc or am!!:;,.acId racemizallDn dating. See lalt and Table 1ior dilCUlllon_
A. _1M] -- - -44 - -44 - -74 - -63 - -- - -1111 10t2' 23t2 - - -
131 23 33 141 40t2 3U2 155 - -230 - -251 - -270 1I1:t2 84:t2 312 - -371 - -363 - -:~! ~ 14:t2 - -
Cobrlllo Poln' A. ~UI
- -- -- -- -- -- -- -II 22 - -
22±2 32±2 42 sa - -- -- -
58:t2 BI:t2 - -- -- -- ------
01:>0 w

400 H
E SHIR/wr
300
~ a. :;)
1 t: ~ oS
80 180 240
400 f STngTeyRst
300
0.1
100
240 320
.Q
SmlthGuk:h
300 0.2
200
100
80 160 240 320
11 400 KalunaCITff
E 300 :!
~ 200
l .e .5i
0 0 80 160 240 320
Time Before Present, ka
320
100
0 0
300
200
100
eo
300
800
800
400
200
A2
g
Cape Ranch
80
0.1
0.3
.E McNutt Gulch
180 240
~
RandaIT Creek
320
[Note ver1Ieal leale chango.)
60 160 240 320
Bruhel PoInt
180 240 320
Time befo .. p ........ lea
Figure 2.13. Composite view of inferred uplift rate diagrams for eight coastal transects. Axis scales and labels are the same for all diagrams but Randall Creek. Numbers adjacent to curves are uplift rates, in m/ka. From south to north, each diagram· shows variations in rates of uplift and times of acceleration in uplift that reflect migration of the MTJ during the past 2 mao
44

Fig. 2.9a is shown in the composite view of Fig. 2.13, although it is
as likely as the correlation in Figure 2.9b.
46
Notable similarities in the five diagrams north of Randall
Creek (Fig. 2.13) are indicated by the overall shapes of the
uplift-rate curves, which reflect similar values of uniform uplift
rates and progressive increases in these rates with time. Upper,
gently sloping segments of the curves represent low' uplift rates, and
are all less than 0.4 m/ka. A similar pattern of uplift rates
increasing from less than 0.4 mlka to more than 2 mlka during the past
120 ka is seen on each transect between Smith Gulch and Cape Mendocino.
Between Singley Flat and Smith Gulch, at McNutt Gulch, latest Pleisto
cene uplift rates are 3.3 m/ka--less than that to the south, but
greater than that to the north. North of Singley Flat, at the Cape
Ranch and Bear River sites, latest Pleistocene uplift rates are only
2.4 and 2.1 mlka, respectively. Apparently uplift rates have
increased, but have yet to reach maximum values associated with the
passage of the triple junction. Timing of the increases in uplift
rates seems to change northward, shifting to progressively more recent
times, from 120 ka at Randall Creek, to 94 ka at Smith Gulch, 83 ka at
McNutt Gulch, and 83 to 57 ka from Singley Flat to Bear River.
Discussion of Inferred Uplift Rates
The assigned terrace ages can be viewed as predictions of the
most probable ages, to be tested as further data, such as additional
radiometric dates, are obtained. It is useful to compare the preferred
inferred uplift rate diagrams and to consider their reliability
relative to other data, and relative to one another. Thus, the next

47
section considers the internal consistency of terrace age assignments
and inferred uplift rates with 1) independent absolute and relative age
control, 2) geomorphic studies regarding variations in long-tena
uplift, and 3) comparison of altitudinal spacing analyses of marine
terraces between sites.
Comparison With Independent Age Control
Uplift rates determined from absolute age control along the
northern California coast are scarce at present, but those available so
far can be compared with inferred rates determined in this study. This
comparison is summarized graphically in Fig. 2.14. Both inferred
uplift rates from this study, and independently obtained rates from
previous studies, for late Pleistocene and Holocene time are plotted
along a N300 W transect that roughly parallels the San Andreas transform
and coastline. These 13 points form an uplift rate curve that is
highest in the central and northern parts of the King Range--from Big
Flat to Smith Gulch--and lowest along the Fort Bragg coast. The late
Pleistocene rate inferred for the Singley Flat site, 2.8 mlka, agrees
with a maximum Holocene uplift rate determined from radiometric ages of
eight emergent Holocene terraces and beach ridges. Similarly, the
nearby sites at Big Flat and Randall Creek have a radiometrically
determined Holocene uplift rate of 4.0-5.0 mlka, and an inferred late
Pleistocene uplift rate of 4.0 mlka, respectively. One of the inferred
uplift rates determined for Bruhel Point agrees with that obtained from
the late Pleistocene amino-acid age estimate, although other inferred
uplift rates are also possible, and the spacing analysis can not
identify a unique solution.
---------------------------------_._ ....

cD -CU tJ:CU =I!!E _E 'ii :;)
Oma * 6.0
1ma
* 2ma
* II !£. BF
4.0
2.0 ~ FB M
0 0 40 80 120
Distance along a N30W transect, km
BF = Big Aat FB = Fort Bragg PO = Point Oelgada SF = Singley Flat WG = Whale Gulch
0'B, Marine Terrace Spacing Analysis (with site reference letter)
• 14C Dated Terrace A Amino Acid Dated Terrace * Location of Mendocino Triple
Junction (ma=Million years)
48
Figure 2.14. Latest Pleistocene uplift rates plotted along a N300W transect from near Cape Mendocino (0 km) to Fort Bragg (~120 km). Present and past locations of the MTJ are plotted at top of diagram. Inferred uplift rates determined from this study complement those obtained from dated marine terraces. Site locations are Al)Cabrillo Point, A2)Bruhel Point, B)Kaluna Cliff, C)Randall Creek, D)Smith Gulch, E)McNutt Gulch, F)Singley Flat, G)Cape Ranch, and H)Bear River.

50
Additional relative age constraints are provided from studies
of soil chronosequence development at Smith Gulch, Cabrillo Point, and
Bruhel Point (Merritts, Chadwick, and Hendricks, in preparation;
Chapter 3 of dissertation). Soil development in marine and eolian
sands and gravels overlying each of four terraces at Smith Gulch is
progressively greater on older terraces. Plots of properties such as
accumulated weight of organic matter, clay, crystalline iron,
crystalline aluminum, and amorphous aluminum versus assigned ages for
each terrace show characteristic trends that indicate much greater soil
ages for the terraces above 250 m than for those below the break in
slope. Moreover, the degree of soil development on the terrace
assigned an age of 120 ka at Smith Gulch corresponds closely to the
that on the 23-m terrace at Bruhel Point, with an amino-acid age
estimate of 103 or 83 ka.
All terraces above 23 m at Bruhel Point have much greater soil
profile development than the 120 ka terrace at Cape Mendocino, and are
well-known for high degrees of spodosolic development--i.e., depletion
of clay and sesquioxides from upper parts of soil profiles, and
accumulation of the same in lower horizons. The most pronounced soil
development is found on the 88-m terrace near Cabrillo Point, where
prolonged leaching and accumulation has resulted in development of an
iron-rich hardpan that stunts vegetation growth. Pygmy forests of
dwarfed cypresses and pines have grown on these older nutrient
deficient soils. This terrace is assigned an age of 320 ka in the
correlation attempt of Fig. 7d; such antiquity is supported by the
advanced soil development, and certainly represents a much older

51
terrace than those assigned ages of 120 ka or less at Smith Gulch.
Geomorphic Evidence for Variations in Uplift Rates
Higher rates of uplift between Cape Mendocino and Big Flat than
elsewhere along the coast are supported by other evidence, such as
variations in relief from Fort Bragg to Cape Mendocino, and the
steepness of first, second, and third order channel slopes (Merritts
and Vincent, in preparation; Chapter 4 of dissertation). A plot of
highest skyline altitudes for the first inland drainage divide from
Fort Bragg to Cape Mendocino roughly parallels the uplift rate curve.
Relief is a function of uplift rate, and the length of time that high
uplift rates have prevailed. This similarity suggests that higher
uplift rates nor'th of Point Delgada have existed for longer than
Holocene time. Merritts and Vincent have shown that plots of mean
first, second, and third order channel slopes along the same N300W
coastal transect also roughly parallel the uplift rate curve, with
steepest channel slopes between Smith Gulch and Big Flat Creek for all
three orders. To the north and south, mean channel slopes gradually
become gentler.
Cross-checks between sites
Comparison of inferred uplift rates determined for each site
from Fort Bragg to Cape Mendocino (Fig. 2.13) indicates that each
uplift-rate diagram is generally consistent with those obtained from
nearby sites. Coastal northern California is known to be tectonically
dynamic--it is part of an active orogenic belt, and tectonic regimes
are changing with time in response to MTJ migration {Kelsey and Carver,

in preparation; Carver, Burke, and Kelsey, 1985; Kelsey and Cashman,
1984). Thus, spatial variations in uplift rates, and changes in rates
with time, are more reasonable than would be a set of plots that
indicated the same uniform uplift for each site. Moreover, even late
Quaternary uplift rates obtained from dated terraces vary spatially,
and major differences in overall landscape morphology indicate that
variable uplift is the more likely case.
52
Another means of presenting what can be interpreted as
indicating internal consistency between flights is a plot of present
altitudes of each age terrace at each site (Fig. 2.15). If each
terrace assigned a given age is plotted along a N300W coastal transect,
and those points are connected from site to site, the resulting curve
shows the spatial pattern of deformation of a time-line that was
originally horizontal at the time of terrace formation (Chappell, 1974;
Lajoie, 1986). If all terraces-remnants of a given ~ge were raised
equal amounts, the line would remain horizontal. Deviations from
horizontal indicate differential uplift and tilting. An abrupt break
in such a line might indicate a structural discontinuity, such as a
fault. Furthermore, the spacing between two lines can be used to
identify whether uplift through time has been continual or episodic.
If two lines are equally spaced (parallel) along their length, but both
tilted from horizontal, differential vertical deformation occurred
since the time of formation of the younger terrace. In contrast, if
two lines converge, differential vertical deformation was continual,
and postdates formation of both terraces.
The pattern of deformation shown in Fig. 2.15 indicates both

53
Oma 1 rna 2ma 800 * * *
T(U'rac{!,A{l,e, ka E c x 6ka
"' • 30ka Q) 600 0 46ka CJ a S3ka CO • 103 ka ... ... 0 214ka Q) + 320 ka --0 400 Q) 'tI :::s -:; <t 200
A1
0 0 50 100 150
Distance, km
Figure 2.15. Pattern of deformation of marine terraces along a N300 W coastal transect from Cape Mendocino (2 km) to Cabrillo Point (~130 km). Each point represents the altitude of the inner edge of a marine terrace at that locality; lines connect terraces assigned the same age. Asterisks indicate position of the MTJ at present, 1 rna, and 2 ma ago. Site locations are Al)Cabrillo Point, A2)Bruhel Point, B)Kaluna Cliff, C}Randall Creek, D)Smith Gulch, E)McNutt Gulch, F)Singley Flat, G)Cape Ranch, and H)Bear River.
-------------------------- --------- ---

uniform vertical displacement between Cabrillo Point and Bruhal Point,
and continual differential vertical displacement between Bruhe! Point
and Cape Mendocino. No abrupt structural boundaries are indicated,
although little data exist between Randall Creek and Bruhel Point,
where a discontinuity may occur.
Mechanisms for Late Quaternary Uplift
The exact mechanism for Pleistocene uplift in coastal northern
California is unknown, as is the inland extent of the high-uplift
bulge. Numerous south-dipping, northwest-trending thrust faults and
northwest-trending complex folds in the King Range terrane were
probably active during late Tertiary uplift of the deep-water sedi
ments, but are not related to Quaternary deformation. Although
Quaternary marine terraces in the Humboldt Bay area have significant,
measurable offsets along northwest-trending thrust faults and folds
(Carver, Burke, and Kelsey, 1985; Carver, Burke, and Kelsey, 1986), no
clearly deformed terraces were noted between Fort Bragg and Cape
Mendocino. A possible interpretation is that deformation since passage
of the MTJ has been the result of more regional tilting or folding than
that occuring in a subduction zone tectonic regime north of the triple
junction.
Four possible mechanisms of uplift and their relation to late
Quaternary deformation are summarized here.
1. The Mendocino triple junction is presently unstable, as the
54

San Andreas transform and Gorda trench are noncollinear.
Local deformation might occur as the plates realign
themselves (Dickinson and Snyder, 1979b).
55
2. The subducted Mendocino fracture zone is moving northward
relative to the overlying North American plate, and, as it is
a prominent, 1 km-high south-facing topographic scarp, the
North American lithosphere is adjusting isostatically by
flexural tilt (Glazner and Schubert, 1985).
3. Growth of a "slab window" (Dickinson and Snyder, 1979a)
beneath the North American plate south of the triple junction
juxtaposes hot asthenosphere against cold North American
Hthosphere, where it was previously adjusted to underlying
bouyant oceanic lithosphere of the Gorda plate. The North
American lithosphere responds mechanically to this effective
lithospheric thinning and thermal change by local uplift due
to thermal expansion of the crust and flexural uplift due to
bouyant loading from the influx of less dense asthenospheric
material (Furlong, 1984). The resultant uplift is
time-dependent, and trails the Mendocino triple junction.
4. A change in relative motion of the Gorda plate 2.5-3 ma (ma = million years before present; my = million years) ago
resulted in internal deformation and subsequent coupling of
the southeastern corner of the Gorda plate with the
overriding North American plate (Silver, 1971; Wilson, 1986).
If the Gorda plate has been the cause of contractional
deformation in the overlying North American plate since the

56
change in plate motion, then a zone of deformation similar to
that existing north of Cape Mendocino at present probably
existed south of the present triple junction, in conjunction
with its migratory path, for the past few million years
(Kelsey and Carver, in preparation).
Local deformation might result from realignment of plate
boundaries (Dickinson and Snyder, 1979b). Such deformation is
occurring within the Gorda plate, where bathymetric information,
seismicity, and paleomagnetic stripes indicate local faulting and
bending related to realignment (Smith and Knapp, 1985; Silver, 1971).
At present, however, there is no evidence for recent folding or
faulting that would produce large amounts of vertical deformation south
of Cape Mendocino. No surficial features such as fault scarps, or
offset streams or terraces have been observed, so the uplift seems to
be of a more regional nature.
The styles of deformation presented in cases 2 and 3 have been
modeled as regional time-transgressive flexure of a thin, elastic
slab. In the case of lithospheric response to asthenospheric influx
(number 3 above), the total uplift would be ~he sum of that from
isostatic flexure and thermal expansion (Furlong, 1984). The model
predicts that width of the deformation zone is 100 km, as determined by
the dip of the subducted slab. Highest elevations would occur about 50
km inland from the San Andreas transform. Furlong (1984) calculated
total uplift response along east-west transects for time periods of 0,
1, 5, 10, and 15 rna since triple-junction passage. Total uplift 1 my
after triple junction passage is 1000-1300 m, depending on the value of
---------- ---- ------------------------------

57
flexural rigidity used in the calculations. Furlong assumes that
present altitude is controlled largely by the uplift response from
passage of the ~riple junction. This predicted response corresponds
well with the observed altitude pattern along the 400 N latitude (Point
Delgada), which was the approximate location of the triple junction 1
rna ago. Interestingly, the uplift rate determined from uplift of about
1200 m over a 1 my period is 1.2 mlka, which is very close to that
determined by McLaughlin et al. (1983a) for the past 45 ka from the
dated terrace at Point Delgada.
Calculations of the isostatic flexural response of the North
American plate to a northward-moving subducted l-km high fracture zone
(number 2 above; Glazner and Schubert, 1985) predict an east-west
trending flexure that is 700 m higher in topographic elevation south of
the fracture zone than to the north. The topographic bulge is
distributed 70-120 km over a north-south distance, thus creating a
regional slope of the land surface of 0.50 to the north. The edge of
this bulge would advance northward at the same rate as movement along
the Pacific-North American plate boundary. Again, the model fits the
modern analog--the topography and uplift history at the present-day
location of the triple junction. Regional slope of the land surface
north of Big Flat is 0.6 degrees over a distance of 45 km. An aspect
of the actual system that does not agree well with the model, however,
is the rapid decrease in uplift rates and altitude immediately south of
Big Flat.
Both flexural response models provide uplift mechanisms that
would create higher uplift rates in the wake of the triple junction and

58
regional uplift of an unbroken elastic plate. This would explain the
lack of structural evidence of failure by fracture. However, tensile
stresses calculated by Glazner and Schubert (1985) for the upper
surface of the flexed plate are well above the tensile failure strength
of crustal rocks, even though evidence of east-west fractures with
up-to-the-south movement does not exist near the present triple
junction.
Deformation associated with coupling of the North American and
Gorda plates, and a change in relative plate motion 2.5-3 ma (Silver,
1971; Wilson, 1986), has been suggested as the cause of Neogene
deformation east of the King Range, and Quaternary deformation north of
the present triple juncti~n location by'Kelsey and Carver (in
preparation). However, contractional deformation related to internal
deformation of the Gorda plate and coupling to the North American plate
may have occurred in what now forms the coastline south of the triple
junction, but its timing may have been prior to 336 ka, and thus is not
recorded by the terraces examined in this study.
Conclusions
The MTJ is a tectonically dynamic boundary, where changing
plate geometries and tectonic regimes dominate. Spatial variations in
uplift in the triple junction region for the past 45 ka were documented
previously from dated marine terraces. Analysis of the altitudinal
spacing of entire flights of marine terraces in this study indicates a
corresponding spatial pattern for the past 100 ka, with temporal
changes prior to then that may reflect initial response (accelerated
uplift) to oncoming changes in tectonic regime during triple junction

59
migration. The preferred correlations portray a pattern of increasing
rates of uplift from <1 mlka to 4-5 mlka in response to passage of the
triple junction. Accelerated uplift seems to occur during and after
the change in type of plate boundary. Uplift at the northernmost site
in this study, Bear River, has just begun to increase, and apparently
has not yet reached maximum values associated with passage of the
triple junction. The region .of most rapid uplift, 4-5 mlka, is 20-40
km south of the MTJ, between Smith Gulch and Big Flat. At Point
Delgada, 65 km south of the present MTJ~ where the triple junction
passed about I ma ago, uplift rates have been 1.3 mlka for at least 336
ka. Two rna after triple junction passage, at Fort Bragg, uplift rates
have been less than 0.3 mlka for at least 336 ka.
The rates and patterns of uplift determined in this analysis
agree well with those predicted by models of thermally and
isostatically driven flexure in response to changing plate
configurations. In one model, uplift is driven by isostatic adjustment
to the subducted Mendocino fracture zone. In the other, it is driven
by thermal and isostatic adjustment to effective lithospheric thinning
and asthenospheric upwelling at the base of the North American plate.
Although both mechanisms may contribute to total uplift, the prominent
peak in uplift near Big Flat, and rapid drop to the south, are best
explained by the response of North American lithosphere to
asthenospheric influx and subsequent isostatic adjustment, as described
by Furlong (1984).
~-----.~--.-----------------------

CHAPTER 3
A SOILS CHRONOSEQUENCE ON UPLIFTED MARINE TERRACES, NORTHERN CALIFORNIA
Introduction
Gently sloping marine terraces io northern California provide
excellent conditions for minimizing variations in non-temporal soil-
forming factors and for preserving the chronological record of soil
properties that vary as a function of time. Jenny, Arkley, and Shultz
(1969) recognized the value of the elevated northern California marine
terraces for soil chronosequences studies, noting especially the
"remarkable and fortunate mineralogical uniformity in the soil parent
materials • [that] are either weathering graywacke sandstone or
sandstone-derived beach materials and dunes" (p. 62). In this paper we
evaluate time-dependent changes in soil development on two flights
(Fig. 3.1 and 3.2) of northern California marine terraces that range in
age from 1.7 ka to more than 320 ka (ka = one thousand years before
present) •
Flights of marine terraces in coastal northern California exist
because the land is rising above the sea due to tectonic forces. Wave-
cut bedrock platforms formed during times of sea-level stability that
were associated with glacio-eustatic sea-level highstands. Terrace
destruction is prevented where shore platforms are riased above the
level of subsequent sea-level highstands. As sea level retreats, the
60

125'
42'
40°
38'
"tJ » o ~ o
Cape Mendocino
Fig.2e/
125'
124' 123' 122-· ______ 0.!l~Q.N ______ 42'
CALIFORNIA
+
+ 40'
+
+ 38°
SAN FRANCISCO
123' 122°
Figure 3.1. Location map of coastal northern California, study areas.
-------.--.---- ------------------
61
showing key

Figure 3.2. Topography, terrace flights, and soil sites for key study areas. a)Mendocino-Westport coast. Only the 200- and 400-foot (61- and l22-m) contours and isolated peaks are shown. b), c),and d)Composite topographic profiles at A and B at Mendocino-Westport, and C at Cape Mendocino-Punta Gorda. Position of bedrock marine platforms is shown relative to surface topography of terraces. Numbers refer to soil sites. C, J, R, F, H and L refer to labels for Mendocino terraces. Assigned terrace ages, in ka, are listed for Cape Mendocino-Punta Gorda terraces. e)Cape Mendocino-Punta Gorda coast. Only the 400-, 800-, and 1200-foot (122-, 244-, and 366-m) contours and isolated peaks are shown.

c o
• > D
iii
c. 'C '>IRRt* :=Pl;'U I 18-11' 123°411'
o IIKm
Contour Interval 200 Fe.t
(281
IT! I
300
200
400 100
0
12bl
800 :-\.200 .1\
400 .-\
-~ 1'00
0
(2cl
'OOf. ... 200 Om 0""~t\:!i' 1 '..,. to;"St' \ \ t 0
A 0 0 0.4 0.8 1.2
12dl
Distance, km
VE 2.3.
Figure 3.2. Topography, terraces, and soil sites.
Cape Mendocino
1{~~~4O.30'
'fl3 , 40-15. ,24·,11'
o IIKm , ,
Contou, Inle,yel 400 F •• t
1281
m '"

63
previously cut surface is mantled with beach and fluvial sands and
gravels that are the parent material of the soils we studied.
The rising land carries the marine benches, along with cover
bed deposits and relicts of marine biota, away from the effects of
salt-rich sea spray, wind-blown beach sands, mobile dune bodies, and
succesive sea-level high stands. Plants colonize and stabilize the
terrace surfaces, and drainage networks adjust to the new increment of
relief. Thus, with time, vegetative sequences succede one another,
relief increases according to the local uplift rate, eolian influx
decreases, and streams dissect the terrace surfaces. Although each of
these changes alters the non-temporal soil-forming factors, time is the
critical element, and significant differences in soil profile
development on nearly flat remnants of each terrace step are related to
the age of the terrace.
The two flights of terraces examined in this study have
.. different uplift rates and ages. The first, a flight of eleven
terraces north of Punta Gorda (Fig. 3.2c and 3.2e), was chosen for
detailed analysis. Soils on four of these terraces were studied; a
fifth pedon on a low terrace north of Punta Gorda, at Cape Mendocino,
is included in this chronosequence. Terraces in the Cape Me~docino
Punta Gorda area are being uplifted rapidly, and thus provide the best
site for a chronosequence study because 1) relatively young terraces
are preserved. providing critical data on early soil development,
2) all terraces have edaphically controlled (coastal wind and salt)
prairie vegetation, 3) the terraces are rapidly removed from the major

64
zone of wind-blown sand addition, and 4) the terraces extend only 1.2
km inland and are subject to similar microclimates.
Results obtained from the Cape Mendocino-Punta Gorda (CM-PO)
chronosequence were then compared with a less detailed analysis of a
flight of five marine terraces, with mostly older ages, 100 km farther
south near Fort Bragg, at Westport and Mendocino. The Mendocino
Westport (M-W) terraces are less satisfactory for studying time
dependent soil changes, because their low uplift rates do not provide
recent terraces, and the older terraces have been subjected to major
incursions of wind-blown sand. In addition, the older terraces extend
5-10 km inland, support coniferous vegetation, and probably receive
greater rainfall than younger terraces near the coast.
Scope
This paper focuses on development of a soils chronosequence on
uplifted marine terraces with similar site characteristics and age
control in the CM-PG area. Before describing this chronosequence,
primary soil-forming factors (Jenny, 1941) that influence soil
development in sedimentary deposits overlying marine platforms are
discussed within the general framework of the history of uplifting
marine terraces. These factors are physiography, climate, parent
material, time, and vegetation. Time is the critical, changing
variable in a chronosequence study, and thus is emphasized in the
following section. Variations in pH, and organic matter, clay, and Fe
and Al oxyhydroxide contents with both profile depth and time are then
presented. Useful time-dependent trends identified in the CM-PG
chronosequence are then compared with laboratory data from the M-W

65
terrace soils. In addition, we compare preliminary data from a nearby
marine terrace chronosequence at Eureka studied by Burke, Carver, and
Lundstrom (1986; unpub. data) with the CM-PG chronosequence.
Site Physiography
The CM-PG soil sites are located on gently sloping (generally
1-40 ) marine-terrace treads between 7 m and 300 m above sea level
(Table 3.1; Fig. 3.2c, 3.2e, and 3.3). At Punta Gorda, between
altitudes of 250-350 m above sea level, the landscape is similar to
that in the Fort Bragg area: broad marine terraces separated by low
risers slope gently westward. Below 250 m, a steep escarpment drops
seaward, and steep valley and gully walls are marked by landslides,
waterfalls, and masswasting. Small terrace remnants and prominent
notched spurs mark positions of past sea-level high stands.
We attribute this marked difference in landscape features to a
change from low to high uplift rates in latest Pleistocene time
(Merritts and Bull, in preparation; Chapter 2 of dissertation).
Acceleration in uplift rates only affects soil development in that
terraces reach higher altitudes more rapidly, and thus are moved into
areas of reduced affects of salt-spray and wind-blown sand. The range
of terrace altitudes probably has minimal influence on soil processes,
with exception of the role of salt spray and windblown sand at low
altitudes near sea level.
Climate
Present climate. Climatic characteristics are stabilized by
maritime influences, and are typical of a Mediterranean climate. Moist

Table 3.1. General description of soil site characteristics for Cape Mendocino-Punta Gorda and Fort Bragg-Mendocino-Westport soils.
Altitude, Age, Surface Subsurfae. Soli SU. Terrace m ka* Slop., degrees Drainage Vegetation
Cape Mf1ndoclno-Punta Gorda
5 7±1 1.7 3 Well drained Grass 4 78 30 2-8 Well drained Grass 3 111 40 4 Moderate Grass 2 252 94 2-4 Moderate Grass
297 120-133 <4 Moderate Grass
Westport 10w C 23 103 1-2 Moderate Grass 9w J 40±2 120-133 1-2 Moderate Grass 8w R 61±2 214 1-2 Well drained Grass
Mendocino 10m C 22±2 103 2 Somewhat poor Grass 9m J 42 120 2 Well drained Grass 8m R 58±2 214 2 Moderate RW-OF-H-CYt 7m F (86±3)# 320-336 2 Somewhat poor BP-RW-H 6m L 130±5°· 4051 4 Somewhat poor BP-RW-H
·Ages estimated with different techniques; see text for discussion. #Altitude of terrace from Westport survey, checked on 7.5' topographic map at Mendocino site. ··Altitude of terrace from 7.5' topographic map. tAbbreviations are: RW .. Redwood; OF.Douglas Fir; H.Hemlock; CY.Cypress; BP.Blshop Pine.
66

67
Figure 3,3. Punta Gorda coast~ View eastward shows prominent break in slope that separates two distinct landscapes: broad, gently sloping marine terraces above 250 m, and steep slopes with bedrock notches and small marine terrace-remnants on spurs. Arrows point to inner-edges of surfaces of terrace-remnants. Numbers refer to soil sites. Note modern (Holocene) marine platform forming at base of escarpment (active inner edge) .

68
maritime air masses moving towards the southeast from the Aleutian low
pressure system provide most winter precipitation. Local
climatological data are availabale at three coastal climatic stations
and one inland station that fringe the study area (Fig. 3.1): Fort
Bragg in the south, Eureka just north of the study area, Shelter Cove
midway between these two, and Honeydew (inland) on the Mattole River
(National Oceanic . and Atmospheric Administration, National Climatic
Data Center, local climatological data summaries, 1985).
Climatic data for each station are similar in that summers are
cool, foggy, and dry; mean monthly temperatures vary less than 60 C
throughout the year; and more than 90% of mean annual precipitation
occurs as rain during mild winters. However, although climatic
characteristics of Fort Bragg and Eureka are nearly identical (mean
annual precipitation 100-102 em; mean annual temperature 12-140 C),
the Shelter Cove and Honeydew noncontinuously operated supplemental
stations have greater mean annual precipitations: 165 em at Shelter
Cove, and 170-250 em at Honeydew. Greater precipitation at these
stations is related to the orographic effect of the 800- to 1200- m
high King Range, which extends northwest of Point Delgada for 60 km.
The CM-PG soil sites are at and north of the northern tip of the King
Range, thus they might receive more rainfall than Eureka or Fort Bragg,
but probably not as much as Shelter Cove, which is at the base of the
highest peaks in the King Range, or Honeydew, which is a valley station
on the east side of the King Range. The soil-moisture and temperature
regimes are characterized in this study as strongly seasonal xeric and
------ .... - -_ .. __ .

69
weakly seasonal mesic for both the CM-PG and W-M areas, although site
specific data are unavailable at present.
Pleistocene Climates. Although vegetation, temperature, and
precipitation changes during late Pleistocene glacial periods affected
coastal northern California, the coastal strip is considered a possible
ice-age refugium (Johnson, 1977), as vegetation changes were minimal.
During cooler climatic conditions, many cold-sensitive species
continued to thrive along the coast, and provided a refugium for those
that later moved inland and to higher altitudes, where habitats were
more altered by colder glacial conditions. Thus, rates of soil
formation might have varied during glacial and interglacial periods,
but the differences were muted by stabilizing maritime influences.
Parent Material
Sedimentary deposits overlying the bedrock shore platforms
provide the parent material for soil formation, and are remarkably
similar in composition. They consist of unconsolidated, well-sorted,
stratified eolian silt and sand overlying coarser deposits of
unconsolidated, well-sorted stratified littoral marine sands and pebbly
sands that grade with depth into coarser littoral gravels and cobbles.
These cover-bed deposits are derived from weathered bedrock of the
Franciscan Coastal terrane, which is dominantly arkosic sandstone,
siltstone, and shale (McLaughlin et al., 1982). The percent of
feldspar in the arkosic sandstone varies from I to 25% in the study
area (Bailey and Irwin, 1959). Gardner (1967) found the same mean
ratio of potassium feldspar to quartz (0.175) in the sand-sized
fraction of recent dune and beach deposits as in the unweathered C-

70
horizons of three older terraces near Fort Bragg sand and silt.
Composition and particle-soze of a sample of eolian and beach sand from
the back edge of the modern beach near Punta Gorda (Fig. 3.3) is used
in this study as a reference for comparison with particle-size and
chemical data obtained from soil material on the higher terrace
surfaces.
The most significant differences in initial parent material
conditions may be related to heterogeneities in the original thickness
of cover-bed deposits and relative proportions of eolian and littoral
deposits, rather than compositional variations. For example, at site
4, near Punta Gorda (Fig. 3.2b, 3.2e), the soil profile has developed
in a thin cover (0.41 m) of beach sands and gravels overlain by a
thicker section (0.94 m) of finer-grained eolian sands. This part of
the platform appears not to have been mantled with much beach sand and
gravel, but was chosen because only a l5-m wide remnant of the terrace
remains, thus no better sites were available. In contrast, soil
profiles at the other four sites have developed in thicker sections of
cover-bed depos its with greater amounts of Ii t toral beach sands and
pebbles than exists at site 4.
Marine Terrace Platform and Soil Parent Material Ages
Ages of the five CM-PG terraces span the past 120 ka (Table
3.1; Fig. 3.2b, 3.2e). The lowest terrace comprises part of Singley
Flat, a broad complex of gently seaward-sloping Holocene marine and
fluvial surfaces at Cape Mendocino. Radiocarbon dates of shell and
organic material from this terrace are about 1.7 ka (Lajoie, unpub.
data). Fifteen km south of Singley Flat, at Punta Gorda, ages were

71
assigned to 12 terrace remnants (Fig. 3.3) by correlating them with
dated worldwide glacio-eustatic sea-level high stands (Chapter 2;
Merritts et al., 1986; Merritts and Bull, in preparation; methodology
of Bull, 1985, and Bull and Cooper, 1986). The correlations were based
on altitudinal spacing analyses of shore-platform inner edges using the
sea-level chronology of Chappell (1983). Soils were sampled on two of
the escarpment terraces: . one with an inner-edge shore platform
altitude of 78m (site 2), assigned an age of 30 ka, and a second at III
m (site 3), assigned an age of 40 ka. Above the 250 m break in slope,
two soils were described and sampled on terraces with inner-edge shore
platform altitudes at 252 m (site 4; 94 ka), and 297 m (site 5; 120-133
ka) •
The age of a soil on a marine-terrace tread may approximate the
shore-platform age, but may also be substantially younger where the
cover-bed stratigraphy has been deposited during a long time-span since
terrace formation. Thus, only the maximum age of each soil is known
from the terrace age. Littoral beach sands and gravels deposited
during sea-level retreat after a sea-level highstand are essentially
synchronous with shore-platform formation. However, in addition to
times of primary sand deposition associated with an active beach,
secondary sand deposition occurs at a variety of times as a result of
eolian reworking of existing sands, and influx of atmospheric sands.
Eolian sands that cap the marine deposits may be up to tens of
thousands of years younger if they are associated with active beaches
during younger sea-level highstands. Furthermore, times of both
erosion and burial of the terrace tread may have ocurred during the

72
terrace's history. Wherever possible, our pedon description sites were
on nearly flat, undissected terrace treads with little evidence of
substantial deposition of younger materials above marine deposits
mantling the shore platforms.
Vegetation
Vegetation on all terraces examined at Cape Mendocino is
prairie bunchgrasses J scrubs, and wildflowers. Major (1977) attributes
the anomalous gap in the Redwood forest south of Cape Mendocino to
orographically driven downdrafts of offshore summer winds along the
front of the King Range that prevent fog from moving upslope and
inland. At Punta Gorda, however, the writers have observed summer fogs
moving up the escarpment to altitudes of 400 m. The unforested,
coastal grassland strip is probably due to this influx of salt-rich
marine air and associated high winds.
Investigative Approach
Previous chronosequence studies of soil profile development
have identified a number of properties that are time-dependent: pH,
amounts of organic matter and clay, thickness of B horizons, and
amounts of free iron oxides (crystalline and amorphous). pH has been
found to decrease systematically with age for many different soil
regimes (Bockheim, 1980). Many studies of young soils have shown
initial rapid increases in organic carbon with time, with stabilization
achiev~ within hundreds to thousands of years (Dickson and Crocker,
1953; Syers, Adams, and Walker, 1970; Birkeland, 1984). Clay
accumulation and formation of an argillic horizon with time has been
-------------

73
documented for many
(Birkeland, 1984).
parent materials and in many . climatic regimes
An increase in the amount and thickness of clay in
Bt-horizons in marine terrace soils in xeric coastal areas has been
demonstrated in northern Califonia, north of Cape Mendocino at Eureka
(Burke et al., 1986), and in southern Oregon (Janda, 1970). This
investigation focuses on pH, organic matter, clay, and Free Fe and Al
oxyhydroxide contents to determine time-dependent trends.
Recent developments in soil chemistry and extraction techniques
have shown that analysis of forms and amounts of secondary free Fe and
Al oxides is useful for interpreting degree of soil development and
establishing relative age control (McKeague, Brydon, and Miles, 1971;
Childs, Parfitt, and Lee, 1983; Arduino et al., 1984; McFadden and
Hendricks, 1985; Arduino et al., 1986). Various extraction techniques
approximately isolate different forms of iron, and less approximately
different forms of aluminum (McKeague et al., 1971). Organically bound
forms of Fe and Al are extracted with NH4-pyrophosphate. Oxalate-
extractable Fe and Al are a combination of both organic Fe- and Al
complexes and amorphous inorganic sesquioxides, thus the latter can be
determined by calculating the difference between the percents obtained
from each extraction method. Percents of finely divided crystalline Fe
and Al oxides can be obtained from the differences between dithionite
and oxalate-extrable Fe and AI, as dithionite extraction measures all
crystalline, weakly crystalline, amorphous, and organic forms of Fe and
Al in the sample that are not bound in silicate minerals.
A number of studies have successfully used amounts of extracted
forms 'of Fe and Al oxyhydroxides in soil chronosequence investigations
.- _ .. _---_._---- ------------------- ---

74
(Kneupfer, 1984; Arduino et aI, 1984; McFadden and Hendricks, 1985).
In semiarid and xeric moisture regimes in southern California, Feo and
Fed accumulate slowly over 1 million years (McFadden, 1982). In the
southern California chronosequence and in soils developed in a variety
of unconsolidated sedimentary deposits in humid moisture regimes in New
Zealand (Kneupfer, 1984), Feo increased less rapidly than Fed, possibly
because Feo converted. to more ordered, crystalline structures with
time. In New Zealand, amounts of Feo and Alo actually began to
decrease at about 12 ka. In Italy, Arduino et al. (1984) were able to
reliably estimate relative ages of 19 previously dated alluvial
terraces from amounts of extracted forms of Fe oxyhydroxides. On
progressively older terraces, Feo decreased and Fed increased, thus the
difference between the two correlated closely with terrace ages.
Soil Site Selections and Methods
Site Selections
Each site was carefully chosen after traversing the terrace
surface and examining test pits and auger-holes. Colluvial deposits
are common near the inner-edges of terrace treads, where the ancestral
sea cliff meets the terrace and material drained from adjacent higher
terraces accumulates. These deposits were easily identified by the
presence of angular rock fragments, and such sites were not used. The
midsection of a terrace tread is preferable to its lateral and outer
edges, where erosion and lateral drainage are most effective. Four of
the sites were hand-dug rectangular pits located on the midsections of
terrace treads (sites I through 4; Fig. 3.2c and 3.2e; Table 3.1),

--I
75
Site 5 was excavated from the face of a low sea cliff at Singley Flat.
Methods
Soil horizons were described in the field and samples were
analyzed in the laboratory.
of the Soil Survey Staff
Soil descriptions follow the conventions
(1975). (Complete field descriptions and
results of additional laboratory analyses are contained in Appendix B).
Bulk density measurements of each horizon were made with cone samples
collected with a cylinder (volulimeter) of known volume. Percent
gravel «2 mm) wa~ estimated in the field and the laboratory with a
sieve.
Clay contents of the Cape Mendocino soils were determined
following complete separation of the clay from the sand and silt
fractions after pre-treatment to remove organic matter (Jackson, 1956).
pH values were measured with a glass electrode pH meter on both 1:2
soil:water and soil:O.Ol M CaCl suspensions. The heat of dilution
method described by Metson et al. (1979) was used for determining soil
organic carbon. Dithionite-citrate, ammonium oxalate, and sodium
pryophosphate extractions wre made according to the procedures of the
Soil Conservation Service (1984), Schwertman (1973), and McKeague
(1967), respectively. The extracted Fe, AI, Mo, and Si were determined
by atomic absorption analysis using an Instrumentation Laboratory (It)
Video 12 spectrophotometer.
Descriptions of Soil Properties
Field descriptions and laboratory analyses of iron, aluminum,
organic carbon, and clay contents, particle size, and pH are summarized
in Tables 3;2 and 3.3. Soils are grouped in each table from youngest
----- - -----------

Table 3.2. Field descriptions of Cape Mendocino-Punta Gorda soil properties.
COLOR IIiATRI!} COLOR IIiOTTLESI CONSISTENCE OIIAVEL CLAY SOIL HORIZON DEPTH TEXTUREt DRY WET IIOTTLES DRY WET DRY IIOIST WET STRUCTURE %, Size FlLIlS NODULES
• All 0-22 I 2.5Y4/2 2.5Y312 10 10 oo.po ag 0.0 ncn (1.7 Ita) 1.12 22-48 II 2.SY4/2 2.SY3/2 10 10 oo.po ag 0.0 ncn
AI3 48-U II lOYR4/2 lOYR3/2 10 vfr oo.po ag 0.0 none Aam u-ao II IOYR412 10YR312 III 10 vir oo,po lmabk 0.0 ncn 3mp, Un Btflrm 80-07 II 7.SYR4/a II ""iP 2mahk 0.0 I nbr 3n"f>,1In IIC1IOX 87-IIS II 10YRS/I lOYR4.S/2 Ih fr oo,po Ulbk 0.1 ncn 1IC120. 115-125 II 2.SYS/2 2.5Y312 Ih fr oo,po mllmlbk 0.0 ncn
f AI 0-7.8 II 10YR2JI.S vfr D,IP Imgr 0.4 ncn (30 Ita) 1.2 7.a-22.0 II lOYR3/1 lOYR2J1 00 vir ",IP llabk I.a ncn
ABI 22.8-38.1 II lOYR3J1 lOYR2J1 00 vir D,IP U-mlbk 1.2 none AB2 38.1-5S.8 II 10YR2J1 vir .. ,po lmabk 2.0 ncn AB3 55.0-73.7 II 10YR2J1 Ir IO,pO lmabk 1.1 I nbr AB4 73.7-84 II 10YRII D,IP m 1.7 Inbr ABII 84-114.3 II 10YR2J1 rr "Ip m 5.4 I npopl ABI2 114.3-135 I lOYR2.511 II I,p m 8.4 2 mk po;2 n br
I AI 0-5 IOYR412 IOYR311 III Ir IO,IP II-vllbk:lmgr 11.4 none (40 Ita) 1.2 5-12.7 lOYR412 10YR212 Ih Ir D,,,, U-vllbk:lmgr 7.5 none
AS 12.7-30.S ad IOYR412 10YR212 III Ir I,,,, lmabk 8.3 2npoplbr ABII 30.5-43.2 lei IOYR512 lOYR212 Ih Ir I,,,, lI·vllbk 7.5 2npoplbr ABI2 43.2-S3.3 ad 10YRS12 lOYR212 Ih fr I,IP II-vflbk 10.8 2npoplbr BII 53.3-73.7 ad IOYR513 10YR312 III Ir I,IP lmabk 10.4 2npl BI2 73.7-104 vklel loYRS/4 lOYR4/3 h II I,IP 2mprl2mabk 43.2 3mkpopf BCI 104-147.3 vkl IOYRS/4 IOYR5J4 ed lOYR518 h fl D,IP m 38.S 2npopf Ccv 147.3-172.7 vgll lOYRa/a IOYRS/4 III fr IO,IP m 70.11 ncn 3p,IIn. Fe 2Rr 172.7.
I AI 0-10 cI IOYR412 lOYR212 Ih Ir I,p lIabk:2mgr 3.3 nona (84 b) ABII 18-44 cI IOYR411 10YR2J1 00 fr I,p 2f-mlbk:2mgr 4.1 Inpopl
ASI2 44-al eI lOYR412 10YR212 III fr I,p 21-mlbk 3.a 2mkpopf BII 81-07 eI 10YRa/a IOYR5/5 led lOYR518 h II I,p 21-mpr 2.11 2mk po plbr BI2 117-132 I lOYR7/4 IOYR8/a led Fe:11p lin 7.5YR5I8, 818 h II I,p 2f-mlbk;2mprJ3mabk 1.7 3l1"li po pfbr Bel 132-182 I IOYRa/4 lOYRa/a 2md Fe;2cd Un 10YRS18 h II-vII I,p 2mahk 2.8 3kpoplbr BC2 182-270 gill IOYR8/4 10YRS/. 3mcIFe lOYR5/S h II-vII U,IP m 3.0 2kpopl 1111 Un C 270-320 ad 5Y811 I,p
f AI O-IS lei lOYR212 10YR212 vh fr l,p 2mobk 1.7 ncn (120- 1.2 15-33 ad lOYR212 10YR212 Ih-ll Ir I,p 21-mlbkJ2mgr 1.11 ncn
133 Ita) AS 33-S3 I IOYR3/2 lOYR312 Ih Ir I,p 21-mlbkJ2mgr 3.3 2mkpopl ABII 83-00 ad 10YR212 10YR212 Ih fr I,p 2f-mlbkJ2mgr 4.3 2 l1"li po pf ABI2 00-128 1Ie1 10YR312 IOYR312 III Ir I,p 21-mlbk 1.0 2mkpopf BII 128-173 lie lOYRS/4 lOYRa/4 vh II I,Vp 3eprJ3elbk 0.0 3kpopl BI2 173-200 I IOYR5/4 IOYRS/4 1ccfFe;1cg 10YRllla, 8/2 h " I,p 3abk 5.8 3kpopf led Un BI3 200-231 I 7.5YRet8 7.5YR518 _%Flcott lOYRal2 vh ell I,p m 10· 3kpo 3mdUn Bt4 231-248 I 7,SYR7/8 7,SYRS18 h-vh II I,p m 2.1 3kpo 2-3111 Un Erg 24a-257 I 2.SY8/4 2.SYa/4 h-vh II I,p m 5.8 3kpo BC 257·282 In IOYR7/3 lOYRS/3 2cdFe 7.5YRs/8 h-vh II I,IP m 35-40· Upo
AbbrlVlalona acccrdng tI USDA ScI Suvoy SlaW, 11I7S. ·GrI .. 1 perea .. II Iold llIImalt.
'-I tTIIILnI orl 11-'" 110m lofcf _III and IabonoIDly mu",,"menl 01 % elay. ttce-.t. 0\

77
Table 3.3. Sununary of laboratory properties of Cape Mendocino-Punta Gorda soil properties.
Orllini. D'''''o""...,I/,.,. a".' ... Soli 81te Depth, 0111 " C'., pH, .... r lilt. CIICI2 CorMn, " " F. "AI " F. " AI
BOlICh SMfI 1.1 7.53 8.32 0.0' 0.083 0.33 0.17
II 0-22 2.1 8.89 5.73 0.93 0.09 0.061 0.29 0.11 22-48 1.2 7.20 B.38 0.28 0.12 0.093 0.33 0.13 48-B5 1.2 7.40 B.59 0.24 0.08 0.068 0.24 0.07 85-80 2.8 7.31 8.59 0.40 0.54 0.120 0.40 0.11 80-97 2.8 7.12 8.47 0.53 2.91 0.080 1.73 0.09 97-115 4.9 7.28 8.19 0.40 0.33 0.071 0.28 0.09 115-125 5.0 7.08 5.9B 0.28 0.21 0.080 0.18 0.08
0-7.8 7.5 5.42 5.01 4.88 0.84 0.19 0.34 0.17 7.8-22.9 7.4 5.45 4.74 2.84 0.89 0.23 0.35 0.18
22.9-38.1 7.1 5.87 . 4.85 2.53 0.82 0.22 0.39 0.18 38.1-55.9 B.7 5.83 4.97 2.08 0.70 0.18 0.40 0.19 55.9-73.7 B.7 5.92 5.00 1.77 0.66 0.19 0.37 0.18 73.7-94 8.9 6.13 5.07 1.36 0.63 0.17 0.35 0.16 94-114.3 9.8 5.92 4.80 1.39 0.72 0.21 0.35 0.20 114.3-135 18.1 5.72 4.93 1.43 0.77 0.24 0.39 0.25
3 0-5 20.0 4.79 4.32 5.98 1.2B 0.34 0.37 0.30 5-12.7 22.1 4.94 4.53 4.83 1.23 0.33 0.34 0.30
12.7-30.5 21.7 4.91 4.31 3.29 1.27 0.35 0.35 0.34 30.5-43.2 23.4 5.23 4.47 2.89 1.35 0.38 0.37 0.36 43.2-53.3 21.1 5.09 4.35 2.78 1.43 0.41 0.37 0.38 53.3-73.7 22.4 5.29 4.40 1.86 1.80 0.40 0.32 0.38 73.7-104 22.2 5.31 4.54 0.89 1.22 0.29 0.23 0.32 104-147.3 17.1 5.42 4.57 0.78 1.25 0.29 0.23 0.30
147.3-172.7 10.7 5.38 4.84 0.33 1.43 0.27 0.38 0.22
2 0-111 31.5 4.82 4.40 6.33 1.63 0.93 0.70 0.88 19-44 33.1 5.12 4.39 4.93 1.90 0.90 0.89 0.87 44-81 31.9 5.28 4.57 4.01 1.90 0.82 0.72 0.87 81-97 28.9 5.87 4.56 0.74 1.63 0.87 0.60 0.73 97-132 28.7 5.17 4.42 0.27 1.67 0.37 0.39 0.42
132-162 18.4 5.19 4.51 0.16 1.50 0.28 0.55 0.32 182-270 19.6 5.22 4.57 0.08 1.33 0.19 0.47 0.24 270-320 0.27 0.12 0.22
0-15 31.2 5.31 4.59 8.03 2.00 0.77 0.84 0.72 15-33 32.7 5.28 4.50 5.34 2.01 0.79 0.64 0.77 33-83 25.6 5.35 4.46 4.44 2.00 0.83 0.69 0.80 63-90 32.8 5.43 4.87 3.27 1.93 0.78 0.65 0.74
90-128 28.4 5.57 4.50 1.82 1.90 0.72 0.84 0.71 128-173 40.1 5.09 4.50 0.15 2.13 0.39 0.10 0.25 173-200 22.7 5.33 4.65 0.04 1.39 0.23 0.09 0.14 200-231 22.5 5.78 5.02 0.04 4.61 0.49 0.58 0.18 231-2411 25.4 5.62 5.07 0.02 4.19 0.37 0.45 0.15 2411-257 18.1 5.84 5.18 0.01 0.39 0.19 0.08 0.09 257-282 10.3 8.20 5.43 0.01 0.40 0.11 0.11
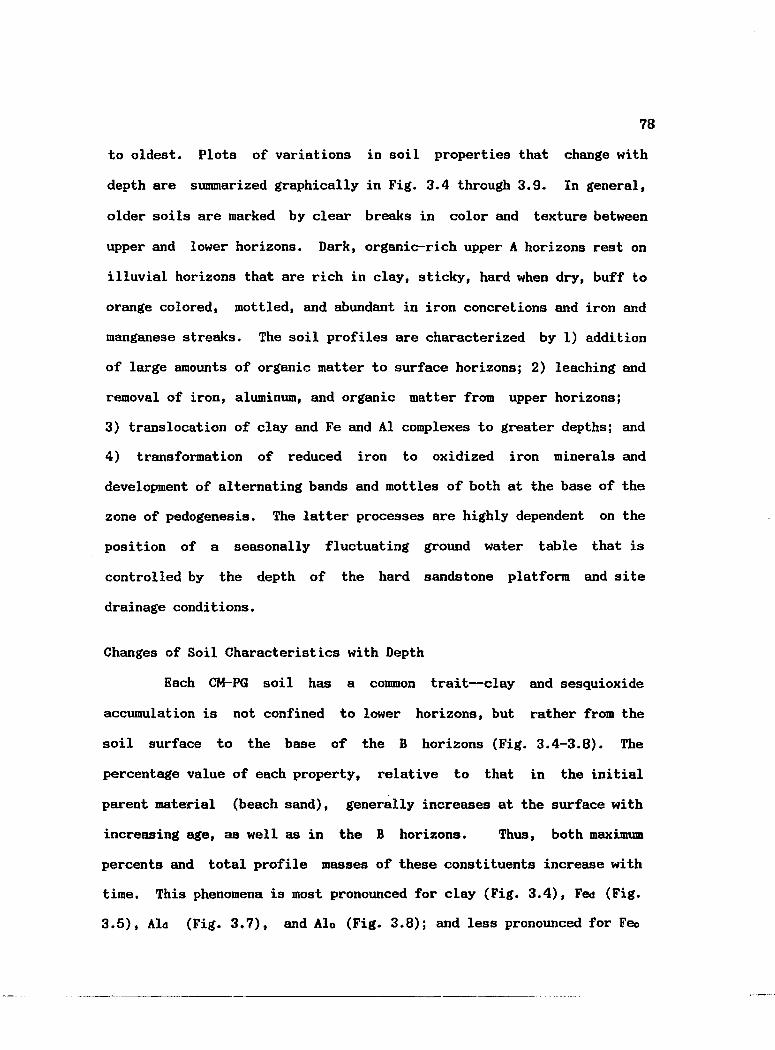
78
to oldest. Plots of variations in soil properties that change with
depth are summarized graphically in Fig. 3.4 through 3.9. In general,
older soils are marked by clear breaks in color and texture between
upper and lower horizons. Dark, organic-rich upper A horizons rest on
illuvial horizons that are rich in clay, sticky, hard when dry, buff to
orange colored, mottled, and abundant in iron concrelions and iron and
manganese streaks. The soil profiles are characterized by 1) addition
of large amounts of organic matter to surface horizons; 2) leaching and
removal of iron, aluminum, and organic matter from upper horizons;
3) translocation of clay and Fe and Al complexes to greater depths; and
4) transformation of reduced iron to oxidized iron minerals and
development of alternating bands and mottles of both at the base of the
zone of pedogenesis. The latter processes are highly dependent on the
position of a seasonally fluctuating ground water table that is
controlled by the depth of the hard sandstone platform and site
drainage conditions.
Changes of Soil Characteristics with Depth
Each CM-PG soil has a common trait--clay and sesquioxide
accumulation is not confined to lower horizons, but rather from the
soil surface to the base of the B horizons (Fig. 3.4-3.8). The
percentage value of each property, relative to that in the initial
parent material (beach sand), generally increases at the surface with
increasing age, as well as in the B horizons. Thus, both maximum
percents and total profile masses of these constituents increase with
time. This phenomena is most pronounced for clay (Fig. 3.4), F~ (Fig.
3.5), AId (Fig. 3.7), and Alo (Fig. 3.8); and less pronounced for Feo

79
Clay, %
0 10 20 30 40 0 • • • • .,.. , , , , , , ,
~ .. ., 4 80 = " , , ....... , , , .,
!
Depth, 5 160 em
3
240
1 320
Figure 3.4. Changes in clay content with depth, Cape Mendocino-Punta Gorda soils. Numbers refer to soil sites, from oldest to youngest: Site 1, (120-133 ka)j Site 2, (94 ka)j Site 3, (40 ka)j Site 4, (40 ka)j Site 5, (1.7 ka).
--_._-----------------

o o
80
Depth, 160 em
240
320
1
5
1
Fe(d),%
2 3 4 5
• .1
2
Figure 3.5. Changes in Fed content with depth, Cape Mendocino-Punta Gorda soils. Site I, (120-133 ka)j Site 2, (94 ka)j Site 3, (40 ka)j Site 4, (40 ka)j Site 5, (1.7 ka).
80

o
80
Depth, 160 em
240
320
o Fe(o),%
0.4 0.8 1.2 1.6 2
5 ..••.•.... ~ ....................... -.....•. ,
t~~~i··········································l
Figure 3.6. Changes in Feo content with depth, Cape Mendocino-Punta Gorda soils. Site 1, (120-133 ka)i Site 2, (94 ka)i Site 3, (40 ka)i Site 4, (40 ka)j Site 5, (1.7 ka).
81

% AI (d) 0 0.2 0.4 0.6 0.8 1
0 • i • • • ' ...... , ....... r , , , , ... • • , ..... , 80
, 2 ,. .. , , ,-
...... ...1 • ,
.! !
5 4 Depth, 160
em
240
320
Figure 3.7. Changes in AId content with depth, Cape Mendocino-Punta Gorda soils. Site 1, (120-133 ka)j Site 2, (94 ka)i Site 3, (40 ka)j Site 4, (40 ka)j Site 5, (1.7 ka).
82

o
80
Depth, 160 em
240
320
o , , : . ., • • • ,. ........ !
• • l1li, ....
: ~ .. , , , I :~
5
1
AI(o), 0/0
0.2 0.4 0.6 0.8 1
2
Figure 3.8. Changes in Ala content with depth, Cape Mendocino-Punta Gorda soils. Site 1, (120-133 ka); Site 2, (94 ka); Site 3, (40 ka)j Site 4, (40 ka)j Site 5, (1.7 ka).
83

o
80
Depth, 160 cm
240
320
o 1
Organic Carbon, %
234 5 6
; .............................. ..1-. r---;'" ---'
2
1
Figure 3.9. Changes in organic carbon content with depth, Cape Mendocino-Punta Gorda soils. Site I, (120-133 ka)j Site 2, (94 ka)j Site 3, (40 ka)j Site 4, (40 ka)j Site 5, (1.7 ka).
84

85
(Fig. 3.6). In contrast to the laboratory data, certain morphological
properties described in the field (primarily structure, consistencies,
and clay films) indicate an increase in clay with depth for all soils
(Table 3.2).
The plot of clay content with depth (Fig. 3.4) indicates that
accumulation of clay in illuvial horizons is distorted by two
processes: eolian influx and a fluctuating groundwater table controlled
by the position of the marine platform. Addition of fine-grained
eolian material to the terrace surface provides sand with highly
weatherable minerals that might increase clay content in upper
horizons, and provide additional clay for translocation to pedogenic B
horizons. Organic matter
permeability, so that these
might stabilize the clay, or reduce
constitutents are moved slowly from the A
to B horizons. These processes have affected every terrace soil
examined in this study, and are especially marked at sites 1, 2, and 3
(Fig. 3.4; Table 3.3). Similar processes probably are affecting
distribution of Fe and Al oxides (Fig. 3.5-3.8).
The high content of clay, relative to Fe and Al oxides at the
base of the 30-ka terrace (site 4) is attributable to particulate
accumulation on the sandstone platform. Clay can be transported as
particulate matter, whereas Fe and Al are carried as solutes and are
more easily removed from the system with lateral drainage along the
impermeable bedrock barrier.
A seasonally fluctuating ground water table above the bedrock
platform complicates interpretations of soil genesis and time
dependent trends. Winter rains begin in October, and 93% of mean
- " "-"----------

annual precipitation occurs in the next eight months.
86
Water
accumulates at the relatively impermeable groundwater/bedrock barrier,
and the local water table begins to rise and soak the soil profile. In
late Spring, monthly rain decreases and by mid-summer potential
evapotranspiration exceeds rainfall, the soil water table declines, and
the soils are dessicated. At the bottom of the section of cover-bed
deposits, as. groundwater moves up and down, new material may be added
to the base of the soil profile, or existing material may be dissolved
and removed. Dissolved matter may be precipitated lower in the
section, and then transported upward during a later groundwater table
rise.
The thickness of the cover bed strata is critical to ground
water/soil interactions. In a thin sedimentary section, pedogenic and
groundwater processes will overlap. In a thicker section, overlap may
not occur until the soil is tens of thousands of years old and has
become thicker during profile development. At Singley Flat (soil site
5, 1.7-ka terrace), the sedimentary section is less than four m in
depth. Lateral groundwater flow during May, in 1986 and 1987, was
marked by a prominent, iron- and manganese-enriched, red seepage zone
near the base of the soil profile (Table 3.3, Fig. 3.5, 80-97 em
depth). The position of the water table appears to be influenced by an
increase in clay from 2.8 to 5% below the seepage zone, as well as by
the bedrock platform 2.5 m below the base of the profile. The
localized concentration of iron and manganese at this site is greater
than that in any higher Punta Gorda terrace soil sampled. Similar
groundwater/soil interactions have probably occurred in each terrace

87
soil during its history, thus we view total profile masses of Fe, AI,
and clay of each soil profile as general indicators of soil age,
despite spatially localized concentr~tions.
Soil Development and Time
Time-Related Properties
Key properties that show significant trends with time in the
CM-PG soils chronosequence are a decrease in pH and an increase in
organic carbon in A horizons; an increase in thickness and maximum clay
content of the Bt horizons; and an increase in total profile weight of
accumulated clay, Fed, AId, and Alo (Table 3.4). Total weights of
quantities of accumulated constituents were calculated for each profile
(Appendix B, Note I), relative to initial weights of each in the parent
material (stratified beach sand sample from Punta Gorda).
A-horizon properties approach stable conditions more rapidly
than B-horizon properties. Soil pH in the upper 20 em of the soil
profile decreases from 7.53 in beach sand parent material to 4.89 at 40
ka (Fig. 3.10). It then remains fairly constant, and appears to have
reached a steady state. Maximum amounts of organic carbon occur
primarily above 70 em, although it is found throughout profile depths
(Fig. 3.9). Whole profile organic carbon content increases rapidly to
3.5 g/~ in the first 40 ka, and less rapidly to 5.0 g/~ on the 120-
l33-ka terrace (Fig. 3.l0). The curve is tending toward steady state,
but has not yet achieved it. If total weight of organic carbon for the
top 70 em of each soil is plotted with time, steady state again appears

Table 3.4. Swmnary of soil properties that vary.with time, Cape Mendocino-Punta Gorda and Westport~endocino soils.
Or". Carbon Or". Carbon. Tolal TOlal TOlal Tol.1 Tol.1 ..... mum "/om2.act. "/cm2-ac. pH (H2O) Clay n (d) Fe(o) AI (d) AI (0) "axlmum "ulmum Thloknna B
5011 Silo Horizon DOI!'h, cm Tolal Profllo TOI! 70 cm Toe 20 em g/em2-ac g/om2-tlc g/cm2-ac II/em2-ac II/em2-ac Cia]!, '!I. Fo, '!I. Horlzons-. em
CAPE MENDOCINO-PUNTA GORDA
S.lICh s.nd 0.000 0.000 7.53 1.54 0.110 0.005 0.001 0.002 1.1 0.08
II All 0·22 0.288 0.473 8.89 0.24 0.003 -0.012 -0.007 -0.018 (I.Tb) A12 22-48 0.102 0.00 0.015 0.000 0.004 -0.015
A13 48·85 0.057 0.00 0.000 -0.021 -0.004 ·0.024 ABmn 65-80 0.084 0.27 0.097 0.015 0.008 -0.013 0.54 BI. 80·97 0.128 0.35 0.674 0.333 ·0.001 -0.019 2.91
Blox 97-115 0.101 0.90 0.063 -0.018 -0.003 -0.020 18 BCtox 115·125 0.038 0.51 0.018 -0.024 -0.003 ·0.013 5.0 10
Tot.1 0.712 2.2' 0.'70 0.273 -0.006 -0.112 2M
4 Al 0·7.8 0.445 2.303 5.42 0.54 0.050 ·0.004 0.008 -0.003 (3D Ir'; A2 7.6-22.9 0.511 1.08 0.108 ·0.008 0.024 ·0.003
ABI 22.S·38.1 0.493 1.11 0.104 0.007 0.025 0.001 AB2 38.1·55." 0.507 1.31 0.151 0.017 0:024 0.005 AB3 55.9-73.7 0.438 1.32 0.143 0.010 0.028 0.002 AB4 73.7·94 0.388 1.55 0.154 0.008 0.024 ·0.003 ABI1 94·114.3 0.374 2.22 0.172 0.005 0.034 0.008 20.3 ABI2 114.3·135 0.378 4.11 0.181 0.018 0.041 0.021 16.1 0.77 20.7
Tot.1 3.112' U.22 1.013 O.DIIt 0.201 D.DZB 41
3 Al 0-5 0.282 2.529 4.79 0.80 0.051 ·0.004 0.010 0.003 (40 Ir'; A2 5-12.7 0.412 1.78 0.097 -0.004 0.020 0.009
AB 12.7-30.5 0.697 4.30 0.251 ·0.001 0.055 0.033 ABU 30.5·43.2 0.409 3.08 0.177 -0.002 0.040 0.023 23.4 12.7 ABI2 43.2-53.3 0.275 1.112 0.132 ·0.005 0.030 0.014 10.1 BI1 53.3-73.7 0.395 4.98 0.360 -0.008 0.074 0.047 1.80 20.4 812 73.7-104 0.199 4.65 0.254 -0.028 0.045 0.031 30.3 BCI 104-147.3 0.270 5.41 0.402 -0.043 0.069 0.028 43.3 Ccv 147.3-172.7 0.034 0.97 0.140 0.003 0.019 0.005
Tot., 2.fllS3 27.'7 I.Bl4 -0.0112 0.312 0.111 ttl.'
2 AI 0-19 1.048 2.907 4.82 4.87 0.282 0.031 0.304 0.102 ~Ir'; ABI1 19·44 1.183 7.49 0.429 0.055 0.188 0.152 33.1 1.90 25
ABI2 44·81 0.592 4.40 0.262 0.031 0.102 0.089 1.90 17 BI1 81-97 0.337 12.48 0.702 0.111 0.284 0.249 38 812 87·132 0.121 11.30 0.708 0.015 0.125 0.108 35 001 132-182 0.101 10.72 0.893 0.123 0.120 0.087 SC2 182·270 0.071 21.62 1.460 0.166 0.127 0.083 C 270·320 en
Tot.1 3.453 72.BB 4.7$1 0.1132 1.230 D.'" 113 en

Table 3.4. (Continued. )
Org. C.rbon Org. C.rbon. Tot.1 Tot.1 Tot.1 Tot.1 Tot.1 Maximum g/cm2-.ct. g/cm2-ac. pH (H20) CI.y F. (d) F.(o) AI (d) AI (0) Maximum Malmu.. Thlckn ... 8
San SII. Horizon Depth. _em _Tot.L~ro'll. Top 70 em Top 20 em g/cm2-ac a/cm2-ac a/cm2·ac a/cm2·sc a/cm2 .... c Clay. '" _f-. '" Horlzons-, em
1 (120·133 Ita)
A1 A2 AS
ABt1 ABI2 Bt1 BI2 BI3 SI4 ID;t EC
MENDOCINO-WESTPORT U.. BCI
(103 U) ,.. SI2
(120 0) ,.. BC1
(214 U) • Siv
(405 01)
0-15 15-33 33·63 63-90 90-128 128-173 173·200 200-231 231-248 246·257 257-282 Tot.'
2411-420
511-94
147-183
50.8·911.1
tsc II abbraviatian lot IOn column.
0.975 3.328 5.31 0.846 1.288 0.144 0.958 0.094 0.016 0.015 0.004 0.002 0.004
II_D4'
·S hoIizona u uMd in !hie table rel.1I 10 horizons wkh plIIlIOunOtd lICCumulatian of clay.
4.78 4.87 8.88 7.94 14.25 24.20 8.78 8.15 5.32 3.00 3.23
11.4D
0.308 0.036 0.107 0.300 0.020 0.105 0.548 0.068 0.207 0.470 0.049 0.166 0.959 0.163 0.335 1.280 -0.144 0.192 0.538 -0.081 0.064 1.734 0.104 0.160 0.907 0.031 0.085 0.057 -0.037 0.022 0.117 -0.057
7.211 D.150 1.423
0.081 0.080 0.163 0.130 0.284 0.050 40.1 -0.004 0.012 -0.002 -0.009 -0.011 ·0.774
38.11
30.6
31.8
51.8
4.61
5.9
2.82
4.33
5.07
27 38 45 27 31 15
113
178
152
158.4
OJ \0

8 8
CQ -6 6 n 3
• ,fIJ ::E
• til (I)
• o _ . ::CQ
:c 4 4 n~ a. o ~
• ---D c . - -0- 3
~-- ::l
2 ~ 2
/ /
0 0
0 40 80 120 160
Time, ka
• pH, lop 20 em
-0- Organic Carbon, lop 70 em
-_. - Organic Carbon, whole profile
Figure 3.10. Trends in A-horizon properties with time for Cape Mendocino-Punta Gorda soils: pH (H2O), total profile weight of accumulated organic carbon, and weight of accumulated organic carbon in the top 70 em of soil. Curves are estimated by eye.
------------------- ---
90

91
to be achieved within 40 ka, although the two highest soils still have
slightly higher values (Fig. 3.10).
B-horizon properties approach nonvarying, stable conditions
more slowly than do A-horizon properties. Trends of AId and Alo
indicate nonlinear increases from near zero to 1.2 and 0.9 g/~-soil
column, respectively, in the first 94 ka, with little variation
thereafter (Fig. 3.11). However, Fed increases linearly throughout the
sequence, with no indication of decreasing rates of accumulation (Fig.
3.11). Clay content also increases linearly, from 2.3 g/~-soil
column in the 1.7-ka terrace soil to 91.4 g/~-soil column in the 120-
133-ka terrace (Fig. 3.12). Oxalate-extractable Fe has no consistent
trend with time (Tables 3.3 and 3.4), and is not shown in graphical
form. other workers have found irregular variations in Feo with time,
and have attributed them to alteration of amorphous iron to more
ordered crystalline structures with time (e.g., Kneupfer, 1984).
Comparison of Cape Mendocino Chronose9uence with Mendocino-Westport Soils
Increases with time of properties such as thickness of B
horizons and maximum horizon values of percent clay, organic carbon,
and Fed agree fairly well with trends established from calculated
quantities of accumulated constituents. Comparison of these properties
between the M-W and CM-PO soils is useful, because the age range of the
M-W terraces is 103-ka to 405-ka (?), thus soils OD these terraces
provide information on overlapping and longer periods of soil
development than those at CM-PG, where the oldest terraces are 94 ka
and 120-133 ka.

8
c E
6 :J "0 u
1 4
• N
E 2 .!:! tJ)
..;
.c 0 tJ)
~ -2
IZI I.:J ('} __ ----o-
--------~ ---40 80
Tlme,ka
120
--a-- Fe(d)
_0- A/(d)
____ A/(o)
92
160
Figure 3.11. Trends in B-horizon properties with time for Cape Mendocino-Punta Gorda soils: total profile weight of accumulated Fed, AId, and Ala. Best-fit lines from linear regression analysis are: Fed) y = 0.04 + 0.05x, R = 0.98; AId) Y = -0.09 + O.Olx, R = 0.99; Ala) y = -0.14 + O.Olx, R = 0.95 •
..... _._----------

c E ~
'0 u
'0 U) •
N
E ~ t» >: CIS (j
100
80
60
40
20
40
y=-2.91 +O.76(x) (R=O.99)
80
Time, ka
120 160
Figure 3.12. Total accumulated weight of clay with time for Cape Mendocino-Punta Gorda soils.
93

94
Terrace Ages
Soil development was studied on five terraces that range in
altitude from 22 to 130 m between Mendocino and Westport. These five
terraces have been mapped and labeled by earlier workers as the "C",
"3", "R", "F", and "L" surfaces (Fig. 3.2; Kilbourne, 1986). Kennedy
et al. (1982) consider the amino acid ratios of cool-water shell types
found on the C surface near MacKerricher State Park (Fig. 3.2a) to
correlate with either the middle (5c) ?r late (5a) oxygen isotope stage
5. (Shackleton and Opdyke, 1973). Uranium-series ages of corralline
terraces in New Guinea that are interpreted to have formed during
worldwide sea-level highstands that are correlative with these two
stages yield ages of 103 ka and 83 ka for each event (Bloom et al.,
1974; Chappell, 1983). Altitudinal spacing analysis of local terrace
flights at Mendocino and Westport (Chapter 2) indicates that 103 ka is . the more likely estimate of the C surface, and that inferred ages of
the higher surfaces are 120-133 ka (3 surface), 214 ka (R surface), and
320-336 ka (F surface). Higher terraces are beyond the present record
of dated sea-level high stands. Because each Fort Bragg terrace
represents major interglacial cycles, the L surface is given a highly
speculative age of 405. ka, based on the oxygen isotope marine record
(Shackleton and Opdyke, 1973), for the purpose of this discussion.
Vegetation
Along the Fort Bragg coast, the lowest terraces (C and 3
surfaces) are covered with coastal prairie bunchgrasses and scrubs.
Bishop pine forests are found along canyon walls and near the inland

95
edge of the J surface, away from sodium- and chloride-rich sea spray.
Redwood-Douglas fir forests with some hemlocks and cypresses dominate
the third terrace (R surface), although pigmy forests with dwarfed
cypresses and an endemic variety of closed-cone pine (Bolander) occur
locally. Vegetation on the higher terraces (F, H, and L) is dominantly
bishop pine forest with patches of pigmy forest communities.
Site Selection
The objective of examining these soils was to determine depths
and thicknesses of argillic horizons, and maximum amounts of clay and
iron, thus we made fewer laboratory analyses for these soils than at
CM-PG, and used both pit and auger-hole samples. Eight soil sites were
selected in the M-W area (Table 3.1; Fig. 3.2a). They are separated
into two groups, based on location. The first group consists of five
sites near Mendocino (Fig. 3.2a and 3.2c), on the 103-ka site 10m),
120-l33-ka (site 9m), 2l4-ka (site 8m), 320-336-ka (site 7m), and 405-
ka (site 6m) terraces. The second group of soil sites includes three
sites farther north, south of Westport (Fig. 3.1, 3.2a, and 3.2c, Table
3.1) on the 103-ka (lOw), 120-l33-ka (9w), and 214-ka (Bw) terraces.
Near Mendocino, we used Soil Conservation Service (SCS) soil
pits and descriptions for the l03-ka and 405-ka terraces at sites 10m
and 6m, respectively, and sampled their horizons for laboratory
analyses. We dug auger holes at sites 8m and 7m, adjacent to SCS auger
holes on the 214-ka and 320-336-ka surfaces, respectively. Thickness
and preservation of cover strata on the 120-133-ka terrace vary
spatially. South of Fort Bragg, this terrace is narrow, has many
dunes, and has been widely disturbed by logging activities, thus a

pristine site was difficiult to find. At the soil site described and
sampled (site 9m, Fig. 3.2a and 3.2d), the soil profile was formed in a
mixture of marine sands, angular colluvial sandstone fragments, and
minor marine pebbles. Near Westport, site lOw on the 103-ka terrace
was excavated from a near-vertical sea cliff, and the entire
stratigraphic sequence from platform to cobbles, pebbles, beach sands,
and finer eolian sands was exposed. Sites 8w and 9w (2l4-ka and 120-
133-ka terraces, respectively) were sampled from auger-hole cores.
Discussion of Fort Bragg Soil Properties
Previous workers have demonstrated that pronounced
podzolization on older Fort Bragg terraces indicates substantial soil
development (Gardner ~d Bradshaw, 1954; Gardner, 1958; Jennyet al.,
1969; Jenny, 1980). These well-developed Spodosols are acidic and
nutrient-deficient, and locally have hard iron-silica pans that form
barriers to plant'roots. Dwarfed trees and shrubs growing on these
soils are adapted to the acidic, nutrient-deficient soils, forming
pygmy forests (Jenny et al., 1969). Dark, organic-rich upper A
horizons rest on a leached, light-colored, thixotropic horizon. Below
the eluvial horizon are illuvial horizons that are rich in clay, very
sticky, hard when dry, buff to orange colored, mottled, and abundant in
iron concretions and iron and manganese streaks. Long-term depletion
and translocation, and alternating periods of dessication and standing
water, .has produced an indurated iron hardpan at some locales.
Field descriptions and laboratory properties of the M-W soils
(Tables 3.5 and 3.6, Fig. 3.13 and 3.14) indicate that only the 405-ka
terrace soil (site 9) has such pronounced podzolization.

Table 3.5 Field descriptions of Mendocino-Westport soil properties.
COLOR IIiATRIXl MOTTLES CONSISTENCE SOIL HORIZON DEPTH,CII TEXTUREt DRY IIOIST OCCURRENCE WET COLOR DRY IIOIST WET
WESTPORT Ill .. A 0-10 10YR4/2 10YR3/1 vh fr .o.SP
(103 kl) AS lD-45 cl 10YR3/1 lOYR3/1 vh Ir .S.ap (elilf llca) Bllg 45-75 cl 7.5YRSI2 m2d 7.5YR6/S vh Ii .·oP
Bt2g 75-223 I 10YRS/l mId 7.SYRS/S vh Ii loP BCox 223-248 I 7.SYRS/S lId 7.SYR3/2 vh Ii.vli ••• p s:: 249-420 cl 10YRSI1 10YRS/l c3d 7.SYR5/S h vii .op R 420+
, .. Alp 0-20 (120-133 0) ASI 20-44 IOYR4I2 10YR3/2 10 Ir •••• p
(Auger) AB2 44-S2 sci 10YR4/4 10YR3/4 10 vIr •• oap BI1 S2-S9 sci 10YRS/S 10YR4/S 10 Ir .op Bt2 59-94 cl 10YRS/S 10YR4/S ah Ii .op Bt3 94-120 cl 10YR5IS 10YRS/S m2d 7.SYRS/8 h Ii ".IP BI4 120-143 I 10YRS/4 10YR5/S c3d 7.SYRS/8 h II "o'P BIS 143-183 I 10YR5/8 10YR4IS c3d 7.5YR5/S h II .op s:: 163-1S7 I 10YRS/4 10YRS/8 m2d 7.5YRS/S vh vii ••• p SCI 187-183 cl 10YR6J4 10YRS/S m2d 7.SYRS/8 h Ii ·o·P ... Al 0-2.S .1 10YR4/2 10YR3I2 h Ii .',sp
(214 ka) 1.2 2.5-11 I 10YR4I2 10YR2J2 ah Ii •••• p (Pil) ABI 11-19 sci
BI1 19-33 Bt2 33-57 I 10YR4I3 10YR3/3 h Ir ·.p BI3 57-7S I 10YRS/S 10YR5/S f1d 10YR5J6(dry) h Ii I.P Bt4 7S-85 cl 10YRS/II 10YR5/S f1d 10YRS/S(dry) h Ii •• p
(Auger below Bv SS-147 .1 2.5YS/2 2.5Y7/2 13d 7.5YRS/S h Ii .... p 85 em) BC1 147-183 cl 2.SYS/2 2.SY7I2 m2doc2d 10YRS/S h Ii .oap
BC2 163-1S4 I 2.SYS/2 2.SYS/3 f1d 10YRS/S BC3 184-21S .1 10YR7/4 10YRS/4 12d 10YRS/S ah Ii .... p Cox 21S-242 .1 IOYRS/4 10YR5/4 m3d 10YRS/S ah Ir •••• p
Abblllvialiona according 10 USDA SoD Survey Staff. 1975. tT1XIU1II determined lrom 1aborat0f)' maalUlllmanta III percent undo lin. Ind clay.
STRUCTURE CLAY FILMS NODULES
2mgr ~
2mabk 2mkp/ po 21pr 2np/po 31pr 3k pI
2mabk lkpopl 3covc abk lk po pI
/lOIlI
lnag lnpo
lmk brpo 1"* ag po m2dMn 3,,*brpo c3d lin 2"* po c3d 1"* po c3d
/lOIlI c3dUn
lIgr /lOIlI
2mabk lnpo ag 2msbk lnag 2mabk 2nagpo 2mpr 2n po brpl
2mabk 2"* br po 1f.bk;1fgr In po br
2"*plpobr ltd Un /lOIlI
/lOIlI
nono m2dMn /lOIlI lId Un
\0 ~

Table 3.5. (Continued. )
COLOR ,MATRIXI SOIL HORIZON DEPTH, CM TEXTUREt DRY IIOIST
IIENDOCINO
'QIft A1 0-1S.2 .1 10YR412 10YR312 (103 0) A2 1S.2-40.6 .1 10YR3/3 10YR2/2 (SCS Pit) ABI 40.6-66 .1 10YR412,6/4 10YR3/2.4/3
BI1 66-SS.9 • cl 10YR7/4 10YRSI4 Bt2 88.9-127 II 2.SY7/2 2.SY6/2 C 127-1S2.4 .1 2.SY7/2 2.SY6/2
'IIt AP 0-72 Is (120-133 0) AI 72-SS .1 10YR4J2 10YR3/2
(Aug.r) ABI SS-102 II BC 102-119 II 10YRS/4 10YR3/4 C 1111-136 II R 1311-140 Is
,. A 0-20 II 10YR4J1 10YR2I1 (214 0) m 20-35 II 10YR5I1 10YR3/1
(Auger) BI1 3S-60 II Bt2 60-90 .1 10YR7/3 10YRSI4 BC1 90-120 Is BC2 120-1S0 Is C1 1S0-180 Is
711t A 0-11 II 10YR4J1 10YR2I1 (320-3'. 0) E 11-20 II 10YR6/1 10YR4/1
(Aug.r) IE 20-S1 II 10YRSI1 10YR6/2 BI1 S1-7S II 10YR7/2 10YRs/2 Bt2 711-1 OS II 10YR7/1 10YR6/1 BI3 10S-11S II 10YR7I1 10YRS/1 BIg 1111-1S11 II 10YR8J1 10YR7/1
ElloI 1SS-190 sci 10YR7/2.7/1 10YRS/2.S/I
•• El 0-7.S II NS/0;10YR6/1 10YR6/2 (405' ? ka) E2 7.S-17.S II NS/O 10YRS/2
(SCS-Pit) m 17.8-30.S I 10YR7/4.6/S 10YRS/S.S/3 BI 30.5-S0.8 e 10YRSI8 10YRS/S Blv SO.S-99.1 e 10YR6/S;SYRS/S 10YRS/S
BCIY 99.1-1S7 lei SYRS/8 7.5YRS/S
Abbreviations aceonllng to USDA Soil Survay Staff. 1975. tTuture determined lrom Iaboralory malluremen" 01 p.rcenl sand. sill, and clay.
MOnLES OCCURRENCE WET COLOR DRY
10
10
oh m2d 10YRS/6 sh
m2.3p 7.SYRS/8 oh 31.mp SYRS/8 10
11 .h 10
F .... aJned gr oh
oh 1f Ih
m21 10YR7/S oh
oh h
vh m2d 10YR6IS vh m3d 10YRS/S vh m3d 10YRS/S h c3d 10YRS/S h c3d 10YR7/S vh
oh h h
I1d SYR4J6 h m3d SYR4/S;2.SYRF4J8 h m3d 2.SYR4/S h
CONSISTENCE MOIST WET
vir lO,po vir lO,po Ir ".p • Ir III Ir III
vir so.po
Ir •••• p
vir lO.po
Ii ".'P Ir ".111
Ir so.po
Ii "."P Ir so.po ,II so.1II ,II 11.111 ,Ii •••• p Ii ".'P
vII IS.P vII ·.P
vir so,po Ir 1',po,lhx Ir ".PI Ir s.P Ir I,p Ir I.P
STRUCTURE CLAY FlLIIS NODULES
2vl,Igr 'msbk 2msbk 1n br 1msbk 3n.mk pi po 1msbk 3n.mk br
m
non!
1 nsg none none
1 n br none
3 n br 1 nlll
1 nbr
none none 1 nbr
1nbrpo 1nbrpo 2nbr 1 nbr 1 nbr
1',mabk m
1I.mlbklsbk 1 br 21.mlbk 2mk.n po pi
21.msbkklabk 3mk,k po pi 1cabk 2mk br
10 CD

99
Table 3.6. Swmnary of laboratory properties of Mendocino-Westport
soil properties. Soli Site Horizon Depth, em % Send % Slit "" Clay pH (H2O) Fe (d), .%
WESTPORT tOw A 0-10 40.3 36.1 23.6 5.84 1.71
(103 ka) ABila 10-45 38.9 32.3 28.8 5.70 2.39 (Cilli lace) BI1g 45-75 32.2 38.3 29.5 5.37 1.72
BI2g 75-223 45.9 29.1 24.9 5.45 1.94 BCox 223-249 45.2 29.5 25.3 5.41 5.90 BCtte 249-420 26.5 36.6 36.9 5.93 1.52
R 420+
9w A1 0-20 (120-133 ka) AB1 20-44
(Auger) AB2 44-52 47.3 22.2 30.5 5.49 1.49 BI1 52-59 54.1 19.2 26.7 5.34 1.55 BI2 59-94 41.6 27.8 30.6 5.29 1.73 BI3 94-120 43.2 26.0 30.8 5.61 2.08 BI4 120-143 46.4 29.6 24.0 5.88 2.14 BI5 143-163 48.1 30.1 21.8 5.86 2.22 00 163-187 39.4 44.1 19.5 5.84 2.62 Bet 187-193 34.5 37.6 27.9 5.87 2.35
Sw A1 0-2.5 54.7 26.0 19.3 5.38 1.20 (214 ka) A2 2.5-11 36.5 44.1 19.4 5.11 1.50
(Pit) ABI 11-19 51.5 23.6 24.9 5.22 2.09 Bt1 19-33 BI2 33-57 44.4 29.6 26.0 5.25 1.24 BI3 57-76 47.6 30.6 25.0 5.20 1.78 BI4 76-85 45.2 26.6 28.2 5.10 2.25
(Auger below Bv 85-147 53.3 27.9 18.8 5.34 4.33 85 em) 001 147-163 26.5 41.9 31.6 4.97 1.77
BC2 163-184 52.3 32.5 15.2 5.16 0.39 BC3 184-215 59.0 27.5 13.5 5.20 0.58 Cox 215-242 59.7 27.9 12.4 5.33 1.68

100.
Table 3.6. (Continued. )
Soli SUe Horizon Depth, em % Sand % Slit % Clay pH (H2O) Fe (d), %
MENDOCINO 10m A1 0-15.2 76.6 17.4 6.0 4.59 0.86
(103 ka) A2 15.2-40.6 67.5 19.1 13.3 4.93 0.96 (SCS Pit) ABI 40.6-66 66.7 19.5 13.8 5.00 1.01
BI1 66-88.9 65.3 17.8 16.9 5.07 1.15 Bt2 88.9-127 55.6 16.3 28.1 4.66 1.40 C 127-152.4 75.4 7.3 17.2 4.97 0.42
9m Ap 0-72 76.5 19.3 4.2 5.42 1.31 (120-133 ka) A1 72-85 74.0 14.8 11.2 5.91 1.33
(Auger) ABI 85-102 70.7 11.4 18.0 5.83 1.30 Ee 102-119 70.6 16.1 13.3 5.83 1.11 C 119-136 78.0 8.1 13.9 5.85 1.13 R 136-140 83.9 4.4 11.7 5.82 0.82
8m A 0-20 74.2 20.2 5.6 4.93 0.25 (214 ka) EB 20-35 65.6 25.5 8.9 4.76 0.16
(Auger) Bt1 35-60 62.1 23.1 14.8 5.07 0.64 BI2 60-90 72.6 21.9 5.5 5.36 0.24 Ee1 90-120 83.9 14.6 1.5 5.74 0.16 BC2 120-150 85.3 10.9 3.8 5.54 0.24 01 150-190 80.6 14.4 5.0 5.82 0.22
7m A 0-11 61.4 30.2 8.4 3.58 0.08 (320-336 ka) E 11-20 64.7 29.8 5.6 3.70 0.04
(Auger) EE 20-51 71.3 21.4 7.3 4.72 0.30 BI1 51-76 63.9 22.5 13.6 4.82 0.26 BI2 76-105 68.3 18.5 13.2 4.89 0.18 Bt3 105-116 68.4 14.8 16.8 4.57 0.50 BIg 116-166 65.9 14.5 19.5 4.42 2.59 BqJ 166-190 60.2 15.5 24.4 4.42 1.18
6m E1 0-7.6 62.8 34.4 2.7 4.59 0.11 (405 ? ka) E2 7.6-17.8 54.7 38.9 6.7 4.95 0.46
(50S Pit) EB 17.8-30.5 47.5 29.6 22.9 4.94 2.41 Bt 30.5-50.8 34.3 21.0 44.6 4.98 4.81 Blv 50.8-99.1 33.5 14.8 51.8 4.73 5.07
BOlv 99.1-187 61.8 16.3 21.9 4.96 4.76

Depth, em
o
80
160
240
320
400
o "'-'-J
-
I-
-
l-I.
101
Clay, %
10 . 20 30 40 50
• 'I ] ~h.· I
, ...... J
6m I ~1 • ~
• • ;- .......... , .,:
I r-t..... .. .... ........ ,
9w
8w
10w
Figure 3.13. Changes in clay content with depth, Mendocino-Westport soils. Letters refer to soil sites, from youngest to oldest: Site lOw (103 ka), Site 9w (120-133 ka), Site Bw (214 ka), and Site 6m (405 ka?).

Depth, em
o
80
160
240
320
400
o 1 2
Fe(d), %
, ' ......... , , ,
3
! •• .1. 9w
4 5
8w
6m
~----------------------------~ ~ _____ ~ _________ ~ __ .d
10w
102
6
Figure 3.14. Changes in Fed content with depth, Westport-Mendocino soils: Site lOw (103 ka), Site 9w (120-133 ka), Site 8w (214 ka), and Site 6m (405 ka?).
---~------ ---------------------------------------

103
Characteristics of the younger soils examined are similar, but not as
well-developed. Overall and maximum amounts of clay and Fea of the
four youngest soils at Mendocino (sites 7m, 8m, 9m, and 10m, Table 3.5)
decrease with age (Appendix D, note 2) rather than increase, thus these
four sites are not useful in an analysis of time-dependent accumula
tions of Fea and clay. The reversed trend is probably related to
sedimentological and vegetation differences between the sites. Greater
ages and lower uplift rates of these terraces than at aM-PG is also a
factor, as the extensive histories of each, and their low altitudes
relative to successive major interglacial sea-level highstands, are
conducive to subsequent submergence of or deposition on the terrace
tread. These four soils are not compared to the CM-PG chronosequence
because of these uncertainties. The four remaining M-W soil sites
(sites Sm, Bw, 9w, and lOw) are considered excellent, and laboratory
data appear reasonable for correlation purposes.
A comparison of soil development at these four sites (Fig. 3.13
and 3.14), on the 405-ka, 214-ka, 120-133-ka, and 103-ka terraces,
indicates that only the 405-ka terrace soil pedon can be differentiated
as significantly more developed than the other three on the basis of
plots of clay and Fea content with depth (Appendix D, Note 2).
Differences in Fe content with depth between the other three soils are
small, although the 214-ka terrace soil appears more developed than the
two youngest soils (Fig. 3.14). Maximum Fed content of the 214-ka
terrace soil pedon is slightly less than that of the 103-ka terrace
soil pedon, but its zone of iron accumulation is thicker (Fig. 3.14) •
... _--_._----------------------_._--

104
Although the data obtained from the M-W soils are less
satisfactory than those from CMr.PG, the results of this analysis
indicate that relative ages can be roughly determined based on soil
development. Maximum constituent values of Fed and clay for the M-W
soils are used for comparison with the CM-PG chronosequence~ because
bulk densities were not determined at M-W. Maximum clay and Fed
contents and B-horizon thicknesses are plotted against time for CM-PG
and M-W soils in Fig. 3.15 and 3.16 (see Table 3.4 for data). Maximum
percents of clay and Fed for the 94-ka and l20-ka terrace soils at eM
PG are similar to those for the 103-ka and l20-l33-ka terrace soils at
Westport. In general, all soils on terraces older than 94 ka have more
than 30% maximum clay and 1.9% maximum Fed. The data points on Fig.
3.15 have some scatter, but indicate a general decrease in rate of
accumulation of both Fed and clay with time. The Fed curve flattens
between 83 and 120 ka, and the clay curve is less steep after 120 ka.
Because the rate of accumulation or iron and clay declines beyond this
time, the 2l4-ka terrace soil cannot be distinguished from the I03-ka
and l20-l33-ka terrace soils on the basis of these properties, even
though its assigned age is about 100 ky (ky = one thousand years)
greater. Only the 405-ka terrace soil stands out as strikingly more
developed than any other soil examined, and has a higher maximum value
of clay--52%--than all other soils studied. B-horizon thicknesses
(Fig. 3.16) for the M-W soils are greater than those of all but the
l20-ka terrace soil at CM-PG, and appear to continue to increase
slightly with time beyond 120 ka.
--------------

105
60
a 50
-'-</. ---..l' 40 --c a/ ----CD -C 0 a U E 30
/11 :J .§
i 20
10 /
I x x X
Ie
0 0 80 160 240 320 400 480
Tlms,ka
• Clay, CM-PG + Fe, CM-PG a Clay, M-W x Fe, M-W .. Clay, Eureka
Figure 3.15. Plots of maximum percentages of clay for soils at Cape Mendocino-Punta Gorda, Mendocino-Westport, and Eureka (from Burke et al., 1986), and maximum percentages of Fed for soils at Cape Mendocino-Punta Gorda and Mendocino-Westport. Curves are estimated by eye.,

200
150
tII~
til GI 100 c e .::.: u u :c I-
50
0 0
160 240 320 400
Time, ka
Thickness of zone of clay accumulation, Cape Mendocino-Punta Gorda
Thickness of zone of clay accumulation, Mendocino-Westport
480
Figure 3.16. Trend in maximum B-horizon thickness with Mendocino-Punta Gorda and Mendocino-Westport soils. estimated by eye.
time for Cape Curves are
106

107
Comparison with Soils North of Cape Mendocino
Burke et al. (1986, and manuscript in preparation) have made
extensive analyses of multiple soil sites on flights of terraces in the
Eureka area, north of Cape Mendocino (Fig. 3.1). State factors are
very similar between Eureka, Cape Mendocino, and Fort Bragg. Climatic
data from Eureka are much like those at Fort Bragg, soil parent
material is marine and eolian deposits resting on sandstone platforms,
and site topographies are gently sloping marine terrace treads. Three
properties of soil development, and the position and assigned age of
each marine terrace, allowed Burke et al. (1986) to categorize each
soil into one of three primary age classes: 64-83 ka, 83-103 ka, and
120-133 ka. The most significant age-dependent properties they noted
are maximum percent clay, total clay estimate (the summation of percent
clay times horizon thickness for each horizon, divided by the profile
thickness), and B-horizon thickness. Burke et al. calculated mean
values of maximum percent clay for each age class as 23±7 (64-83 ka),
30±10 (83-103 ka), and 37±11 (120-133 ka). For the CM-PG soils,
maximum percent clay values (Table 3.4) are 5.0 (3.5 ka), 16.1 (30 ka),
23.4 (40 ka), 33.1 (94 ka), and 40.1 (120-133 ka). These data are
shown on Fig. 3.15 for both the CM-PG and Eureka data sets, and
indicate a close correspondence. For the same age groupings, total
clay estimates are 19±4 (64-83 ka), 24±5 (83-103 ka) and 33±6 (120-133
ka) for the Eureka soils, and 2.6 (1.7 ka), 8.6 (30 ka), 19.2 (40 ka),
20.6 (94 ka), and 27.4 (120-133 ka) for the Cape Mendocino soils, and
again have a high degree of overlap. B-horizon thicknesses do not

108
compare well; those at CM-PG are much thicker than those to the north,
for all age classes.
Conclusions
Six pedogenic properties of soils developed in unconsolidated
deposits on marine terraces in the CM-PG area have systematic, time
dependent trends. Amount of organic matter accumulation in the upper
70 em of the soil profile, and in the whole profile, increases at a
rate that declines with time, so that terraces older t~an 30 ka have
similar organic matter contents. pH in the top 20 em of the soil
profile decreases at a rate that also declines with time, and reaches a
stable value by 30-40 ka. Both total free Al oxyhydroxides (AId) and
noncrystalline Al oxyhydroxides (Alo) accumulate slowly, in a near
linear manner, for 94 ka, and only slightly more by 120 ka, thus these
properties might accumulate at a rate that decreases after about 120
ka. Amounts of total free Fe oxyhydroxides (Fed) and clay continue to
increase linearly for 120-133 ka. However, maximum percent values of
clay and Fed generally reach their highest values by 120-133 ka, and
increase only slightly on older terrace soils in the ~w area.
Soils developed on marine terraces older than 94 ka at Eureka,
OM-PO ,. and ~w have at least 30% maximum clay and 2% maximum Fed, thus
these values provide cut-off points to separate marine terraces younger
or older than 94 ka in this region. The CM chronosequence is
especially useful in that this preliminary work indicates that easily
obtained properties, such as maximum clay and iron, will provide a
means of roughly estimating soil ages and correlating marine terraces
overlain by marine deposits.
--------- --------------

CHAPTER 4
FLUVIAL RESPONSE TO LOW, INTERMEDIATE,AND HIGH RATES OF UPLIFT
Introduction
According to Walther Penck (1953), when one studies the
morphology of the earth's surface, "the problem is that of crustal
movement", because a landscape cannot develop until "the earth's crust
offers • • • surfaces of attack" (p. 1). This study is a specific
example, in reverse, of the objective to which Penck devoted his
career:
Crustal movements cannot be observed directly, and no adequate method is known for ascertaining their characteristics •.•• it is the crustal movements which correspond to the unknown, about which statements can be made only as a final result of the investigation, not as one of the premises. • • • Morphological analysis is this procedure of deducing the course and development of crustal movements from the exogenetic processes and the morphogical features." (Penck, 1953, p. 6)
Penck's aim was to observe morphological features and processes of
denudation (exogenetic processes), and to deduce from them the nature
and causes of crustal movements. The aim here is the reverse, and is
inductive: it is to define empirically the connection between known
intensities of uplift and resultant morphological features, then to
develop hypotheses that relate morphogenesis to crustal movements.
In contrast to the times in which Penck worked"crustal
movements can now be observed directly (e.g., geodetically), and their
characteristics (i.e., their rates and spatial distributions) can be
109
------------------- . __ ._._ ....

110
measured. Rates of crustal movement in coastal northern California are
known, and are one of the premises of this investigation. The selected
study area is a coastal section about 120 km long and 8 km wide,
between Cape Mendocino (Singley Flat) and Fort Bragg (Fig. 4.1). Rates
of uplift, determined from uplifted marine terraces, increase from 0.3
m/ka (ka = 1000 years before present) at Fort Bragg to 4 mlka 20-40 km
south of Cape Mendocino, near the Mendocino triple junction (Kennedy,
Lajoie, and Wehmiller, 1982; Lajoie, Sarna-Wojcicki, and Ota, 1982;
McLaughlin et al., 1983a). The spatial pattern of Quaternary uplift
rates is probably related to northward passage of the triple junction.
This area is suitable for studying geomorphic response to varying
uplift rates, because climatic conditions and lithology are fairly
constant. Although the importance of these independent variables has
been recognized, few studies have attempted to systematically
investigate geomorphic response to tectonism in an area where
differences in nontectonic variables are minimal.
Objectives and Approach
The objectives of this work are to identify the drainage-basin
morphologies that accompany different rates of uplift for a given
climate and erodibility of materials, to identify the best indicators
of tectonism in the landscape and estimate their sensitivities and
response times, and to quantify the interplay between processes of
upheaval and downcutting. The results of this analysis are especially
useful to geomorphological studies in areas of low or intermediate
uplift, where evidence of tectonic activity may be subtle. Previous
studies in tectonic geomorphology have used fault scarp morphogies,

•• OJ~12~8~O ____________________ ~12~.~O ____________________ 1_2rO_O~ •• o
~ t
~\ > }
.. Oregon
~ \\. California - ~-
F'l Eureka ~
Mendoclno~ 1 e; Fracture Zone
~ < Francisco ~~ ~
~
Figure 4.1. Location map, tectonic setting, and published rates of uplift of the Mendocino triple junction (MTJ) region, coastal northern Oalifornia. The MTJ, shown in hachures, marks the juncture of the North American, Pacific, and Gorda plates. Uplift rates and their sources are discussed in the text, and in Table 4.1.
111

112
alluvial-channel geometries (e.g., sinuosity), and mountain-front
morphologies to interpret tectonic activity. None of these is used in
this study, because no fault scarps have been identified, stream
channels are cutting down into bedrock and thus have little chance to
adjust their geometries laterally, and mountain fronts are modified by
coastal erosion. Furthermore, coastal California is a humid region
with rapid erosion rates and dense redwood and pine forests, thus
exposures and accessibility are limited. The approach emphasized here,
then, is to compare three-dimensional morphological properties,
obtained from topographic maps, of drainage basins that have evolved in
areas of low «1 m/ka), intermediate (1-3 m/ka), and high (>3 m/ka)
rates of uplift.
Scope of the Paper
The morphological analysis must first be prefaced with an
evaluation of the premises of uniform local climatic and lithologic
conditions. Included in this discussion is a summary of the
seismotectonic setting and known rates of late Quaternary uplift of the
Mendocino triple junction region. The following section on analysis of
geomorphic properties of drainage basins is divided into several parts.
The first briefly presents the conceptual models regarding base level
fall and drainage-basin adjustment that underlie the objectives of the
morphological analyses. This section is follwed with a description of
the response of a large fluvial system, the Mattole River, to uplift.
The remaining parts, concerning three-dimensional geometrical analysis,
concentrate on small «21 ~) basins; their responses to uplift are
the most dramatic in the region. The concluding sections summarize

113
the empirically determined relations between rates of crustal movement
and morphological elements of the landscape. Although the cause of
variable rates of uplift in the Mendocino triple junction region was
unclear at the outset, the nature of geomorphic adjustments themselves
can be used to infer likely general styles of deformation and possible
mechanisms of uplift. Thus, tentative inferences of mechanisms of late
Quaternary uplift are discussed in the final section.
Background Information
Physiographic Setting
The narrow study area, within the rugged northwest-trending
Coastal Ranges, is bounded on the west by the Pacific Ocean, and on the
east by two large, northwest-flowing antecedent rivers, the Mattole and
Eel Rivers (Fig. 4.2). The meandering Mattole River originates less
than 5 Jon from the coast near Shelter Cove (Point Delgada), flows
inland and north for 120 km and exits north of the King Range, a
prominent 60 km-Iong range within the study area. Much smaller west
and southwest-flowing drainages along the coast (Fig. 4.3) are referred
to here as coastal drainage basins. Their drainage patterns, like that
of the Matto1e River, are predominantly dendritic, with a minor trellis
component. Maximum relief along the first inland drainage divide
between these basins and the Mattole and Eel River Basins increases
northward from 300 m near Fort Bragg to 1246 m in the central part of
the King Range. Hillslopes in all basins are generally steep and
convex, and conducive to massive slope failure and rapid erosion rates.
-1-

40" 30'
39· 30'
124· 30'
KIng Range Terrane
-:,---- Shear Zone
• .... Ancestral Mallo'"
.It!' Fold Axis
124· 30'
124· 00'
124· 00'
114
123· 30'
40· 30'
",,0 ==*== ... 10M.
o 10K. --=-
39· 3~'
a 'orl IIragg
.@ 123· 30'
Figure 4.2. Physiographic and geologic setting of coastal northern California and locations of flights of marine terrace-remnants used to determine inferred rates of uplift. structural geology and b9uodary of the King Range Terrane modified from Beutner et ale (1980). Prior locations of the MTJ are indicated at 1 ma and 2 mao Site locations are Al)Cabrillo Point, A2)Bruhel Point, B)Kaluna Cliff, C)Randall Creek, D)Smith Gulch, E)McNutt Gulch, F)Singley Flat, G)Cape Ranch, and H)Bear River.

1. Unnamed 2. Singley 3. DUrT 4. Davis 5. Fourmile 6. Cooskie 7. Randall 8. Spanish 9. Cal
... -.... .... .... .. -...... ..... ... -"'4 A .......
Drainage Basins
10. Kinsey 11. Big 12. Big Flat 13. Shipman 14. Buck 15. Gitchell 16. Horse ML 17. Telegraph 20. Whale Gulch
'" '4- .. NOb"";. ..... 'T .. A~ .. _
21. JackAss 22. Hardy 23. Juan 24. Howard 25. DeHaven 26. Wages 27. Abalobaciah
9L.. __ ~,----,1P Km
~(il.T-
Marine Terrace Sites
A 1. Cabrillo Point A2. Bruha! Point B. KaJuna Cliff C. RandaH Creek D. Smith Gulch E. McNutt Gulch F. Singley Flat G. Cape Ranch H. Bear River
Figure 4.3. Offset strip map of major drainage basins along coastal northern California. Drainage networks are from 7.5' topographic map blue lines. Heavy dashed line is major drainage divide between west-flowing coastal drainages and larger inland drainage basins. Only major trunk streams of the Mattole River basin are shown.
-------------------------------
115
o·

116
Climatic Setting
Present climate. Climatic characteristics are stabilized by
maritime influences, and are typical of a Mediterranean climate. Moist
maritime air masses moving towards the southeast from the Aleutian low
pressure system provide most winter precipitation. Local
climatological data are available at three coastal climatic stations
and one inland station that fringe the study area: Fort Bragg in the
south, Eureka just north of the study area, Shelter Cove in the King
Range, and Honeydew (inland) on the Mattole River (Fig. 4.1 and 4.3)
(National Oceanic and Atmospheric Administration, National Climatic
Data Center, local climatological data summaries). Records from these
stations are used to evaluate the assumption of spatially near
constant climatic conditions.
Climatic data for each station are similar in that summers are
cool, foggy, and dry; mean monthly temperatures vary less than 60 C
throughout the year; and more than 90% of mean annual precipitation
occurs as rain during mild winters. Climatic characteristics of the
Fort Bragg and Eureka coastal stations are nearly identical (mean
annual precipitation 100-102 em; mean annual temperature 12-140 C),
however there are several differences at the Shelter Cove and Honeydew
stations. Mean annual precipitation is 165 em at Shelter Cove, and
170-250 em at Honeydew. These differences, and others, are related to
the orographic effect of the King Range. The most critical climatic
differences are those that affect analysis and comparison of the 25
small coastal drainage basins. Although greater precipitation in the
Mattole basin than elsewhere probably results in potentially greater
---- - --~---------------------

117
proportional stream power, the Mattole basin is already considered
separately from the smaller basins because of its much greater drainage
basin size.
The key to evaluating local climatic differences in terms of
their effect on geomorphic processes is to consider how they affect
amount of water available to each coastal drainage basin, and amount
of sediment yield related to ·freeze-thaw processes at higher altitudes
in the King Range. As all the coastal drainages flow west or southwest
(Fig. 4.3), microclimatic variations due to northerly or southerly
aspects are considered to be equally weighted throughout the area.
Upper hills lopes of coastal drainages in the King Range, where
orographic affects are greatest, may be drier in the summer, and have
greater diurnal and seasonal climatic fluctuations, less fog cover, and
less effective moisture available for streamflow than lower altitude
drainages to the north and south. Upper slopes also receive occasional
accumulations of snow, and 60-160 days of frost above 850 m, whereas
the coastal areas are frost-free (PuIs, 1984). Freeze-thaw processes
generally occur above 850 m in the King Range, however, and thus affect
only a few percent of the areas of seven drainages. In contrast to
upper slopes, lower sloeps along the coast may receive greater maP, as
at Shelter Cove. Strong easterly summer winds along the ridgetops form
a downdraft that inhibits onshore movement of fog along the front of
the King Range. The presence or absence of fog is significant, because
fog cover can reduce evapotranspiration, and add as much as 30 em of
annual fog drip in forested areas (Azevedo and Morgan, 1974).

In lieu of detailed local climatic information, and despite
evidence of local microclimatic variations, however, we continue with
the assumption that the dominant control on fluvial processes--winter
rainfall--affects all coastal drainages in a similar manner, and that
climatic conditions are spatially uniform over the area. Thus, we
assume constant effective streamflow at a given longitudinal point
along each stream, regardless of relief and localized differences in
mean annual precipitation.
118
Pleistocene Climates. Vegetation, temperature, and
precipitation changes during glacial periods affected all drainages
examined in this study, but probably do not weaken the basis for
comparison of geometric properties between basins. Although late
Pleistocene glacial climates in coastal northern California were
slightly cooler, the coastal strip is considered a possible ice-age
refugium (Johnson, 1977), as vegetation changes were minimal, and many
cold-sensitive species continued to thrive along the coast.
Late Quaternary Uplift and Seismotectonic Setting
Plate Boundary Configurations. Plate interactions at the
Mendocino triple junction (MTJ) result in different tectonic regimes
north and south of Cape Mendocino. The triple junction is the boundary
between the North American, Pacific, and Gorda plates (Fig. 4.1). The
MTJ formed about 29 million years ago when part of the ancestral
spreading center of the Farallon (present-day Gorda) plate was
subducted beneath the North American plate, causing the North American
and Pacific plates to converge (Atwater, 1970; Dickinson and Snyder,
1979b). Subduction of the Gorda plate has continued north of the

119
triple junction, while south of it right-lateral shear' between the
Pacific and North American plates has developed into the San Andreas
transform boundary (Fig. 4.1). As the Gorda plate moves northeastward
relative to the North American plate and is consumed, the length of the
San Andreas fault system increases and the position of the MTJ migrates
northward at the same rate as relative movement between the North
American and Pacific plates (-5.6 cm/yr).
San Andreas Fault. The entire region examined in this study is
bounded on the west by the main trace of the San Andreas fault (Fig.
4.2 and 4.3), which plays a key role in interpreting rates and styles
of deformation in the region. The location of the main branch of the
present San Andreas fault between Shelter Cove and Cape Mendocino is
uncertain. Analysis of continuous acoustic reflection profiles run
south of Shelter Cove allowed Curray and Nason (1967) to identify zones
of disturbance and faulting along a NI7°W trend from Point Arena
offshore toward Shelter Cove (Fig. 4.1). From Shelter Cove northward,
the location of the San Andreas fault is poorly determined by the
reflection lines (Curray and Nason, 1967). Until recently, many
thought that ground breakage onshore at Shelter Cove was associated
with a main branch of the San Andreas fault system that ruptured during
the 1906 earthquake, and suggested that the San Andreas came back
onshore to connect with the surface rupture (Fig. 4.2). However,
recent geologic mapping and radiometric dating of mineralized veins
that cross the hypothetical fault trace indicate that no significant
lateral movement has occurred along this discontinuity since 13.8 ±O.4
million years B.P. (McLaughlin et al., 1979).
-------------------- "'--"-'"

120
Historically, the northern termination of the San Andreas fault
(north of Point Arena) has been seismically quiet, and clearly active
fault zones can not be delineated from seismicity patterns. Moreover,
inadequate station coverage and highly variable crustal structures and
seismic velocity propagations complicate interpretations of local
seismicity (Smith and Knapp, 1980). In contrast to parts of southern
and central California, where patterns of seismicity clearly define
surface traces of active branches of the San Andreas fault system,
seismicity south of the Mendocino fracture zone is diffuse, and few
events greater than MS 3.0 are recorded. Other elements of the MTJ,
however, are seismically active. The Mendocino fracture zone, along
the southern edge of the Gorda/Pacific plate boundary, is an active
right-lateral transform fault, and the Gorda Ridge and its eastern
subduction zone are both seismically active (Smith and Knapp, 1980).
Spatial Variations in Quaternary Uplift Rates. North of the
triple junction, deformation is northeastward-directed compression, as
reflected by southwest-dipping thrust faults, northwest-southeast
trending broad anticlinal folds (Carver, Burke, and Kelsey, 1985,
1986), landward tilting of marine terraces (Adams, 1984), and crustal
shortening (Kelsey and Carver, in preparation). Local uplift rates as
high as 1.5 m/ka, or possibly 2 m/ka, have been suggested from studies
of marine terraces in Oregon and northern California, although rates
less than 1 m/ka are more common (Adams, 1984; Carver, Burke, and
Kelsey, 1986). South of the triple junction, deformation along the San
Andreas fault is right-lateral shear with associated localized
extension and transpression. Typical uplift rates along the central

and southern California coast are 0.3 m/ka (Ku, T.-L, and Kern, J.P.,
1974; Lajoie et al., 1979a; Lajoie et al., 1979b; MUhs, 1985; Lajoie,
1986). Locally, uplift rates are much higher, as at Ventura in the
Transverse Ranges (6-10 m/ka: Lajoie, Sarna-Wojcicki, and Ota, 1982;
Lajoie and Sarna-Wojcicki, 1982), due to oblique convergence and
compression.
121
Unusually high rates of uplift also occur at and just south of
the MTJ (Fig. 4.1). Rates of uplift determined from studies of dated
Holocene and late Pleistocene marine terraces in this area span an
order of magnitude, from the typical low value of 0.3 m/ka near Fort
Bragg (Kennedy, Lajoie, and Wehmiller, 1982; Lajoie, unpubl. data,
1981, as cited by McLaughlin et al., 1983a), to at least 1 m/ka farther
north at Whale Gulch (Hagemann, 1982) and Shelter Cove (McLaughlin et
al., 1983a), to 4 m/ka 40 km.south of the triple junction at Big Flat,
and to 2.8 m/ka at the triple junction at Cape Mendocino (Lajoie,
Sarna-Wojcicki, and Ota, 1982). Merritts and Bull (Chapter 2;
manuscript in preparation) estimated terrace ages and determined
inferred rates of uplift of entire fligh~s of terraces at these same
sites, and several others (Fig. 4.2), from an altitudinal spacing
analyses of local marine terrace-remnants in order to correlate them to
flights of global marine terraces that have been dated elsewhere
(methodology of Bull, 1985, and Bull and Cooper, 1986; sea-level
fluctuation chronology of Chappell, 1983). Merritts and Bull observed
that uplift rates derived from altitudinal spacing of terraces and from
previously dated terraces together define a distinct pattern of spatial
variations in uplift along a N300W coastal transect (Fig. 4.4). Their

a> -nI a:nI
=.:!!E _E a ::l
Oma *
6.0
4.0
2.0
0 0 40
1 rna *
2ma
*
PO 00
80
U FB A1
120 Distance along a N30W transect, km
BF = Big Flat FB = Fort Bragg PO = Point Deigada SF = Singley Flat WG = Whale Gulch
OD Marine Terrace Spacing Analysis .IItI. (with site reference letter)
• 14C Dated Terrace , Amino Acid Dated Terrace * Location ot Mendocino Triple
Junction (ma=Million years)
Figure 4.4. Latest Pleistocene uplift rates plotted along a N300W transect from near Cape Mendocino (0 km) to Fort Bragg (-120 km). Present and past locations of the MTJ are plotted at top of diagram. Site locations are AI)Cabrillo Point, A2)Bruhel Point, B)Kaluna Cliff, C)Randall Creek, D)Smith Gulch, E)McNutt Gulch, F)Singley Flat, G)Cape Ranch, and H)Bear River and represent inferred uplift rates (Merritts and Bull, manuscript in prep.).
122

123
uplift rate curve is the basis for the present comparison of geometric
properties between drainage basins presumed to have different rates of
uplift.
Temporal Variations in Quaternary Uplift Rates. Results of the
analysis by Merritts and Bull (Chapter 2; manuscript in preparation)
indicate an additional element that must be considered-temporal
changes in uplift with passage of the MTJ. Accelerated uplift seems to
occur both during and after the change in type of plate boundary,
because times of increase in uplift rate, from <1 mlka to 4 mlka, are
progressively younger towards the triple junction. Immediately north
of the MTJ (Bear River), inferred uplift rates have just begun to
increase in the past 57 ka, and have not yet reached maximum values of
about 4 mlka apparently associated with passage of the MTJ.
Immediately south of the MTJ (from Smith Gulch to Randall Creek),
inferred uplift rates have been as high as 2.5-4.0 mlka for at least 83
ka. South of Point De1gada, where the MTJ passed about 1 rna (rna = million years before present) uplift rates have been uniform for at
least the past 320 ka. At Point De1gada, uplift rates have been 1.3
mlka, and at Bruhel Point and Cabri110 Point uplift rates have been 0.3
m/ka. These results suggest that a drainage basin currently responding
to rapid uplift may have been adjusted to low rates of uplift within
the past several hundred thousand years. Conversely, farther south, a
presently low uplift area may previously have been a rapid uplift area.
Geologic Setting and Rock Resistance
Tectonostratigraphic Units. Rock units along this part of the
North American plate margin are part of the Franciscan assemblage of
~~----.------ ----------------~---

subduction-related deposits that formed within convergent tectonic
regimes that existed much before passage of the MTJ. Two
tectonostratigraphic units, the Coastal and King Range terranes, are
separated by a prominent shear zone (Fig.4.2; Beutner et al., 1980).
Predominant lithologies in the larger northwest-oriented Coastal
Terrane (Late Cretaceous to late Eocene) are arkosic sandstone,
siltstone, shale, and minor conglomerate that were deposited in a
variety of deep-water trench and trench-slope environments (Bachman,
1978j McLaughlin et al., 1982; Blake et al., 1985). Athough these
rocks are less sheared, fractured, and isoclinally folded than
Franciscan rocks to the east, structural style is very inhomogenous
within the unit. Fabric varies across the belt, from fairly coherent
sandstone-rich rocks in the east to more disrupted, deformed, and
sheared argillaceous rocks described as a broken formation near the
coast (Blake et al., 1985).
124
General composition of the younger King Range terrane (early
Tertiary (1) to mid-Miocenej Fig. 4.2) is similar to that of the
Coastal terrane. However, structural styles are different between the
tWOj the King Range terrane rocks, although sheared and folded, are
more intact than those of the Coastal terrane. Beutner et a1. (1980)
have mapped the King Range terrane as two lithostructural facies. A
broken-formation facies consists of well-bedded, pelagic and
hemipelagic calcareous argillite and interbedded arkosic to andesitic
sandstone interpreted as lower slope or trench deposits (Blake et al.,
1985). This facies grades to the north and east into a penetratively

sheared argillaceous melange facies--the shear zone boundary of the
King Range terrane (Fig. 4.2; McLaughlin et al., 1982).
Rock Resistance
125
Lithologic conditions in the King Range and Coastal terranes
are certainly not constant in the sense that streams and hills lopes are
everywhere developed on one uniform rock type. However, they are
treated herein as homogenous in the sense that the predominant rock
types of argillite and arkosic sandstone are everywhere variable,
sheared, and tectonically and syndepositionally mixed, and that each
drainage basin is exposed to a mixture of rock types that are
moderately to highly erodable. More resistant outcrops of thick-bedded
sandStone occur in parts of the King Range, but they are no more
resistant or abundant than resistant sandstone units in the Coastal
terrane (pers. comm' 7 McLaughlin, 1986).
When one studies landscape morphologies, the affects of greater
rock resistance are difficult to separate from the affects of more
rapid or more recent uplift. A rapidly uplifted mountain range may
appear to consist of more resistant rock types than an adjacent range
with lower relief, subdued slopes, and gentler channel gradients.
Closer inspection, however, might indicate that both ranges have
similar total rock mass strengths. One mountain may have high relief
because its uplift rate greatly exceeds the rate of landscape lowering,
or has in the recent past. The other mountain may have low relief
because absolute uplift occurred in the distant past and erosion has
had sufficient time to remove most of the evidence, or because the
uplift rate has only recently exceeded the rate of landscape lowering.

126
Determining Rock Mass Strength. An objective attempt was made
to separate lithologic from tectonic components of relief, by
quantifying rock mass strength at individual outcrops, according to the
criteria and methodology established by Selby (1980) and Moon (1984).
The Selby rock mass strength classification identifies a number of
characteristics of lithology and structure that are critical to
determining rock resistance to erosion. These characteristics include
intact rock strength; degree of weathering; number, spacing, and
continuity of geologic discontinuities (joints, faults, bedding planes,
etc.); and presence of ground moisture. A quantitative rating scale
that sums numeric values for each category was used to compare total
rock strength at different sites.
Mappable, continuous units are rare in the Franciscan rocks of
coastal northern California, thus the field rating method had sampling
bias in that it was used where there were outcrops, and thus where more
resistant rocks existed. For the 12 sites evaluated (in six drainage
basins), the numeric values of rock mass strength varied from 42 to 71
(scale of 25-100), with most values between 50 and 60; these values
correspond to weak to moderately resistant rock strengths, according to
Selby's (1980) five-part classification terminology. The rock mass
strength classification verified the known erosion-prone nature of the
existing rock types, put an upper bound on the strength of the most
resistant local rock types, and indicated that resistant units in the
King Range terrane are probably no more resistant than.those in the
Coastal terrane.

127
Rock-Mass Erodibility. An additional means of identifying
large-scale rockmass erodibility was provided by the work of Ellen
(unpubl. map; pers. comm., 1986). Ellen used large-scale aerial
photographs (1:12,000) to map terrain units from Fort Bragg to Cape
Mendocino. His detailed, 10-part classification categorized terrain
units according to their visual geomorphic expression, primarily the
prominence and regularity of fluting, or sidehill incision. These 10
categories, ranging from unfluted, irregular, rounded topography to
fluted, regular topography, can be grouped into three classes of
inferred large-scale rock mass strength that are associated with known
rock types, based on local field checking. These classes are, from
most to least resistant, "hard" (intact sandstone and shale),
"intermediate" (broken rock with both sheared argillaceous and intact
sandstone masses), and "soft" (melange of sheared argillaceous rock) •
. Although inferences of rock resistance drawn from the degree
and style of fluting for the purposes of this study may also be blurred
by the influence of tectonism, Ellen found that much of the region
south of the King Range consists of "hard" terrain, whereas much of
that in and north of the King Range consists of "soft" and
"intermediate" terrain. This is the opposite of what one would expect
if the high relief areas, and areas of known higher rates of Holocene
uplift, are reflecting primarily lithologic rather than tectonic
control. The highest relief, and steepest hillslopes and channel
slopes, are found both in and north of the King Range terrane, where
Ellen's photointerpretation indicates a high proportion of "softest"
rock mass states.

In conclusion, we assume lithologic control of variations in
landforms is minimal based on the observations noted above:
1) resistant rock types are found scattered throughout the area,
2) rocks that crop out have similar resistances to erosion, and
3)surface texture mapping and correlation with rock type erodibility
(Ellen, unpublished map and data) shows a negative correlation with
relief.
Conceptual Reference Frames and Equilibrium
128
We describe below two types of fluvial systems: 1) the lower
50 km of the Mattole River, with sufficient stream power to adjust to
base level fall by downcutting and retaining its overall profile form
and position, and 2) 25 small drainage basins «21 ~) (Fig. 4.2 and
4.3) that vary in their ability to maintain graded conditions,
depending on the rate of relative base level change at their mouths.
Before evaluating their responses to uplift, we must define a frame of
reference for stream equilibrium and transfer upstream of relative net
base-level change. This paper evaluates the motions of an uplifting
landmass and erosion at the land surface relative to changing relief of
the landmass. (Although sea level has fluctuated rapidly during 10-20
ka intervals in response to glacio-eustatic changes, these variations
are not treated here; rather, we emphasize longer-term tectonically
controlled base-level changes). We consider erosional modification in
a watershed as vertical lowering of the land surface with respect to
the mountain interior, or the main drainage divide. An uplifting
landmass views the ocean level as falling over the long term. If the
erosion rate at the crest of a mountain is less than the local uplift
---- - --------------------

129
rate, the crest will gain altitude equal to the difference between
these rates. A stream draining the crest will experience a source-area
rise, in the absolute sense. However, the mouth of the river merges
with, or is tied to, the ocean base level. Thus, if erosion at the
ridgecrest is minimal compared to source-area rise, the drainage system
will experience net base-level fall at its mouth, with respect to the
mountain reference frame.
Equilibrium
A stream with no base-level changes or lithologic control may
remain fixed with a stable shape, relative to its position within the
drainage basin and the mountain interior. With no net erosion or
sedimentation there is equality of action (Gilbert, 1877) and the river
is at grade. The river is also in dynamic equilibrium (Hack, 1960), in
that it is at grade with respect to its drainage basin position, but
also in that each component of the fluvial system is mutually adjusted
and retains a constant form through time.
Relative net base-level lowering at the mouth of a river
creates an elevation potential, and increases stream gradient--and
therefore stream power. The effect of base-level lowering, or rate of
lowering, propagates upstream into the watershed. The nature of the
effect and its propagation involves the ability of a stream to react to
the elevation potential, and therefore depends on the stream power
available to transport sediment from upstream and to erode the bed.
Discharge at the mouth of a large stream may be sufficient to incise
the channel, with only slightly increased gradient, at the rate of
base-level fall. This reach of the stream is not graded, because it is

130
eroding with time. The shape of the profile does, however, remain
constant through time, and conceptually is a form at equilibrium (Hack,
1960) with the variables of the system--tectonic base-level lowering,
hydraulic conditions from upstream, and bedrock resistance or
erodibility. A reach in this condition will transfer the entire
magnitude, or rate, of base-level fall to the next reach upstream.
The power of a stream is derived from the watershed as water
discharge. Power also depends on stream gradient. Stream gradient
usually increases upstream as discharge decreases, but stream power,
the product of local gradient and discharge, may remain constant along
stream length if no base-level changes are involved (Leopold, Wolman,
and Miller, 1964). The ability of a stream reach to respond to base
level fall depends on its position within the watershed, and decreases
with distance upstream. The first upstream reach that has insufficient
stream power to transfer the entire magnitude of base-level change will
absorb some of the change by increasing its gradient through time, in
addition to lowering--at a reduced rate--into the mountain. This reach
is at a threshold, and all other reaches upstream from that reach are
affected less by uplift.
Drainage-Basin Geomorphology
The Mattole River
Strath terrace remnants can be followed for almost 50 km
upstream from the river mouth of the Mattole River (Fig. 4.5).
Positions-of these straths, with reference to the present channel,
were surveyed with a hand level from the thalweg of the active channel

o ., N
ELEVATION, m
, \
o co -
\ \ \ C'"\ \ \\ \ \
c- \ , , \ , \ , \
\ \ \ \ .,.. \ \ \
\\ ... \
\ \ \ \ \ \ ... \ \ \ \ \ ~ \ \ I ... \ 'I ,. I I \ I I \ 'I \ \ \ \ \, , ... \ , 1\ , I I , \ I \ '\ , '\ \
i \ \ \ .. \
CD , c CD I
-- .~ g \ ~ e::-I o CD ",,,,-~
DIII III
o
'" ., III co
'"
., N
N
o
1&1 U Z C tIII -Q
Figure 4.5. Strath surfaces surveyed at 13 sites between Honeydew (48 km) and the river mouth (0 kII). Radiometric age of lowest strath is indicated at charcoal sample site. Vertical exaggeration is 75 times.
131

132
at 13 sites. Each strath is overlain by <2 m of lag gravel deposits.
The two lowest terraces are the best preserved and most extensive; they
were followed semi-continuously in the field, and mapped with large
scale aerial (1:12,000) photographs. Charcoal and wood from the base
of the alluvial gravel overlying the lowest strath was dated
radiometrically at 5435±45 yrs BP (USGS lab). A preliminary age of
5145 was obtained from a second sample from the same site. This strath
surface is 3-6 m above the present channel floor, thus indicating a
mean rate of channel downcutting of approximately 1 m/ky. Correlations
of the four higher straths are very tentative because these surfaces
were not followed continuously in the field, and no other evidence,
besides surface preservation and altitudinal position, was used in
correlation from site to site.
The terrace correlations indicate no significant structural
deformation of the strath surfaces with time. This would suggest that
uplift in coastal northern California is due to regional folding or
tilting, rather than to movement along discrete faults or local folds.
The straths exist because the Mattole River, although dominated by
tectonically-induced downcutting, has also experienced periods of
stability and lateral valley floor bevelling when the river is at
equilibrium--in other words, not changing its vertical position in the
reference frame of the mountain. During strath formation, the river is
not incising and there is equality of action, which requires no base
level change--and therefore no absolute uplift--of the river.

133
Second and Third Order Coastal Drainage Basins
A drainage basin has a three-dimensional geometric form. It is
separated hydrologically from adjacent drainage basins by a drainage
divide, and has a length, height (relief), surface area, and volume. -
Measurement and analysis of these variables is collectively referred to
as morphometry. A drainage basin consists ·of two parts: a drainage
network, and the interfluves and ridgecrests left standing from
dissection. Either could be analyzed for morphometric purposes;
however, the most direct response to uplift will be recorded by
streams, and secondarily by hillslopes responding to channel
downcutting and increased relief. This analysis treats the linear,
aerial, and vertical dimensions of the drainage network.
Network Ordering and Delimitation. A drainage network is a
complex system of converging stream segments of different magnitudes
and orders (Fig. 4.6). Ordering of a stream network is a method of
ranking or counting each stream segment so that those of similar
magnitude can be compared, thus it serves as a general substitute for
discharge, or position of the segment within the drainage system. The
best-known ordering schemes are those of Strahler (1952) and Shreve
(1967) (Fig. 4.6). Both ordering methods are objective and commonly
used for morphological studies, however the latter may be up to 50 . percent more time consuming, as the number of individual links defined
is greater (Smart, 1978). The choice of ordering does not
signif~cantly alter comparisons between basins in this study, thus the
Strahler method was used. All basins analyzed in this study are second

134
Figure 4.6. Planimetric view of Big Flat Creek drainage network, and two methods of designating stream orders. a) Strahler method (1952). Each fingertip tributary is a first order stream; when two stream segments of equal order join, a higher order stream is formed. Total basin order is three, and number of stream segments measured is 18. b)Shreve (1967) method. Each fingertip tributary is a first order link. Each time a link is added to the circuit, the downstream magnitude increases one value. Thus, the total magnitude of the basin is equal to the number of first order links-25.

135
or third order networks1 according to the Strahler method. and have
between two and 23 first order links. or magnitudes of 2-23 according
to the Shreve method.
Measurement Methods. Twenty-five second and third order basins
were analyzed. The scale and purpose of this study dictated the choice
of the blue line (hydrological) method for delimiting drainage
networks. The recommended scale of maps for morphometric analysis.
1:24.000 (Smart, 1978), with 40-foot (12.2 m) contours, was used as the
primary data source throughout the study. Because this is a
comparative study of a large region, the key factor is consistency.
Blue-line networks of the drainage basins are shown in Fig. 4.3.
Variables measured were stream length, drainage area~ channel slope,
and stream orientation for each first, second, and third order
(Strahler order) stream segment (Tables 4.1 and 4.2). A Numonics
digitizer was used to measure stream length and drainage areaj
instrumental and operator error is about ±0.4%. Azimuthal orientation,
from head to mouth. of each first order stream segment was measured
with a protractor. Elevations were interpolated from 40 foot (12.2 m)
contour intervals. and slopes were calculated from the ratio of
elevation difference to length.
For each drainage basin, every blue line was included, thus the
data represent the total population of variables. rather than a sample
population. However. an inherent problem in this analysis is the small
lStream order in this study refers to that obtained from the blue lines on 7.5' topographic maps. Actual stream order is that obtained from field- and/or aerial photo-checking, and is generally N + 2 for each blue-line order in this area.

Table 4.1. Morphometric properties OT coastal drainage basins, with analysis of geometrical similarity;
111/0' D,.In~ Singley Davl. Fourmile e...,.,. Rand~1 Spe.n1ah Big Big FIM SII' • 2 4 5 6 7 8 11 12 Location, km 0.3 12.0 24.7 30.6 33.5 36.3 41.0 45.3 f., Order:
Number 01 .. gm.nlo 14.0 13.0 11.0 17.0 7.0 5.0 7.0 13.0 Ltnglh, mun 1.1 1.2 1.0 1.2 0.8 1.0 1.0 1.2 L.ng!h, rong' 0.2-1.8 0.5-2.0 0.6-1.3 0.7-1.8 0.5-1.1 0.6-1.6 0.6-1.2 0.6-2.5 Ar ... m .... 0.9 0.9 0.6 0.7 0.4 0.6 0.6 0.1 Ar ... ""11' 0.1-1.8 0.2-1.5 0.3-1.0 0.2-1.7 0.2-0.7 0.3-1.3 0.4-0.11 0.2-2.7 Dralnallo D.nllly, m .... 1.7 1.5 2.0 2.2 2.0 1.7 1.8 1.1 Drainage D.ntlly, ot 1.2 0.5 0.8 1.0 0.8 0.3 0.3 1.0
2nd Onhr: Humber 01 .. gmonlo 2.0 2.0 1.0 3.0 1.0 2.0 2.0 4.0 Ltngth, mun 11.9 5.2 18.4 5.1 8.0 2.8 4.2 4.11 Ltng!h, r"'g' 8.8-18.9 3.0-7.4 2.7-6.3 1.7-3.5 2.8-5.7 2.3-7.11 Art .. m .... 10.0 4.4 13.0 3.0 4.9 1.8 3.1 3.4 Art .. rugo 6.3-14.0 3.1-5.8 2.4-3.8 0.8-2.8 2.3-3.9 1.2-5.7 Drainage D.ntlly, m.an 1.2 1.1 1.4 1.6 1.8 1.8 1.4 1.5 Dralnlg' D.ntlly, ot 0.1 0.2 0.4 0.4 0.2 0.3
3rd OrlNr: Humber 01 .. gmon" 1.0 1.0 1.0 1.0 1.0 1.0 Ltngth 24.4 22.8 28.7 7.3 11.0 22.3 Art. 21.0 17.8 14.5 4.8 9.4 18.0 Drainage D.nally 1.2 1.3 2.0 1.5 1.2 1.4
RolT.f 809 921 899 899 728 757 1081 1248 Buin Ullfllh 7.5 7.4 7.9 5.4 3.2 3.9 4.6 5.7
Anatyata of GNm.'rlcal Similarity
111 Order Length 0.9 1.0 0.8 1.0 0.7 0.8 0.8 1.0 2nd Order Lenlllh 2.8 1.1 4.0 1.1 1.7 0.8 0.9 1.0 3rd Ord.r Length 1.1 1.0 1.3 0.3 0.5 1.0 lal Order Ar .. 1.1 1.1 0.8 0.9 0.7 0.9 0.9 1.0 2nd Order Area 1.7 1.1 1.9 0.9 1.2 0.7 0.9 1.0 :lrd Order Ar .. 1.0 0.9 0.8 0.5 0.7 0.9 1st Order Dr. Dens.. 0.9 1.1 0.8 0.7 0.8 0.9 1.0 0.9 2nd Order Dr. DlnL 1.1 1.2 0.9 0.8 0.8 0.7 0.9 0.9 3rd Order Dr. Dina. 0.9 0.8 0.8 0.7 0.9 0.8 Varlanc. 0.30 0.01 1.8 0.04 0.18 0.04 0.03 0.01
te iI ± one standard deviation. 'Value iI ncI a moan. _ • repr_ only ono dell point.
I-' W 0\

Table 4.1. (Continued.)
Mil/« D,.",. SIIIp • ." Q/leh.1I HotN lit. T.MIlf8ph WhaM QL SII •• 13 15 18 17 20 Locellon, km 47.5 51.7 55.0 56.9 69.5 fat Ord.r:
Number 01 .. gmanl. 5.0 8.0 5.0 5.0 5.0 Length, ml.n 1.5 1.0 1.2 1.0 1.4 Langlb, rang. 0.11-2.4 0.7-2.3 0.4-1.7 0.8-1.5 1-1.9 Are .. mlan 0.11 0.8 0.8 0.8 0.9 Arl" ~. 0.5-1.7 0.3-1.7 0.2-2.1 0.5-1.7 0.7-1.5 Dralnag. DenlllY, mean 1.7 1.6 1.9 1.5 1.6 Dralnag. Denally, 8f 0.1 0.7 0.8 0.5 0.3
2nd Orr»r. Number 01 .. gment. 1.0 2.0 1.0 2.0 1.0 Length, moan 11.1 5.6 9.1 3.5 12.7 Langth, range 3.3-7.8 3.1-3.8 Ar ... m.an a.1 4.1 6.8 2.7 9.3 Are .. rang. 2.7-5.5 2.4-3.0 Dralnag. D.nlllY, mean 1.3 1.3 1.3 1.3 1.4 Draln.g. D.nally, .t
~rrI Ordor: Number 01 .. gment. 1.0 1.0 Length 11.9 8.8 Are. 12.0 7.8 Dralnag. Dlnal1y 1.0 1.2 R.II., 12411 1004 720 760 671
Buin Length 4.1 4.2 3.4 8.1 4.2
An./yata of Goolflllrical S/mU.,lty
1.& Ordor Length 1.3 0.6 1.0 0.8 1.2 2nd Order Length 2.4 1.2 2.0 0.8 2.8 ard Order Length 0.5 0.4 1.t Order Ar •• 1.1 1.0 1.0 1.0 1.1 2nd Order Are. 1.5 1.1 1.4 0.9 1.6 ard Order Ar •• 0.8 0.8 1s1 Ordor Dr_ Dona. 0.11 1.0 0.8 1.1 1.0 2nd Order Dr_ Dina. 1.0 1.0 1.0 1.0 0.9 3rd Ordor Dr. D,n •• 1.1 0.9 V.rl.nc. 0.30 0.04 0.19 0.05 0.51
"f$ Is ± onl standard devillion. 'Value fa not • moan, ... ropr_ aNy one dell poi ...
.-.... """ .. n Ab<JI .. 1Md1llh 21 25 27
79.8 106.5 116.2
11.0 10.0 6.0 1.1 1.2 1.5
0.5-2.2 0.7-1.8 0.8-2.3 0.8 0.8 1.0
0.3-1.5 0.4-1.4 0.2-1.7 1.8 1.6 1.7 0.3 0.5 0.9
3.0 3.0 1.0 4.4 4.6 12.0
2.0-8.4 2.8-5.7 3.1 3.6 8.0
1.2-6.6 2.3-5.2 1.6 1.3 1.5 0.2 0.2
1.0 1.0 13.2 22.9 14.0 21.0 0.9 1.1 568 697 415 4.8 8.5 4.1
0.9 1.0 1.3 1.0 1.0 2.8 0.6 1.0 1.0 1.0 1.1 0.9 1.0 1.5 0.8 1.0 1.0 1.0 0.9 0.8 1.0 0.9 1.2 1.0
0.03 0.00 0.41
I-' \..oJ ~

Table 4.2. SUJIIIDBry of channel slope data for coastal drainage basins.
1st Order Channel Sloe,es 2nd Order Channel Sloe,es 3rd O. Major Drainage Channel and site # Location, km Number Mean Range s Number Mean Range s Slope
! Unnamed, 1 0.3 2 8.9 7.3-10.5 1.6 1- Singley, 2 6.2 14 11.9 5.1-18.3 4.2 2 3.4 2.9-4.0 0.6 1.2
Durr, 3 8.7 2 12.8 11.4-14.3 1.4 Davis, 4 12.0 13 14.2 8.5-24.1 4.3 2 6.3 S.7-6.B 0.6 2.6 Fourmile, 5 24.7 11 15.0 11.3-18.8 2.2 1 2.9* Cooskle, 6 30.6 17 14.4 11.0-24.0 3.9 3 6.3 4.0-B.S 1.B 2.3 Randall, 7 33.5 7 19.6 17.0-22.0 1.7 1 6.B* Spanish, 8 36.3 5 20.6 15.0-25.0 3.4 2 10.2 6.B-13.S 3.3 3.4 Oat, 9 37.4 2 18.5 17.0-20.0 1.5 Kinsey, 10 38.6 4 22.5 20.0-25.0 2.1 Big, 11 41.0 7 24.4 19.0-29.0 3.1 2 10.4 6.B-14.0 3.6 4.S Big Flat, 12 4S.3 13 21.8 18.0-31.0 4.4 4 S.7 3.4-9.6 2.B 2.3 Shipman, 13 47.5 5 19.8 16.0-24.0 2.9 1 B.O* Buck, 14 49.2 2 22.5 20.0-25.0 2.5 Gitchell, 15 51.7 8 19.7 14.0-28.0 4.7 2 7.7 7.4-B.0 0.3 2.9 Horse Mt., 16 55.0 5 14.7 8.5--29.0 3.9 1 5.9* Telegraph, 17 56.9 5 14.0 9.6-18.3 3.3 2 4.6 4.0-S.1 0.6 2.6 Whale Gulch, 20 69.5 5 12.9 9.6-16.1 2.7 1 2.9* Jack Ass, 21 79.8 11 13.2 10.2-17.7 2.7 3 4.B 2.3-6.3 1.B 1.7 Hardy, 22 100.7 8 9.6 6.8-1S.8 2.B 2 4.1 3.B-4.4 0.3 1.0 Juan, 23 101.7 13 13.B 7.9-1B.5 3.1 2 6.4 4.9-B.0 1.6 1.3 Howard, 24 104.8 8 12.8 9.2-1B.2 3.2 2 6.4 3.4-9.4 3.0 DeHaven, 25 106.5 12 11.4 6.3-17.7 3.7 3 4.6 4.0-5.1 0.4 0.9 Wages, 26 107.5 23 13.1 3.9-20.3 4.6 3 4.1 3.2-5.5 1.0 1.2 Abalobadlah, 27 116.2 6 7.0 1.7-14.6 4.0 1 1.2*
Channel slopes are in degrees. *Value is for a single segment, and is not a mean. s is population standard deviation.
.-. w CD

139
number of samples in each population. With increasing stream order,
the sample size decreases, .thus means have larger standard deviations
and less significance. This problem·must be recognized when comparin~
trends in means of individual properties that might relate to
tectonism.
Analysis of Coastal Drainage Basin Morphometries
The objective of this analysis is to compare morphological
variables for basins responding to low, intermediate, and high rates of
uplift. Three methods are used here. The first is based on the
concepts of dimensional analysis and geometrical similarity presented
by Strahler (1958; 1964). The second is a spatial comparison of
individual morphometric properties to the uplift rate curve of Fig.
4.4. The third method is an analysis of longitudinal profiles of major
trunk streams, using the str~am-gradient index (Hack, 1957, 1973).
Dimensional Analrsis and Geometrical Similarity
Horton (1945), the first to define and quantify the methods of
stream network analysis, was also the first to note that stream systems
developed in similar materials and from similar processes are
genetically similar, and may also be geometrically similar (Fig. 4.7).
Strahler (1958) applied the concept of geometrical similarity to a
dimensional analysis of drainage basins in different regions. If two
drainage basins are considered, one being a model (the smaller basin)
and the other a prototype (the larger basin), variables that define
their shape dimensions--regardless of differences in size--can be
tested for geometrical similarity (Strahler, 1957). If the basins are
geometrically similar, linear properties, such as stream length or

BASIN A
I I I
H'c::J
L' p' H' -=-=-L P H
l= Area A Area B
II I I I I I I I
. I
I
H[?1
Corresponding Angles: 0(.'
Figure 4.7. Principles of dimensional analysis and geometrical similarity (modified from Strahler, 1957).
,
140

141
basin perimeter, are related by a constant proportionality factor, k
(Fig. 4.7). Corresponding two-dimensional properties, such as basin
area, are related by the square of the proportionality factor, k2, and
properties with the dimension of inverse of length, such as drainage
density, are related by the ratio l/A. Corresponding dimensionless
values such as tangents to curves (slopes) are equal if two drainages
are geometrically similar.
Each coastal drainage" basin was compared with others in areas
of presumed different or similar uplift rates, and tested for
geometrical similarity. The results of this analysis indicate a
striking degree of geometrical similarity of planimetric properties for
all 25 basins, but differing degrees of similarity for vertical
dimension properties. As rock types and climatic conditions are
assumed to be uniform between adjacent basins, and throughout the study
area, this method can be used to identify those morphological
components that are not similar, and may be reflecting tectonically
controlled differences.
An example of an analysis of geometrical similarity is the
comparison of three basins, DeHaven, Singley, and Big Creeks, that
represent low (0.3 m/ka), intermediate (2.8 m/ka) , and high (4.0 m/ka)
uplift rates, respectively, as based on their proximity to sites in
Fig. 4.4 (Table 4.3; see Fig. 4.2 for locations). The proportionality
constant was calculated for each morphologic variable, using Big Creek
as the model. These two basins, and especially their 1st and 2nd order
subbasins, are very similar in plan view, but highly dissimilar in the
vertical dimension (Table 4.3). Values of the proportionality constant

142
Table 4.3. Comparisons of three streams--for ar~as of low, intermediate, and high uplift--for geometrical st.ilarity.
SIngley/Big DeHaven/Big
l~t Qrd.e.c. S,tle.aam ..l 2-Length 1.1 1.2 Area 1.5 1.3 Dr. Density 1.1 1.0 Channel Slopes 11.9°/24.4° 11.4°/24.4°
ZD.d. C2J:.d.flC s'tc.Qil.Clm Length 2.8 1.1 Area 3.2 1.2 Dr. Density 0.9 0.9 Channel Slopes 3.4°/10.4° 4.6°/10.4°
~c.d. Qc.d.flC S,tC.Qil.Cllti Length 2.2 2.1 Area 2.2 2.2 Dr. Density 1.0 0.9 Channel Slopes 1.2°/4.5° 0.9°/4.5°
Elatila LflOa.t1l 1.6 1.8 Basio BflUflf 0.8 0.7

143
for planimetric properties range from 0.9 to 2.2, although all but two
values cluster together, between 0.9 and 1.3 (Table 4.3). The
proportionality constant for ·relief is low, 0.7, and indicates that
this property is not geometrically similar, relative to the others.
Likewise, values of channel slopes (Table 4.3) indicate that those at
Big Creek are 2.1 to 5 times greater than those at DeHaven Creek.
Likewise, if Singley Creek (prototype) and Big Creek (model)
are geometrically similar, the value of ~ will be the same for each
property. For planimetric properties, the proportionality factor, ~,
ranges from 0.9 to 3.2, and clusters between 0.9 and 2.2 (Table 4.3).
Higher values for 2nd order stream lengths and areas are caused by an
unusually large second order subbasin in Singley Creek. The value
obtained for relief is low, 0.8, because Big Creek has a much greater
maximum relief than Singley Creek. Similarly, the dimensionless values
of channel slopes are not equal, as predicted for geometrical
similarity. Each Big Creek value is about twice as great as the
corresponding Singley Creek value. Thus, these two basins are also
fairly similar in plan view, but highly dissimilar in the vertical
dimension.
A means of identifying the most geometrically similar basins is
to calculate the variance of the ~ values of all morphological
properties for each comparison between a selected model basin--in this
case DeHaven Creek--and all other basins. The higher the variance, or
dispersion about a mean value of ~ for each comparison, the less the \
degree of geometrical similarity between the two basins. Analysis of
variance for planimetric properties (Table 4.1) indicates that the
-._--_.,._---------------

144
relative degree of correspondence is very good for all basins. The few
anomalous values are for 2nd order stream lengths and subbasin areas at
Singley Creek, Whale Gulch, and Fourmile Creek. These basins have
exceptionally long 2nd order streams. Comparison of channel slopes is
discussed later.
Spatial Trends in Planimetric Morphological Properties
A similar means of portraying this planimetric correspondence
is to consider the ~ value of one property, such as mean drainage
density, for different basins. These values are nearly the same for
each comparison, because individual properties vary little throughout
the study area (Table 4.1). This is the approach used in the second
analysis of fluvial response to uplift, although the variable itself,
not its ratio with that of another basin, is compared along the coast.
The uplift rate curve of Fig. 4.4 is used for this treatment, as the
mean drainage basin value of each morphological property is plotted
along the same N300W coastal transect as the known and inferred uplift
rates.
Fig. 4.B is a plot of mean first and second order drainage
densities for all third order basins along a N300W transect, with the
uplift rate curve included for comparison. The slope of the best-fit
straight line for first and second order drainage density shows no
increase or decrease related to uplift rates. Slightly greater
drainage densities in the Cooskie Creek area reflect decreased
resistance of rocks in the major west-trending shear zone that passes
through the Cooskie Creek drainage basin (Fig. 4.2). A comparison of
drainage density with relief (Fig. 4.9) also shows no correlation.

5
~e • 1st Order .III 4 .... --I!I-- 2nd Order e .III
= 3 .. 0; c: CI:I 1:1 2 CI:I CII II c: 'ii .. 1:1
0 0 50 100 150
10
1200 8
as 900
~ 6 E Ii
..: ~
as 600 Gi a:
4 a: ~ a. ::I
2 300
Ell
0 0 0 50 100 150
Distance along N300W tranaect, km
Figure 4.8. Drainage density of first and second order subbasins for each major coastal drainage basin, along a N300W transect from Fort Bragg (-120 km) to Cape Mendocino (0 km). Also shown are uplift rates and maximum drainage basin relief along the same coastal transect. Best-fit lines indicate that drainage density does not vary with relief or uplift rates.
145

f
4
N
e .:w: '- 3 e .:w: :i ... • 'iii 2 • c • II) • = • • • • • II)
= 11:1 C .-11:1 ... =
0 400 600 800 1000 1200 1400
Relief, m
Figure 4.9. Relation between first order subbasin drainage density and maximum drainage basin relief indicates that blue-line drainage density is unrelated to relief in·the coastal northern California study area.
146

147
Drainage density appears to be unrelated to relief or uplift, and is
apparently controlled largely by other factors which are similar
throughout the study area. Many workers have cited the dependence of
drainage density on lithologic and climatic controls (Abrahams, 1984),
thus the similarities in drainage density suggest that the initial
assumptions of constant climate and rock resistance are valid.
Both the analyses of .geometrical similarity and the comparison
of drainage density t.o the uplift rate curve indicate that planimetric
network properties are largely insensitive to uplift and relief, but
probably strongly related to similar lithologic and climatic
conditions. The remainder of this analysis concentrates on landscape
elements in the vertical dimension that do vary, specifically channel
slopes.
Spatial Trends in Channel Slopes
First, second, and third order channel slopes for all third
order basins are plotted along a N300 W coastal transect in Fig. 4.10.
The significance of these plots is that 1) the shape of each curve is
similar to that of the uplift rate curve, and 2) the greatest variation
in channel slopes is in first order streams, which vary from 7 to
24.40 , with lowest values near Fort Bragg and Singley Creek, and
highest values immediately north of Big Flat (Table 4.2). The plot of
second order channel slopes is similar, as channel slopes vary from 1.2
to 10.40 • Likewise, third order channel slopes have low values of 1.20
in the north, at Singley Creek, and 0.90 in the south at DeHaven Creek,
and high values of 3.40 and 4.50 at Spanish Creek and Big Creek,
respectively (Table 4.2). Thus, all three plots show channel slopes

30
11/ Q)
e C) 20 Q) 'tJ ai Q. 0 en
Gi 10 c C 111 .c CJ
o~~~~~~~~~ a 20 40 60 80 100 120
Distance along N30W transect, km
4
or cu lU a:~ 2 =-::E Co ~
0 a 50 100 150
Distance along N300W transect, km
Figure 4.10. Variations in mean values of first, second, and third order channel slopes for each coastal drainage basin, plotted along a N300W coastal transect. Error bars for first and second order channel slopes are ± one standard deviation. Note that some drainage basins had only one second order stream, thus values are not means, and have no standard deviations. These values are generally low, as the streams are graded to sea level rather than to a third order trunk stream, and are not included in the curve fit.
-- --------------_._--
148

that gradually steepen towards Big Flat and Big Creeks' from the north
and south.
Discussion of Morphological Analyses
149
The observed trends in channel slopes seem to correlate
directly to spatial variations in uplift, and the landscape elements
most sensitive to tectonism are--from least to most sensitive--third,
second, and first order channel slopes. During rapid uplift, streams
are rejuvenated, channels downcut, stream gradients increase, and
valley walls are oversteepened. Larger streams are able to maintain
their profile forms through time by incising rapidly enough to adjust
to lower base levels. Smaller tributaries tend to be modified by and
to accumulate the effects of net base-level fall over a period of time,
and have steepest profiles in the areas of highest uplift. These
results indicate that studies of slopes of higher magnitude streams,
such as third order slopes in this study, are not nearly as likely to
yield useful results as studies of lower order tributaries.
Although the trends in mean channel slopes (Fig. 4.10) may be
related to increasing rock resistance towards the center of the study
area, from the Coastal terrane to the King Range terrane, we consider
it to be a reflection of higher uplift rates for several reasons.
First, a difference in rock erodibility that would be great enough to
cause a two-fold increase in mean basin channel slopes should cause a
corresponding variation in drainage density, but no such change is
observed. Second, all three orders of channel slopes increase
regularly from Singley Creek to Big Creek, then decrease regularly from
Big Creek to Telegraph Creek. The increase and decrease may be

150
spurious results of small populations, however the fact that all three
orders follow this pattern with few exceptions suggests that the trend
is real. Third, the geomorphic map of Ellen (unpub. map; pers. comm.,
1986) indicates large amounts of "soft" rocks in the Singley, Davis,
Spanish, and Big Creek drainage basins, where the corresponding
increases in mean first order channel slopes are from 11.9, to 14.2,
20.6, and 24.4°, respectively.
A final indication that the trends in channel slopes are
related to uplift rates is their striking correspondence to the uplift
rate curve. The curves are roughly parallel with one another and with
the gross topography of the mountain crest. A notable disparity is
lower first-order channel slopes than what would be expected in the
intermediate-uplift Singley Creek area, where mean channel slopes are
similar to those in the low uplift area near Fort Bragg. However, the
MTJ has only recently migrated to this part of the coast, thus a recent
increase in uplift rates might not yet be reflected in the landscape
elements. For example, a recent change in uplift rates from low to
intermediate would result in a wave of increase in base level fall rate
propagating upstream, during which time the population of channel
slopes would consist of both steep and gentle channel gradients. Thus,
mean channel slopes for such a basin would be lower than for a basin
responding to intermediate rates of uplift for a longer period of time.
A similar argument can be presented in the case of a drainage basin in
an area that has recently changed from high to interme~iate or low
uplift rates.
------ ----------

151
G~adient Analysis and Time
The steepness of high uplift d~ainage basin channels ~elative
to those in low uplift a~eas can be used to estimate the amount of time
~equi~ed to steepen an initially g~aded slope in a low uplift ~ea to
that ~esponding to long-term base-level fall in a high-uplift a~ea.
The goal of this analysis is to estimate how much time would be
~equi~ed, afte~ uplift ~ates increased from low values to 4.0-m/ka, to
steepen a graded stream profile to the ungraded conditions obse~ed at
present. Channel profiles in areas of low uplift are presumed to be
adjusted to the given conditions of rock erodibility, climate, and
uplift rate with a form that is constant in time. Fig. 4.11 was
constructed from a composite of typical mean channel slopes, ~eliefs,
and stream lengths in a low uplift area. This typical low uplift
stream is compared to a composite example of an unadjusted stream in a
high uplift area. Both are considered to be geometrically simil~ in
planimetric aspects, but have greatly diffe~ent channel slopes.
Several assumptions are made to simplify the gradient analysis.
First, third order streams can apparently adjust to most of the base
level change with spatially uniform incision, thus the mouth of the
second order stream feels the same change in base level as the mouth of
the third order stream. This assumption is supported by the small
change in third order channel slopes throughout the field area (Fig.
4.10). Second, the upstream end of the first order stream is the upper
limit of incision, and is fixed relative to the mountain crest, with an
assumed zero rate of erosion. Third, the rate of incision should
decrease rapidly upstream, proportional to decreasing discharge, thus
1----------- ------------------------ ----------

800
600
E ,. 'a ~ 400 = = c(
200
SeaLevel
~ 3rd Orde~ ... 2nd Order ~~ 1st ~ Order ~
\l!I .Q.
2°
2°
0 2 3
Distance, km
4
Figure 4.11. Incision analysis. Upper stream profile represents a composite example of typical channel slopes, reliefs, and stream lengths for 1st, 2nd, and 3rd order subbasins in a low uplift area. Lower stream profile is the same, but represents a drainage basin in a high uplift rate area. Shaded arrows represent uplift, solid arrows downcutting. Lettered locations in circles are A, mouth of 3rd order stream, B, mouth of second order stream, C, mouth of 1st order stream, and D, mouth of 0 order stream. Underlined values are amounts of downcutting, in m. Subbasin reliefs in m.
-------------------- -----------------
152

153
the average incision rate for the second order stream is larger than
that for the first order stream, and the change in incision rate along
the length of the first order stream is larger than that for the second
order stream.
Working downstream from the head of the first order stream, in
the adjusted profile, steepening of the first order channel slope from
12 to 250 would be caused by .an increase in subbasin relief from 296 to
444 m, or 148 m of incision at the downstream end of the first order
channel (Fig. 4.11). Steepening of the second order channel slope from
5 to 110 requires additional incision of 293 m at the downstream end of
the second order channel. This is the net uplift of the mountain
crest, and is assumed to be equal to the total accumulated amount of
uplift, or total base-level change, that would result from constant
uplift of 4.0 mlka for a certain period of time. At 4.0 mlka, 293 m of
base level change would require uplift for 73 ka (without considering
glacio-eustatic variations). This value is very reasonable in terms of
the local tectonic setting and the rates of geomorphic processes
themselves.
Analyis of Tectonic Tilt
The Models. The uplift rate curve (Fig. 4.4) indicates
differential uplift that resembles the cross-sectional shape of a fold
with limbs tilting in opposite directions. We view this differential
tilt along a N300 W transect of the coast, and procede to calculate
rates of apparent (therefore minimum) tectonic tilt of the land surface
in that orientation. The azimuthal direction of maximum tilt is not
known, nor is the cause, although several models have been proposed and

154
will be discussed later. If the landscape is tilting to the nor'~h and
south at high rates, it should be reflected in south- and north-facing
first order channel slopes. Note that the cause of uplift is presumed
to be migrating with the MTJ, and valleys north of the area of highest
uplift are just beginning to rise, thus the area between Fourmile Creek
and Big Flat Creek is assumed to be the locus of the change in
direction of tilt for the past 50-100 ka.
Along the north flank of the fold, between Bear River and Big
Flat Creek, the differential tilt rate is 2.0 mlka to the north over a
distance of 23 km, or 0.09 m/ka-km (angular tilt = 0.005°/ka) (Fig.
4.12). Along the south flank of the fold, between Big Flat Creek and
Point Delgada, the differential tilt rate is 3 mlka over a distance of
17 km, or 0.18 m/ka-km to the south (angular tilt = O.Olo/ka). Between
Whale Gulch and Bruhel Point it is 0.7 m/ka over a distance of 45 km,
or 0.02 m/ka-km (angular tilt = 0.0010 ). No differential tilt occurs
in the low uplift rate Fort Bragg area or at the peak of the uplift
rate curve, between Fourmile and Big Flat Creeks.
Fig. 4.12 contains a diagramatic cross-section of the Fort
Bragg-Cape Mendocino coastline centered on an uplift fold, with
longitiudinal profiles of opposing pairs of first order channels
located on both flanks of the folding mountain. Initially all channels
had the same gradient of 15°. During subsequent folding, streams
flowing in the direction of tilt are steepened, regardless of aspect.
Each thousand years, the valley south of Big Flat is tilted upwards
0.010 to the north, based on differential tilt from the upli~t-rate
curve. Such tilting should cause preferential steepening of channels

Channel Sages
Valley Tilt Valley Tilt
~.
0.08 No 0.18 0.02 m/ka·km Tilt m/ka·km m/ka·km No Tilt . ..~. ... ... ..
4
2
ol---~--~--~~;===~~ o 50 100 150
Distance along N3O"W transect, km
Figure 4.12. Schematic diagram of valley side tilt analysis. Differential uplift is assumed, and consequent tilt rates are determined from the uplift rate curve.
:,

156
developed on the no~th side of the valley, relative to those on the
south side. The opposite phenomenon should occu~ north of Big Flat
Creek, where valleys are being tilted upwards 0.0050 to the south each
thousand years. In this case, north-facing channels developed on the
south side of the valley would be steepest.
Three models are used to separate channel slope directions into
azimuthal classes that might reflect fold orientation with respect to
proposed mechanisms of uplift, in order to identify the most likely
direction of maximum tilt. In the first model, uplift is assumed to be
related to the migration direction of the MTJ, and/or the trend of the
San Andreas transform boundary, thus the tilt direction is along a
N300 W transect. North of the Big Flat area, maximum tilt is in the
direction of N300 W, to the north, and south of the Big Flat area it is
in. the direction of S300 E, to the south. This model is referred to as
the transform model, because the axis of maximum uplift is
perpendicular to the transform boundary.
In the second model, tilt is assumed to be due to 1) isostatic
and thermal adjustment of the North Ame~ican plate lithosphere to
removal of the underlying subducted slab and development of a slab
window (Dickinson and Snyder, 1979a; Fu~long, 1984), or 2) isostatic
adjustment of the lithosphere to the subducted south-facing Mendocino
fracture zone escarpment (1 km high) as it moves unde~ the North
American plate (Glazner and Schubert, 1985). In either case, the axis
of maximum uplift should be parallel to the Mendocino fracture zone.
The fracture zone forms the southern edge of the Gorda plate, and has
an azimuthal trend of S800 E, as determined from ae~omagnetic anomalies

157
(Griscom, 1980). The orientation of maximum tilting would be
perpendicular to the fracture zone trend: NIooE north of the region of
greatest uplift due to the fracture zone, and SlOoW south of the region
of greatest uplift due to the fracture zone. This model is referred to
as the fracture-zone model.
In the third model, tilt is considered to resemble a dome,
rather than a broad cylindrical fold, that is due to either or both the
fracture zone or transform boundary configurations, and thus has a
range of tilt directions from NIooE to N300W north of the region of
highest uplift, and from SIOoW to S300E to the south.
These models and hypotheses were used to divide first order
channel slopes data into four classes, based on stream orientations.
Two classes include streams flowing within ±40o of the direction of
maximum tilt either to the north or south, and the remaining two
classes include those streams flowing outside that range, i.e., closer
to parallel with the tilt axis. It was assumed that the former two
classes would be affected by tilt, whereas the latter would not. For
each of the three models, the two classes of channel slopes affected by
tilting are plotted with distance along the N300 W transect (Fig. 4.13;
in this case because it parallels the coastline and apparent uplift
rate curve, without reference to any tectonic model). Thus for every
drainage basin there is a set of one or two points that represent mean
channel slopes for streams facing north or south with orientations
within + 400 of the assumed tilt direction. However, in some drainage

30
~ g' 20 'tI
! o iii ~ 10 c .! (J
O+-~-r~--~T-~~~~~r-~~
o 20 40 60 80 100 120
Dlslance I km
(a)
30 south-facing channels
20
10
O+-~.--r~~-'~~r-~~~~ o 20 40 60 80 100 120
Dlslance I km
(b)
30 south.faclng channer.
~/ 'R> 20 ~\
~..... / ~,o ,,0---; " ,.
rJ • 'C1' 0
north.faclng chan~els 10
O+-~'-~-r--~~~ __ ~--~ o 20 40 60 80 100 120
Distance I km
(c)
Figure 4.13. Tilt analysis for first order channel slopes. Open circles represent mean slopes of stream channels facing south, and developed on the northern valley wall. Solid circles represent mean slopes of stream channels facing north, and developed on the southern valley wall. a)Transform model; b)fracture-zone model; c)composite model •
158
. _ .............. ----------------------------------

basins, a single point exists rather than a pair, because no streams
had orientations within a particular azimuthal class.
159
In the analysis of the first model (Fig. 4.13a), the transform
model, mean first order channel slopes of all but one set (Fourmile
Creek) of north-facing channels are steeper than south-facing channels
between Singley Creek and Big Creek, as predicted. The differences
vary from 1.5 to 3°. At Big Creek, lines drawn through the two data
sets cross over, and the mean of south-facing channels is three degrees
steeper than that of north-facing channels slopes. This cross-over
demonstrates that aspect does not dominate the difference between
north- and south-facing slopes. From Big Creek southward to Juan Creek
(at 102 km), all south-facing channel slope means are steeper than
corresponding north-facing channel slope means, again as predicted.
The differences vary from 1.6 to go, and are greatest at Big Flat (45
km) and Horse Mountain Creeks (55 km). An exception is Gitchell Creek
(52 km), where both means are the same. From Juan Creek southward, the
three drainage basin data pairs are erratic in that the first, Juan
Creek, has similar means on both valley sides; the second, Howard Creek
(105 km), has steeper north-facing slopes; and the third, Wages Creek
(108 km), has much steeper south-facing slopes.
In the analysis of the second model (Fig. 4.13b), the Mendocino
fracture zone model, north-facing channels between Singley Creek and
Big Flat Creek are steeper than south-facing channels in three of five
cases. The differences vary from 2.3 to 5°. Between Big Flat Creek
and Juan Creek (102 km), south-facing channel slopes are 1.2 to 3.80
steeper, although only two sets of points are actually pairs from the

same drainage basins, as only two drainage basins have north-facing
streams that flow within ±400 of NlooE. From Juan Creek south north
facing channel slopes are 2 to 4.10 steeper than south-facing channel
slopes.
160
In the analysis of the third model (Fig. 4.l3c), the composite
model, the data sets are larger, as more streams fall into the broader
azimuthal ranges (subtending 1200 rather than 800 zones). As· in the
transform model, all but one basin north of Big Creek--Fourmile Creek-
have steeper north-facing than south-facing mean channel slopes. The
difference varies from 1.5 to 50. From Big Creek southward to Juan
Creek, all south-facing channel slopes are greater, as predicted. The
difference varies from 1.3 to 7.10 , and is substantially larger for all
data pairs south of Big Creek. From Juan Creek southward, two north
facing ch~nel slope means are about 20 greater than south-facing
means, and a third basin, Wages Creek, has approximately equal mean
values.
Discussion of Tilt Analysis. General features of the plots
that would be predicted by all three models based on the uplift rate
curve are 1) greater amounts of tilt south of Big Flat Creek than north
of it, and 2) the least amounts of tilt south of Whale Gulch--in the
Fort Bragg area, and at the peak of the uplift rate curve--between Big
Flat and Fourmile Creeks. In terms of the channel slope data, closer
values between the pairs of channel slope means would be expected where
tilt is least, and greater differences between the means where tilt is
greatest. The channel slope analyses agree best with the transform and
composite models (Fig. 4.l3a and 4.l3c), as there are fewer exceptions

161
to these characteristics. The plots for these two models are very
similar. They agree best with the model hypotheses in that lines
connecting the two data sets are parallel south of Big Creek, and then
begin to diverge--or increase in difference--at Horse Mountain (55 km)
and Telegraph Creeks (57 km), and finally to converge towards Juan
Creek, where most points cluster closely together. The composite model
(Fig. 4.l3c) has slightly better correspondence to predicted trends in
the low uplift Fort Bragg area, as the data pairs cluster more closely
together.
Tilt Analysis and Geomorphic Processes. The estimates of tilt
rates and differences between north-facing and south-facing channel
slope means can be used to calculate rates of channel slope steepening,
and thus amounts of time that such processes have been occurring.
South of Big Creek, the tilt rate is O.Olo/ka, and the differences
between north-facing and south-facing channel slopes vary from 3.3 to
7.10 for the composite model. A mean channel slope difference of 4.50
is used to estimate how much time would be required to steepen south
facing channel slopes 4.50 more than north-facing channel slopes,
assuming that both had similar slopes before uplift began. For a pair
of oppositely facing streams, one is back-tilted as the other is
forward-tilted through time (Fig. 4.12). Thus, the difference between
the mean channel slopes of opposing streams on the flank of a fold is
actually twice the amount of landscape tilting that has occurred. The
amount of time required to steepen south-facing slopes 4.50 relative to
north-facing slopes is equal to a valley tilt of 2.20 , and would be 220
ka at a tilt rate of O.Olo/ka. A similar analysis for valleys north of

162
Big Creek, using a mean channel slope difference of 2.80, tilt of 1.40 ,
and a tilt rate of 0.005°/ka (Fig. 4.12), yields an estimate of 280 ka.
These values are reasonable in terms of geomorphic and tectonic
processes, given the simplicity of the model.
This model is grossly simplified, as other factors are
involved. Channel steepening is in response to two tectonicailly
driven processes: 1) actual physical tilting of the land surface, and
2) net relative base-level change at the mouth of the drainage basin
and upstream propagation of channel incision. Only the first is
considered in the analysis of tilt with time. The proportion of
influence of each tectonically-driven process can be estimated. At the
two areas of maximum tilting (Fig. 4.13; 35 and 50 km), base level fall
has steepened mean first order channel slopes about 50 relative to low
uplift areas (Table 4.2). At these same locations, tectonic tilt has
apparently produced differential gradients for opposed stream flow
directions of about 20 (Fig. 4.13). In these cases, then, the effect
of tilt is about 40% of the effect of base level fall.
Stream-Gradient Index
The longitudinal profiles of each stream order have already
been identified as the morphologic elements most sensitive to uplift.
The longitudinal profile of the main trunk stream can also be examined
with the stream-gradient (S1) index, a relatively simple method
developed by Hack (1957, 1973) for analyzing stream profiles. The
index is equal to the product of channel slope at a point and total
stream length from the drainage divide to that point. It is used in
this study to examine ten of the third order coastal drainages in areas
-----------------------------------------

of different uplift rates. The results of the SL-index analysis are
used as a comparison with those of the channel slope and dimensional
analyses.
163
Hack developed the SL-index while studying the relations
between channel slope and streambed particle size in generally well
adjusted streams in the Appalachian Mountains. His analyses
demonstrated empirically that SL-index values correspond to differences
in rock resistance, particle size of streambed material, and, by
inference, stream power. In an adjusted stream, the product of
discharge and slope is proportional to stream power and remains
constant along the stream; Hack (1973) suggested that stream length
might be a reasonable proxy for upstream discharge at a point. If so,
the product of slope and length will also be constant along an adjusted
stream, and will reflect an equal distribution of stream power in all
reaches. Keller (1977) predicted that, for a given rock resistance,
anomalously high SL values might reflect tectonic activity. He applied
the index to the San Gabriel Mountains in southern California, and
found that high indices occur where uplift rates are known to be high,
thus verifying the usefulness of the index as a tectonic reconnaissance
tool.
Methods. Horizontal stream channel lengths from the drainage
divide to each topographic contour line were measured with a map wheel
from 7.5' topographic maps. These values were then converted to
channel lengths to the midpoint between each contour interval. Channel
slope at each reach between adjacent contours was calculated as the
ratio of the contour interval (40 ft, 12.2 m) to the horizontal

164
distance between the contours. The 8L value was then calculated as the
product of channel length to each contour interval midpoint and channel
slope for that reach. All longitudinal stream profiles were plotted on
semi logarithmic graph paper, with stream altitude (H) plotted along the
ordinate on an arithmetic scale, and horizontal stream length from the . .
drainage divide (L) along the abscissa on a logarithmic scale. The
equation of a straight line on this type of plot is
H = C - klnL,
where C is a constant and k is the slope of the line. Actual stream
slope is the derivative of this equation with respect to L, or
8 = dH dL
= d(klnL) = k dL L
The slope of a straight logarithmic segment on the semi logarithmic plot
is k, which is equal to the product 8L.
Three of the ten longitUdinal semi logarithmic profiles analyzed
are shown in Fig. 4.14 (see Appendix C for remaining profiles). Each
is classified as a low, intermediate, or high uplift stream from the
uplift rate curve of Fig. 4.4. Reaches with constant slopes, and thus
constant or nearly constant 8L values, are designated as segments.
Average 8L values for each segment are to the right of each profile.
Locally high 8L values that might be underrepresented by the averaging
procedure are also indicated. Anomalously high values are significant
in a study concerned with stream adjustment to recent tectonism, and
may be more important than average 8L values.
SL values and profile forms are related to uplift rates. A
completely adjusted stream will have nearly constant SL values along

500
400
E 300 C
0
'"iI > 200 • W
100 DeHaven Creek
0 2.5 3.0 3.5 4.0
(a)
500
400
300
200 (738)
100 Telegraph Creek
0 2.5 3.0 3.5 4.0
(b)
500 /
400
300
200 (616)
100 Fourmile Creek
04---~--~----~--~--~--~ 2.5 3.0 3.5 4.0
. Log Strellm Dlstlnce, m
(c)
Figure 4.14. Three representative semilogarithmic streaa profiles for low (DeHaven), intermediate (Telegraph), and high (Fourmile) uplift drainage basins. Lines with constant slopes represent stream seglDents with similar 8L values that have been averaged. Average 8L values are shown to the right of the profiles; anomolously high 8L values for individual reaches between contours are indicated in parentheses.
165

166
its entire length, or progressively decreasing 8L values in a
downstream direction if particle size decreases as a result of
transportation (Hack, 1973). Overall profile form on a semilogarithmic
plot will be either straight or slightly concave. An example of a
stream profile adjusted to local climatic and lithologic conditions in
the Cape Mendocino study area is DeHaven Creek, in an area of low
uplift (0.3 m/ka; Fig. 4.14a). In contrast, a partly adjusted stream
might have low, constant SL values near the lower reaches, with
anomolously high values at the mouth, and a number of segments with
alternating high and low SL values in the upper reaches. An example of
such a profile is Telegraph Creek (Fig. 4.14b), in an area of
intermediate uplift (-1 m/ka). An unadjusted stream responding to
higher rates of uplift will have high SL values in all reaches, but
highest values may occur in middle and lower reaches, and overall
profile form will be convex on a semi-logarithmic plot. An example of
such a profile is Fourmile Creek (Fig. 4.14c). These three profiles
are used as reference profiles for low, intermediate, and high uplift
rates, in order to compare and classify tectonic activity of other
drainage basins.
Based on the profile characteristics for unadjusted, partially
adjusted, and adjusted streams, and on the three reference profiles,
the ten basins studied are grouped into one of the three uplift rate
categories, as follows: 1) low--DeHaven, Wages, and JackAss; 2)
interm~diate--Telegraph, and Singley; and 3) hi gh--Dav is , Fourmile,
Big, Big Flat, and Gitchell Creeks. The range of average 8L values for
streams classified as low uplift is 66-393 gradient-me Average SL

167
values are generally higher throughout the profile for streams
classified as intermediate uplift, but have a range ofvalues--89-386
gradient-m--that overlaps that of streams classified as low uplift.
Average SL values for streams classified as high uplift are exceedingly
high, 114-838 gradient-me
This method, although highly useful as a tectonic indicator, is
best used as a reconnaissance tool to classify drainage basins into
categories of tectonic activity at the first-order level. It is
somewhat crude because ranges of SL values overlap between basins, and
all profiles have unique characteristics that make it difficult to
classify them into uplift rate categories. In general, the uplift rate
categories determined from the semilogarithmic profile forms and
average 8L values are consistent with the uplift rates plotted on the
uplift rate curve (Fig. 4.4) and the trends of mean channel slopes.
In an area where uplift rates have only recently increased,
analysis of the main trunk stream, via the 8L index, may be more useful
than analysis of channel slopes of lower order tributaries. Whereas
the trends in channel slope data were useful for distinguishing areas
of high uplift, and were poor indicators of differences between low and
intermediate uplift drainage basins, the SL analysis clearly identifies
Singley Creek as being significantly different than DeHaven Creek and
other streams categorized as low uplift streams.
Conclusions
Each analysis of fluvial response to uplift is based on the
assumptions 1) of overall uniform rock resistance, 2) uniform climate,
and 3) that the combination of altitudinal spacing analysis of marine
--- ---- ---------

168
terraces and radiometric dates provides adequate knowledge of spatial
and temporal variations of uplift rates. Arguments for the assumptions
of constant lithology and climate were based on measurements of rock
mass strength and mapping of geomorphic texture (Ellen, unpubl. map),
and were supported by the high degree of geometrical similarity in
planimetric morpohological properties of drainage basin geometries.
The inferred uplift rates are the best estimates of probable uplift
rates, using current knowledge of sea-level history.
The main result of the dimensional analysis of drainage basin
morpohologies was the indication of a high degree of geometrical
similarity in planimetric properties for all drainage basins studied.
Dimensional analysis also indicated substantial differences in vertical
properties, especially channel slopes. These properties were then
compared to the pattern of spatial variations in up.lift rates in the
analysis of channel slopes, and were found to have a remarkable
correspondence to rates of uplift. The most significant aspect of this
analysis was the finding that third order channel (blue line) slopes,
with the greatest stream powers, are relatively poor indicators of
tectonism, second order channel slopes are slightly better, and first
order channel slopes are the most sensitive to uplift. These trends
clearly identified high uplift drainage basins, however, channel slopes
of presumed intermediate and low uplift rate drainage basins were not
significantly different. Although the stream-gradient analysis yielded
little information regarding the nature of geomorphic adjustment to
uplift, it was able to distinguish between low and intermediate uplift
streams. It was also useful as a reconnaissance tool to broadly

169
categorize uplift rates.
Channel-slope analysis provided the best information for
testing models of mechanisms of uplift, and determining rates of
geomorphic adjustments. This analysis, combined with the dimensional
analysis, indicated that primary responses to uplift are incision ruld
channel steepening due to base level fall and physical tilting.
Estimates of the amount of time required to steepen channel slopes or
tilt valleys enough to create the observed differences in mean north
and south-facing channel slopes are especially significant, in that
they are consistent with both the tectonic timeframes and typical rates
of geomorphic processes.
Although the hypotheses tested herein do not identify the exact
mechanism of uplift in the MTJ region, they do indicate that the nature
of deformation is most likely regional tilt, rather than crustal
shortening with associated folding and faulting. The area of highest
uplift, Big Creek, is about 40 km south of the present location of the
MTJ, thus a lag time between migration and uplift response is
suggested. Furthermore, the channel slope analyses indicate that the
preferred direction of maximum tilt is roughly parallel to the San
Andreas transform boundary.
Inferences regarding rates and natures of deformation from
these analyses are exciting. The methods presented have been little
used in tectonic geomorphology, and provide new tools and hypotheses to
utilize and test in other humid regions, where the effects of
deformation are not expressed as fault scarps or linear, faceted
mountain fronts. These methods may prove to be even as useful, or more

so, in such areas. Other coastal environments with known uplift
rates, and especially differential tilt, will provide ideal locations
to further test these models and methods.
170

MENDOCINO TRIPLE JUNCTION: TECTONIC SETTING
Note 1: Analysis of continuous acoustic reflection profiles run south
of Point Delgada allowed Curray and Nason (1967) to identify zones of
disturbance and faulting along a N17°W trend from Point Arena (Fig.
2.1) offshore toward Point Delgada. At the time, many thought that
ground breakage onshore at Point Delgada was associated with a main
branch of the San Andreas fault system that ruptured during the 1906
earthquake, and suggested that the San Andreas came back onshore to
connect with the surface rupture. However, recent geologic mapping and
radiometric dating of mineralized veins that cross the hypothetical
fault trace indicate that no significant lateral movement has occurred
along this discontinuity since l3.8±0.4m.y. B.P. (McLaughlin et al.,
1979). From Point Delgada northward, the location of the San Andreas
fault is poorly determined by the reflection lines.
Note 2: Inadequate station coverage and highly variable crustal
structures and seismic velocity propagations also complicate
interpretations of local seismicity (Smith and Knapp, 1980). In
contrast to parts of southern and central California, where patterns of
seismicity clearly define surface traces of active branches of the San
Andreas fault system, seismicity south of the Mendocino fracture zone
is diffuse, and few events )M 3.0 are recorded. Other elements of the
171

MTJ are seismically active. The Mendocino fracture zone, along the
southern edge of the Gorda plate boundary, is an active right-lateral
transform fault, and the Gorda Ridge and its eastern subduction zone
are both seismically active (Smith and Knapp, 1980).
172
Despite accumulating evidence regarding the Neogene tectonic
history of the Cape Mendocino-King Range region, a unique
interpretation of magnitudes and senses of displacement and deformation
can not yet be made. None of the three generations of folding
described earlier seem to be related to present tectonic regimes
(Beutner and Hansen, 1975a). Prominent, recent vertical shear planes
with evidence of right-slip movement are common along the coast from
Shelter Cove to Cape Mendocino, and trend parallel to the San Andreas
fault system (N20oW-N400W)j Beutner and Hansen (1975b) interpret these
features as evidence of shear strain that has occurred since
development of the San Andreas transform boundary in the area.
Note 3: The configuration of the triple junction is geometrically
unstable, as the San Andreas transform boundary and the Gorda
subduction zone are noncollinear, and the current configuration of the
triple junction cannot be retained as the San Andreas transform
boundary extends. Although this aspect of the system may be related to
the anomalously high rates of uplift, Dickinson and Snyder (1979b) have
shown that the expected results of this type of instability should be
development of extensional basins at the triple junction, and inboard
jumps of the primary transform faults. However, neither of these
results necessitates vertical deformation of the magnitudes known to

173
have occurred iuunediately south of the triple junction·.

APPENDIX B
SOIL MORPHOLOGICAL DATA
Note 1. Percent by weight of constituent for each horizon was
converted to weight per unit volume by multiplying the percentage by
the bulk density. The weight of that propert~ in the parent material
was then subtracted, and the remainder multiplied by the thickness of
the <2mm fraction (% fines x thickness of horizon) to give the weight
of the property in I ~ area of the horizon.
Note 2. Sites 9w and lOw probably were not sampled deeply enough.
Site lOw has increasing clay contents with depth, thus samples from a
deeper horizon might yield higher maximum clay and iron contents. A
decrease in clay and Fe was also not reached for site 9w, and its
maximum clay and Fed contents are less than those of the younger soil
at site lOw.
174

Depth, em
o 10 o y!.IJ I i
I '. I <n-I I I I I I
~ I I I 40 I I I I I I I I -I 1M ............
• • • • ' .. ....... ", 80 - I
I I
••••• J. I I I
120 . - I ., I I , I , ,. ... .
9m 160 10m
'-200 8m
175
Clay, 0/0
20 30 40 50 I i I i I i I i
i ····1
8m
- -7m
Figure Bl. Changes in Fed content with depth, Mendocino soils. Site 10m (103 ka), Site 9m (120-133 ka), Site 8m (214 ka), Site 7m (320-336 ka) and Site 6m (405 ka?).

176
Fe(d), %
0 1 2 3 4 5 0
• • • • • 40 • • • • ,
• """~ , • I • • • • ~ I 80 ~ ,I
Depth, , 6mr , •
em r·~ , • ,
120 . , , I , , r·· ....
I 9m
160 10m
200 8m 7m
Figure B.2. Changes in clay content with depth, Mendocino soils. Letters refer to soil sites, from youngest to oldest: Site 10m (103 ka), Site 9m (120-133 ka), Site 8m (214 ka), Site 7m (320-336 ka), and Site Sm (405 ka?).

Table 8-1. Complete SUDDDary of laboratory properties of Cape Mendocino-Punta Gorda soils, with Fe activity ratio.
OrgUlI. £rlhlonll.-d""'. a •• '.'. !!It!.0e!!o~''''' F •• oUvlly Il0l1 IU.
o.,th, -~ Cloy pH ••• 1. pH, cacJ2 Carbon. % '!Io f. '!Iolin '!loA! '!Io f. '!Iolin '!loA! '!Io f. '!Iolin 10 AI R.Uot a __
t.t 7.53 0.32 0.08 0.004 0.083 0.33 0.0082 0.17 0.040 0.001 4.13
• 0-22 2.1 8.88 5.73 0.83 0.08 0.013 0.081 0.28 0.015 0.11 0.083 0.008 0.042 3.22 22-48 t.2 7.20 8.38 0.28 0.12 0.012 o.on 0.33 0.013 0.13 0.088 0.007 0.052 2.75 48-85 1.2 7.40 8.58 0.24 0.08 0.028 0.088 0.24 0.025 0.07 0.051 0.010 0.025 3.00 05-80 2.8 7.31 8.58 0.40 0.54 0.410 0.120 0.40 0.370 0.11 0.053 0.017 0.027 0.74 10-87 2.8 7.12 8.47 0.53 2.81 0.033 0.080 1.73 0.028 0.08 0.110 0.007 0.020 0.58 87-115 4.8 7.28 8.10 0.40 0.33 0.032 0.071 0.28 0.004 0.00 0.035 0.002 0.028 0.78 115-125 5.0 7.08 5.88 0.28 0.21 0.002 0.080 0.18 0.003 0.08 0.020 0.001 0.020 0.78
• 0-7.8 7.5 5.42 5.01 4.88 0.84 0.018 0.18 0.34 0.054 0.17 0.180 0.010 0.130 0.53 7.8-22.8 7.4 5.45 4.74 2.84 0.80 0.018 0.23 0.35 0.020 0.18 0.170 0.007 0.180 0.51
22.0-38.1 7.1 5.87 4.85 2.53 0.82 0.013 0.22 0.30 0.017 0.18 0.t80 0.008 0.180 0.58 3&.1-55.8 8.7 5.83 4.87 2.08 0.70 0.013 0.18 0.40 0.017 0.10 0.180 0.005 0.110 0.84 55.0·73.7 8.7 5.82 5.00 1.77 0.88 0.011 0.18 0.37 0.015 0.18 0.220 0.005 0.210 0.58 73.7,84 8.8 8.13 5.07 1.38 0.e3 0.011 0.17 0.35 0.013 0.11 0.170 0.004 0.170 0.58
84-114.3 8.0 5.82 4.80 t.30 0.72 0.014 0.21 0.35 0.015 0.20 0.170 0.004 0.170 0.48 114.3-135 11.1 5.72 4.83 1.43 0.77 0.018 0.24 0.38 0.017 0.25 0.170 0.004 0.180 0.51
~ 0-5 20.0 4.78 4.32 5.88 1.2& 0.021 0.34 0.37 0.018 0.30 0.210 0.014 0.280 0.20 5-12.7 22.1 4.84 4.53 4.83 1.23 0.018 0.33 0.34 0.018 0.30 0.220 0.012 0.280 0.28
12.7-30.5 21.7 4.81 4.31 3.28 1.27 O.Ote 0.35 0.35 0.015 0.34 0.280 0.008 0.330 0.28 30.5-43.2 23.4 5.23 4.47 2.80 1.35 0.018 0.38 0.37 0.017 0.38 0.280 0.007 0.380 0.27 43.2-53.3 21.1 5.00 4.35 2.78 1.43 0.018 0.41 0.37 0.015 0.38 0.320 0.008 0.380 0.28 53.3-73.7 22.4 5.28 4.40 1.88 1.80 0.013 0.40 0.32 0.011 0.38 0.280 0.005 0.340 0.20 73.7-104 22.2 5.31 4.54 0.80 1.22 0.007 0.28 0.23 0.007 0.32 0.150 0.002 0.240 0.18 104-147.3 17.1 5.42 4.57 0.78 1.25 0.008 0.20 0.23 0.007 0.30 0.140 0.002 0.220 0.1&
147.3-172.7 10.7 5.38 4.14 0.33 1.43 0.073 0.27 0.38 0.De4 0.22 0.080 0.005 0.140 0.25
II 0-18 31.5 4.82 4.40 8.33 1.83 0.040 0.03 0.70 0.031 0.88 0.520 0.010 0.750 0.38 10-44 33.1 5.12 4.38 4.83 1.00 0.038 0.00 0.88 0.027 0.&7 0.540 0.014 0.810 0.38 44-81 31.0 5.28 4.57 4.01 1.00 0.031 0.82 0.72 0.023 0.87 0.500 0.010 0.730 0.38 111-87 28.8 5.87 4.58 0.74 1.83 0.007 0.87 0.80 0.002 0.73 0.200 0.000 0.400 0.37 07-132 28.7 5.17 4.42 0.27 1.87 0.020 0.37 0.38 0.021 0.42 0.058 0.001 0.220 0.23 132-182 18.4 5.10 4.51 0.11 1.50 0.105 0.28 0.55 0.072 0.32 0.025 0.002 0.140 0.37 182-270 10.8 5.22 4.57 0.08 1.33 0.048 0.18 0.47 0.033 0.24 0.012 0.001 0.070 0.35 270-320 0.27 0.12 0.002 0.22 0.041 0.000 0.120
0-15 31.2 5.31 4.50 8.03 2.00 0.048 0.77 0.14 0.038 0.72 0.480 0.024 0.140 0.32 15-33 32.7 5.20 4.50 5.34 2.01 0.050 0.78 0.84 0.041 0.77 0.520 0.022 0.880 0.32 33-83 25.8 5.35 4.48 4.44 2.00 0.047 0.83 0.88 0.037 0.80 0.510 0.010 0.730 0.35 83-00 32.8 5.43 4.87 3.27 I.D3 0.041 0.78 0.85 0.030 0.74 0.510 0.013 0.540 0.34 DO-128 28.4 5.57 4.50 1.82 1.80 0.028 0.72 0.84 0.010 0.71 0.500 0.008 0.540 0.34 128-173 40.1 5.0D 4.50 0.15 2.t3 0.012 0.30 0.10 0.010 0.25 0.030 0.002 0.110 0.05 173-200 22.7 5.33 4.85 0.04 1.38 0.013 0.23 O.OD 0.011 0.14 O.OOD 0.001 0.054 0.07 200-231 22.5 5.78 5.02 0.04 4.81 0.340 0.40 0.58 0.280 0.18 0.032 0.001 0.050 0.12 231-248 25.4 5.82 5.07 0.02 4.18 0.080 0.37 0.45 0.088 0.15 0.024 0.002 0.040 0.11 248·257 18.1 5.84 5.18 0.01 0.30 0.005 0.10 0.08 0.003 0.00 0.004 0.001 0.028 0.15 257-282 10.3 8.20 5.43 0.01 0.40 O.ODe 0.11 0.004 0.11 0.011 0.001 0.045 0.28
tFe &<1IvI11 ratio I. fI.oulllelFl-dithIonIlKIIr.lI. ..... -...J -...J

APPENDIX C
STREAM-GRADIENT ANALYSIS: SEMI-LOGARITHMIC STREAM PROFILES
Ten third order coastal streams were analyzed with the stream-
gradient (SL) index (Hack, 1973). These were grouped into three
categories of uplift--low, intermediate, or high--based on their
semi logarithmic profile forms and SL values, and the initial
assumptions that the uplift rates of three streams are known, from
knowledge of assigned and dated marine terrace ages. These streams are
Singley Creek, intermediate uplift rate, DeHaven Creek, low uplift
rate, and Big Flat Creek, high uplift rate. The profile forms and SL
values of these three streams were then used as references for
comparison with other streams.
178
------------------------------ ------------------ .-

500
400
E 300
I 200
100
600
500
400
300
200
100
800
600
400
200
179
SINGLEY CREEK BIG CREEK 500
400
300
200
100 IUD 281
0 3.0 3.2 3.4 3.6 3.8 4.0 2.8 3.0 3.2 3.4 3.8 3.8 4.0
Log DI._,m Log Dletance, m
FOURMILE CREEK BIG FLAT CREEK 800
600
400
200
0 3.2 3.4 3.8 3.8 4.0 2.8 3.0 3.2 3.4 3.8 3.8 4.0
LogDl._.m Log Dletance. m
GITCHELL CREEK DAVIS CREEK 800
274 207
600
400
200
1225
3.0 3.2 3.4 3.8 3.8 3.0 3.2 3.4 3.8 3.8 4.0 LogDl~.m
Log DI._.m
Figure C-l. coastal Numbers reach.
semilogarithmic stream profiles of ten third-order streams. Vertical scales are altitudes, in m. beside stream reaches are average SL values for that

180
JACKASS CREEK DEHAVEN CREEK 300 400
300
E 200
r! oR 200 10 > m 100
100
68
0 0 2.8 3.0 3.2 3.4 3.8 3.8 2.8 3.0 3.2 3.4 3.8 3.8 4.0
Log Dratance, m Log Dr'lance, m
WAGES CREEK . TELEGRAPH CREEK 400
484 400
300 300
200 200
100 100
0 2.8 3.0 3.2 3.4 3.8 3.8 4.0 4.2 3.0 3.2 3.4 3.0 3.8
Log Dlatancl, m Log Dr.lance, m
Figure C-l. (Continued. )
----------------------------_ ... _ ..•. __ .- ..

REFERENCES CITED
Abrahams, Athol, D. 1984, Channel networks: a geomorphological perspective: Water Resources Research, v. 20, no. 2, p. 161-188.
Adams, John, 1984, Active deformation of the Pacific northwest continental margin: Tectonics, v. 3, p. 449-472.
Arduino, E., Barberis, E., Carraro, F., and forno, M.G., 1984, Estimating relative ages from iron-oxide/total-iron ratios of soils in the western Po Valley, Italy: Geoderma, v. 33, p. 39-52.
Arduino, E., Barberis, E., Mars an , F. Ajmone, Zanini, E., and Franchini, M., 1986, Iron oxides and clay minerals within profiles as indicators of soil age in northern Italy: Geoderma, v. 37, p. 45-55.
Atwater, T., 1970, Implications of plate tectonics for the Cenozoic tectonics of· western North America: Geological Society of America Bulletin, v. 80, p. 3513-3536.
Azevedo, J., and Morgan, D.L., 1974, Fog precipitation in coastal California forests: Ecology, v. 55, n. 5, p. 1135-1141.
Bachman, S. B., 1978, A Cretaceous and early Tertiary subduction complex, Mendocino coast, northern California, in, J.K. Leggett (ed.), Trench-forearc geology: Sedimentation and tectonics on modern and ancient active plate margins: Geological Society of London Special Publications, v. 10, p. 401-418.
Bailey, E.H., and W.P. Irwin, 1959, K-feldspar content of Jurassic and Cretaceous graywackes of northern Coast Ranges and Sacramento Valley, California: American Association of Petroleum Geologists Bulletin, v. 43, no. 12, p. 2797-2809.
Beutner, E.C., and Hansen, E.C., 1975a, Folds in coastal Franciscan rocks, Cape Mendocino area, California: Geological Society of America Abstracts with Programs, v. 7, no. 3, p. 298-299.
Beutner, E.C., and Hansen, 1975b, Structural evidence of plate interactions from continental rocks, Cape Mendocino to Shelter Cove, California: Geological Society of America Abstracts with Programs, v. 7, p. 997.
181
-------------------------------------------------

Beutner, E.C., McLaughlin, R.J., Ohlin, H.N., and Sorg, D.H., 1980, Geologic map of the King Range and Chemise Mountain Instant Study Areas, northern California: U.S. Geological Survey Miscellaneous Field Studies Map MF-1196-A, scale 1:62,500, 1 sheet and explanation.
Birkeland, P. W., 1984, Soils and Geomorphology: Oxford University Press, New York, 372 p.
182
Blake, M.C., Jr., Jayko, A.S., and McLaughlin, R.J., 1985, Tectonostratigraphic terranes of the northern Coast Ranges, California, in Howell, D.G., ed., Tectonostratigraphic terranes of the Circumpacific region: Earth Science Series, v. 1, Circumpacific Council for Energy and Mineral Resources, p. 159-171.
Bloom, A.L., 1980, Late Quaternary sea level change on South Pacific coasts; a study in tectonic diversity; in Morner, N.A., ed., Earth rheology, isostasy and eustasy: Wiley Chichester, p. 505-516.
Bloom, A.L., Broecker, W.S., Chappell, J., Matthews, R.K., and Mesolella, K.J., 1974, Quaternary sea-level fluctuations on a tectonic coast: New 230Th/234 U dates from the Huon Peninsula, New Guinea: Quaternary Research, v. 4, p. 185-205.
Bockheim, J.G., 1980, Solution and use of chronofunctions in studying soil development: Geoderma, v. 24, p. 71-86.
Broecker, W.S., and Thurber, D.L., 1965, Uranium-series dating of corals and oolites from Bahamian and Florida Key limestones: Science, v. 149, p. 58-60.
Bull, W.B., 1985, Correlation of flights of global marine terraces, in Morisawa, M., and Hack, J.T., eds., Proceedings of the 15th Annual Geomorphology Symposium, State University of New York at Binghamton: Allen and Unwin, p. 129-152.
Bull, W.B., and Cooper, A.F., 1986, Uplifted marine terraces along the Alpine Fault, New Zealand: Science, v. 234, p. 1225-1228.
Burke, R.M., Carver, G.A., and Lundstrom, S., 1986, Soil development as a relative dating and correlation tool on marine terraces of northern California: Geological Society of America abstracts with programs, v. 18, no. 2, p. 91.
Carver, G.A., Burke, R.M., and Kelsey, H.M., 1986, Deformation of late Pleistocene marine terraces along the California coast north of Cape Mendocino: Geological Society of America Abstracts with Programs, v. 15, n. 5, p. 316.
Carver, G.A., Burke, R.M.~ and Kelsey, H.M., 1985, Quaternary deformation studies in the region of the Mendocino Triple Junction: U.S.Geological Survey Open-File Report 86-31, p. 58-62.

Chappell, J.M., 19B3, A revised sea-level record for the last 300,000 years from Papua New Guinea: Search, v. 14, p. 99-101.
Chappell, J.M., 1974, Geology of coral terraces, Huon Peninsula, New Guinea: A study of Quaternary tectonic movements and sea-level changes: Geological Society of America Bulletin, v. 85, p. 553-570.
Chappell, J.M., and Shackleton, N.J., 19B6, Oxygen isotopes and sea level: Nature, v. 324, p. 137-140.
Chappell, J.M., and Veeh, H.H., 197B, Late Quaternary tectonic movements and sea-level changes at Timor and Atauro Island: Geological Society of America Bulletin, v. B9, p. 356-36B.
IB3
Childs, C.W., Parfitt, R.L., and Lee, R., 19B3, Movement of aluminum as an inorganic complex in some podzolized soils, New Zealand: Geoderma, v. 29, p. 139-155.
Curray, J.R., and Nason, R.D., 1967, San Andreas fault north of Point Arena, California: Geological Society of America Bulletin, v. 7B, p. 413-4lB.
Dickinson, W.R., and Snyder, W.S., 1979a, Geometry of subducted slabs related to San Andreas transform: Journal of Geophysical Research, v. B7, p. 609-627.
Dickinson, W.R., and Snyder, W.S., 1979b, Geometry of triple junctions related to San Andreas transform: Journal of Geophysical Research, v. B4, n. B2, p. 561-572.
Dickson, B.A., and Crocker, R.L., 1953, A chronosequence of soils and vegetation near Mt. Shasta, California. II. The development of the forest floors and the carbon and nitrogen profiles of the soils: Jour. Soil Sci., v. 4, R. P. 142-154.
Dodge, R.E., Fairbanks, R.G., Benninger, L.K., and Maurrase, F., 19B3, Pleistocene sea levels from raised coral reefs of Haiti: Science, 219, p. 1423-1425.
Ellen, Steven, 19B6, Unpubl. geomorphic map of coastal northern California: 1:100,000.
Furlong, Kevin P., 19B4, Lithospheric behavior with triple junction migration: an example based on the Mendocino triple junction: Physics of the Earth and Planetary Interiors, v. 36, p. 213-223.
Gardner, R.A., 1967, Sequence of podzolic soils along the coast of northern California: Ph.D. thesis, University of California, Berkeley, 236 p.

Gardner, R.A., 1958, Soil-vegetation associations in the redwoodDouglas-fir zone of California, in First North American Forest Soils Conference: Ag. Exp. Sta., Michigan State Univ., East Lansing, p. 86-101.
184
Gardner, R.A., and Bradshaw, K.E., 1954, Characteristics and vegetation relationships of some podzolic soils near the coast of northern California: Soil Science Society of America Proceedings, v. 18, p. 320-325.
Gilbert, G.K., 1877, Geology of the Henry Mountains (Utah); U.S. Geographical and Geological Survey of the Rocky Mountain region: Washington, D.C., U.S. Government Printing Office.
Glazner, Allen, F., and Schubert, Gerald, 1985, Flexure of the North American lithosphere above the subducted Mendocino fracture zone and the formation of east-west faults in the Transverse Ranges: Journal of Geophysical Research, v. 90, n. B7, p. 5405-5409.
Griscom, Andrew, 1980, Aeromagnetic interpretation of the Mendocino triple junction, in Studies of the San Andreas fault zone in northern California: California Division of Mines and Geology Special Report 140, p. 121-127.
Hack, J.T., 1957, Studies of longitiudinal stream profiles in Virginia and Maryland: U.S. Geological Survey Professional Paper 294-B, p. 45-97.
Hack, J.T., 1960, Interpretation of erosional topography in humid temperate regions: American Journal of Science (Bradley volume), v. 258-A, p. 80-97.
Hack, J.T., 1973, Stream-profile analysis and stream-gradient index: U.S. Geological Survey Journal of Research, v. 1, p. 421-429.
Hagemann, M.F., 1982, Origin and uplift of a pair of late Quaternary marine platforms near Cape Mendocino, California: Geological Society of America Abstracts with Programs, v. 17, n. 6, p. 359.
Harden, J.W., 1982, A quantitative index of soil development from field descriptions: examples from a chronosequence in central California: Geoderma, v. 28, p. 1-28.
Harden, J.W., and Taylor, E.M., 1983, A quantitative comparison of soil development in four climatic regions: Quaternary Research, v. 20, p. ·342-359.
Horton, R.E., 1945, Erosional development of streams and their drainage basins: Hydrophysical approach to quantitative morphology: Geological Society of America Bulletin, v. 56, p. 275-370.

Jackson, M.L., 1956, Soil chemical analysis, advanced course: Privately published, Madison, Wisconsin, 991 p.
Janda, R.F., 1970, Informal field guide to Pleistocene sediments and landforms and soil development in the Cape Arago-Cape Blanco area of Coos and Curry Counties, southern coastal Oregon: Friends of the Pleistocene, October 9-11, 1970, unpublished.
Jenny, H., 1941, Factors of Soil Formation: Mc-Graw-Hill, New York, 281 p.
Jenny, H., Arkley, R.J., and Schultz, A.M., 1969, The pygmy forestpodzol ecosystem and its dune associates of the Mendocino coast: Madrano, v. 20, p. 60-74.
Jenny, H., 1980, The Soil Resource: Origin and Behavior, SpringerVerlag, New York, 377 p.
Johnson, Donald Lee, 1977, The late Quaternary climate of coastal California: evidence for an ice age refugium: Quaternary Research, v. 8, p. 154-179.
Keller, E.A., 1977, Adjustment of drainage to bedrock in regions of contrasting tectonic framework: Geological Society of America Abstracts with Programs, v. 9, no. 7, p. 1046.
185
Kelsey, H.M., and Carver, G.A., manuscript in preparation, Late Neogene and Quaternary tectonics associated with the northward growth of the San Andreas transform fault, northern California.
Kelsey, H.M., and Cashman, S.M., 1984, Fault relationships and tectonic evolution in the northernmost part of the San Andreas transform system, northwestern California; International Symposium on Recent Crustal Movements in the Pacific Region, Royal Society of New Zealand, Wellington, New Zealand, abstracts, p. 26.
Kennedy, G.L., Lajoie, K.R., and Wehmiller, J.F., 1982, Aminostratigraphy and faunal correlations of late Quaternary marine terraces, Pacific Coast, U.S.A.: Nature, v. 299, p. 545-547.
Kilbourne, Richard T., 1986, Geology and slope stability of the Fort Bragg Area, Mendocino County, California: California Geology, v. 39, p. 56-68.
Kneupfer, P.L.K., 1984, Tectonic geomorphology and present-day tectonics of the Alpine Shear System, South Island, New Zealand: Ph.D. thesis, 489 p.
Ku, T.-L., and Kern, J.P., 1974, Uranium-series age of the upper Pleistocene Nestor Terrace, San Diego, California: Geological Society of America Bulletin, v. 85, p. 1713-1716.
-----------------------_._--_._--

186
Ku, T.-L, Kimmel, M.A., Easton, W.H., and O'Neil, T.J., 1974, Eustatic sea level 120,000 years ago on Oahu, Hawaii: Science, v. 183, p. 959-962.
Lajoie, K.R., 1986) Coastal Tectonics, in, Wallace, R., panel chairman, Active Tectonics: Studies in Geophysics Series, Geophysics Research Forum, National Academy Press, p. 95-124.
Lajoie, K.R., Kern, J.P., Wehmiller, J.F., Kennedy, G.L., Mathieson, S.A., Sarna-Wojcicki, Yerkes, R.F., and McCrory, P.F., 1979a, Quaternary marine shorelines and crustal deformation, San Diego to Santa Barbara, California, in Abbott, P.L., ed., Geological Excursions Southern California Area: San Diego State University, p. 3-15.
Lajoie, K.R., Weber, G.E., Mathieson, S.A., and Wallace, J., 1979b, Quaternary tectonics of coastal Santa Cruz and San Mateo Counties, California, as indicated by deformed marine terracaes and alluvial deposits, in Weber, G.E., Lajoie, K.R., and Griggs, G.B., eds., Coastal tectonics and coastal geologic hazards in Santa Cruz and San Mateo Counties, California: Geological Society of America Guidebook.
Lajoie, K.R., and Sarna-Wojcicki, A.M., 1982, Late Quaternary coastal tectonics in the central and western Transverse Ranges, southern California: Geological Society of America Abstracts with Programs, v. 14, n. 4, p. 179.
Lajoie, K.R., Sarna-Wojcicki, A.M., and Ota, Y., 1982, Emergent Holocene marine terraces at Ventura and Cape Mendocino, California-indicators of high tectonic uplift rates: Geological Society of America Abstracts with Programs, v. 14, n. 4, p. 178.
Leopold, L.B., Wolman, M.G., and Miller, J.P., 1964, Fluvial processes in geomorphology: San Francisco, W.H. Freeman.
Machida, Hiroshi, 1975, Pleistocene analyzed by tephrachoronology: M.M., eds., Quaternary Studies: Bulletin, v. 13, p. 215-222.
sea level of South Kanto, Japan, in Suggate, R.P., and Cresswell, Royal Society of New Zealalnd
Major, J., 1977, The Redwood forest and associated north coast forests, in Barbour, M.G., and Major, J., (eds.), Terrestrial Vegetation of California: John Wiley, New York, p. 679-698.
McFadden, L.D., 1982, The impacts of temporal and spatial climatic changes on alluvial soils genesis in Southern California: Ph.D. thesis, University of Arizona, 430 p.
-------------------------------- --

McFadden, Leslie D., and Hendricks, David M., 1985, Changes in the content and composition of pedogenic iron oxyhydroxides in a chronosequence of soils in southern California:· Quaternary Research, v. 23, p. 189-204.
187
McKeague, J.A., 1967, An evaluation of O.lM pyrophosphate and phrophosphate-dithionite in comparison with oxalate as extract ants of the accumulation products in Podzols and some other soils: Canadian Journal of Soil Science, v. 47, p. 95-99.
McKeague, J .A., (ed.), 1978, Manual of Soil Sampling and Methods of Analysis: Canadian Society of Soil Science, 2n~ ed., 212 p.
McKeague, J.A., Brydon, J.E., and Miles, N.M., 1971, Differentiation of forms of extractable iron and aluminum in soils: Soil Science Society of America Proceedings, v. 35, p. 33-38.
McLaughlin, R.J., Kling, S.A., Poore, R.Z., McDougall, Kristin, and Beutner, E.C., 1982, Post-middle Miocene accretion of Frnaciscan Rocks, northwestern California: Geological Society of America Bulletin, v. 93, p. 595-605.
McLaughlin, R.J., Lajoie, K.R., Sorg, D.H., Morrison, S.D., and Wolfe, J.A., 1983a, Tectonic uplift of a middle Wisconsin marine platform near the Mendocino triple junction, California: Geology, v. II, p. 35-39. .
McLaughlin, R.J., Lajoie, K.R., Sorg, D.H., Morrison, S.D., and Wolfe, J.A., 1983b, Reply to Conunent by Morner, N.-A., on "Tectonic uplift of a middle Wisconsin marine platform near the Mendocino triple junction, California": Geology, v. 11, no. 10, p. 621-622.
McLaughlin, R.J., Sorg, D.H., Morton, J.L., Batchelder, J.N., LeVeque, R.A., Heropoulos, C., Ohlin, H.N., and Norman, M.B., II, 1979, Timing of sulfide mineralization and elimination of the San Andreas fault at Point Delgada, California: EOS (American Geophysical Union Transactions), v. '60, p. 883.
Merritts, Dorothy J., Bull, W.B., Chadwick, Oliver, and Hendricks, David M., 1986, Influence of Mendocino triple-junction migration on late Quaternary uplift rates in northern California: . Geological Society of America Abstracts with Programs, v. 18, p. 693.
Merritts, Dorothy J., and Bull, W.B., in prep., Variations of Quaternary uplift rates with passage of the Mendocino triple junction, northern California.
Merritts, Dorothy J., Chadwick, Oliver, and Hendricks, David M., in prep., Soils chronosequence on uplifted marine terraces, northern California.

188
Merritts, Dorothy J., and Vincent, Kirk, in prep., Fluvial response to low to high rates of uplift, Mendocino triple junction region, northern California.
Mesolella, K.J., Mathews, R.K., Broecker, W.S., and Thurber, D.L., 1969, The astronomical theory of climatic change: Barbados data: Journal of Geology, v. 77, p. 250-274.
Metson, A.J., Blakemore, L.C., and Rhoades, D.A., 1979, Methods for the determination of soil organic carbon: a review, and application to New Zealand soils: New Zealand Journal of Science, v. 22, p. 205-228.
Moon, B.P., 1984, Refinement of a technique for determining rock mass strength for geomorphological purp~ses: Earth Surface Processes, v. 9, p. 189-193.
Morner, N.-A, 1983, Comment on "Tectonic uplift of a middle Wisconsin marine platform near the Mendocino triple junction, California": Geology, v. 11, p. 621.
Muhs, Daniel R., 1985, Amino-acid age estimates of marine terraces and sea levels on San Nicolas Island, California: Geology, v. 13, p. 58-61.
Muhs, Daniel R., 1983, Quaternary sea-level events on northern San Clemente Island, California: Quaternary Research, v. 20, p. 322-341.
National Oeanic and Atmospheric Administration (1985), Local climatological data, annual summaries: Environmental Data Service, National Climatic Center, Dept. Commerce, Washington, D.C.
Ota, Yoko, 1986, Marine terraces as reference surfaces in late Quaternary tectonics studies: examples from the Pacific Rim: Royal Society of New Zealand Bulletin, v. 24, p. 357-375.
Penck, Walther, 1953, Morphological analysis of land forms, trans. by Czech, Hella, and Boswell, Katharine Cumming: MacMillan and Co., Ltd., Great Britain, 429 p.
PuIs, Robert W., 1985, Soils of the King Range National Conservation Area (western slope), Humboldt County, California: prepared for the Bureau of Land Management, Contract No. Ya551-Ct3-340079, 119 p.
Schwertmann, V., 1973, Use of oxalate for Fe extraction from soils: Canadian Journal of Soil Science, v. 53, p. 244-246.

189
Selby, M.J., 1980, A rock mass strength classification for geomorphic purposes: with tests from Antarctica and New Zealand: Zeitschrift fur Geomorphologie, v. 24, no. 1, p. 31-51.
Shackleton, N.J., and Opdyke, N.D., 1973, Oxygen isotope and palaeomagnetic stratigraphy of equatorial Pacific core V28-238: Oxygen isotope temperatures and ice volumes on a 105 year and 106
year scale: Quaternary Research, v. 3, p. 39-55.
Shreve, R.L., 1967, Infinite topologically random channel networks: Journal of Geology, v. 75, p. 178-186.
Silver, E.A., 1971, Transitional tectonics and late Cenozoic structure of the continental margin off northernmost California: Geological Society of America Bulletin, v. 82, p. 1-22.
Smart, J.S., 1978, The analysis of drainage network composition: Earth Surface Processes, v. 3, p. 129-170.
Smith, Stewart W., and Knapp, John S., 1980, The northern termination of the San Andreas fault, in Studies of the San Andreas fault zone in northern California: California Division of Mines and Geology Special Report 140, p. 153-164.
Soil Conservation Service, USDA, 1984, Soil Survey laboraatory methods and procedures for collecting soil samples: Soil Survey Investigations Report No.1 (Revised): U.S. Government Printing Office, Washington, D.C.
Soil Survey Staff, 1975, Soil Taxonomy: Soil Conservation Service, U.S. Department of Agriculture Handbook no. 436, 754 p.
Stearns, C.E., 1984, Uranium-series dating and the history of sea level, in Mahaney, W.C., ed., Quaternary Dating Methods: Elsevier, New York, p. 53-66.
Stearns, C.E., 1976, Estimates of the position of sea level between 140,000 and 75,000 years ago: Quaternary Research, v. 5, p. 445-429.
Steinen, R.P., Harrison, R.S., and Matthews, R.K., 1973, stand of sea level between 125,000 and 105,000 B.P.: the subsurface of Barbados, West Indies: Geological America Bulletin, v. 84, p. 63-70.
Strahler, A.N., 1952, Dynammic basis of geomorphology: Society of America Bulletin, v. 63, p. 923-938.
Eustatic low evidence from
Society of
Geological
Strahler, A.N., 1957, Quantitative analysis of watershed geomorphology: American Geophysical Union Transactions: v. 38, p. 913-920.
--1-----

190
Strahler, A.N., 1958, Dimensional analysis applied to fluvially eroded landforms: Geological Society of America Bulletin, v. 69, p. 279-299.
Strahler, A.N., 1964, Quantitative geomorphology of drainage basins and channel networks, in Chow, V.T., ed., Handbook of applied hydrology: McGraw-Hill, New York, p. 4-39-4-76.
Syers, J.K., Adams, J.A., and Walker, T.W., 1970, Accumulation of organic matter in a chronosequence of soils developed on wind-blown sand in New Zealand: Jour. Soil Sci., v. 21, p. 146-153.
Veeh, H.H., 1966, 230Th/238 U and 234U/238U ages of Pleistocene high sea-level stand: Journal of Geopohysical Research, v. 71, p. 3379-3386.
Veeh, H.H., and Chappell, J., 1970, Astronomical theory of climate change: Support from New Guinea: Science, v. 167, p. 862-865.
Wilson, Douglas S., 1986, A kinematic model for the Gorda deformation zone as a diffuse southern boundary of the Juan de Fuca plate: Journal of Geophysical Research, v. 91, n. BlO, p. 10,259-10,270.
Yonekura, N., 1983, Late Quaternary vertical crustal movements in and around the Pacific as deduced from former shoreline data, in Hilde, T.W.C., and Uyeda, S., eds., Geodynamics of the western PacificIndonesian Region: American Geophysical Union Special Paper, p. 41-50.