information to users -...
TRANSCRIPT

INFORMATION TO USERS
This manuscript has been reproduced tram the microfilm m8lt8r. UMI films
the text directly from the original or copy lubmitted. Thul. sorne "sil .nd
dissertation copies are in typewrfter tEe. while oIherI may be tram any type of
computer printer.
The qU111ty of thl. Npracluction 1. dependent upon the qU811ty of the
copy aubmltted. Broken or indistinct print. coknd or poor qUillity illustrations
and photographl. prfnt bleedthrough. subStlndlrd margi1s, and improper
alignment ca" adversely 8ffect naproduction.
ln the unlikely event ht the 8Uthor did not send UUI • complete m8nuscript
and the,. are milling pegel. the.. will be noted. AllO, if unauthorized
copyright material had to be removed. a note will indicate the deletion.
Oversize materi81s (e.CI., mapl. dl'llWingl. eh8rt1) are reproduced by
sectioning the origi".l. begiming 8t the upper 1Ift·tw1d corner 8I1d continuing
from left to right in 8qUIII sections with small ov.rlapa.
Photographl induded in the origiNlI manuscript h8v. been reprodUCld
xerographically in thil copy. Higher ~Iity 8- x 9- black Ind white
photographie printl .re IY8ilabie for InY photogl'lPhl or illultnltionl~ring
in thi. copy for an Idditional charge. Con.et UMI dirKtly ta arder.
Bell & HoweIllnfoImation 8nd Luming300 North ZHb ROId. Ann ArborI MI 48108-1348 USA
800-521-œoo


NOTE TO USERS
Page(s) not ineluded in the original manuscriptare unavailable from the author or university. The
manuseript was mierofilmed as reeeived.
••• •III-IV
This reproduction is the best copy available.
UMI


•
•
•
MPEG-2 Transport over ATM Networks with BestEffort Service
Song PuSchool of Computer Science
McGill University
Montréal, Québec, Canada
A Thesis submitted to theFaculty of Graduate Studies and Research
in partial fulfillment of the requirements for the degree of
Master of Science
@ Song Pu, 1998

1+1 National Ubraryof Canada
Acquisitions andBibliographie Services315 weIingIon StfMt0IIawa ON K1A 0N4c.n.dI
BibliothèQue nationaledu Canada
Acquisitions etservices bibliographiques
385. rue wellingtonOttawa ON K1 A0N4c.n.da
The author bas granted a nonexclusive licence allowing theNational Library ofCanada toreproduce, loan, distnbute or sencopies ofthis thesis in microform,paper or electronic formats.
The author relains ownership ofthecopyright in this thesis. Neither thetbesis nor substantial exttacts from itmay he printed or otberwisereproduced without the author' spenmsslon.
L'auteur a accordé une licence Donexclusive permettant à laBibliothèque nationale du Canada dereproduire, prêter, distnbuer ouvendre des copies de cette thèse sousla forme de microfiche/film, dereproduction sur papier ou sur fonnatélectronique.
L'auteur conserve la propriété dudroit d'auteur qui protège cette thèse.Ni la thèse ni des extraits substantielsde celle-ci ne doivent être imprimésou autrement reproduits sans sonautorisation.
0-612...50861 ...7

•
•
•
-
To my lovely wile
and my parents

NOTE TO USERS
Page(s) not included in the original manuscriptare unavailable trom the author or university. The
manuscript was microfilmed as received.
••• •III-IV
This reproduction is the best copy available.
UMI
•
•
•
CONTENTS
RÉSUMÉ
ABSTRACT
ACKNOWLEDGMENTS
1 ÜUTLINE AND MOTIVATION
2 MPEG-2 STANDARD: A REVIEW2.1 History...................................2.2 Color Representation . . . . . . . . . . . . . . . . . . . . . . . . . . .2.3 Digital Video Format . . . . . . . . . . . . . . . . . . . . . . . . . . .
2.3.1 CCIR-601 Recommendation .2.3.2 Source Input Format (SIF) and Common Interchange Format
(CIF) .2.4 MPEG Carling . . . . . . . . . . . . . . . . . . .
2.4.1 Carling Principles . . . . . . . . . . . . . . . . . . . . . . . . .2.4.2 Discrete Cosine Transform Cading .2.4.3 Quantization .2.4.4 Entropy Coding . . . . . . . . . . . . . . . . . . . . . . . . . .2.4.5 Motion-Compensated Inter-Frame Prediction .2.4.6 Picture Types in MPEG . . . . . . . . . . . . . . . . . . . . .
2.5 MPEG-2 Video Standard . . . . . . . . . . . . . . . . . . . . . . . . .2.5.1 Differences between MPEG-2 and MPEG-1 .2.5.2 Scalability and Data Partition .2.5.3 MPEG-2 Systems Layer .
3 SERVICE CLASSIFICATION AND ADAPTATION LAYER OF ATM3.1 Classification of Services in ATM Networks .
3.1.1 How These Services Wark Together . . . . . . . . . . . . . . .3.2 ATM Adaptation Layer (AAL) .
3.2.1 Common Part Convergence Sublayer (CPCS) of AAL-5 . . . .3.2.2 Segmentation and Re-Assembly Sublayer .3.2.3 Error Detection . . . . . . . . . . . . . . . . . . . . . . . . . .
4 ISSUES IN MPEG-2 OVER ATM4.1 Service Class Selection . . . . . . . . . . . . . . . . . . . . . . . . . .4.2 Choice of Adaptation Layer . . . . . . . . . . . . . . . . . . . . . . .4.3 Transport Stream Encapsulation. . - . . _ . . . _ . . . . . . . . . . .4.4 Factors Meeting Picture Quality .
4.4.1 Data Losses Due to CeU Errors .4.4.2 Data Lasses Due to Burstiness and Excessive Delays .
v
ix
xi
xiii
1
678
1010
10Il12131415151617181920
2425 .2727303131
32333435363637

4.5 Congestion Control and Switch Discarding Scheme 374.5.1 Priority Assignation Scheme " 38
4.6 Error Correction and Concealment 384.6.1 Forward Error Correction (FEC) in AAL Layer . . . . . . .. 39
4.7 Related Work . . . . . . . . . . . . . . . . . . . . . . . . . . . . . .. 394.7.1 FEC-Service Specifie Convergence Sublayers . . . . . . . . .. 404.7.2 Switch Discarding Schemes. . . . . . . . . . . . . . . . . . .. 404.7.3 Priority Assignation Scheme . . . . . . . . . . . . . . . . . .. 41
5 VIDEO QUALITY OF SERVICE CONTROL FRAMEWORK 435.1 Dynamic Extended Priority Assignation Scheme (Dex-PAS) ..... 445.2 Slice-Based MPEG-2 TS Packets Encapsulation Strategy . . . . . .. 465.3 AAL-5 Service Specifie Convergence Sublayer with FEe Support. .. 47
5.3.1 Requirement of SSCS with FEe support . . . . . . . . . . .. 475.3.2 Behavior of Sender and Receiver Entities . . . . . . . . . . .. 48
5.4 Selective and Adaptive Partial Slice Discard Scheme (SA-PSD) . . .. 535.4.1 The Algorithm Introduction " 535.4.2 SA-PSO Parameters 545.4.3 SA-PSD Operation Modes . . . . . . . . . . . . . . . . . . .. 55
6 EXPERIMENT AND RESULT 586.1 Simulation Environment . . . . . . . . . . . . . . . . . . . . . . . .. 59
6.1.1 The NIST ATM SiUlulator . . . . . . . . . . . . . . . . . . .. 596.1.2 Network Madel . . . . . . . . . . . . . . . . . . . . . . . . .. 60
6.2 MPEG-2 Trace File . . . . . . . . . . . . . . . . . . . . . . . . . . .. 616.3 Several Assumptions . . . . . . . . . . . . . . . . . . . . . . . . . .. 626.4 Parameters 64
7 DISCUSSION 667.1 Results at Cell-level. . . . . . . . . . . . . . . . . . . . . . . . . . .. 677.2 Results at Slice-Level . . . . . . . . . . . . . . . . . . . . . . . . . .. 717.3 Distance Effect .... . . . . . . . . . . . . . . . . . . . . . . . . .. 727.4 Redundancy Vs Data Ratio . . . . . . . . . . . .. 74
8 CONCLUSION 788.1 Conclusions . . . . . . . . . . . . . . . . . . . . . . . . . . . . . . .. 798.2 Future Work. . . . . . . . . . . . . . . . . . . . . . . . . . . . . . .. 81
•
•
•
vi
REFERENCES
CONTENTS
82
• FIGURES AND TABLES
FIGURES
2.12.22.32.42.52.62.7
3.13.23.33.4
4.1
• 5.15.25.35.4
6.16.26.3
Basic abjects defined in MPEG-2 . . . . . . . . . . . . . . . . . . .. 13OCT coefficients in a coding block is scanned in zig-zag order .... 15Motion compensation and motion estimation . . . . . . . . . . . . .. 16MPEG encoder . . . . . . . . . . . .. . . . . . . . . . . . . . . . . .. 17Example of MPEG video sequence 18Scope of MPEG-2 systems specifications . . . . .. . . . . . . .. 20PES encapsulation using fixed length packet . . . . . . . . . . . . .. 22
Service bandwidth allocation. . . . . . . . . . . . . . . .. . . . . . .. 27Traffic classes and AAL types . . . . . . . . . . . . . . . . . . . . .. 29Structure of the convergence sublayer .. . . . . . . . . . . . . . . . .. 29AAL-5 CPCS-PDU Header. . . . . . . . . . . . . . . . . . . . . . .. 30
Mapping of MPEG-2 transport packets . . . . . . . . . . . . . . . .. 36
Slice-based PES encapsulation using variable length packet . . . . .. 46AAL-5 multi-Ievel FEC-SSCS using grouping mode 1 . .. 49Control block structure used in FEe scheme . . . . . . . . . . . . .. 51Buifer thresholds . . . . . . . . . . . . . . . . . . . . . . . . . . . .. 55
Network topology used in the simulation . . . . . . . . . . . . . . .. 60Number of ATM cells per slice . . . . . . . _ . . . . . . . . . . . . .. 62Number of ceUs per slice after multiplexing of all sources with time shift 63
•
7.1 Cell loss ratio (Aggregate) . . . . . . . . . . . . . . . . . . . . . . . .7.2 Cellioss ratio (I-frame) . . . . . . . . . . . . . . . . . . . . . . . . ..7.3 Cellioss ratio (P-frame) . .7.4 Cell 1058 ratio (B-Crame) .. . . . . . . . . . . . . . . . . . . . . . . .7.5 Mean cell traosfer delay .7.6 Buffer occupancy in No-RD . . . . . . . . . . . . . . . . .7.7 Buffer occupancy in Ex-SeO .7.8 Buffer occupancy in Ex-PSO .7.9 Buffer occupancy in Oex-SA-PSD . . . . . .. . . . . . . . . . . . . . .7..10 Slice loss ratio (Aggregate) . . . . . . . . . .. . .. . . .. .. .7..11 Slice loss ratio (I-frame) .7.12 Slice 1088 ratio (P-frame) . . . . . . . . . . . . . .. . . . . . . . . . . .7.13 Slice lOBS ratio (B-frame) .7..14 CLR(Aggregate) with different distance .7.15 CLR(I-frame) with different distance .7.16 CLR(P-frame) with different distance .
vii
676767 .67697070707071717272727273

•viii FIGURES AND TABLES
7.17 CLR(B-frame) with difl'erent distance. . . . . . . . . . . . . . . . .. 737.18 SLR(Aggregate) with different Distance. . . . . . . . . . . . . . . .. 747.19 SLR(I-frame) with different Distance . . . . . . . . . . . . . . . . .. 747.20 SLR(P-frame) with diff'erent Distance. . . . . . . . . . . . . . . . .. 757.21 SLR(B-frame) with different Distance. . . . . . . . . . . . . . . . .. 757.22 CLR(Aggregate) with different redundancy . . . . . . . . . . . . . .. 767.23 CLR(I-frame) with different redundancy . . . . . . . . .. 767.24 CLR(P-frame) with different redundancy . . . . . . . . . . . . . . .. 767.25 CLR(B-frame) with different redundancy . . . . . . . . . . . . . . .. 767.26 SLR(Aggregate) with different redundancy . . . . . . . . . . . . . .. 777.27 SLR(I-frame) with different redundancy . . . . . . . . .. 777.28 SLR(P-frame) with different redundancy . . . . . . . . . . .. 777.29 SLR(B-frame) with different redundancy . . . . . . . . . . .. 77
TABLES
2.1 Comparison of YUV various ratio formats . . . . . .. 92.2 CCIR-601 video frame scanning parameters 102.3 SIF and CIF video frame scanning parameters . . . .. .. Il
•
•
3.1 ATM Layer Service Categories . . . . . . . . . . . . .. ..3.2 Support Operations for AAL Classes .
5.1 New Ex-CLP Field Mapping .
6.1 Statistics data of MPEG-2 trace file used in simulation6.2 Data unit definitions . . . . . . . . . . . . . . . . . . . . . .6.3 Performance Parameters Definitions .
2628
45
616465

•
•
•
RÉSUMÉ
ix

Avec l'intérêt croissant dans la transmission d'applications audio-visuelles (par exem
ple MPEG-2) sur les services "meilleur effort" d'ATM, des mécanismes de contrôle
efficaces et orientés vidéo pour améliorer la qualité vidéo en présence de pertes doivent
être coneus. Dans cette thèse, nous proposons et évaluons une nouvelle infrastructure
de contrôle de Qualité de Service (QoS) pour le service Unspecified Bit Rate modifié
(UBR+).Nous avons étudié un certain nombre de problèmes liés au codage et contrôle des
flots de données MPEG-2 transmis sur les réseaux ATM, analysés le facteur réseau
qui affecte la Qualité de Service des applications vidéo temps réel et montré comment
cette infrastructure de contrôle de Qualité de Service orientée vidéo proposée améliore
la performance de ce type de service.L'infrastructure présentée ici consiste de quatre composants: un plan de rejection
orienté vidéo, qui ajuste le niveau de rejection de facon adaptative et sélective en
fonction de la mémoire tampon du commutateur, des types de payload vidéo et de
la tolérance de rejet du Forward Error Correction (FEC); un mécanisme de partitiondes données de priorité au niveau trame basé sur la structure de données MPEG
et la réaction du réseau; un ATM Adaptation Layer type 5 (AAL5) amélioré avecune nouvelle stratégie d'encapsulation MPEG-2 par tranche ; et un mécanisme FEC,qui est implementé dans la sous-couche convergence spécifique au service AAL5 pour
fournir la capacité de détection et correction d'erreurs.Cette infrastructure de livraison vidéo n meilleur effort" est evaluée avec des données
MPEG vidéo simulées et réelles. L'objectif d'ensemble de cette infrastructure de
contrôle de Qualité de Service est double. D'une part, assurer une dégradation
élégante de la qualité d'image en minimisant la probabilité de perte de cellules pour
les données vidéo critiques tout en garantissant un délai de transfert de cellules borné.
D'autre part, optimiser le débit en réduisant la transmission de données inutiles.En comparaison avec les approches précédentes, l'évaluation de performance a
demontrée une réduction significative du mauvais débit et une minimisation des pertes
de trames codées Intra et Predictive au niveau de la tranche vidéo.
•
•
•
x RÉSUMÉ

•
•
•
ABSTRACT
xi

With increasing interest in the transmission oC audio-visual applications (e.g. MPEG
2 ) over ATM best effort services, such as Available Bit-Rate (ABR) and Unspecific
Bit-Rate (UBR), efficient video-oriented control mechanisms for improving the video
quality in the presence of loss have to be designed. In this thesis, we proposed and
evaluated a new quality of service control Cramework for use with modified Unspecific
Bit Rate service.
We surveyed a number of issues related to the coding and control of ~(PEG-2 video
data streams transmitted over ATM networks, analyzed the network factors affecting
the quality of service of real-time video applications and showed how this proposed
video-oriented QoS control Cramework improve the performance Cor such services.
The presented framework relies on four components: a dynamic Crame-Ievel pri
ority data partition mechanism based on MPEG-2 data structure and feedhack Crom
the network; an enhanced ATM Adaptation Layer type 5 (A.AL-5) associated with
a new slice-based hlIPEG-2 encapsulation strategy; a forward error correction (FEe)
mechanism, which is implemented at the AAL-5 service specifie convergence sublayer
to provide the error detection and recovery capability, and a video-oriented cell dis
carding scheme, which adaptively and selectively adjusts discard level according to
switch buffer occupancy, video cell payload types and FEe drop tolerance .
This best-effort video delivery Cramework is evaluated using simulation and real
MPEG-2 video data. The overall objective of this proposed framework is twofold.
First, ensuring a graceful picture quality degradation by minimizing cellioss proba
bility Cor critica! video data while guaranteeing a bounded cell transCer delay. Second,
optimizing the network effective throughput by reducing the transmission of non use
fuI data.
In comparison to previous approaches, the performance evaluation has shown a
significant reduetion of the had throughput and minimization of losses of Intra- and
Predictive-coded frames at the video slice layer.
•
•
•
xii AOSTRACT
•
•
•
ACKNOWLEDGMENTS
xiii

xiv ACKNOWLEDGMENTS
• To my wife Tao, Cor her love and support despite of the many lonely hours.
To my supervisor ProCessor Nathan Friedman and Karim El Guemhioui, for theirguidance and support throughout the course oC my studies.
To Ahmed Mehaaua, whom 1 have been worked with all the time in these 1 yeu, Cor
his aid in every aspect of this work, from experimental design ta data analysis.
Ta Rauof Boutaba, who leaded me into this field and gave me lots of instructions at
the start time of this project.To Eric Leung-Tack, Linda Gu, mingchen Zhang, Yang Ling, Zijun Hu, Bonnie Wu,
Song Hu, Yanmei Zhang and Adel Ghlamallah, for their constant support in this
project, and for their friendship.Ta Michael R. Izquierdo for providing us with MPEG-2 trace file for the simulation
study.Ta the system administrators in CRIM, Yves Belanger, Daniel Choiniere for their
assistance in computer system support.Ta Franca Cianci, Judy Kenigsberg and Erica Huber for many helps on my study.
•
•

•
•
•
MPEG-2 Transport over ATM Networks with BestEffort Service

•
•
•
1
OUTLINE AND MOTIVATION
1

2 1 OUTLINE AND MOTIVATION
• Asynchronous Transfer Mode (ATM) is an emerging technology for broadband net
works that allows the transmission of a wide range oC traffic types - ranging from
real-time video (e.g. MPEG-2 application) to best-effort data (such as, e-mail) - to
be multiplexed in a single physical network. A key benefit of ATM technology is its
ability to provide quality-of-service (QoS) guarantees to applications with different
traffic characteristics. These QoS guarantees are in the form of bounds 00 end-to-end
delay, delay jitter and packet loss rate. Several classes of service have been defined in
the context of ATM networks ta satisfy the QoS needs of various applications. Among
them, The Constant Bit-Rate (CaR) and real-time Variable Bit-Rate (VBR-rt) ser
vice classes provide upper bounds on delay, jitter, and loss rate. These classes are
intended for real-time applications that require low delay and jitter. The non real
Ume Variable Bit-Rate (VBR-nrt) service class is intended for applications where
no jitter control is needed, but a delay guarantee is still required. The Available
Bit-Rate (ABR) service class is intended for delay-tolerant hest-effort applications
and uses sorne kind of feedhack approach to regulate source bit rates to avoid poten-
• tial congestion. The Unspecified Bit-Rate service (VBR) does not offer any service
guarantees and, thus, has the lowest priority amoog all the classes.
This thesis studies the transport of real-time traffic generated by MPEG-2 appli
cations in an ATM network using a modified VBR service (UBR+). MPEG-2 is an
emerging standard for audio and video compression. Being capable of exploiting both
spatial and temporal redundancies, it achieves compression ratios up ta 200:1 and can
encode a video or audio source to almost any level of quality. MPEG-2 standard offers
two ways ta multiplex elementary audio, video or private streams ta form a program:
the MPEG-2 Program Stream and the MPEG-2 Transport Stream formats.
•
The transport oC MPEG-2 over ATM introduces severa! issues that must be ad
dressed in order to solve the problem on an end-to-end basis. These inc1ude the
selection of service type, choice of the adaptation layer, method of encapsulation of
MPEG-2 packets in adaptation layer packets, strategy of scheduling algorithms in the
ATM network for control oC delay and jitter, and the error control scheme.
The ATM adaptation layer (AAL) is responsible for m&king the network behavior
transparent to the application. There are (our types of adaptation layers currently

•
•
•
3
defined for ATM networks: AAL-1, AAL-2, AAL-3/4 and AAL-5. Each of these is
designed for supporting specifie services and has different functionality. The choice
of an adaptation layer involves a number of tradeofFs (1). For instance, the use of a
circuit-emulation type of adaptation layer (AAL-l) would eliminate the various syn
chronization problems associated with MPEG-2 but ean be used only with constant
bit-rate MPEG-2 streams. In the more general variable bit-rate (VaR) case, such
an adaptation layer cannot be used. An alternative is AAL-5 which was initially
proposed to carry datl traffie over ATM networks. The drawback is that it is too
simple to provide reliable eonnection for sorne multimedia applications. In this thesis,
AAL-5 is selected, sinee it is currently the most commonly used adaptation layer in
industry and can support variable bit-rate MPEG-2 traffie. Sorne modifications are
proposed to improve its reliability for the transport of real-time MPEG-2 video data.
Different proposals have been made for seleeting the type of service under which
MPEG-2 is to be transported over AT~I [2, 3, 4). For constant bit-rate MPEG-2
streams, the CBR class of service is the natural choice. For the variable bit-rate case,
three main approaches have been proposed. The VBR service with rate renegotiation
tries to maximize the multiplexing gain by eapturing the VBR nature of MPEG-
2 [2, 5]. Aecording to this approach, the effective bandwidth of the source during
a specifie interval is used in order to allocate resources in the network. If enough
resources are not available the quality is degraded. The rate is renegotiated in the
long time ron and the way the renegotiation points are selected depends on the exact
algorithm. The second approach, ABR service, usually uses feedhack information _
in order to change the coding rate at the output of the MPEG-2 encoder to suit
the available bandwidth [6, 3, 4]. In this approach, the service is considered best
effort with some minimum guarantees. In the last approach, UBR service, provides
statistical service without any guarantees, like the one used in the Internet today.
The overall quality relies totally on the load of the network, thus, no QoS can be
guaranteed at ail. Of these, the last two approaches, ABR and UBR, are primary
designed for data traffic, which have a bursty unpredictable behavior. However, since
these best effort services will be widely available in the future and are based on the
excess bandwidth in the network with lower usage cost, it is predicted that they will

4 1 OUTLINE AND MOTIVATION
• also SUpport a non-negligible part oC the multimedia traffic.
ThereCore in this thesis, we propose a quality oC service control framework for
the delivery oC best effort video applications over UBR service. The aims of this
Cramework is twoCold. First, minimize 10ss for critical video data with bounded end
to-end delay for the arriving cells. Second, reduce the bad throughput crossing the
network.
•
•
In order ta ensure end-to-end acceptable quality, each component along the trans
port path must be designed ta provide the desired level of service. Therefore,opti
mizing only specifie components in the path may not be adequate for ensuring the
desired quality for the application. For example, designing a goad forward errar re
covery scheme for the adaptation layer whiIe using a poor cell discarding algorithm
(e.g. randomly discarding) Cor the switch will not be sufficient ta maintain the end-ta
end performance of video application at the receiver. Therefore, the adaptation layer,
encapsulation scheme, scheduling discipline in the ATM switches and error recovery
mechanisms at the receiver must aIl he designed ta provide the desired level of quality
at the receiver. Consequently, the proposed Cramework relies on three schemes : an
intelligent video data partition and prioritization mechanism located at the source,
a slice-based MPEG-2 packet encapsulation strategy, an AAL sublayer with Corward
errar correction control capability, and finally, an efficient switch scheduling strategy
with adaptive discarding technique.
The rest oC this thesis is organized as Collows: first, we introduce sorne fundamen
tal concepts of video coding, compression, and the MPEG-2 standard, Collowed by a
discussion of the Cunctionality of the system layer oC MPEG-2 . Aspects dealing with
the current types of services in ATM networks and the ATM adaptation layer with
principal traffic and QoS control approaches Cor traditional packet-oriented applica
tions over ATM are presented in Chapter 3. In Chapter 4, issues oC MPEG-2 video
traffic over ATM best effort services are addressed, Collowed by a discussion of the
insufficiency ofsome approaches that have been proposed in the literature. Chapter 5
is devoted to the description of the four components of the proposed best effort video
delivery Cramework. In Chapter 6, we present the network model, the characteristic
of MPEG-2 tracing file we use, and the investigated performance parameters. We

•
•
•
5
discuss the experimental results in Chapter 7. Finally, chapter 8 gives the conclusion
and proposes areas for future research.

•
•
•
2
MPEG-2 STANDARD: A REVIEW
6

In this chapter we overview digital video coding and compression, and the MPEG-2
standard. we begin with a short history of MPEG standards and proceed to discuss
the video standard, which includes principles of MPEG-2 coding and compression sucb
as quantization and inter-frame prediction. Then, We conclude with a description of
the MPEG-2 systems standard, in which the main components of the transport stream
will he explained, including elementary streams, packetized elementary streams, and
program specifie information.
•2.1 History 7
•
•
2.1 History
Two important standardization efforts related to digital video coding were started
in the late 1980s. One is the ITU-T standard for video conferencing and video
telephony, known as H.261. The other one came under the name of MPEG (Moving
Pictures Experts Group) from ISO/IEC in order ta define a video coding algorithm
for application on digital storage and transmission. In addition, audio coding was
added and the scope of the targeted applications was extended ta cover aJmost a11
applications, from multimedia systems to high definition television.
MPEG's first effort led to the MPEG-l standard, that was puhlished in 1993 as
ISO/IEC 11172. It is divided into three parts: audio compression, video compression,
and system level multiplexing for applications that need video and audio ta he played
back in close synchronization. MPEG-1 is being used in a variety of applications. For
example, CO-I and VideO-CD technology use MPEG-1 as the compression algorithm
for video and audio. It was designOO to support video coding up to 1.5 Mbps with
VHS quality, audio coding at 192 Khps/channel (stereo CD-quality) , and is optimized
for non-interlaced video signaIs.
MPEG's second effort started in 1990. The main objective was to design a com
pression standard capable of different qualities depending on the bit-rate, &om TV
broadcast to studio quality, and ta enable the transmission of video and audio in
broadband networks. This work 100 to the MPEG-2 standard which is based on
MPEG-l but is more sophisticated and optimized for interlaced pictures. FUrther
more, it is targeted to cope with lossy communication media. The MPEG-2 standard
is capable ofcoding standard TV at about 4 to 9 Mbps, and HDTV at 15 to 25 Mbps.

8 2 MPEG-2 STANDARD: A REVIEW
• In the audio part of the standard, it supports multi-channel surround sound coding
while being backward compatible with the MPEG-l audio definition.
Since this thesis is mainly concerned about the MPEG data transport in network
environment, we will use MPEG-2 data only in our network simulation. The MPEG
standard will be discussed in Section 2.4 with an emphasis on MPEG-2 .
2.2 Color Representation
•
•
To understand the process of video compression, it is a good idea to start with the
color representation.
Color is the perceptual result of light in the visible regjon of the spectrum, having
wavelengths in the region of 400nm to 700nm, incident upon the retina. Because
there are exactly three types of color photo-receptors in the eye, three numerical
components are neeessary and sufficient to describe a color, providing that appro
priate spectral weighting funetions are used. This is the coneern of the science of
colorimetry. Usually, color is represented by the intensity distribution of the three
primary colors, Red, Green and Blue (R,G,B) or equivalently of one luminance (Y)
and two chrominance components(U,V or Cr, Cb). RGB color space is widely used
in computer environment, while YUV and YCrCb find their place in television. The
video compression technique used in ~IPEG-l and MPEG-2 works with the later.
It is believed that the human eye can detect as many as 4 million colors. Anything
more than that is potentially wasted. RGB uses a specifie number of colors for each
picture element. These are usually referred to in a ratio sucb as 5:5:5 or 8:8:8. This
means that for each component of the pixel (R, G, or B) there are 5 or 8 bits of color
respectively. 5:5:5 R,G,B is also referred to as 15 bit color and gives a total of 32,768
colors for any and every pixel on the screen. Common R,G,B color resolutions are 8
bits/pixel (256 colors), 16 bits/pixel (65,535 colors) and 24 bits/pixel (16.7 million
colors). Sa, to deliver an R,G,B video image that meets the needs of the human eye,
24 bits/pixel graphies are required. This is often referred to as True-Color. YUV
and YCrCb define and display color in a slightly ditrerent way. Because the human
eye can detect brightness (luminance) better than it can detect color (chrominance),
the video community developed the Y,U,V component format to reduce the amount

of data required ta deliver full fidelity calor, while retaining maximum brightness.
This is done by limiting the rate at which chrominance changes relative to the rate at
which luminance changes, thus allows the Y,U,V format ta reduce the amount of color
information per pixel while retaining the maximum brightness per pixel. Therefore,
•2.2 Color Representation 9
•
•
Component 4:1:1
Pixell Pixel 2 Pixel 3 Pixel 4
y 8 bits 8 bits 8 bits 8 bits
U (Cr) 8 bits Shared with pixel 1 Shared with pixel 1 Shared with pixel 1
V (Ch) 8 bits Shared with pixell Shared with pixel 1 Shared with pixel 1
4:2:2
y 8 bits 8 bits 8 bits 8 bits
U (Cr) 8 bits Shared with pixel 1 8 bits Shared with pixel 1
V (Cb) 8 bits Shared with pixell 8 bits Shared with pixell
4:4:4
y 8 bits 8 bits 8 bits 8 bits
U (Cr) 8 bits 8 bits 8 bits 8 bits
V (Cb) 8 bits 8 bits 8 bits 8 bits
Table 2.1: Comparison of YUV various ratio formats
Y,U,V video color resolutions are a1so reCerred to in a ratio format. Typical Y,U,V
formats are 4:1:1 (4:2:0), 4:2:2, and 4:4:4. The numbers in the format refer ta the
amount of color data that is shared between groups of 2 or 4 pixels. Assuming 8 bits .
per pixel of data, a 4:1:1 Y,U,V format means that within a 4 pixel group there will
be 8 bits of Y for each pixel but only 8 common bits of U and V shared over 4 pixels,
4:2:0 format is a special case of 4:1:1, where the chrominance values are calculated
and therefore represent a value that is offset from luminance samples. A 4:2:2 Y,U,V
format means that within a 4 pixel group there will be 8 bits of Y for each pixel but
only 8 common bits of U and V shared over each 2 pixel pair. A 4:4:4 Y,U,V format
means that for each pixel within a 4 pixel group there will be 8 bits of Y, 8 bits of U,
and 8 bits ofV. Essentially, 4:4:4 is identical in color depth to 24 bit R,G,B. Table 2.1
show the relative comparison of 4:1:1, 4:2:2 and 4:4:4 and how its data is sampled

10
• and spread across pixels.
2.3 Digital Video Format
2.3.1 CCIR-601 Recommendation
2 MPEG-2 STANDARD: A REVIEW
•
The video signal is obtained through a process known as scanning. Scanning can he
either progressive or interlaced. Progressive scanning scans aIl the horizontallines to
fonn the complete frame and is used hy the computer industry. Interlaced scanning
is used by the TV industry. CCIR Recommendation SOI (now with the name of ITU
BT-60l) defines the digital video format, which serves as a standard for TV industry.
Table 2.2 shows the scanning parameters defined in CCIR-SOl.
PARAMETER CCIR-601 NTSC CCIR-SOI PAL/SECAM
Active Pixels/Line 720 720
Active Lines/Picture 485 576
Sampling Structure 4:2:2 (4:4:4) 4:2:2 (4:4:4)
Temporal Rate 60 fields/s 50 fields/s
Frame/Sec. 30 25
Aspect Ratio 4:3 4:3
Interlacing 2:1 2:1
Table 2.2: CCIR-601 video frame scanning parameters
2.3.2 Source Input Format (SIF) and Common Interchange Format
(CIF)
However, the number of picture element (pixel) in CeIR 601 is tremendously high
to he coded at reasonable bit-rates. For example, consider a Ce1R-601 NTSC video
signal at a frame rate of 30Hz and 24 bits/pixel resolution, the requirements are
approximately 250 Mbps Cor 4:2:2 sampling ratio. For a two bouts movie, the stor-
• age requirement would simply translate to an astronomical 225 Gbytesl Thus to
accommodate slower communication channeis and computer buses, a SIF (Standard

Interchange Format) source format has been defined as MPEG encoder input signal
(MPEG-l onlyaccepts SIF whereas MPEG-2 accepts both SIF and CCIR-601).•2.4 MPEG Coding
PARAMETER SIF NTSC SIF PAL/SECAM CIF
Active Pixels/Line 352 352 352
Active Lines/Picture 240 288 288
Sampling Structure 4:2:0 4:2:0 4:2:0
Temporal Rate 60 fields/s 50 fields/s 60
Frame/Sec. 30 25 30
Aspect Ratio 4:3 4:3 4:3
Il
•
•
Table 2.3: SIF and CIF video frame scanning parameters
Briefty, the CCIR 601 to SIF conversion is done by three distinct operations.
Reducing the picture size by a factor of two, removing the interlacing (e.g. removing
odd fields from CCIR 601), and a 2 to 1 decimation of the chrominance information,
since it is less important ta the human visual system.
CIF (Common Interchange Format) was developed in the ITU-T H.261 recom
mendation in order to have a common format to which PAL- and NTSC-based
frames could be converted. The parameters of SIF and CIF are bath summarized
in Table 2.3.
2.4 MPEG Coding
Ta understand the cading and compression process, it is important to recognize the
different redundancies present in the video signal data- spatial, temporal, psycho
visual and coding. Spatial redundancy occurs because neighboring pixels in each
individual frame of a video signal are related, in other words, have sorne degree of
correlation. The pixels in consecutive frames of a signal are aIso correlated, leading
to substantial temporal redundancy. In addition, the human visual system does
not treat ail the visual information with equal sensitivity. This leads to psych~
visuaI redundancy. For example, as we mentioned in Section 2.3, the eye perceives
changes to a greater extent in the luminance than in the chrominance. The eye is

12 2 MPEG-2 STANDARD: A REVIEW
• also less sensitive ta high frequencies. Finally, not all parameters occur with the same
probability in an image. As a result, they would not require equal number of bits
ta code them, leading ta coding redundancy. For any compression algorithm ta be
effective, it must exploit these redundancies.
•
2.4.1 Coding Principles
The basic MPEG algorithm consists of the following stages: a motion compensation
stage, a transformation stage, a lossy quantization stage and a last lossless coding
stage. The motion compensation stage takes the difference between the current image
and a shifted view of the previous one. The transformation stage then tries to concen
trate the information energy inta the first transform coefficients, MPEG uses Discrete
Cosine Transform (OCT) for this purpose. The quantization step that follows causes
a loss of information that takes inta account psychO-visual limitations of the human
eye, and the last coding stage is nothing more than an entropy cading pracess that
further compresses the data.
MPEG defines a number of basic abjects that are used ta structure video infor
mation (see Figure 2.1). Before discussing the cading algorithm, let's introduce these
basic units that are used in MPEG algorithm:
Block: A block is the smallest corling unit in the MPEG algorithm. It is made up
of 8 x 8 pixels and can be one of three types: luminance (Y), red chrominance
(Cr) and blue chrominance (Cb) as described in Section 2.2. Block is the basic
unit in intra-frame OCT coded frames.
Macro-block: A macra-block is the basic coding unit in the MPEG algorithm. It
consists of a 16 x 16 pixel segment. Since MPEG's video main profile uses the
4:2:0 chrome fonnat, a macrO-block consists of four Y, one Cr and one Cb block.
It is the motion-compensation unit.
Slice: A sUce is a horizontal strip within a frame and it is the main processing unit in
MPEG. Coding of blocks and macro-blocks is feasible only when all the pixels
of a sUce are available. Besides, coding of a slice is being done independently
• from its adjacent slices, making it an autonomous unît. Thus, slices serve as
resynchronization units.

•2.4 MPEG COCÜlJg
Video Sequence
13
\..y
üroup of PiC:IUR
) \. y
üroup of Piclure
)
Figure 2.1: Basic objects defined in MPEG-2 .
EB-!
D
•
Mac:robloc:k
Block
1
1Slice
1
1
1
1
•
Picture: A picture in MPEG is a single frame in a video sequence.
Group-of-pictures:The group-of-pictures (Gap) is simply a small sequence of pic
tures in which random access is provided. Typical values are 12 and 15 pic
tures/group. The GOP concept was mandatory in the MPEG..1 standard
whereas it is optional in the MPEG-2 standard.
Sequence: The sequence consists of a series of pictures (or a series of GOPs if these
are used).
2.4.2 Discrete Cosine 'Iransform Coding
Usually, the video energy of a image has low spatial frequency that varies very slowly
and 50 a transformation Crom space to frequency domain can concentrate the energy in
very few coefficients. For this transformation, the actual image is divided into blocks
to decrease the complexity. Every block (8 x 8) is transformed according to a tw~
dimensional Discrete Cosine Transform which cao be thought of as a one dimensional
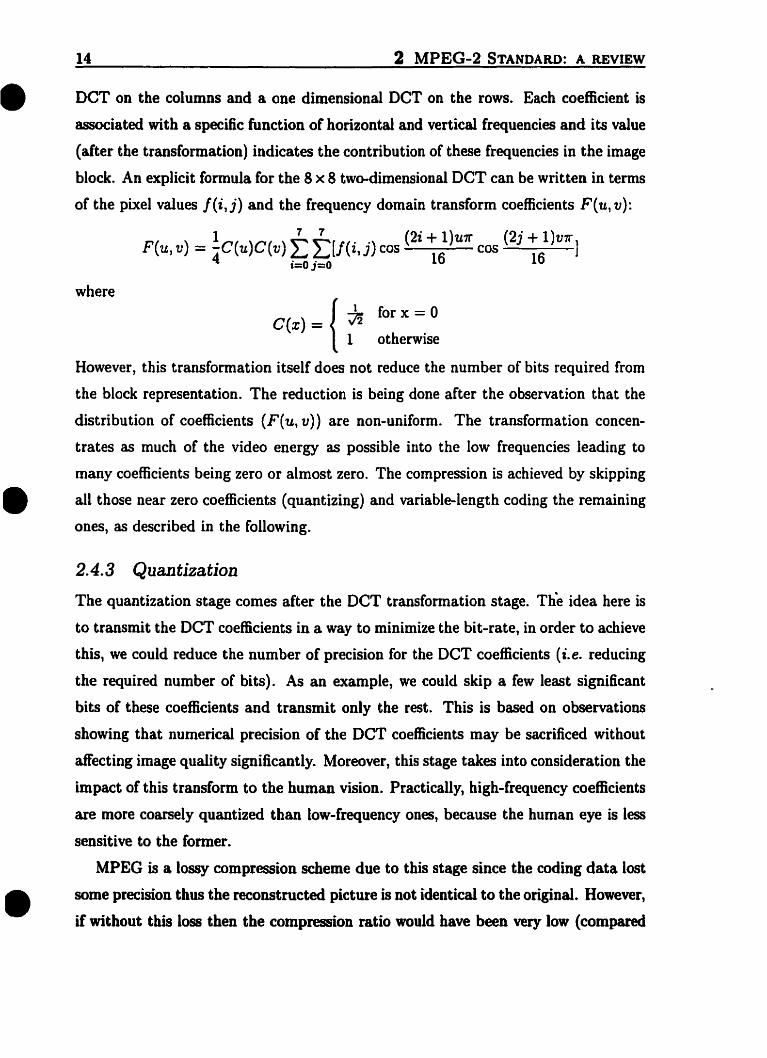
14 2 MPEG-2 STANDARD: A REVIEW
• DCT on the columns and a one dimensional OCT on the rows. Each coefficient is
associated with a specifie fonction of horizontal and vertical frequencies and its value
(after the transformation) indicates the contribution of these frequencies in the image
block. An explicit fonnula for the 8 x 8 two-dimensional OCT can he written in terms
of the pixel values f(i,j) and the frequency domain transform coefficients F(u, v):
F( t) = !C( )C( )~ ~[f(··) (2i + l)u1l" (2j + 1)V7r1u, v 4 u v ~~ 1.,) cos 16 cos 16I=OJ=O
where
CCx) = {~ for x = 01 otherwise
However, this transformation itself does not reduce the number of bits required from
the black representation. The reduction is being done after the observation that the
distribution of coefficients (F(u, v)) are non-uniform. The transformation concen
trates as much of the video energy as possible into the low frequencies leading to
many coefficients being zero or almost zero. The compression is achieved by skipping
• all those near zero coefficients (quantizing) and variable-Iength coding the remaining
ones, as described in the following.
•
2.4.3 Quantization
The quantization stage cornes after the OCT transformation stage. The idea here is
to transmit the OCT coefficients in a way to minimize the bit-rate, in order to achieve
this, we could reduce the number of precision for the DCT coefficients (i.e. reducing
the required number of bits). As an example, we could skip a few least significant
bits of these coefficients and transmit only the rest. This is based on observations
showing that numerical precision of the OCT coefficients may be sacrificed without
affecting image quality signifieantly. Moreover, this stage takes into consideration the
impact of this transform to the human vision. PracticallYt high-frequeney coefficients
are more coarsely quantized than low-frequeney ones, because the human eye is less
sensitive to the former.
MPEG is a Jossy compression scheme due to this stage sinee the coding data lost
some precision thus the reconstructed picture is not identical to the original. However,
if without this loss then the compression ratio would have been very low (compared

ta 100:1 that it is typical in MPEG) since the least significant bits of each color
component become progressively more random, thus harder ta code.•2.4 MPEG CodilJg 15
2.4.4 Entropy Coding
The final compression stage starts with the serialization of the quantized OCT co
efficients and attempts ta exploit any redundancy left. The way the serialization is
done affects the final compression. The OCT coefficients are rearranged in a zig-zag
manner as it is shawn in Figure 2.2. The scanning starts from the coefficient with the
•
Mleralle SCia
A /1 A A A V1 j
IV), IV) IV) /1 ( ( JI ( .J j
) ) ) IV ) /' 1
/ / / 1/ J / 11 J / J
j 1 1 Il Il1 1
""- -
•
Figure 2.2: DCT coefficients in a corling black is scanned in zig..zag arder (regular and altemate).
lowest frequency (OC coefficient) and follows the zig-zag pattern until it reaches the
last coefficient. In MPEG-2 there is an altemate scan pattern that is more efficient
with interlaced video signais. The sequence of coefficients is then entropy-coded using
a variable length code (VLC). The way the VLC allocates code lengths depends on .
the probability that they are expected ta occur, these codes could he obtained by
using Huffman algorithm.
2.4.5 Motion-Compensated Inter··Frame Prediction
The inter-frame prediction is being used in arder ta exploit temporal redundancies
found in the video sequence. The idea is to check the displacement of the varions
macro..blocks and to encode the best resulting difference (see Figure 2.3). The MPEG
syntax specifies how to represent the motion information: one or two motion vectors
per 16x16 macro..block of the picture depending on the type of motion compensa·

•16 2 MPEG-2 STANDARD: A REVlEW
(-frame
MOlion Vcclor(Mh. Mv)
Colocalcd Macroblucks
Figure 2.3: Motion compensation and motion estimation.
•tion (forward or backward-predicted, see next section). However. the method used
in computing the motion vectors is not specified in the standard. This can be done
either exhaustively or using different techniques depending on many parameters. For
example, in stationary scenes the predictor may use the same block from the reference
frame. If the scene is not stationary then one way ta compute motion vectors is ta
find the d!fference between the current black and a black that is shifted appropriately
in the reference frame. "Block-matching" techniques are likely ta be used for this
purpose [7}. The actual ways of computing the motion vectors is left ta the imple
menters. The whole encoding process is shown in Figure 2.4 in the block-diagram of
a hypothetical MPEG encoder.
2.4.6 Picture Types in MPEG
In MPEG (bath MPEG-l and MPEG-2 ) there are three types of pictures that are
defined [8]:
Intra-frames or I-frames: These are pictures that are coded autonomously with
out the need of a reference ta another picture. Temporal redundancy is not
• taken into account. Moderate compression is achieved by exploiting other three
redundancies. An I-frame is always an access point in the video sequence.

•2.5 MPEG-2 Video Standard
videosueam
P-otB·fnme
......----..----oej VLC ~---.
17
OCT: Disc:rete Cosine TransformQ: QuantizationIQ: Inverse Qu:mtimionIDCT: Inverse OCTMCP: Motion-Compenwcd PredictionVLC: Variable Lcnlth Ccldcr
•
•
Figure 2.4: MPEG encoder.
Predictive or P-frames: These frames are coded with respect ta a previous 1- or poo
frame using a motion-compensated prediction mechanism. The coding process
here exploits ail kind of redundancies.
Bidirectionally-predicted or B..frames:The B-frames use bath previous and future
1- or P..frames as a reference for motion-estimation and compensation. This
achieve the highest compression ratios. However, because they reference bath
past and future frames, the coder has to rearder the pictures that are involved
in this process 50 that each B-frame is produced aCter ail the frames it refer
ences. This intraduces a reordering delay which depends on the interval between
consecutive B-frames.
A typical MPEG video sequence is shown in Figure 2.5.The I-frame is coded first.
tben the next P-frame and then the interpolated B-frames between the two. The
process repeats with the next P-frame and B-frames.
2.5 MPEG-2 Video Standard
The MPEG-2 standard is similar to MPEG-l but bas extensions to cover a wider range
of applications. The primary application targeted during the MPEG-2 definition
process was the all-digital transmission of broadcast quality video at coded bit-rates
between 4 and 9 Mbits/sec. However, the MPEG-2 standard proved to be efficient
for other applications &Iso that need higher rates, sucb as HDTV.

•18
Time
2 MPEG-2 STANDARD: A REVIEW
- [·frame
- P·frame
Cl B·frame
Figure 2.5: Example of inter-dependence among various picture types in a MPEG video sequence.
2..5.1 Differences between MPEG-2 and MPEG-l
• Sorne of the important differences between MPEG-2 and MPEG-1 standards are
summarized below:
1. MPEG-2 is optimized for interlaced pictures and can represent progressive video
sequences a1so, whereas MPEG-l's syntax is strictly meant for progr~ssive se
quences and was optimized for CD-ROM or applications at about 1.5 Mhit/sec..
2. The second main improvement of MPEG-2 in comparison to MPEG-l is the
possibility ta efficiently transmit video over networks and Dot from a local CD
ROM player.
3. MPEG-2 has more profiles and levels and supports scalable profiles. This is an
important feature that could he taken advantage in the network environment
as described later in this section.
4. Additional prediction codes for motion-compensation were introduced, as weIl
as more chrome formats.
• 5. Severa! other more subtle enhancements (e..g. adaptive quantization, 10-bit
nCT nc precision, non-linear quantization, VLC tables. improved mismatch

control.) were introduced that improved the coding efficiency even for progres
sive pictures.•2.5 MPEG-2 Video Standard 19
•
•
2.5.2 Scalabilityand Data Partition
As listed above, An important difference between MPEG-2 and MPEG-l is that
MPEG-2 could achieve scalability by using its structure syntax. Four scalable com
pression modes are defined in the MPEG-2 toolkit [7]. These coding techniques
subdivide MPEG-2 video into numerous layers (base, middle, and high layers) mostly
for prioritized transmissions [8]. At the destination, the lowest priority bitstreams,
referred as enhancement layers, can be added to the base layer to display a higher
quality picture. A brief summary of these different modes are presented below.
• Spatial Scalability: this mode codes a base layer at lower sampling dimensions
(i.e. resolution) than the upper layers. This is useful in simulcasting, where a
standard TV set needs only ta decode the CCITT-S01 720 x 480 base channel,
and leave the higher HDTV 1440 x 960 data.
• Temporal Scalability: the higher priority bitstream codes video at a lower frame
rate (e.g. 15 Hz), and the intermediate frames are coded in a second bitstream
ta achieve a full frame rate (e.g. 30 Hz).
• SNR Scalability: the layers are coded with differing picture quality by using
different quantization step sizes.
• Data Partitioning: it is a frequency domain method that breaks the block of 64
quantized DCT coefficients into two bitstreams. The first, higher priority bit
stream contains the lowest frequency coefficients and side information (sncb as
motion vectors, macroblock headers, etc. ). The second lower priority bitstream
canies the remaining higher frequency AC coefficients.
One application of the scalable syntax concept might be the following: one layer con
tains the video information for a standard (PAL or NTSC resolution) TV program,
this layer, called the "hase layer" in MPEG-2 , could then he combined with another

20 2 MPEG-2 STANDARD: A REVIEW
• information stream, the "enhancement layer" , which contains additional video infor
mation to get the RDTV quality video. This is very useful when data are transmitted
over a resource-limited network environment.
Another idea similar to this is used for data partitioning, in this case, the most
important syntax elements could be transmitted with a higher priority, the less im
portant elements \Vith lower priority. Then, when transmitted in a best effort service
class, like UBR, the elements with lower priority would be considered to discarded first
if network congestion happens. This could preserve the critical data in applications
thus ensure graceful end-to-end degradation.
2.5.3 MPEG-2 Systems Layer
The ~IPEG-2 standard also defines system layer specification that describe how more
than one stream (video or audio) should be multiplexed together to form an actual
program. A program is considered a single broadcast entity service. For example,
"The 11 Q'clock CTV news" is considered a program that has individual streams of
• video, audio and maybe other data such as caption text. The standard defines the
\Vay the different streams are multiplexed. Figure 2.6 shows the scope of the MPEG-2
Systems part in relation to the video and audio part and the network equipment.
Video DataVideo Encoder
Audie EncoderAudio Dala
Network Eqllipmenl
Scapc ofMPEG-2 Sysrcms
Figure 2.6: Scope of MPEG-2 systems specifications.
•Two schemes are used in the MPEG-2 standard for the multiplexing process.
• Program Stream: This is analogous and similar to MPEG-l Systems layer. It
is a grouping of video, audio and data elementary streams that have a common

time base and are grouped together for delivery in a specifie environment. Each
program stream consists of only one program. The program stream is often
called Program Stream Multiplex.
•2.5 MPEG-2 Video Standard 21
•
•
• Transport Stream: The transport stream combines one or more programs inta
a single stream. The programs may or may not have a cammon time base. This
type of multiplexing is used in environments where errors are likely and is the
default choice for transport uver a computer network. The transport stream is
often called Transport Stream Multiplex.
The program stream is mainly focused on using CD-RDM and hard-disc media,
thus, it uses long data structures to transport video and audio data. This could
ooly be done io "low-error environment" , since a loss of any of these structures could
results in seriaus problems with the quality of the video information transferred. The
transport stream is used in the oetworked environment, it uses fixed length, relatively
short data structures that can be well processed in network environment. Since this
thesis concerns MPEG-2 video in ATM networks, we will only focus on the transport
stream.
Transport stream layer deals with sorne special entities. The whole process starts
from the uncompressed data which cornes directIy from the actual video sequence,
each frame is uncompressed and is called a "presentation unit". ·The encoder com
presses each frame according ta the standard and each frame is then called an "access
unit". The stream produced by the access units is called "elementary stream" in
MPEG terminology. This process is shawn in Figure 2.7.
Arter the creation of the elementary stream, the next step is its packetization. The
resuiting stream is now called "packetized elementary stream" and the packets are
called "PES packets". The way the PES packets are formed is independent from the
actual multiplexing procedure.
A PES packet consists of a header and a payload. The payload is nothing more
than data bytes taken sequentially from the original elementary stream. There is
no specific format for encapsulating data bytes in a PES packet, i .. e.. there is no
requirement ta align the start of the access units and the start of the PES packets.
This means that an access unit may start at any point within a PES packet as shown in

22 2 MPEG-2 STANDARD: A REVIEW
• Figure 2.7. In addition, more than one access unit may he present in one PES packet.
The way this packetization is done, however, cao significantly affect the nature of the
actual packetized stream. For example, if each PES packet contains exactly one video
frame (in the case of a video elementary stream), the decoder cao determine the start
and end of a frame easily. Similarly, network transport and control policies can take
henefit of this structure ta offer a guaranteed packet-oriented service. This, however,
requires use of variable size packets and iDcreases the complexity of processing in
the encoder. On the other hand, if the PES packets are of fixed length, then the
packetization process at the encoder is simpler.
Presentation Unit
Elementary Stream
",
Frame 3
.......... '
Frame: 1 Frame 2 Frame: 4 Frame: S r.' '' '.~
........············.:: ······o,nê~~presscd Video StreamO' ~. • • .. .
Ac:cess Unit :: , .. ' ....
~1......_-q=EJ---.~--Ittrtt=-p-,.......[: :: :..\"':'::.:---...
I_PES__Pac_kct~I.Il_---I···I·I__··l""I""--"'--_Packetizcd EJcmenwy Stream (PES)
oPœE;;C4EJ 0F"lXed Lcngtb Payload ( 184 bytes)
Transpon Stream (TS)
"' .
rrs PlCk~1 \. ". ". ".DDIfDD
Adaptation Ficld(uscd or stumng)
•Figure 2.7: PES encapsulation using fixed length packet.
As shown in Figure 2.7, the transport stream consists ofshort, 6xed-length packets.
A transport packet has a length of 188 bytes. It comprises a 4-byte header followed
by an Uadaptation field" or a payload or bath. The PES packets from the varions
elementary streams are each divided among the payload parts ofa number of transport
packets. However, there are two constraints:
1. The first byte of a PES packet must he the first byte of a transport packet
payload.
• 2. Each transport packet must contain data from only one PES-packet, Î. e. a
single transport packet reCers to a specifie PES stream and thus to a specifie
•2.5 MPEG-2 Video Standard
elemeotary stream.
23
•
•
Because of the two constraints stated above, a transport packet may Dot be eom
pletely full siDee it is unlikely that a PES-packet will fit exactly into an integer number
of transport packets. The stuffiog bytes that oeeded ta fill the packet are placed in
the adaptation field (see Figure 2.7). The amount of this stuffing cao be minimized
by careful selection of the PES packet length. Usually. long PES packets are better
in terms of bandwidth efficiency, but are more prone to synchronization problems.

•
•
•
3
SERVICE CLASSIFICATION AND ADAPTATION LAYER OF ATM
24
Asynchronous Transfer Mode (ATM) is a cell-based switching and multiplexing tech
nology designed to be a general-purpose, connection-oriented transfer mode for a wide
range of services. It is used bath in WAN and LAN environment, public and private
network, as specified by the ATM Forum.
The primary unit in ATM is the celle The ATM standard defines the cell with
a fixed-size length of 53 octets (bytes), comprised of a 5-octet header and a 48
octet payload. The fixed cell size simplifies the switching and multiplexing process
and enables implementations of these at very high-speeds. The fixed cell size aIso
eliminates the problems of short packets being delayed behind larger ones. This
allows ATM to provide good service ta such things as voice and video, where large
transmission time variation is unacceptable.
The vision of ATM is that an entire network can be constructed using ATM Appli
cation Layers (AALs). and switching and multiplexing principles, to support a wide
range of service. In this manner, ATM provides multiple QoS classes for differing
application requirernents on delay and loss performance.
•
•
3.1 Classilication ofServices in ATM Networlcs 25
•
3.1 Classification of Services in ATM Networks
As mentioned above, in ATM networks, a large number of services can be provided.
These include low-speed services such as telemetry, tele-control, tele:alarm, voice,
tele-fax, medium-speed ones like Hi-Fi sound, video telephony, and high-speed ones
like high-quality video distribution. In addition, the conventiooal "best-effort" appli
cations will aIso be included, giving a large variety of services provided.
These different services are based 00 a variety of desired communication attributes
(see Table 3.1), such as cell loss rate (CLR), cell transfer delay (CTD), cell delay
variance (COV), sustainable cell rate (SCR), peak eell rate (PCR) , minimum cell rate
(MCR), whether or not the flow control is applied. By taking difrerent combinations
of these attributes, we have Cour basic service classes:
• Constant Bit-Rate (CBR): Used for emulating circuit switching, where the re
quired bandwidth is constant and known in advance (e.g. voice and television).
This service provides guarantees on both delay and delay variance.

•
•
•
26 3 SERVICE CLASSIFICATION AND ADAPTATION LAYER OF ATM
QoS
Attribute CBR VBR ABR UBR
realtime 1 non-realtime
CLR Specified Specified Unspecified
CTD Specified Unspecified
COV Specified 1 Unspecified Unspecified
SCR N.A. Specified N.A.
PCR Specified Specified
MeR N.A. Specified N.A.
Controlled No Yes No
Table 3.1: ATM Layer Service Categories
• Variable Bit-Rate (VBR): Allows users ta send at a variable rate that could
he characterized in advance (e.g. video conferencing). The traffie is described
in terms of the PCR, SCR, and MeR. VBR has two sub-categories: real-time
(VBR-rt) and non-real-time (VBR-nrt) [9]. The fomler needs specifie quality-of
service guarantees from the networks, sinee it carries traffie with a fixed timing
relationship between samples. The VBR-nrt is intend ta carry variable bit-rate.traffie in which there is no timing relationship between sample, but a guarantee
of end-to-end delay is still needed.
• Available Bit-Rate (ABR): Designed for classieal data traffic that cannot (or is
hard to) predict in advanee and is not time sensitive. It proposes a guaranteed
minimum rate and uses a rate-based feedback approach ta control congestion
in the netwark.
• Unspecified Bit-Rate (UBR): Designed for those data applications that want
ta use any leftover bandwidth and are Dot sensitive ta cell loss or delay. This
service does not offer any service guarantees and thus, has the minimum priority
among all the other classes.

3.1.1 How These Services Work Together
First, a given amount of bandwidth is guaranteed ta CBR, and VaR connections.
Although the entire guaranteed bandwidth is not always used by the connection, the
connection bas access ta all of its reserved bandwidth, ifnecessary (Figure 3.1). ABR
then belps fiU in this otherwise wasted bandwidth witb regular data traffic. UBR was
created ta do approximately the same thing, except that it had no MeR and was
•3.2 ATM Adaptation Layer (AAL) 27
•
•
AvDilable For ABR(UBR) Servie
Alloc:alcd Ta CBR Servic:es ~_-'- ----.l.~
Time
Uscd by CBR Servic:es
Figure 3.1: Service bandwidth allocation.
more of a send-and-pray protocol. To deal with the data loss and errOJ: in networks,
one way is, for the receiver, ta timeout aCter a given period of time, then ta ask for
a re-send of a missing cell. However, in a delay-sensitive flow (like MPEG-2 video
data), retransmission causes long time delay which is not acceptable. The alternate
way is using a forward error correction mechanism to recover from the error which
avoids the extra delay caused by retransmission.
3.2 ATM Adaptation Layer (AAL)
Another important concept is the ATM Adaptation Layer (AAL). The function of
this layer is to pro\ide generalized inter-working across the ATM oetwork. Generally
speaking, it is divided ioto two sub-layers: the Segmentation and Re-assembly (SAR)
and the Convergence Sublayers (CS) (see Figure 3.3).
The SAR is responsible for the segmentation of the outgoing Protocol Data Units

28 3 SERVICE CLASSIFICATION AND ADAPTATION LAYER OF ATM
• (PDUs) into ATM cells and the re-assemblyof ATM cells back into PDUs. In the case
of data, for example, the AAL takes frames (blocks) of data delivered to it, breaks
them up into cells and adds necessary header information to allow rebuilding of the
original frame at the receiver.
The function of convergence sublayer covers the generation and recovery of timing
information, e.g. it can compensate for the effects of cell delay, variation, it takes
care of cell misinsertion, cell loss and cell mis-sequency, and also it 8ags possible
error condition to the upper layer.
AAL is designed ta cope with the different requirement of variant traffie. The ITU
T has defined four generic classes network traffic that need to be treated differently by
an ATM network. These classes are designated from class A to class 0 with regards
to the following operations [10]:
• Timing between sender and receiver (present or not present)
•
•
• Bit rate (variable or constant)
• Conneetionless or connection-oriented sessions between sender and receiver.
These four traffic classes are summarized in table 3.2.
Class A lB C 1 0
Timing Synchronous Asynchronous
Bit Transfer Constant 1 Variable
Connection Mode Connection-Oriented 1 Connectionless
Table 3.2: Support Operations for AAL Classes
Originally, there were four different AAL types proposed, one for each traffie class.
This changed during the standards definitian process as the problem came ta be better
understood. The current AAL types association with traffie classes are summarized
in Figure 3.2
As we can see, there are DOW Cour AAL types:
• AAL-l provides function for c1ass A.

•3.2 ATM Adaptation Layer (AAL)
Class A1
Class B1
Class C1
Class D
AAL-l AAL-2 AAL-S ...... .....···AAL-3/441.··::;,·,:::·· ...~
ATM Adaptation Layer
ATM Networking Layer
Physical Layer
Figure 3.2: Traffle classes and AAL types.
29
•
• AAL-2 provides the required function for variable-rate service class B. As yet
there are no defined standards in this area.
• AAL-3/4 provides service for bath class C and D. AAL 3 and 4 were combined
during the standards definition process as it was realized that the same process
could perform both functions. This type is quite complex and regarded by sorne
as over-designed.
• AAL-5 provides functions for both class C and D too, but is significantly simpler
(it is also less functional, however).
The intemallogical structure offour AAL types are shawn in Figure 3.3: As shown,
Type 1 Typc2 Type 3/4 TypeS
t
•
SSCS sscscs cs CPCSCPCS
SAR SAR SAR SAR
ATM
sscs: Service Specifie: Convcraenc:y Sublayu
CPCS: COlDfDon Pan Covefacnc:y Sublayer
Figure 3.3: Structure of the convergence sublayer.
the convergence sublayer has been divided for the type 3/4 and 5 traffie. The two
sublayers are the service specifie convergence sublayer (SSeS) and the common part

30 3 SERVICE CLASSIFICATION AND ADAPTATION LAYER OF ATM
• of convergence sublayer (CPCS). As their name imply, SSCS is designed to support
specifie aspect of a data application, and CPCS supports generic functions common
to more than one type of data application.
Since AAL-5 is currently the most eommonly used adaptation layer in the industry
and for our interest, it ean support VBR MPEG-2 traffie (AAL-l can be used only
with CBR traffie), we will discuss it in details as follows.
AAL-S was originally designed for transporting data traffie with no real-time COD
straints over ATM. However, it has also been used for transfer multimedia data DOW
because of its simplicity and eflicieney. The CPCS of AAL-S can make the use of
variable length protocol data unit (PDUs) from 1 to 65,536 bytes. The SSCS pro
vides the flexibility of having a special sublayer for different services that need to use
AAL-5. The SSCS may also be null and in this case it does not perform any specifie
task.
3.2.1 Common Part Convergence Sublayer (epCS) of AAL-5
• The CPCS-PDU format for AAL-5 is shawn in Figure 3.4. The meanings of the fields
Payload (Max 6S 536 Bytes) Pad CPCS·UU CPI Lcngth CRC-32047 1 1 2 4
Figure 3.4: AAL-5 CPCS-PDU Header.
in the CPCS trailer are briefly described as follows:
CPCS-PDU Payload: If absence of an SSCS this will be just the data passed to
the AAL over in the service interface (the AAL service data unit, SDU). If an
SSCS is present it may perform other funetions such as blocking or re-blocking
or even transmit protocol data messages of its owo.
Pad: The CPCS pads out the data frame sa that the total length, including the
CPCS trailer, is a multiple of 48 bytes. This is 50 that the SAR does not have
to do any padding of its OWD.
• CPCS User ta User Indication (CPCS-UU): This is used ta pass information
from one CPCS to its communicating partner.

Data Length: This field is very important because it tells us how much of the
reœived data is CPCS-SDU and how much is pad. It is also a check on the loss
(or gain) of cells during transit.
•3.2 ATM Adaptation Layer (AAL) 31
•
•
Cyclic Redundancy Cheek (CRC): This field provides a validity check on the
whole cpeS-PDU.
3.2.2 Segmentation and Re-Assembly Sublayer
AU that the SAR sublayer does is to take the SAR-SDU (CpeS-PDU) and break it
up into 48-byte units. In the reverse direction it receives a stream of cells and builds
them inta a S.~R-SDU ta pass to the cpes.
3.2.3 Error Detection
For AAL-5 layer, in the case that the data unit is corrupted or lost, an indication
is sent ta the SSCS (or the service layer if the sses is null). However, according to
the current standard, AAL-5 does not do any error recovery. That is, AAL-S does
not provide enough protection against cell errors and cell lasses. This is because
that it was mainly designed for loss-sensitive data transfer applications that make
use of reliable transmission protocols to handle error correction with retransmission
mechanisms based on sorne kind of feedhack scheme.

•
•
•
4
ISSUES IN MPEG-2 OVER ATM
32

The MPEG-2 standard [Il] does not specify how a MPEG-2 video stream is to be
transported over a communication network. In order to ensure satisfactory quality,
a number of design issues have to be addressed, some of which are discussed in this
section.
•4.1 Service Class Selection 33
•
•
4.1 Service Class Selection
The 6rst problem that arises in the transport of MPEG-2 over ATlVI is the select of
the service classa To do this, a compromise must be made between two conflicting
requirements: quality-of-service guarantees and network utilization. There are several
approaches proposed at this time:
• Deterministic Constant Bit-rate (CBR) approach: In this approach, MPEG-2 is
considered CBR in the network and is treated as sucb. The constant rate has ta
be either computed in the case of a pre-existing MPEG stream or estimated in
a real-time application. Any smoothing necessary to deliver a constant bit-rate
stream must he done at the encoder via buffering.
• Variable Bit-Rate with rate renegotiation: The approach tries to maximize the
multiplexing gain by capturing the VBR nature of MPEG-2 [2, 5]. According
to this approach, the effective bandwidth of the source during a specifie interval
is used in order to allocate resources in the network. H enough resources are
not available the quality is degraded. The rate is renegotiated in the long time
run and the way the renegotiation points are selected depends on the exact .
algorithm. Source policing is required to ensure that the traffic source conforms
to the traffic contract it negotiated with the network when the connection was
established. However, this approach is not suitable for unpredictable traffic.
Also, the resource allocation and source policing add more complexity.
• Feedback-based Available Bit-Rate (ABR) best-effort service with or without
resource reservations: A number of schemes have been proposed for transport
ing video ovet a best-eff'ort service where the source adjusts its rate based on
available-rate information received !rom the network periodically. This requires
34 4 ISSUES IN MPEG-2 OVER ATM
• varying the eneoding rate at the source adaptively based on feedhaek informa
tion received from the network [6, 3, 4] .
• Unspecifie Bit-Rate (UBR) service without any guarantees: In this case the
stream is transported over the network in best effort mode with no feedhack
controls. The quality at the receiver depends on the current congestion level in
the network [12, 13, 14}.
•
Of these, the last two approaches are based on ATM best effort service, namely,
ABR and UBR which are primary designed for data traffic with bursty unpredictable
behavior. Since these best effort services will be widely available in the future and
are based on the excess bandwidth in the network with lower usage cast, they will
also support a non-negligible part of the multimedia traffic. However, in ABR, the
rate-based feedback mechanism requires one or more network round-trip times before
it reacts to congestion, since it has to wait until the network status information is
available. This limits its usage [8]. VBR is the simplest service in the sense that users
negotiate ooly theïr peak cell rates (peR) wheo setting up the coonection. Then,
they can send burst of video frames as desired at 80y time at the peak rate. If tao
Many sources send trame at the same time, the total traffic at a switch may exceed
the output capaeity causing delays, buff'er overfiows, and loss. The network ~ries ta
minimize the delay and 1055 but makes no guarantees. It is a true best effort service
and provides the least expensive service for the transport of multimedia applications.
Thus, in our quality of service control framework, we propose ta deliver MPEG-2
video applications over UBR service.
4.2 Choice of Adaptation Layer
Another important choice to transport MPEG-2 traffie over ATM is the Adaptation
Layer (AAL), The selection of a suitable adaptation layer for MPEG-2 needs to take
into aceount the specific requirements of MPEG-2 transport stream, such as jitter
removal, error detection and/or correction, end-to-end delay minimization for real-
• time applications, and support of both CBR and VBR applications. In our work, we
win choose AAL-S for the foUowing consideration:

1. AAL-5 is currently the most commonly used adaptation layer in the industry.
It is being used for encapsulating UNI 4.0 signaling messages and to carry best
effort traffic through the ATM network.
•4.3 'Iransport Stream Encapsulation 35
•
•
2. AAL-5 can support VBR MPEG-2 traffic. AAL-l can be used only with CBR
traflie, while AAL-2, which is proposed to support VBR traffic, is not suitable
for video beeause it has been recently standardized for mobile voiee communi
cations with a maximum AAL-2 PDU of 64 bytes, this is tao little for video
packet.
3. Since signaling is being done under AAL-5, ATM network interfaces will need
to support different types of adaptation layers if other AALs are used, which
makes such a choice expensive.
However, the present specified AAL-5 is inadequate for transmission of variable
bit rate video and requires extended features. For instance, due to the lack of more
sophisticated error detection functionality, the AAL-5 is unable ta know the position
of the cells 10st inside the POU and 50 no error correction can be applied (see Section
4.6). In this thesis, we propose a Service Specifie Convergence Sublayer (SSCS) in
AAL-5, which defines a robust Forward Error Correction (FEe) mechanism targeted
to MPEG-2 encoded video transmission.
4.3 Transport Stream Encapsulation
After the AAL has been chosen, the next issue is how MPEG-2 transport stream
packets are mapped ioto AAL-5 Service Data Units. Basically, 1 ta n transport .
packets can be mapped into one AAL-5 SOU. For AAL-5 with a "null" service specifie
convergence sublayer, ATM Forum requires that n = 2 must be supported for all
conformable equipment and with the following constramts:
• An AAL-5 POU shall contain two TS Packets, unless it contains the last TS
Packet of the Single Program Transport Stream.
• An AAL-5 POU shall contain ooly one MPEG-2 Transport Packet, if that
MPEG-2 transport paclœt is the last transport packet of the single program
transport stream.

36 4 ISSUES IN MPEG-2 OVER ATM
• Figure 4.1 shows the mapping of two transport stream packets in an AAL-5 POU.
,. 188 bytes• 1 1•
188 bytes.1
MPEG-2 Transport Packet 11
MPEG-2 Transport Packet J
• 0"
AAL-S CPCS-PDU payload CPCS-Trailer
1- -1- -1376 bytes 8 bytes
Figure 4.1: Mapping of MPEG-2 transport packets according ta the ATM Forum.
Wc can see that the transport packets need 376 byte, which are mapped together
with the CPCS trailer of 8 byte inta the payload of exactly 8 ATM eells. n > 2 is
also allowed, as long as the stufling byte used in SAR sublayer is minimized.
• 4.4 Factors Affecting Picture Quality
After service class and adaptation layer have been seleeted, the approaches of quality
of service control in such a frame have to be addressed. If the QoS parameters, sucb
as cellioss ratio (CLR), cell transfer delay (eTD), and cell delay variance (CTDV)
are not limited ta certain level, the end-to-end application performance will endure
quality. degradation. Controlling the QoS of sncb applications is quite demanding for
MPEG-2 video transmission in the sense that they are submitted to both error-free
and real-time transmission constraints - both CLR and CTD have ta be bounded.
Let us first take a detour to analyze the various networking factors causing pieture
quality degradation. The approaches that could he used to address these problems
will he discussed afterwards.
4.4.1 Data Losses Due ta GeIl Errars
•Along the communication path or within the network nodes, random bit errors may
occur due to e1ectrical or physical prohlems, thus damage the quality of the decoded
pictures. At the celllevel when sucb bit errors oceur in the header, the cell is either
mis-delivered when errors and address modifications are undetected, or discarded by

the physical layer of the receiver in case of uncorrectable detected errars. In both
cases the whole cell should be considered as lost and the consequences can be serious
for the MPEG decoding process. If the error oecurs in the payload type of the cell, the
damage is obviously limited to the degradation of part of the MPEG-2 packet. If this
part belongs to the MPEG-2 transport stream packet header the entire packet may be
lost and the impact on the displayed pictures can be also very serious. Fortunately,
the probability of such data lasses is normally extremely low. For instance, in high
speed networks based on optical fibers, it is not exeeeding 10-13 • Nevertheless, even
for these transient error events, new mechanisms (i.e. error detection and correction
schemes) are required at the AAL level to ensure a low video quality degradation.
•4.5 CoDgestiol1 Control and Switch Discarding Scheme 37
•
•
4.4.2 Data Losses Due to Burstiness and Excessive Delays
With regards to real-time video service, variable bit-rate transmission has several
advantages over conventional constant bit-rate mode. However, VBR transmission
mode is an important cause of data lasses due ta peaks in traffie and subsequent
switch buffers overflowing. These heavy loads are mostly due ta inadequate network
resources allocation and multiplexing proeesses. Exceeding network capacity leads
to the cell discarding by either the congested nodes or the destination terminal if
the transmission delay exceeds a threshold. In the latter case, the MPEG-2 packet
arrives too late for playback on the terminal. Both cases leads ta a loss of data in
units of the MPEG-2 transport packets. Preventive actions must then be applied ta
minimize the QoS degradation, inside the network through intelligent discarding and,
at terminal nades, through fast data recovery schemes at bath ATM and MPEG-2
transport levels.
4.5 Congestion Control and Switch Discarding Scheme
As we have shown, the second factor listed above is mainly due to congestion. AIl
networks of finite capacity encounter congestion at varions times, ATM will not be
an exception. But with video, it needs extra effort to slow done the input rate to the
network in order to control congestion, for example, the EFCI has to be sent back to
source from the network to ÎDdicate congestion, which has to be processed and thus

38 4 ISSUES IN MPEG-2 OVER ATM
• causes delay for reaction. Therefore, the best we can do is to throw some ceUs away
until the network retums to normal. However, discarding of a single cell may causes
many cells belong to the same packet useless, therefore, if we keep transmitting them,
these data would contribute to the congestion and waste the network resources.
In order to alleviate the congestion level and thus preserve the end-to-end quality
of video data, an important strategy that makes a lot of sense is to discard the whole
packet of data rather than individual cells. These strategies are called intelligent
discarding [24, 25, 27, 28}.
•
4.5.1 Priority Assignation Scheme
Prioritization is another important strategy when we apply the cell discarding scheme.
Instead of discarding cells (or packets) blindly, we can he quite selective depending on
the importance of them. This could take advantage of the CLR (Cell Loss Priority)
bit in the ATM cell header. As discussed in Section 2.5.2, encoding scheme like
MPEG-2 could be structured in such a way that two kind of cells are produced:
• Essential cells which contain basic information to enable the continued function
of the service, CLR bit could be set ta 0, indicates that the cells are of high
priority.
• Optional cells which contain information that improves the quality of service,
the CLR could be set to 1 to indicates their low priority.
When the network endure congestion, cells with CLR bit set to 1 will be considered
ta discard first, giving their buffer space to higher priority data.
4.6 Error Correction and Concealment
The question then comes up about what to do at the receiver when an expected cell
does not arrive due to errors or congestion in the network or a cell arrives with errors
in it due to the transmission media.
One simple technique for handling errors in video, involves using the information
• from the previons frame and whatever has been received oC the current frame ta
bund an approximation of the lost information. For example, we can just continue

displaying the corresponding line from the previous frame, or if ooly a single line is
lost, it is Ceasible to extrapolate the information from the Hnes on either side of the
lost one.
But, if many errors and losses happen, the performance degradation would ex
ceed the tolerable leveL In this case, necessary error recovery functions have to be
implemented in arder to ensure a low quality degradatian.
Recovering by retransmission is ruled out as the error control scheme sinee video
transmission requires a guaranteed maximum end-to-end delay. Forward error detec
tion and recovery is the best solution in this case.
•4.7 Related Work 39
•
•
4.6.1 Forward Error Correction (FEC) in AAL Layer
Forward error correction scheme could be applied ta the physical or application level,
as weIl as the AAL level. FEC scheme at the application level will work weIl, but we
can not expect high throughput by this approach. AIso, since the FEe scheme is at
application data unit level instead of packet level, latency for errar recovery will be
significantly larger than AAL-Ievel FEe scheme, when the FEC scheme in application
layer can not recaver the correct data. The FEC scheme at physical level can only
correct bit errors on the transmission medium, and thereCore can not provide ceIlloss
recovery. .When we apply an FEC scheme at the AAL level, data losses due ta both cases
explained in Section 4.4 can be recovered and we need not modify the upper layer
applications. Also, since the error recovery is performed within the packet (or slice
in video application), the error recovery latency, when the FEC can not get a correct
data, will be much smaller than that for FEC scheme at application level. Therefore,
as also discussed in [15}, an AAL-Ievel FEC scheme is necessary for the application
requiring some delay bound Cor end-to-end data transmission, like MPEG-2 .
4. 7 Related Work
Much work has been done to address the problems of transmission of MPEG-2 video
or traditional data over ATM networks. For instance, severa! protection and recovery
techniques have been proposed to minimize video quality degradation due to cell

40 4 ISSUES IN MPEG-2 OVER ATM
• 1088 [16, 17, 18, 19, 20, 21]. Layered coding with prioritization has also been designed
to take the advantage of MPEG-2 hierarchy data structure [22, 23]. Furthermore,
sorne intelligent cell dropping strategies at packet or slice level in ATM switches are
also proposed.
4.7.1 FEC-Service Specifie Convergence Sublayers
As we mentioned in Section 4.6, forward error recovery schemes with destination con
cealment is a suitable method to cope with the problem of cell 10ss and cell error in
the video network environment. Several FEe schemes have been proposed. In [21],
A. McAuley describes a modified Reed-Solomon hurst error correcting code, based
on solving simultaneous equations. With h redundant symbols per black, this scheme
can fill in up to h missing symbols, or replace e missing symbols and detect d errored
symbols: where e + d = h. In [20], the author describes a two dimensional inter
leaving FEC frame scheme. It is applied to virtual paths (VP's) of ATM networks,
which reduce coding/decoding delays and support facility sharing. However, in these
• papers, a fixed-size FEC frame is suggested, and the re-ordering of data transmission
is required ta deal with bursty cell loss. Therefore, when transferring the variable
sized packets with these methods, the end-to-end latency increases significantly due
to the transmission of unnecessary cells and due to the re-ordering of transmission
data. Moreover, these schemes can not modify the length of appended data,. which
determines the error correction capability. In ATM networks, the cellioss ratio and
cellioss pattern is different for each service class and for each quality of service class,
also, the end...to-end service quality required by the application is not always the same
during a session. As a result, in many cases, the FEe scheme with fixed length of
appended data will not be effective or will require large and unnecessary transmission
overhead. The FEe approach proposed in this thesis will address these requirements.
4.7.2 Switcb Discarding 8cbemes
•Since UBR is a true 'best effort' service, with no flow control and no 1055 guarantees,
it provides the least expensive service for the transport of packet-based applications.
However, because of its simplicity, plain UBR with inadequate buffer sizes performs
poorly in a congested network. Partial Packet Discard (PPD) or Packet TaU Discard

(PTD) has been proposed to address this problem [24]. In this scheme, if a cell
is dropped from a switch, the subsequent cells of the higher layer protocol data
unit are aIso discarded. Romanov and et al. [25] have shown that PPD improves
network performance to a certain degree, but is still not optimal. They proposed a
new mechanism called Early Packet Discard, when the switch buffer queues reach a
threshold level, entire higher level data units are preventively dropped. This approach
achieves better throughput performance but does not guarantee fairness among the
connections. Floyd and Jacobson shown that connections using short packets can
unfairly suffer using this approach [26]. To improve its fairness, selective packet
drops based on per-VC accounting have been introduced by Heinnen and Kilkki and
referenced as Fair Buffer Allocation (FBA) (27),
None of the above congestion control and QoS management schemes are focusing
on the transmission of specifie MPEG-2 video streams over ATM best-effort services.
In [28], a variant of PPD called adaptive Partial Slice Discard (A-PSD) has been
proposed to cope with this problem in video networking environment. Similarly,
an EPO-like strategy called adaptive Early Slice Discard (A-ESO) has also been
presented by the same author. Both of A-PSO and A-ESD mns at the video slice
level and the results have shown a significant reduction of corrupted slices received at
destination as weil as the decrease of the mean end-tO-end cell transfer delay. These
approaches consist of selecting the packet (i.e. slice) to be dropped with respect ta
MPEG-2 data hierarchy and congestion level.
However, neither A-ESO nor A-PSD has taken into account the FEC function
performed at the destination. Also, like PPD and EPO, they do not guarantee fairness .
among connections. As a results, we will propose enhancement to these mechanisms
to support FEC feature and improve their fairness.
•
•
4.7 Related Work 41
•
4.7.3 Priority Assignation Scbeme
As we have shawn above, ta avoid congestion worsening and higher transit delay,
severa! switch discarding approaches are proposed ta drop lower priority celis rather
than delay them and give their buffer space to higher priority cells. These techniques
rely on ATM prioritization capability. Sorne data prioritization schemes have been
proposed at two difl'erent levels: cell-Ievel and connection..level.

42 4 ISSUES IN MPEG-2 OVER ATM
• The first method consists of discriminating between cells within a single channel.
The cellioss priority (CLP) bit in ATM headen is used to provide a twO-level cell
priority mechanism. One such approach is proposed in [29], where a MPEG-2 video
stream is partitioned using frequency domain transfonn and subsequently transmitted
over a single .I\TM virtual channel. The data partition scheme is implemented at
MPEG-2 block and macroblock 1ayers, it sets the priority level of cells belonging to
following frames to different values [8](I-frame cells to he high and B-frame to be low).
These approaches use the only CLP and are Dot able to efficiently capture MPEG-2
data structure complexity.
In [30], a connection-level prioritization approach is evaluated for the transmission
of a layered ~IPEG-2 video sequences. The authors proposed a frequency-domain
static data partitioning scheme using two virtual connections (VCs) associated with
different service classes. By means of a load balancing factor (LBF), the video data
are split and conveyed by two different connections. The VCs are associated with
a guaranteed service class (e.g. VBR-rt) and a best effort service class (e.g. ABR)
• ta respectively carry the base layer and the enhancement layer. The main drawback
of these techniques is the added complexity at the encoders and the special devices
required at the destination ta recover and synchronize the original video stream.
•

•
•
•
5VIDEO QUALITY OF SERVICE CONTROL FRAMEWORK
43

44 5 VIDEO QUALITY OF SERVICE CONTROL FRAMEWORK
• In this chapter, we propose the video-oriented quality of service control framework
for the delivery of MPEG-2 traffic over USR service. To address issues presented in
Chapter 4, this framework consists of the following components:
• A priority assignment scheme to discriminate ATM cells by their importance.
(Section 5.1)
• A packet encapsulation strategy to map MPEG-2 transport stream packets into
AAL-S SDU and then into ATM cells. (Section 5.2)
• A Corward error correction mechanism, which is implemented at the AAL-S
service specifie convergence sublayer (SSCS) ta provide the error detection and
recovery capability. (Section 5.3)
•
•
• A cell discarding scheme termed selective and adaptive Partial Slice Discarding
(SA-PSD), which is designed for taking into account both hierarchical MPEG-2
data structure and SSCS error detecting and correcting capability. (Section 5.4)
5.1 Dynamic Extended Priority Assignation Scheme (Dex
PAS)
As we know, trans~ission of compressed video over ATM networks requires efficient
data priority partition techniques. In association with intelligent cell discard schemes,
these techniques aim ta minimize loss probability of critical information in the sit
uation of congestion. Since the ATM cell header only contains one bit (CLR) to
discriminate between video data, they are not able to efficiently capture MPEG
2 data structure complexity. To better cope with the hierarchical MPEG-2 video
transmission requirements, we propose a new video data formatting and prioriti
zation scheme, named Dynamic Extended Priority Assignation Scheme (Dex-PAS).
The mechanism is sufliciently generic to he performed at any MPEG-2 data layer
(e.g. frame, slice, macroblock, or block). In this thesis, the data partition is made
at the slice layer and the priority assignation is performed at the frame level. In [28J
a new cell header field, located in the ATM cell header, is defined and referenced as
Extended CLP (Ex-CLP). This field comprises the classical CLP bit and the adjacent

PTI ATM-user-t~ATM-userbit (AUU). Used individuallythese two single bits define
only three distinctive cells: high priority cell, low priority cell, and end of message
(EOM) cell. Their gathering permits a better utilization of the ceU header with the
definition of up to four available ceU types within a single channel. In Dex-PAS,
we uses Ex-CLP field to dynamically assign cell priorities according to the current
MPEG-2 frame type (e.g. (I)ntra (P)redictive or (B)i-directional predictive) and the
reception of backward congestion signais of the network.
Table 5.1 presents the mapping of MPEG-2 data frames into the Ex-CLP field.
•5.1 DYDamic ExtetJded Priority Assignation Scheme (Dex-PAS) 45
•
•
Cell Type CLP PTI-AUU Priority
I/P-frame 0 0 High
P/B-frame 0 1 Low
End of Control Block 1 0 Very High
End ofSlîce 1 1 Very High
Table 5.1: New Ex-CLP Field Mapping
Cells belonging to I-frame have a high priority and their Ex-CLP ftag is set to
'00'. B-frame cells bave the lowest priority and the associated ceUs have an Ex-CLP
value of '01'. As to P-frame ceUs, they are altematively assigned a high or a low
priority depending on the network load. At the beginning of the transmission, P-cells
are initialized with a high priority. When the buffer queue length (QL) exceeds
an upper threshold, an early congestion is detected and the ATM switch sends a
Ceedback signal to the source, which, in tum, adjust P-cells priority level to low. .
When QL decreases belowa lower threshold, P-cells priority are switched back to a
high priority. In our implementation we use forward resource management (RM) cells
with congestion indication (CI) flag marked to notify the destination and afterward
the source about the network status. The 'lot value is used to allow the design
of a tw~level video--oriented cell discard scheme located at every switch along the
connection path. The cell having its Ex-CLP field set to '10', is referenced as 'End
of Control Block' (EOB) and delimits a group of video cells onder FEe control (see
Section 5.3). Sînce the PTI AUU bit is employed to indicate whether it is the last
ceU of an upper message (e.g. Tep packet), we propose to define a similar flag to

46 5 VIDEO QUALITY OF SERVICE CONTROL FRAMEWORK
Frame Hcader
• distinguish between successive video sUces. The cell having its Ex·CLP 8ag set to
'11' is termed End of Slice (EOS) eell. 80th EOB and EOS eell will be treated as
very high priority.
5.2 Slice-Based MPEG-2 TB Packets Encapsulation Strat-
egy
As illustrated in Chapter 2, uncompressed video frames (presentation units) are in-
. dividuallyencoded according to the MPEG standard and are referenced as access
units. The stream produced by these access units is then named the elementary
stream. the ne.xt step is packetization, the resulting stream is called Packetized EI
ementary Stream (PES). According to the MPEG standard [Il], there is no specifie
requirements for encapsulating encoded video data in a PESo This means that an en
coded frame (e.g. access unit) may start at any point within a PES packet, and more
than one encoded frame May be presented in one PES packet. The way this packeti-
• zation is done can significantly affect the performance of the decoding process and the
quality of the service provided by the network. In this thesis, we propose that each
PES is built from a single encoded video slice (see Figure 5.1). The consideration is
Frame Lcvel
1.... Acc_css_un_ll 1Etc:mcnrarySIream
Slice Header
Figure 5.1: SUc~based PES encapsulation using variable length paclœt.
• that slice is the main coding processing and the smallest autonomous unit in MPEG
2, coding and decoding of blocks and macroblocks are Ceasible only when ail the data

ofa sUce is available [8). At the next step, we propose to segment the PES packet into
a number of fixed length Transport Stream (TS) packets. In respect to the MPEG-2
system multiplex standard [11], every TS packet embeds data from only one PES
Packet. The last transport packet may not be completely full since it is unlikely that
a variable PES packet will fit exactly into an integer number of transport packets.
Thus, stuffing bytes are placed in the adaptation field to complete the payload. Us
ing this encapsulation strategy, the decoder can easily determine the start and end
of the sUce. Similarly, network transport and control polides can take advantage
of this structure to offer a guaranteed packet-oriented service. For example, we can
implement sorne intelligent discarding algorithm at switch to decrease the frame error
ratio, like PPD and EPD (see Section 4.7.2), since the start (or end) of a frame could
be easily found in this case.
•5.3 AAL-5 Service Specifie Convergence Sublayer witb FEe Support 47
•
•
5.3 AAL-5 Service Specifie Convergence Sublayer with FEe
Support
5.3.1 Requirement of SSGS with FEe support
As described in Chapter 4, classical AAL-5 only provides error detection by means
of CPCS packet lcngth integrity and CRC-32 checks, and is not able to locate which
cell was dropped or which cell includes bit errors. Therefore, the task of the proposed
video service specifie convergence sublayer is to implement a robust FEC mechanism
targeted to hierarchical MPEG-2 encoded video transmission. Requirements of sucb
a FEC-SSCS are described in [31, 32} and may he summarized in the following :
1. Compatibility with the specification of the existing AAL-5, e.g. compatibility
with the current CPCS/SAR layers;
2. No modifications are required for the upper layer (e.g. MPEG-2 Transport
Stream or Program Stream);
3. Support of variable size data (e.g. slice or frame);
4. The amount oC [edundant data should be minimized;
48 5 VIDEO QUALITY OF SERVICE CONTROL FRAMEWORK
• 5. Similarly to the ATM Forum's video on demand over ATM specification [33],
byte padding should he avoided;
6. It would he interesting ta adjust and negotiate FEC-SSCS parameters at the
connection setup phase as weIl as during the session;
7. FEC-SSCS shauld be able ta ùetect erl'ors, localize them and finally correct
them;
8. In arder to avoid increase of latency, SSCS service data unit should he trans
ferred in pipelining at the sender side. This way, no buffering is required and
the processing cast is minimized,
•
•
9. At the peer destination, if no errors are detected, the packet should he forwarded
to the upper layer with no extra delay. The processing speed at the receiver
entity should be as fast as with classical AAL-5;
10. In order to recaver a corrupted packet, huffering af previous packets should be
avoided;
Il. In order to avoid errors propagation, slice houndaries have ta be respected
during cell filling;
12. A similar requirement shauld be applied ta the frame boundaries.
The proposed FEC-SSCS protocol satisfies all the above requirements. It is based
on Reed-Solomon and Parity Codes [34, 35J. In comparison ta those based on only
Reed-Solomon codes with byte interleaving, this approach permits the use of flexible
matrix structures and a correction granularity at the basis of byte and cell (see Page
52 for further explanation). Moreovert it better takes into account the fixed struc
tures of MPEG-2 TS packet and ATM cell to avoid bit padding at the lower AAL-5
CPCS sublayer. It can also be used selectively to protect separately audio, video and
syntactic data (e.g. headers) and thus minimize data control overheads.

5.3.2 Behavior of Bender and Receiver Entities
Sender Side Behavior
First, the TS packets are passed to the SSCS sublayer by the MPEG-2 system layer
using message mode service with blocking/non-blocking internaI function, as illus
trated in Figure 5.2. The following primitive is used: AAL_UNITDATA-request(ID,
•5.3 AAL-5 Service Specilic Convergence Sublayer with FEe Support 49
Application Layer
MPEG-2 PES Laycr
Comprcsscd Video Slice
6iit_cs_. PES Packct
4 bytes
MPEG-2 TS uycrlr---Ts-p-ac-k-ct-l 1 1 1 _4··············· .. ··· .. ·..
188 bytes
8 byte!----C-o-m-m-o-n-Pan-C-o-ny-c-rg-cn-ce-S-u-b--Ia-y-cr-P-D-U---... .• AAL TypeS
AV-SSCS
CPCS
2 bytes.r------Sc-rv-ic-c-S-pe-c-m-c-C-on-y-er-gc-n-cc-S-u-b--Ia-ye-r-P-OU---.
.. ..576 bytes
SAR
S bytes
ATMLaycr B EJ EJS3 bytes
B
•
4···············································..·.. ··· _Exactly 12 cells (no padding)
Figure 5.2: AAL-5 multi-level FEC-SSCS using grouping mode 1.
M, SLP, CI). The tlnterface Data' (ID) parameter specifies the exchange MPEG-2 TS
packet. The tMore' (M) parameter indicates if it is the last AAL SOU of the upper
message (e.y. end of the eurrent video sUce). The 'Submitted Loss Priority' (SLP)
parameter gives the priority level of the TS packet and is initialized in respect to the
'PICTURE-CODING-TYPE' field Iocated in the MPEG-2 frame header [Il} , this
field specifies the used coding mode (e.g. Intra, Predictive or Bi-direetional predic·
tive) for each frame. This parameter also indicates how the 'SLP' parameter of the
ATM-DATA-request primitive shall be set for cell header initializatioD. As described
in Section 5.1, we propose to extend its range from two to (our possible values ta
50 5 VIDEO QUALITY OF SERVICE CONTROL FRAMEWORK
• allow identification of MPEG-2 frame types and system information. Finally, the
last parameter 'Congestion Indication' (CI) indicates how the 'CI' parameter of the
ATM-DATA-request primitive shaH be set to notify a congestion state ta the network
nodes and destination.
•
•
Four grouping modes are defined at the SSCS sublayer, which ensure an integer
number of 48-byte cell payloads at the SAR layer and thus avoid byte stuffing. These
modes consist to group a number 'N'of MPEG-2 TS packets ta build a SSCS-SDU.
The parameter, 'N' May have the following values: 3, 15, 27 and 39. After ap
pending the CPCS-trailer information, we, respectively, obtain exactly 12, 59, 106
and 153x 48-byte ATM cell payloads. For every connection, the grouping mode is
negotiated between the source and destination at connection establishment phase ac
cording to the requested quality of service. During communication, this mode can
he dynamically adjusted in respect to the on-line measures of the end-to-end QoS
parameters.
A two-byte header and a two-byte trailer information are appended to every SSCS
SDU. The header is composed of a 4-bit Sequence Number (SN), a 4-hit Sequence
Number Protection (SNP), a 4-bit Payload Type (PT), and a 4-bit Control Black
Length (CBL). The trailer is composed of a 2-byte FEC field applied on1y to the pay
load. The FEC scheme uses a Reed-Solomon (RS) code, which enables the correction
of up to 4 erroneous bytes in each block of 564 bytes (i.e. 188x3, sinee for group mode
1, each SSCS-PDU contains 3 TS packets). It is only used for recovering of cell errors
due to electrical or physical problems along the communication path. The addition
of a sequence number (SN) of 4 bits enables the reeeiver entity ta detect and locate
up ta 15 consecutive SSCS POU losses. When lasses are detected, dummy bytes are
inserted in order to preserve the bit connt integrity at the receiver. The SNP cantains
a 3-bit CRC generated using the generator polynomial g(x) = x3 + x + 1, and the
resulting 7-bit codeword is protected by an even parity check bit. The SNP field is
then capable of correcting single bit errors and detecting multiple bit errors. The PT
field specifies the type of embedded information for discrimination purpose (I-frame,
P-frame, B-Crame, Audio, Data, Headers, FEC information, etc. ).
Now, let us define a Control Block (CB) as a two dimensional matrix of P ceUs

column x M rows ioto which consecutive fixed length SSCS PDUs are written row
by row (see Figure 5.3). The corresponding CPCS trailer is then appended. A single•5.3 AA.lr-5 Service Specilic Convergence Sublayer with FEe Support 51
P(œl1 paylOlds)
M
tiCSTl'Iilcr
CPCS2
3
4
•
•
--_. Writina and Re4dina Order • Erreonous or LoSI Cell
• Correction (RS and XOR Codes) • FEe In(onnation
'. LocaIislUion (PuriIY ond Sequence Number Checks)
Figure 5.3: Control black structure used in FEe scheme
redundancy row is appended at the tail of the matrix which is obtained by XORing
the columns at the cell basis. A single cellioss per black can be recovered or up to
an entire SSCS POU. The number of row 'M' is referenced as Control Block Length
(eBL) which determine the ratio of data and redundancy. It is negotiated at the caU
set up with reference to the protection level desired by the connection. Lower is its
value and higher is the recovery power of the FEC-SSCS mechanism. The drawback
is a proportional increase of the control information overhead with M decreases. Since
the FEe information are obtained using XORing method, the data matrix is only an
abstract structure and no buffering is required at the sender. The destination checking
process is also pipelined and the correct SSCS POUs are immediately transmitted to
the upper layer with no latency. The virtual matrix is read row by row and the
traiter is created by calculating the Reed-Solomn check bytes tirst. The parameters,
Payload Type (PT), the Control Block Length (CBL) and the Sequence Number
(SN) are subsequently set. Finally the Sequence Number Protection (SNP) fields is
calculated and appended to the black.

Receiver Side Behavior
Since we are dealing with variable length encoded video slices, it is unlikely ta
have an exact Bumber of SSCS SDUs ta fill up the last virtual matrix of every slice.
Therefore, we propose ta indicate in the SSCS header, the length of the Control
Black (CBL) that they belong to. This approach allow an easier and more reliable
delimitation of the end of the block as well as a better protection of slices from error
propagation.
The SSCS-POU are then transmitted to the common part convergence sublayer
(CpeS) using the CPCS-UNIDATA-Invoke primitive. The 8-byte CPCS trailer infor
mation is appended ta the CPCS SDU and no byte padding is required. The resulting
cpes POU is passed to the segmentation and reassembly (SAR) layer using the SAR
UNIDATA-Invoke primitive. The underlying SAR protocol will subsequently segment
the CS-POU into exactly twelve (12) 48-byte ATM SOU. The ATM layer will then
marked the CLP field of every cell using the 'AUU' and the 'SLP' parameters of the
AAL-UNIDATA-Request [36] .
At destination, three tasks have ta be performed by the FEe sses receiver entity :
(1) detect errar or loss in the incoming stream, (2) localize the missing cells or the
position of the erroneous bytes, and finally (3) recover the initial data.
The detection of erroneous SSCS POUs is assured by both SSCS and cpes pro
tocols.··CPCS layer is able ta identify received corrupted AAL POUs by CRC-32 and
missing cells by length mismatch. Rather than discarding a corrupted packet, we
propose ta forward it ta the upper layer SSCS together with an error indication (e.g.
Reception Status (RS) parameter of the CPCS_UNIDATA-signal primitive). Un
fortunately, in the extreme situation of missing entire POUs, the previous checking
mechanisms are not capable of detecting the problem. Therefore, the introduction
of a sequence number (SN) at the SSCS layer will permit the detection of up ta 15
consecutive packet losses.
The association of the reported indication and the parity FEC XOR check se
quence allows the FEC-SSCS layer ta locate the erroneous bytes by determining
simultaneously the Une and the column numbers in matrix (control block), as shawn
in Figure 5.3. This way, up ta 4 erroreous bytes in each block could be detected and
•
•
•
52 5 VIDEO QUALITY OF SERVICE CONTROL FRAMEWORK

corrected. Moreover, taking benefit of the fixed length of bath MPEG-2 TS packet
and ATM cell, the SSCS layer is capable to easily locate the missing celle As a result,
this approach achieves a correction granularity at the basis of both byte and celle
After localization, bath errors and losses can be corrected by respectively using
Reed-Solomon and XORed FEC check codes. If no error is detected, the SSCS PDUs
are immediately passed to the upper layer aCter sequence numbering check and trailer
removing. When ooly the last SSCS-PDU (redundancy part) is erroneous, no action
is performed.
•5.4 Selective and Adaptive Partial Slice Discard Scheme (SA-P8D) 53
•
•
5.4 Selective and Adaptive Partial Slice Discard Scheme
(SA-PSD)
5.4.1 The Algorithm Introduction
One of the simplest switch buffer scheduling algorithm is to serve cells in first-in
first-out (FIFO) order, if buffer congestion occurs, the incoming cells are dropped
regardless to their importance. This random discard (RD) strategy is not suitable
for video transmission. A modification is to take into consideration the cell's priority
when discarding, e.g. a cell with low priority is dropped first, then, if the congestion
persists, this approach gradually begins to drop the high priority cells. This is called
Selective Cell Discard (SCO) [28}. However, as described in Chapter 4, the useless
ceIls, in our case, the tail of corrupted slice may still be transmitted and congest
upstream switches. In [28], a scheme called Adaptive Partial Slice Oiscard (A-PSO) _
has been proposed to cape with this problem, which consists of selecting the packet
(i.e. slice) to be dropped with respect to MPEG-2 data hierarchy and congestion level
(e.g. switch queue length).
We propose sorne enhancernent ta the A-PSD to support forward error correction
feature. The new scheme, named Selective and Adaptive Partial Slice Discard (SA
PSD), is performed at bath control group and video slice levels. Our approach is to
reduce the number of corrupted slices by assuming that a number of ceUs per control
block can be recovered by the destination SSCS sublayer using FEe techniques. Let
us define this specifie number as the drop tolerance (DT) which corresponds ta the

54 5 VIDEO QUALITY OF SERVICE CONTROL FRAMEWORK
• maximum number oC cells per control block that may be discarded by SA-PSD beCore
considering the control black as definitively corrupted. DT is usually set ta the
number of cells per row in the control black. Therefore, unlikely ta simple A-PSD,
SA-PSD stops discard as saon as the congestion decreases and only if the number
of previously dropped cells in every control black is below DT, the drop tolerance.
Using this approach, the proposed scheme acts at a finer data granu1arity and better
preserves entire slices from elimination. The ftexibility proposed by our mechanism
can not be achieved without the use of Dex-PAS which allows the detection of bath
slice and control black boundaries at the cellievel. The proposed SA-PSD algorithm
is highlighted in the following.
5.4.2 8A-P8D Parameters
•SA-PSO scheme runs per-VC and employs four state variables and one counter vari
able ta control each video connection. Two of them are associated with the slice level
and the remaining ones with the control black level.
1. S...PRIORITY indicates the priority level of the current slice. The indicator is
modified at the reception of the first cell of this slice in respect to its priority
field (the two Ex-CLP bits). This indicate that the switch is currently handling
a high (S-PRIORITY=O), or a low (S-PRIORITY=l) priority slice.
2. S..DISCARDING indicates whether the switch is currently discarding (S..DISC
ARDING=l) this slice (e.g. the tail) or not (S-DISCARDING=O). Only the last
cell of a slice (EOS) can change this indicator from discarding ta not discarding.
Other cells will only change the flag Crom not discarding to discarding.
3. CB..DROPPED is a counter which indicates for the current control black the
number of cells discarded by the switch. It is initialized to zero at the reception
of a new control black. This is needed so that we can check if a control block
(thus, a slice) is still recoverable or not.
4. CB-DISCARDING indicates whether the switch is currently discarding (CB-DIS-
• CARDING=l) this control block or not (CB.DISCARDING-O). Unlikely to
the slice level control, the indicator changes from discardiDg to Dot discarding

in two situations: the CB-DROPPED counter reaches the drop tolerance 'DT',
or else a new black is received. Other events (e.g. ceU arrivaIs) will ooly change
the flag from not discarding to discarding.
•5.4 Selective and Adaptive Partial Slice Discard Scheme (SA-PSD) 55
•
5. CB..EFCI.MARKING indicates whether the switch is tagging (CB..EFCI.MARK
ING=l) or not tagging (CB..EFCI.MARKING=O) the EFCI bit of the cell for
the CUITent control black. Ooly the last cell of a block (EOB) cao change
this indicator from marking ta not marking. Besides, only one event may pro
voke the modification of the state from not marking ta marking: the arrivai
of a cell whereas CB..DISCARDING indicator is in 'no discarding' state and
CB..DROPPED equals the tolerance DT.
The use of bath CB..DISCARDING and CB..EFCLMARKING indicators allow us
to manage more efficient1y lasses occurring at subsequent switches and belonging ta
a control black. Indeed, when a black is partially discarded by a switch node, the
following switches are not capable to take into accouot these celliosses ta update the
assaciated drop tolerance. The consequence is that the switches handie erroneous cell
drop tolerance with adverse effect on algorithm performance. At the control black
level, the drop tolerance DT can be seen as a 10ss credit shared by the crossed switches.
Ta make implementation easy, we propose ta entirely consume the 10ss credit as 500n
as a celll05s occuITed. CB..DISCARDING is used ta ensure that, for every control
black, lasses are concentrated in a single switch. If cells from a black tail arrive in a
congested node, the use of EFCI bit allows the detection of non recoverable blacks
since whole the drop credit have been used by a previous switcb. In this situation, we
propose to commit ta the slice level control by entirely dropping the remaining slice.
5.4.3 SA-PSD Operation Modes
SA-PSO uses three buffer thresholds (Figure 5.4): Low_Threshold (LT) , MediuID_Thre-
O~---------~88-----IB3-------B8---00tO~"'~"
LT MT KT Qmax•{Ml} {M2} (M2. 1M3)
Fipre 5.4: Oder thresholds

56 5 VIDEO QUALITY OF SERVICE CONTROL FRAMEWORK
e shold (MT) and High_Threshold (HT). The utilization of three thresholds instead of
two reduces the speed of oscillation for the transmission of Dex-PAS RM cells and
have shown better performance.
These thresholds define three operation modes :
1. Mode 1: If the buffer queue length (QL) is lower than Low_Threshold, for every
connections, the cells arc acccptcd and may have EFCr marked ifCB-EFCLJ.\IAR
KING is activated.
•
e.
2. Mode 2 : If the total number of celis in the buffer exceeds Low_Threshold but is
still below High_Threshold, for every video connection currently emitting a low
priority slice, SA-PSD starts ta discard their incoming cells in respect ta the
drop tolerance associated with each connection. We propose ta fairly distribute
the elimination among the targeted connections using round robin service (i.e.
each connections using this congested switch would, in turn, have a chance ta get
its cells dropped). If the light congestion is subsisting, the algorithm commutes
ta the slice level and starts ta eliminate the incoming low priority cells until
the reception of an EOS cell. Again, this commutation is done in a round robin
manner ta guarantee the fairness among connections. The last cells of a control
block and slice (EOB and EOS) are always preserved from elimination since
they provides indication of the next control block or slice. The cells with higher
priority are accepted in the buffer. This mode stops when queue length falls
down ta Low_Threshold.
3. Mode 3 : This mode is activated when queue length exceeds High_threshold.
Ineoming slices are eligible for discarding regardless ta their priority level. This
mode behaves like Mode 2 for intelligently spreading the losses over connections
with respect to their drop tolerance. It stops when queue length falls below
High_Threshold. As in mode 2, EOB and EOS are preserved ta avoid the error
propagation. This is feasible, sinee usually 10% of switch buffer has been set
aside ta accommodate the system control and management messages and other
important cells.
The Medium_Threshold is used ta control P-cell priority assignment: IIPB cells

are transmitted to aIl the video sources when MT is exceeded, upon receiving these
cells, the source start to set P-cells to he low priority. When queue length drops below
Low_Tbreshold IP/B RM cells are send and at the reception of feedhack signais, P
cells are switched back to high priority immediately. Consequently, some P-frames
may transmit cells with different priority.
Using this adaptive strategyt B-slices are 6rstly dropped ta quickly reduce huffer
occupancy during light congestion, while P and I-slices are preserved from elimination.
If the congestion persists, B and P-slices are both candidate to elimination, this
situation is Collowed by gradually including I-frame cells if congestion worsens.
•
•
•
5.4 Selective and Adaptive Partial SUce Discard Scheme (SA-PSD) 57

•
•
•
6
EXPERIMENT AND RESULT
58
•6.1 Simulation Environment
6.1 Simulation EnviIonment
59
•
•
Ta evaluate the end-to-end behavior of MPEG-2 traffic over ATM network using the
proposed video quality of service control framework, we implemented these schemes in
an ATM simulator and performed simulation experiments. In this section, we discuss
the experiment environment. We start with an presentation of the NIST simulator
we used as our software tao!. Then, alter a brie! description of the network topology
used in the simulations, we proceed to discuss the MPEG-2 trace files. Parameters we
used as network configuration and performance measurement are discussed in Section
6.4.
6.1.1 The NIST ATM Simulator
The Nationallnstitute of Science and Technology (NIST) developed an ATM simu
lator in mid-1994, and provided the simulator and source code to the public. The
initial version (1.0) provided basic ATM networking capabilities. Version 2.0 was
made available in 1995 and included sorne flow control options, like EFCI and ER
ABR flow control options.
The simulator gives the user an interactive modeling environment with a graph
icaI user interface. It uses bath the C language and the X-window system running
on UNIX platform and allows the user to create different network topologies, set the
parameters of component operation and save/load the different simulated configura
tions.
The network to be simulated coosists of several components sending message to .
one another. The components available include ATM switches, Broadband Terminal
Equipment (BTE), and ATM applications. Switches and BTE components are in
terconnected with physicallinks, which is also considered a component. The ATM
applications may be cODsidered as traffic generators that are capable of emulating
variable or constant bit rate traffic sources. They are connected ta each other over a
route that uses a selected Hst of adjacent components to form an end-to-end virtual
connection.
Every component, sueb as switch, BTE, and link can be configured as to what
type of data should be logged during a simulation. These data can be link utilization,

60 6 EXPERIMENT AND RESULT
• buffer usage, cellioss ratio, cell transfer delay, cells received/transmitted, etc. The
simulations can then be executed and the data analyzed.
6.1.2 Network Madel
The network topology used is shown in Figure 6.1. It consists of two ATM switches,
•Figure 6.1: Network topology used in the simulation
ten MPEG-2 application sources and ten receivers, each is connected to a BTE.
MEPG-2 trace file is read by the sources and then sent through the two switches ta the
destinations. The backbone link (LINK-B) between these two switches (SWITCH...1
and SWITCH-2) is shared by ail connections, with a capacity of 155Mbps (to simulate
an OC-3Iink). Our experiments were run in both LAN and WAN configurations, with
backbone links ranging nom 1 ta lOOOkm. AIl the other link distances (between the
source/destination and the switch nodes) are constant and set to O.2km. The ATM
• switches are implemented to be non-blocking, output-buffered with a finite amount
of buffering, and the switch bufl'ers size varies (rom 80000 ta 220000 cells for both
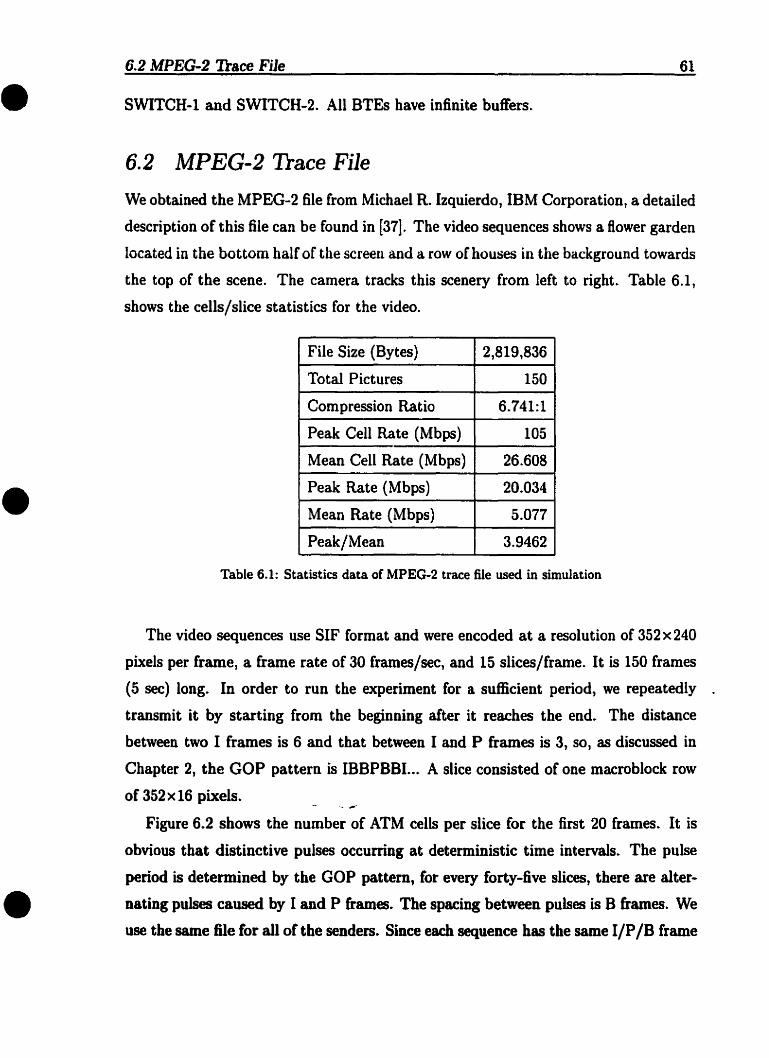
•6.2 MPEG..2 Thace File
SWiTCH..l and SWITCH-2. AIl BTEs have infinite bufFers.
6.2 MPEG-2 'frace File
61
•
•
We obtained the MPEG-2 file from Michael R. Izquierdo, IBM Corporation, a detailed
description of this file can be found in [37}. The video sequences shows a flower garden
located in the bottom hale of the screen and a row ofhouses in the background towards
the top of the scene. The camera traclcs this scenery from left ta right. Table 6.1,
shows the cells/slice statistics for the video.
File Size (Bytes) 2,819,836
Total Pictures 150
Cornpression Ratio 6.741:1
Peak Cell Rate (Mbps) 105
Mean CeU Rate (Mbps) 26.608
Peak Rate (Mbps) 20.034
Mean Rate (Mbps) 5.077
Peak/Mean 3.9462
Table 6.1: Statistics data of MPEG-2 trace file used in simulation
The video sequences use SIF format and were encoded at a resolution of 352 x 240
pixels per frame, a frame rate of 30 frames/sec, and 15 slices/frame. It is 150 frames
(5 sec) long. In order ta run the experiment for a sufficient period, we repeatedly .
transmit it by starting from the beginning aCter it reaches the end. The distance
between two 1 frames is 6 and that between 1 and P frames is 3, sa, as discussed in
Chapter 2, the GOP pattern is lliBPBBI... A sUce consisted of one macroblock row
of 352x16 pixels.
Figure 6.2 shows the number of ATM cells pel slice for the first 20 frames. It is
obvious that distinctive pulses occuning at deterministic time intervals. The pulse
period is determined by the GOP pattern, for every forty-five slices, there are alter
nating pulses caused by 1and P frames. The spacing between pulses is B frames. We
use the same file for all of the senders. Sînce each sequence has the same I/PlB frame

62
• 25
20
15
110
5
°0
6 EXPERIMENT AND RESULT
Figure 6.2: Number oC ATM cells per sUce for the tirst 20 Crames oC the MPEG-2 video sequence.
pattern, 1 frames will always overlap for the duration oC playback if the source send
video streams at the same time, which exaggerate the bursty traffie. For this reason,
• we shiCt the send time so that 1 and P frames from one sequence would overlap B
frames Crom another source, and Figure 6.3 shows the results of aCter multiplexing
the shiCted MPEG-2 traffics.
6.3 Several Assumptions
Before discussing the experimental results, let us make the Collowing assumptions.
First, as indicated in Cbapter 5, the level of congestion is monitored through the
occupancy of the switch buffers, and we assume shared output FIFO buffer is used.
Three congestion thresholds are defined, namely, Low Threshold (LT) , Middle Thresh
old (MT) and High Threshold (RT). As to the transfer delay, we have the foUowing
estimation:
• Propagation delay between the sender and the receiver varies from 0.005 msec
ta 5.0 IDSeC, if we assume the medium speed ta be 200,OOOkm/s - two thirds
• of light speed. 0.005 is equivalent to the propagation distance of about 1 km,
while 5.0 corresponds to 1000 km.
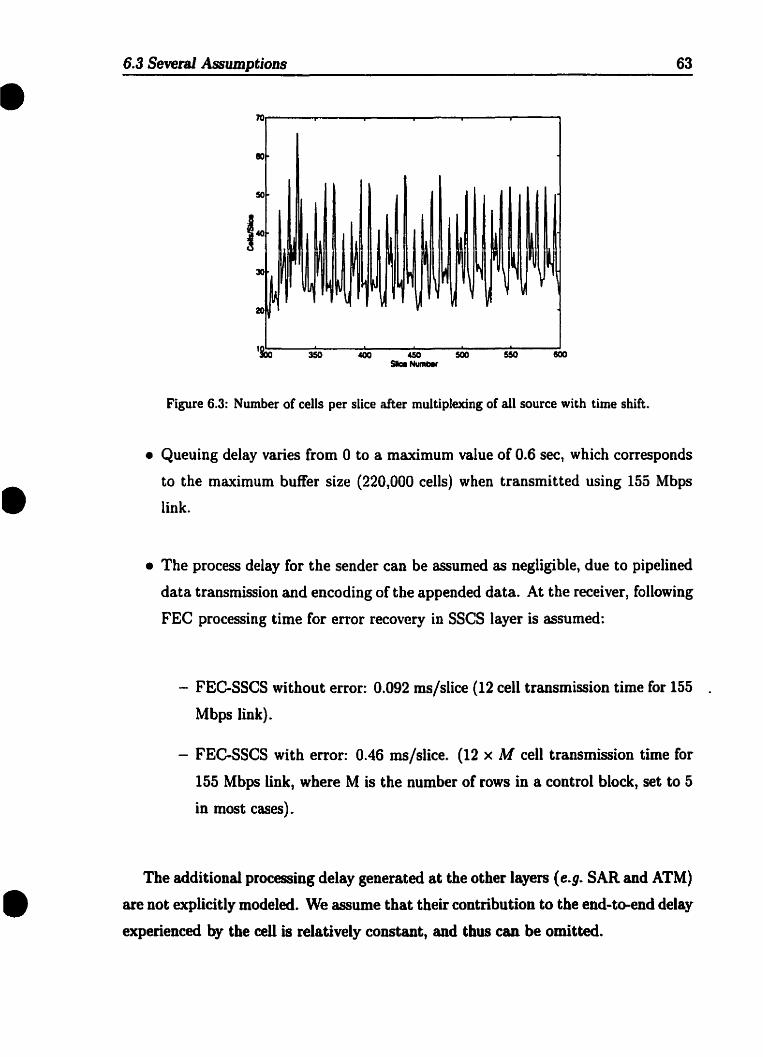
•6.3 Several Assomptions
7Or----.,....--...,.....----,.--~--r__-_..,
50
I~
~W~ l ~ l
~ "30~M
~ ~ ~ fil \ \u
V20
liDo 400 450 500SllceNumtlef
Figure 6.3: Number of cells per slice after multiplexing of ail source with time shift.
63
•
•
• Queuing delay varies from 0 to a maximum value of 0.6 seCt which corresponds
to the maximum buffer size (220tOOO cells) when transmitted using 155 Mbps
link.
• The process delay for the sender can he assumed as negligiblet due to pipelined
data transmission and encoding of the appended data. At the receiver, following
FEe processing time for error recovery in SSCS layer is assumed:
- FEC-SSCS without error: 0.092 ms/slice (12 cell transmission time for 155 .
Mbps link).
- FEC-SSCS with error: 0.46 ms/slice. (12 x M cell transmission time for
155 Mbps link, where M is the number of rows in a control block, set ta 5
in most cases).
The additional processing delay generated at the other layers (e.g. SAR and ATM)
are not explicitly modeled. We assume that their contribution to the end-to-end delay
experienced by the cell is relatively constant, and thus can be omitted.

64
• 6.4 Parameters
6 EXPERlMENT AND RESULT
•
•
We carried out our simulation with seven switch buffer configurations. For each oC
them, the sarne method is applied to determine the values oC the three thresholds,
specifically, RT, MT and LT are respectively set to 0.9, 0.8 and 0.7 fraction of the
maximum queue size (Qmax) , where Qmax is set to one of the following values:
80,000, 100,000, 120,000, 140,000. 160,000, 180,000, 200,000 and 220,000 ceUs.
Data units Definition
Lost CeU A cell dropped by discarding scheme.
Dead CellA cell received at the destination but belong-
ing ta a partially discarded slice.
A cell arriving at destination after an ended
time-out. This time-out is triggered at the
Late Cell reception of every first cell of a picture. Its
value is set to liN sec., where N is the frame
rate of the video sequence.
Correct Cell Neither a lost, dead or latc cell.
Correct SliceA sUce received with ooly correct cells or cor-
rupted but can be recovered by FEC.
Table 6.2: Data unit definitions
Table 6.2 summarizes the possible states ofa cell crossing the network and Table 6.3
defines the investigated performance parameters. Notice that Slice Loss Ratio (SLR)
is measured at the application layer and taken into account decoding (e.g. 10ss cells)
and propagation (e.g. late cells) constraints.
We compare the performance of proposed Cramework (caUed Dex-SA-PSD here
after) with the three Collowing schemes:
• Random discarding with no priority assignation scheme (No-RD)
• Selective cell discarding with extended priority assignation scheme (Ex·.SCD).
• Partial sUce discardiog with exteoded priority assignation scheme (Ex-PSD).

•6.4 Parameters 65
•
•
Performance Parameters Definition
I-frame Cell Loss Ratio (CLR-I)Number of lost and late ceUs belonging ta 1-
frame vs. the total number of cells transmitted.
P-frame Cell Loss Ratio (CLR-P)Numher of lost and late cells belonging ta P-
frame vs. the total Dumber of cells transmitted.
B-frame Cell LOBs Ratio (CLR-B)Number of lost and late cells belonging ta B-
frame vs. the total Dumber of cells transmitted.
I-frame Slice Loss Ratio (SLR-I)Number of corrupted I-frame slices vs. number
of slices transmitted.
P-frame Slice Loss Ratio (SLR-P)Number of corrupted P-frame slices vs. Dumher
of slices transmitted.
B-frame Slice Loss Ratio (SLR-B)Number of corrupted B-frame slices vs. number
of slices transmitted.
Average time between the departure of a cell
Mean Cell Transfer Delay (Mean CTD) from the source Dode (~) and its arrivai at the
destination Dode (ta): D = E:_,;k-filc -
Table 6.3: Performance Parameters Definitions

•
•
•
7DISCUSSION
66

7.1 Results at Cell-level 67
• 7.1 Results at Cell-level
'2
0
11 0 -Del.PSD0
00 0
oooaoEa-PSD
-Es-SCO1..5
• l• -. .-DelLPSD
_No..RD d00000 Ea.,PSD
--Ea..5CD
_HO-RDa
\0 100 120 140 110 110 200 22 120 140 110 '10 200 220BuIIr Sile (1blII) 8ultIf SIle (KalI)
Figure 1.1: Cell Ioss ratio (Aggregate) Figure 7.2: CeII Ioss ratio (I-frame)
1O
._- Du...SAJ"SD• 00000 Ea.,PSO 10
-- El-SCD a<)
_No_RD
15
l la .- o..-SA.PSD~ 3
III
0 ~5 - &..PSD2..5 a
~
4 - Ea..SCD
3 _ No-RD
1..5
\O-~100~~12O~-I""40----o.'I10---6'IO-~2OO----I22IMIrSlnC~
-100 120 140 110 '10 200 220
BuIIf SIle C....)
Figure 7.3: Ce1110ss ratio (P-frame) Figure 7.4: Cellioss ratio (B-frame)
•
Figure 7.1,7.2,7.3 and 7.4 show the cellioss ratio (CLR) for respectively the aggregate,
1- P- and B-frame cell flows. From Figure 7.1 we can notice that there exists slight
differences between the aggregate cellioss curves for different schemes (No-RD, Ex
sco, Ex-PSO and Dex-SA-PSD) with the No-RD having the minimum CLR. Because
in No-RD, a switch accommodate every cell unless the buffer averfiow, until then it
start ta discard cells without discrimination. As a result, it achieves the most usage
of buffer and has the (east aggregate CLR. Un1ikely, ail the other three schemes take a

68 7 DISCUSSION
• preventive strategy to drop cells before the switch buffer is full in order to protect the
important information (high priority cells) from discarding. Thust the switch buffer
utilization is not as good as N~RD. Ex-SCO bas the second least aggregate cellioss
ratio because of its discarding data at the cell-Ievel. It stops dropping as soon as the
switch buffer size decreases below Low_Threshold. On the contrary, both Ex-PSO
and Oex-SA-PSD has the possibility of stopping elimination only at the reception
of the end of slice cell (EOS), even though the congestion has already gone. They
experience higher cellioss ratio regardless of the picture types. Oex-SA-PSO behaves
better than Ex-PSO, because as discussed in Section 5.4, it has to modes of discarding
cell during congestion. First, it tries to drop cells within a control black, and back ta
normal as soon as the congestion alleviate, in this mode, the dropped data could be
recovered at the end side through FEC and the whole sUce is considered ta be correct.
If the congestion persists, it commute ta the second mode, where the whole slice is ta
he dropped. By this way, cells are preserved better than in Ex-PSD, which has one
discarding mode. In addition, we applied a round-robin strategy to fairly distribute
• the 1058 among the connections, when the switch becomes congested t it tries ta discard
cells one virtual connections after the other, while in Ex-PSO, all connections discard
cells in the case of congestion. The cellioss ratio decreases by 15.4%, 17.6%, 21.6%
and 34.8% (Ex-SCO, Ex-PSO, Dex-SA-PSO and No-RO respectively) while the buffer
size increases from 80,000 ta 220,000 cells.
As illustrated in Figure 7.2, 7.3 and 7.4, aIl of the three preventive schemes, namely,
Ex-SCO, Ex-PSO, and Oex-SA-PSO concentrate the loss within the B-frame and
protect the reference 1- and P- frames. Ta the extreme, Ex-SCO and Ex-PSO have
no CLR-I at all, Dex-SA-PSD has non-zero CLR-I but much better than that of No
RD. Again, the round-robin manner we applied ta ensure faimess in Dex-SA-PSO
plays a raie in here, since only one connection is subject to discarding at one time,
the reaction of discarding B-frame to protect I-frame is not as promptlyas the Ex
SCO and Ex-PSD. Indeed, when an I-frame is transmitted in Dex-SA-PSO, the bufl'er
queue length rapidly increases ta accommodate the burst traffic. The queue length
• exceeds the high threshold more often. Because switch indiscriminately discard cells
when HT is exceeded. this scheme endures more I-frame cellioss compared with the

Ex-SCO and Ex-PSD. No--RD bas the highest I-cellioss ratio because it drops cells
blindly all the time.
As to the CLR-P, No--RD again suffers the most 10ss, because no protection is
applied at a11. Ex-SCD has the minimum value for the same reason as in I-cell CLR,
i.e. it protects high priority cells at the cellievel, which stops dropping as soon as
congestion decreases.
As illustrated, B-frame cells are of the most concemed by 10ss and contribute
largely to the overallioss ratio in Ex-SCD, Ex-PSD, and Oex-SA-PSD. Afterwards,
poo and I-frame cells are, in this order, the most subject to loss. This is eaused by the
drop policy of these three preventive schemes, as well as the frequency of B-frames in
video sequences. Indeed, in our MPEG-2 video samples, the proportion of l, P and
B data are respectively of 53%, 24% and 23% of the aggregate stream. Due to the
GOP pattern and the multiplexing process, B-frames oceur more often and are more
likely to be discarded, e.g. 16 B-frame occurrences per second, while only 2 and 6 for
1 and P- frames.
•
•
7.1 Results at CeH-level
_.Ou.PSO
ooooo&..,PSD
..... &..,sco
_No~D
c..
e..e..
::..e.
;
100 120 140 UIO 110 200 220...., Slza (KcIIII)
69
•Figure 1.S: Mean cell transfer delay
From Figure 7.5, we can see, the mean-ce11 transfer delay (CTD) increases on
arder of magnitude of the buffer size. Without surprise, N<rRD has the largest mean
CTOt since it accommodates every cell in its switch buffer until overflow OCCUISt
thus endure the largest queue delay. Also, we may notice that Dex-SA-PSD has

70 7 DISCUSSION
• longer mean-CTO than the other two schemes. This is mainly due to its overhead
introduced by FEC-SSCS sublayer. Indeed, the data ftow in Oex-SA-PSO contains
a certain amount of redundancy used for the forward error recovery, therefore. it
consumes more bandwidth and results larger switch occupancy. This can be further
shown by Figure 7.6,7.7,7.8 and 7.9, which show the buffer occupancy status of each
schemes. Ex-SCO and Ex-PSO start to drop B-frame ceUs when light congestion
happens and thus has the least buffer occupancy and minimize the transrer delay of
the high priority ceUs. Oex-SA-PSO behaves similar but bas larger average queue
length because of the redundant data it introduced.
-JalIlID
-lGlIlID
--• lOllOO
....
... .. ..... 1-' .....
A A A j
ICIlIlID
J 1 j ....1--... ~,
A j A A
Figure 7.6: Buffer occupancy in No-RD Figure 7.7: Buff'er occupancy in Ex-Sen
.........
--lam
,..U.• -1 .... •...... -
A j A j
....,... -~ '-' """"
r-'I
~ ~ ~ .. A ~ ~
Figure 7.8: Buff'er occupancy in Ex-PSD Figure 7.9: Buff'er occupancy in Oex-SA-PSO
• The difference of mean-CTDs between these four schemes ÎDcreases with buffer
size goes up. This could be explained by the ract that the preventive B-&ame cells
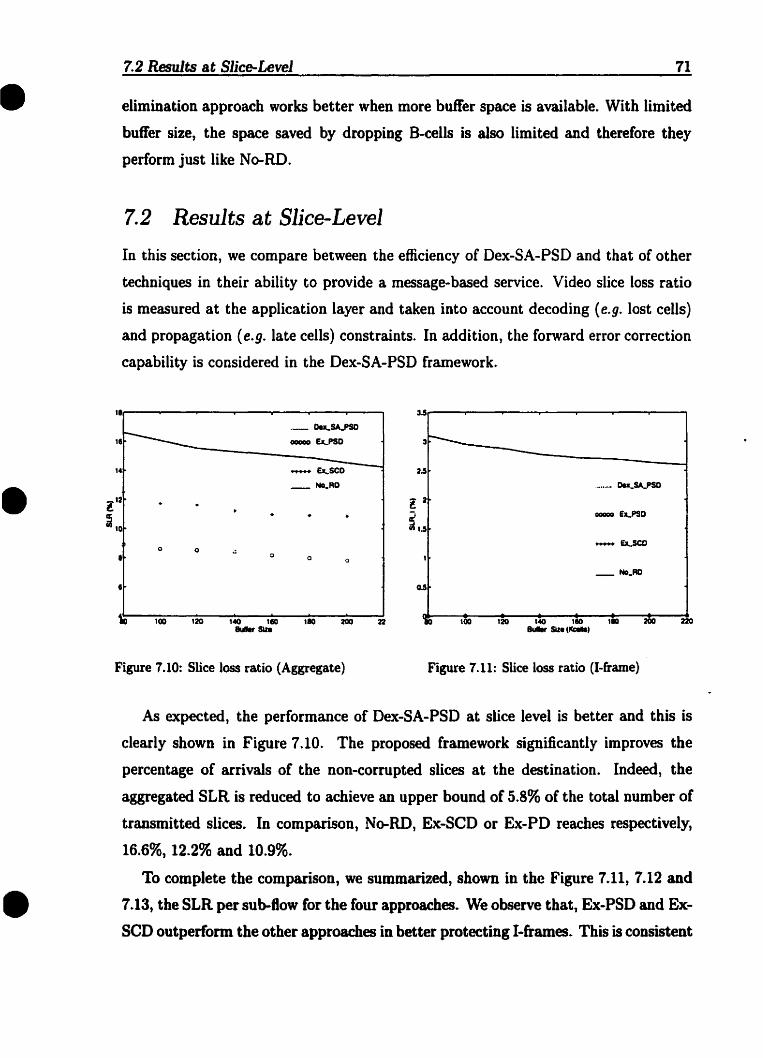
elimination approach works better when more buffer space is available. With limited
buffer size, the space saved by dropping B-cells is also limited and therefore they
perfonn just like No-RD.
•7.2 Results at Slice-Level 71
7.2 Results at Slice-Level
In this section, we compare between the efficiency of Dex-SA-PSD and that of other
techniques in their ability to provide a message-based service. Video slice 10ss ratio
is measured at the application layer and taken ioto account decoding (e.g. lost cells)
and propagation (e.g. late cells) constraints. In addition, the forward error correction
capability is considered in the Dex-SA-PSD framework.
1.1,...---_-_-...--...---....--......--~ 15....--...--...--.....---...--...-----,
•14
._- a....SA-PSDOOGOO EJr,.pso 3~ -J
lICIOClO EIl.PSO
o oo o
0.5
100 120 140 110 110 200 nlIuIer SIZe
Figure 7.10: Slîce loss ratio (Aggregate)
1 ~ 100 120 140 1110 IID 200 220Bulfw Sü. tibial
Figure 7.11: SUce loss ratio (I-Crame)
•
As expected, the performance of Dex-SA-PSD at slice level is better and this is
clearly shown in Figure 7.10. The proposed framework significantly improves the
percentage of arrivais of the non-corrupted slices at the destination. Indeed, the
aggregated SLR is reduced to achieve an upper bound of 5.8% of the total number of
transmitted slices. In comparison, No-RD, Ex-SeO or Ex-PD reaches respectively,
16.6%, 12.2% and 10.9%.
To complete the comparison, we summarized, shown in the Figure 7.11, 7.12 and
7.13, the SLR per sub-ftow for the four approaches. We observe that, Ex-PSO and Ex
SeD outperform the other approaches in better protecting I...frames. This is consistent

72 7 DISCUSSION
• 3~ 13
-2.5 a
0 Q 0 • •Q 0
2 _ Da-~D
l -'~~'.5 aoooo Ea..PSO
~' - Du.SAJISD
~ ~ 7 OGCIOO &-PSO
- Ex..SCO 01 :1 ~ &-seoQ
0.5 _ No.,AD_ No..RQ
..iO 100 120 140 180 110 200 ~ \0 100 120 140 1150 110 200 220
ButIIf~ (1irc8II) lIuIIr SIa
Figure 7.12: Slice loss ratio (P-frame) Figure 7.13: Slice 10ss ratio (B-frame)
with the results measured at cellievel. As we discarded in the previous section, this
is the cast ta pay for the fair distribution of cell discarding among the VCs that we
applied on Dex-SA-PSO.
• As ta P-frame and B-frame, De."(-SA-PSD demonstrates the best SLR value. This
indicates the capability provided by the FEC mechanism ta protect data at the slice
level.
7.3 Distance Effect
3
_ a.a.a. l00011m 0
0Q
10 UQ0
Q
0lIDOO c..nc.. 1 Ilm 0
1.5 _ ~ • lOGO Ilm
• Q
l l~
, • 0 ~t.5.. DlIIIIa. 1 !lm
•1.5
• •7iO--.-..�aa----'�20~-,~40--I~to~~I.~~2OD~-'22....- \O-~I00~-,.~-t~40--,~.~~,.:---~2OD~~220...-•Figure 7.14: CLR(Aggregate} with different distance Figure 7.15: CLR(I-&ame) with difFerent distance

7.3 Distance Elfect 73
• 3.7 U
U - 0IIIIncI.'000!lm •Q •3.5 OODO ~.'Ian 5.5
0 •l' 0
_:1.3 0 lu~ - DiII8nce. 'llQO Ilm
i U ID
0 ~ . 0000 DiIlance. 1 lIm11
J.5
z.t 0 0
2.1 U :)0
2.~ .00 .20 1'0 '10 '10 200 22 \Ci 100 120 1'0 UIO '10 200 220BuIIIr Sile BulIIr Slze
Figure 7.16: CLR(P-frame) with diff'erent distance Figure 7.17: CLR(B-frame} with dift'erent distance
•
•
As mentioned in Section 5.1, in our framework, the extended CLP Priority Assigna
tion Scheme (Oex-PAS) uses the Ex-CLP bits and dynamically assigns cell priorities
according to the current MPEG-2 frame type and network state. ThereCore, it de
pends on the reception of backward congestion signal from the network. The main
drawback is that its efficiency is dependent on the round trip time delay. To validate
this, we compare two sets of result using the new scheme, one with a backbone link
distance of one kilometer (simulating the LAN case) and the other of one thousand
kilometers (simulating WAN case).
Figure 7.14, 7.15, 7.16 and 7.17 show the results of cellioss ratio. In the WAN sit
uation, the aggregated CLR shows only slight difference from that of LAN. However,
the I-frame cell 1058 becomes much worse. This is expected and can be explained by .
the following reason: since the Dex-PAS scheme assigns the priority of P-frame to
lowor high dynamically depending on the Ceedback of the networks, in LAN situa
tion, this can be achieved promptly to reflect the current congestion state and thus,
P-frame could be dropped to alleviate the congestion as soon as the queue length ex
ceeds MT (middle threshold). In WAN, due to the longer round trip time (RTT),
the feedback is slower and thus the priority assignation level could not be adjusted as
fast. Therefore, the protection of I-frame is Dot as good when congestion gets worse.
Sînce the cast of{·frame protection is to sacrifice some p..frame ceUs, the overall CLR
remains almost the same. The same is true at the slice level, as shown in Figure 7.18,

74 7 DISCUSSION
• u 1.1
• _ .,..,.. ,GOO..01.4
0
0000 DiIIMce.'!lm 0 a0
01.2
5.1a
lSA li _ 0IIIance. 1000 Ml
;$.2Q ï
~o.a _ DIItance. 1 lm0
50.15
4.1
Q.44.1
~ 0iQ100 120 140 UIO 110 200 22 100 120 140 110 110 200 220lIuIIf SIa Ek* Slza
Figure 7.18: SLR(Aggregate) with different Distance Figure 7.19: SLR(I-frame) with different Distance
7.19, 7.20 and 7.21.
7.4 Redundancy Vs Data Ratio
• In this section, we want ta turn to the effect introduced by the redundant data we used
in FEe. As discussed in Section 5.3, the FEe capability is based on the redundancy
ta data ratio.
In our algorithm, the redundancy is determined by M, the number of rows in one
control block. The smaller the M value, means a row of FEe coding (redundant) data
is applied ta a small group of user data, thus the stronger error correcting capability.
We use M as an indicator oC redundancy to data ratio hereafter. The redundant
data per FEe control black needed in arder ta obtain sufficient performance mainly
depends on the cellioss pattern: larger number of redundant data is required for the
strongly corrected cellioss, as mentioned in Chapter 5. As one of the advantages, the
praposed FEC scheme uses a variable size of matrix as FEe control block, thus can
he easily optimized Cor both the number oC redundancy data per FEC frame, and the
actual FEe black size. As a result, this FEC scheme cao be fine tuned to achieve
sufficient throughput and latency performance with reasonable transmission overhead.
As an example, the Collowing demonstrate the behavior of our framework by using
• different values oC M. Notice that, M could he adjusted even during a connection
session by using network management Cacility.

7.4 Redundancy Vs Data Ratio 75
• 1.1 U
1.115 •3.1
,.e 0 _ DIIeanel:.'OOO !lm
:lA1.515 0 0000 DIIIInœ.'!lm •
:u - ~. 'OllOIem.
_1.5l. l~""6 ~ 3 oaoo DliII8nca.' lem
~
10 li) 0 Q....U 'J
1.315 Cl 0
2.e1.3 Cl
1.252.4 0
''\0 '00 '20 1~ teo 110 200 22 2il; 100 120 1~ 1eo 110 200 220Butret su. Bullet su.
Figure 7.20: SLR(P·frame} with different Distance Figure 7.21: SLR(B·frame) with different Distance
•
•
Figure 7.22, 7.23, 7.24, 7.25, 7.26, 7.27, 7.28 and 7.29 show the results of CLR and
SLR when different values of lVI are used. For CLR, it is obvious that the 10ss ratio
decreases as redundancy decreases (M increases) since less overhead is transmitted ta
the network and no recovery issue is considered at this level. In SLR, It is interesting
to notice that there exists a optimized value for M, above which, the SLR increases
with M increases. and below, the SLR increases with M decreases. This could be
explained by the two effects introduced by appending redundant data used for errar
recovery. First, if we added more redundant information, we get more powerful error
recovery capability, and as a result, the 10ss ratio at slice level could be reduced. This
is called recovery effect. However, on the other hand, the appended data consumes
more bandwidth, which could worsen the congestion that alreadyexisted in the net
work. As a result, the cellioss ratio would increase and 50 result in a large slice 1055
ratio, called overhead effect.
Therefore, when redundancy to data ratio is tao low (large M value), the errar
correction power provided by redundant data is insufficient, the SLR decreases with
M decreases as a result of increasing recovery power. That is, recovery effect dom
inates in this phase, this continues until M faUs below certain value (around 25 in
our experiment), then, the SLR turns to increase because the overhead introduced
becomes significant, and cause more and more buffer aggregation. In this phase, the
recovery effect is not comparable with the overhead one.

•76 7 DISCUSSION
•
•
'7 1.5
0
11 Q
Il
'5
5.!'4
l ld·3
~ 50
'24,5
11 00
0 g-'0
0 0
'0 5 '0 '5 20 25 30 31150 10 15 20 25 30 35
M SlH(rowI) .. Sih(IUWI)
Figure 7.22: CLR(Aggregate) with diff'erent redun- Figure 7.23: CLR(I-frame) with different redun-dancy daney
• 4.2
a4
c
U
U
5 3..
l lu~u iu Q
0
30
2.1
3.5 0
00-· U
30
20405 10 15 20 25 30 :It 5 '0 '5 20 25 30 35
.. Sih(1UWI1 .. sa(rGIIIl
Figure 7.24: CLR(P-frame) with dift"erent redun- Figure 7.25: CLR(B-&ame) with dürerent redun-dancy dancy
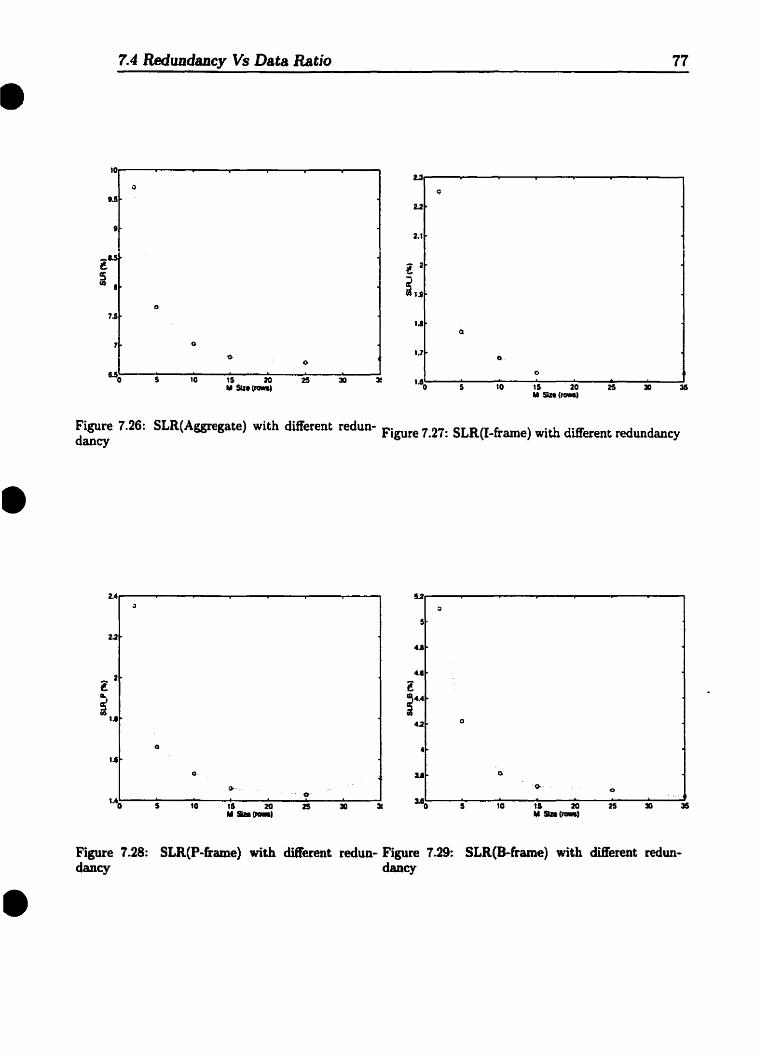
•7.4 RedUl1dancy Vs Data Ratio 77
10
Q
U
•_1.5~
S14 1
Cl
7.5
U
Q
2.2
2.1
l 2
;Ut.I
Q
0
0-U o.
0
010 15 20 25 JO :sr
"'0.. SIz.(JWa) 5 10 15 20 25 JO 35.. 51a(ra-a)
•
•
Figure 7.26: SLR(Aggregate) with different redun- F' 12- SLR(I Cr ) 'th d:a; t d ddancy 19ure • 1: - ame W1 lUeren re un aney
U 5.2Q :;1
U ....
_ 2 ....t. la- i....'514
lA4.2 0
0
lA
O. :li ~
1)•.. .0-.0
·Ct1.4
0 5 10 15 20 25 JO :sr 110 5 10 15 20 25 JO 35.._~) .. S1a(r-.)
Figure 7.28: SLR(P-Crame) with dift'erent redun- Figure 1.29: SLR(B-Crame) with different redun-dancy dancy

•
•
•
8
CONCLUSION
78

•8.1 CODclusions
8.1 Conclusions
79
•
•
In this thesis, we studied the transmission of encoded MPEG-2 video data over ATM
best effort services (i.e. VBR). we have surveyed a number of issues related to the cod
ing and control of MPEG-2 video traffic in ATM networks. Base on these knowledge,
we proposed and evaluated a quality of service control framework, which takes into
account the specifie stochastic properties of MPEG-2 video traffic. This framework
consists several components ta satisfy different requirements of improving end-tO-end
quality of service for video applications in ATM network.
First, a new priority data partition technique which extends ATM prioritization ca
pability is proposed. To better cope with the hierarchical MPEG-2 data transmission
requirements, a new field located in the ATM cell header is defined and referenced as
Ex-CLP. This field comprises the classieal CLP bit and the adjacent PTI ATM-user
to-ATM-user bit. By gathering these two bits together, a better utilization of the cell
header is achieved. This extended priority assignment strategy minimize the loss of
critieal video frames and provide better performance than classical CLP-based tech
niques. However, the main drawback of this strategy is that its efficiency is dependent
on the round trip time delay, thus on the network topology and link distances.
Ta support this sliee-based data partition scheme, a new MPEG-2 video stream
encapsulation strategy is aIso presented. In this scheme, each MPEG-2 PES packet
contains exactly one video slice, so the decoder can easily determine the start/end of
the slice, the network transport and control policies can take henefit of this ta offer
a guaranteed packet-oriented service.
In order to handle the cell 10ss and signal error in the network, we designed a
slice-based service specifie convergence sublayer, which enhanced the classical ATM
adaptation layer type 5. Among the additional features supported by the new ex
tended AAL-5 are the ability ta distinguish video frame types, as weIl as the detection
and the Corward correction of 1085 and errors at both byte and cell basis. The forward
errar correction is based on Reed-Solomn and parity codes. In comparison with those
based on only Reed-Solomn code with byte interleaving, our approach permits the
use of flexible matrix structure and a correction granularity at the basis of byte and
cel!. Moreover, it better takes ioto account the fixed structures of MPEG-2 transport
80 8 CONCLUSION
• stream packet and ATM cell to avoid bit padding at the lower ATM convergence
sublayer. To implement this FEC mechanism, we defined a control block as two di
mensional matrix, which contains fixed length service specific convergence sublayer
PDUs. ACter constructed by the source side FEe process, this control block is usoo
by destination side to detect, localize and finally correct errors.
We aIso presented an intelligent video-oriented switch data dropping scheme,
(selective-adaptive partial slice discarding) which is performed at both control block
and video slice level. Unlike the traditional partial slice discarding scheme, SA-PSD
stops discarding as saon as the congestion decreases and ooly if the number of pre
viously dropped cells in every control black is below a drop tolerance. By using this
approach, the proposed scheme acts at a finer data granularity and better preserves
entire slices from elimination.
•
•
The integration oC these schemes provided us an efficient and intelligent video
delivery service with quality of picture control optimization. Results have shawn that
the proposed Cramework is able ta ensure gracerul picture degradatian during overload
periods as weil as increase of network performance.
We implemented this Cramework in NIST ATM simulator and used MPEG-2 trac
ing file as input to simulate the network transmission state. Results show that our
Cramework (Dex..SA-PSD), as with other two preventive strategies, selective cell dis
carding combined with extended priority assignation scheme (Ex-SeD) and partial
sUce discarding with extended priority assignation scheme (Ex-PSD), can concentrate
the data loss within the B-frame and thus prevent critical video data loss (e.g. 1- and
P-frames). Dex-SA-PSO results in more eellioss if caleulated at the cellievel, but
demonstrated an improved result at the sUce level - the number of non-eorrupted
slice arriving at destination signifieantly increases. A slight reduction of the mean cell
transfer delay for the aggregate video stream is experieneed because of the overhead
introduced by the FEC mechanism. In a WAN situation, the proposed framework
endures performance degradation in protection of critieal information, sinee it de
pends on the reception of reedback from the network. As a result, the efficiency of
Dex-SA-PSO is dependent on the round trip time delay. Finally, we have aIso shawn
that the proposed FEe scheme is 8exible and can be easily optimized for both the

number of redundancy data per FEe block and the actual block size. As a result, it
can achieve sufficient throughput and latency performance through careful selection
of the redundancy data ratio.
•8.2 Future Work 81
•
•
8.2 Future Work
In this framework, as we have seen, the major drawback of the Dex-PAS scheme is
that its efficiency is dependant on the link distance and network topology, thus, not
work weIl in WAN situation. Further work should be done to improve this. For
example, we can segment the netwark inta smaller pieces, and let the switches act as
''virtual source" and/or ''virtual destination", thus reduce the round trip time of the
resource management cell [38J.
Another problem is that, in our FEC-SSCS protocol, it introduces sorne redundant
information, which could be significant in sorne situation (e.g. when the user data
packet is very small). Thus, further wark need ta be done to minimize this kind of
overhead. As an example, we could avoid transmit the stuffing bits (ta construct a
control block at sses sublayer) if both send and receive entities knows the pattern for
stumng. Of course, this makes it necessary to use variable length of SSCS-PDU and
thus need a field in the POU head (or tail) to indicate the actual POU length. We have
actually implemented this in our simulatar, and have observed a slight improvement
of the performance. Further studies need ta be done on this subject ta confirm this.
In this thesis, we only tested the mean Cell Transfer Delay of the MPEG-2 video
stream. For many real-time applications, however, delay jitter (Cell Transfer Delay
Variance) is much more important than the mean delay. In other words, manyappli
cations are not sensitive to a slight increase of average delay, but are sensitive to an
increase of delay jitter. Thus a performance evaluation with respect to delay jitter
should be studied in the future.

•BIBLIOGRAPHY
[1] S. Dbeit and P. Skelly. Mpeg-2 over ATM for video dia! tone networks: issues
and strategies. IEEE Network, 9(5):30-40, 1995.
[2] S. Keshav M. Grossglauser and O. Tse. RRCBR: a simple and effective service
for multiple time-scale traffic. Proceedings of ACiW: SIGCOMM'95, 25:219-230,
1995.
[3] H. Kanakia, P. Mishra, and A. Reibman. Packet video transport in ATM net
works with single-bit feedback. Proceedings of the sixth International Workshop
on Packet Video, Portland, Oregon, September 1994.
• [4] T. V. Lakshman, P. P. Mishra, and K. K. Ramakrishnan. Transporting com-
pressed video over ATM networkswith explicit rate feedback control. IEEE IN
FOCOM 97, Kobe, Japan, March 1997.
[5] H. Zhang and E. \V. Knightly. RE0-VBR: A renegotiation-based approach to
support delay-sensitive VBR video. ta appear in ACM/Sringer- Verlag Multime
dia Systems Journal, 1996.
[6] H. Kanakia, P. Mishra, and A. Reibman. An adaptive congestion control
scheme for real-time packet video transport. Proceedings ofACM SIGCOMM'93,
September 1993.
[7] P. N. Tudor. MPEG-2 - video compression tutorial. IEE Colloqium on "MPEG
2 - what it is and what it ÎSn't", January 1995.
•[8) International Organization for StandardizatioD. Information technology
Generic coding of moving pictures and associated audio: Video, recommendation
H.262, ISO/IEC 13818-2. Droft International Standard Edition, November 1994.
82

[91 M. W. Garrett and W. Willinger. Analysis, modeling and generation of self
similar VBR video traffic. Computer Communication Review, 24(4), October
1994.
•BIBLIOGRAPHY 83
•
•
[101 Uyless Black. ATM:Foundation For Broadband Networks. Prentice Hall Series
in Advanced Communications Technologies, 1995.
[111 International Organization for Standardization. Information technology
Generic coding of moving pictures and associated audio: Systems, recommenda
tion 8.222.0, ISO/IEC 13818-1. Droft International Standard Edition, November
1994.
[12} H. Eriksson. Mbone~ The multicast backbone. Communications of the AGM,
37(8), August 1994.
[13] S. Klett. Mbone: Videoconferencing over internet. CRosseUTS, 5(1), April
1996.
[14) M. R. Macedonia and O. P. Brutzman. Mbone provides audio and video across
the internet. Computer, 27(4), Apri11994.
[15] A. Guha, H. Esaki, G. Carle, and T. Dwight. Necessity of cell-Ievel FEe scheme
for ATM networks. ATM-Forum Technical Contributions/95-1011.
[16] W. Luo and M. El Zarki. Analysis of error concealment schemes for MPEG-2
video transmission over ATM based network. SPIE'95, 2501:1358-68, 1997..
[17] G. Ramamurthy and O. Raychaudhuri. Performance of packet video with com
bined error recovery and concealment. IEEE INFOCOM'95, Boston, pages 753
61, 1995.
[18] S. Lee. CeU loss and error recovery in variable rate video. Journal 0/ Vsual
communication and image representation, pages 39-45, March 1993.
[19] E. W. Biersack. Performance evaluation oC Forward Error Correction in an ATM
environment.IEEE Journal onSelected Areas in Communication, 11(4):631-640.

84 BmLIOGRAPHY
• [20] H. Ohta and T. Titami. A cellioss recovery method using FEe in ATM networks.
IEEE Journal on Selected Areas in Communication, 9:1471-1483, Decmber 1991.
[21] A. J. McAuley. Reliable broadband communication using a burst erasure cor
recting code. ACM, pages 297-306, 1990.
[22] P. Pancha and M. El Zarki. Mpeg cading for variable bit rate video transmission.
IEEE Communication magazine, pages 54-66, May 1994.
[23] B. DeGleen, P. Pancha, and M. El Zark. Comparison of priority partition meth
ods for VaR MPEG. IEEE INFOOM'94, pages 689-96, 1994.
[24] G. Armitage and K. Adams. Packet reassembly during cellloss. IEEE Network
magazine, 7(5):26-34, September 1993.
•
•
(25] A. Romanov and S. Floyd. Dynamics of TCP traffic over ATM networks. ACM
SIGCOMM'94, pages 79-88, September 1994.
[26] R.Jain et al. Buffer requirements for TCP over UBR. ATM Forum 96-0518,
April 1996.
[27] J. Heinanen and K. Kilkki. A fair buffer allocation scheme. unpublished
manuscript.
[28] A. Mehaoua and R. Boutaba. Performance analysis of a slice-based discard
scheme for MPEG video over UBR+ service. Proceedings of /CCC'97, Cannes,
France, November 1997.
[29] ATM Forum. Real-time ABR: Proposai for a new work item. AF-TM-96-1760,
December 1996.
[30] D. LeGal!.. Mpeg: a video compression standard for multimedia application.
Communications of A CM, 34:47-58, April 1991.
[31] ATM Forum. Draft proposai for specification oC FEC-SSCS for AAL type 5.
AF-SAA-0926RB, October 1995.
[32] A. K. Kanai, R. Grueter, et al. Forward error correction control on AAL5:
FEC-SSCS. /CO'96, Dallaa, TX, pages 384-391, June 1996.•BIBLIOGRAPHY 85
•
•
[33] ATM Forum SAA SWG. Audiovisual multimedia services: Video on demand.
AF-SAA-0049.000, December 1995.
[34] I. S. Reed and G. Solomon. Polynomial codes over certain finite fields. SIAM
Journal of Applied Mathematics, 8:300-304, 1960.
[35) S. B. Wicker and V. K. Bhargava. Reed..solomom codes and their applications.
IEEE press, 1994.
[36] Perth. B-ISDN adapation layer (AAL). November 1995.
[37] M. R. Izquierdo and D. S. Reeves. Mpeg VBR sUce layer model using lin..
ear predictive coding and generalized periodic Markov chains. International
Performance, Computing and Communications Conference, Scottsdale, Arizona,
Febrary 1997.
[38} M.Hluchyj et aL Closed-Ioop rate-based traffic management. AF-TM 94-0438R2,
September 1994.