information technology software engineering · information technology software engineering ......
TRANSCRIPT
INFORMATION TECHNOLOGY
SOFTWARE ENGINEERING
FINAL PROJECT
IMPLEMENTATION OF COUNTER TESTING IN NOKIA AUTOMATION SYSTEM
Author: Mirel Pehadzic Supervisor: Simo Silander Instructor: Juha Saarinen
Approved: April 20, 2007 Simo Silander
Senior Lecturer
PREFACE
This thesis is based on the work carried out at the I&V department in Nokia
Networks. I would like to thank my instructor Juha Saarinen for his guidance
and support throughout the work of this thesis. I would also thank my super-
visor Simo Silander for giving his excellent thoughts and feedback on the
thesis. I would also like to thank Marjatta Huhta for proofreading this thesis.
I would like to express my gratitude to Marko Koskela for giving me the op-
portunity to carry out this work. Special thanks to my colleagues Janne
Stenbacka, Marcus Heino and Petri Fokin for sharing a lot of valuable practi-
cal experiences with me.
Finally, I wish to thank my parents and my family for their love and everlast-
ing support.
Espoo, April 20, 2007
Mirel Pehadzic
ABSTRACT
Name: Mirel Pehadzic
Title: Implementation of Counter Testing in Nokia Automation System
Date: April 20, 2007 Number of pages: 59
Degree Programme: Information Technology Specialization: Software Engineering
Instructor: Juha Saarinen, Team Leader, Nokia Supervisor: Simo Silander, Senior Lecturer
In this study the performance measurement, a part of the research and development of the RNC, was improved by implementing counter testing to the Nokia Automation System. The automation of counter testing is a feature the customer ordered, because performing counter testing manually is rather complex. The objective was to implement an automated counter testing system, which once configured correctly, would manage to run the testing and perform the analysis. The requirements for the counter testing were first studied. It was investigated if the auto-mation of the feature was feasible in the meetings with the customer. The basic functional-ity required for the automation was also drawn. The technologies used in the architecture of the Nokia Automation System were studied. Based on the results of the study, a new technology, wxWidgets, was introduced. The new technology was necessary to facilitate the implementing of the required feature. Finally the implementation of the counter testing was defined and implemented. The result of this study was the automation of the counter testing method developed as a new feature for the Nokia Automation System. The feature meets the specifications and requirements set by the customer. The performing of the counter testing feature is totally automated. Only configuration of the test cases is done by the user. The customer has presented new requests to further develop the feature and there are plans by the Nokia Automation System developers to implement those in the near future. The study describes the implementation of the counter testing feature introduced. The results of the study give guidelines for further developing the feature.
Key words: UMTS, performance measurement, automation, counter testing
INSINÖÖRITYÖN TIIVISTELMÄ
Tekijä: Mirel Pehadzic
Työn nimi: Laskuritestauksen toteuttaminen Nokia Automation System – järjestelmään
Päivämäärä: 20.4.2007 Sivumäärä: 59 s
Koulutusohjelma: Tietotekniikka Suuntautumisvaihtoehto: Ohjelmistotekniikka
Työn valvoja: lehtori Simo Silander Työn ohjaaja: tiimipäällikkö Juha Saarinen
Tässä insinöörityössä toteutettiin tulosmittausta joka on osa RNC tuotekehitystä. Toteutus tehtiin Nokia Automation System – järjestelmän uudeksi ominaisuudeksi. Laskuritestauk-sen automatisointi on ominaisuus jonka asiakas tilasi, koska laskuritestauksen suorittami-nen manuaalisesti on melko monimutkaista. Tavoite oli toteuttaa automatisoitu laskurites-tausjärjestelmä, jonka konfiguroimisen jälkeen voitaisiin pystyä suorittamaan testit ja teh-dä tulosanalyysi. Vaatimukset laskuritestaukseen määriteltiin ensin, jonka jälkeen kokouksessa asiakkaan kanssa tutkittiin onko ominaisuuden automatisointi mahdollinen. Perustoiminnallisuus au-tomatisoinnille määriteltiin myös. Nokia Automation System – järjestelmän arkkitehtuuris-sa käytetyt teknologiat tutkittiin, jotta pystyttäisiin selvittämään olisiko tarpeellista ottaa käyttöön uusi teknologia ominaisuuden toteuttamiseksi. Tutkimuksen tuloksien pohjalta uusi teknologia, wxWidgets, esiteltiin. Uusi teknologia oli tarpeellinen helpottamaan vaadi-tun ominaisuuden toteuttamista. Viimeiseksi laskuritestauksen toteutus määriteltiin ja to-teutettiin. Tämän työn tulos on laskuritestauksen automatisointi, joka kehitettiin uudeksi ominaisuu-deksi Nokia Automation System – järjestelmään. Toteutettu ominaisuus täyttää asiakkaan asetetut spesifikaatiot ja vaatimukset. Laskuritestaus on täysin automatisoitu. Käyttäjä on vastuussa ainoastaan testitapausten konfiguroinnista. Tulosten pohjalta asiakas on esittä-nyt uusia vaatimuksia ominaisuuden jälleenkehittämiseksi. Nokia Automation System – järjestelmän kehittäjillä on suunnitelmana toteuttaa ne lähitulevaisuudessa. Tässä työssä kuvataan laskuritestausominaisuuden toteuttamista. Tämän työn tulos antaa ohjeistusta laskuritestausominaisuuden edelleen kehittämiseksi.
Avainsanat: UMTS, tulosmittaus, automaatio, laskuritestaus
TABLE OF CONTENTS
PREFACE
ABSTRACT
TIIVISTELMÄ
TABLE OF CONTENTS
ABBREVIATIONS/ACRONYMS
1 INTRODUCTION 1
2 UMTS NETWORK 3
2.1 Architecture of UMTS 3
2.2 Core Network 4
2.3 UTRAN 5
2.4 UMTS UE 9
2.5 Interfaces 10
3 PERFORMANCE MEASUREMENT 11
3.1 Defining the Measurement Targets 12
3.2 Collecting Measurements 13
3.3 Key Performance Indicators 15
3.4 3GPP Definitions 17
4 AUTOMATION OF TESTING 18
5 NOKIA AUTOMATION SYSTEM 21
6 GSOAP AND THE SOAP PROTOCOL 24
6.1 SOAP message 26
6.2 Object Remote Procedure Calls 27
6.3 Introduction to gSOAP 29
6.4 Developing gSOAP Applications 29
7 WXWIDGETS 32
7.1 wxThread 34
7.2 wxSocket 36
8 IMPLEMENTING COUNTER TESTING 41
8.1 Requirements and Specifications 41
8.2 Handling of the Counter Data 44
8.3 Analyzer Tool 46
8.4 Analysis 50
8.5 Reporting 54
8.6 Summary 58
9 CONCLUSIONS 59
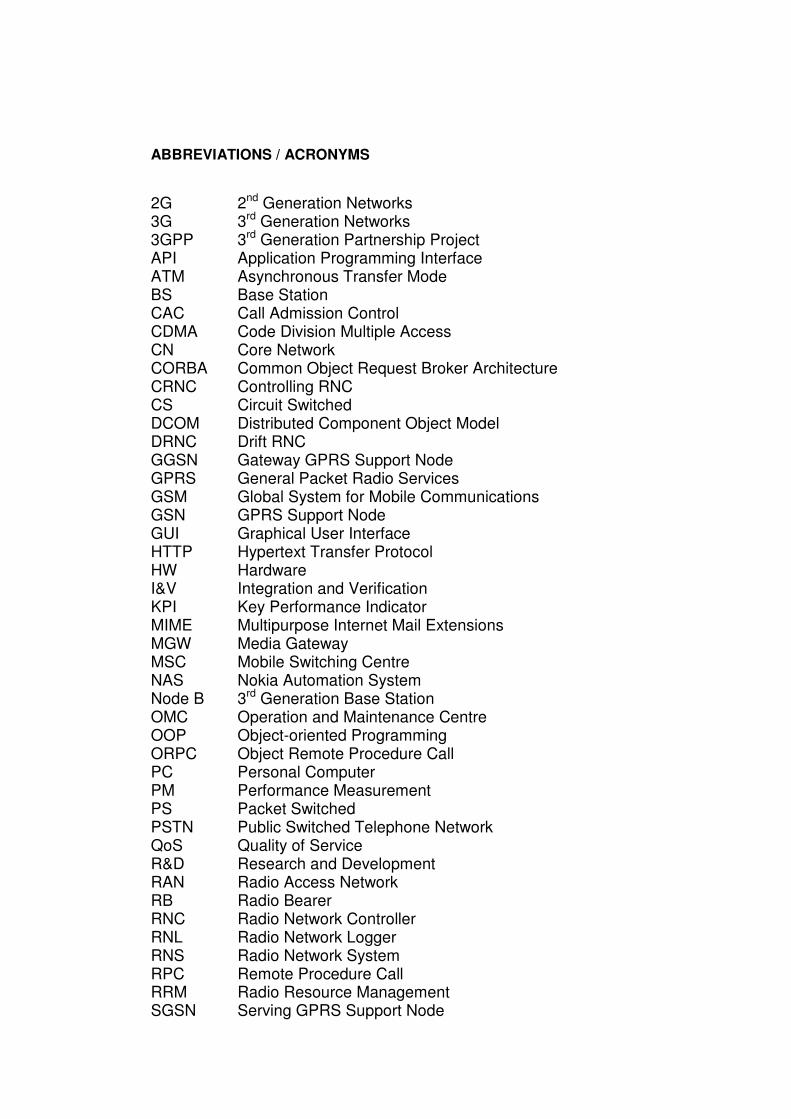
ABBREVIATIONS / ACRONYMS
2G 2nd Generation Networks 3G 3rd Generation Networks 3GPP 3rd Generation Partnership Project API Application Programming Interface ATM Asynchronous Transfer Mode BS Base Station CAC Call Admission Control CDMA Code Division Multiple Access CN Core Network CORBA Common Object Request Broker Architecture CRNC Controlling RNC CS Circuit Switched DCOM Distributed Component Object Model DRNC Drift RNC GGSN Gateway GPRS Support Node GPRS General Packet Radio Services GSM Global System for Mobile Communications GSN GPRS Support Node GUI Graphical User Interface HTTP Hypertext Transfer Protocol HW Hardware I&V Integration and Verification KPI Key Performance Indicator MIME Multipurpose Internet Mail Extensions MGW Media Gateway MSC Mobile Switching Centre NAS Nokia Automation System Node B 3rd Generation Base Station OMC Operation and Maintenance Centre OOP Object-oriented Programming ORPC Object Remote Procedure Call PC Personal Computer PM Performance Measurement PS Packet Switched PSTN Public Switched Telephone Network QoS Quality of Service R&D Research and Development RAN Radio Access Network RB Radio Bearer RNC Radio Network Controller RNL Radio Network Logger RNS Radio Network System RPC Remote Procedure Call RRM Radio Resource Management SGSN Serving GPRS Support Node
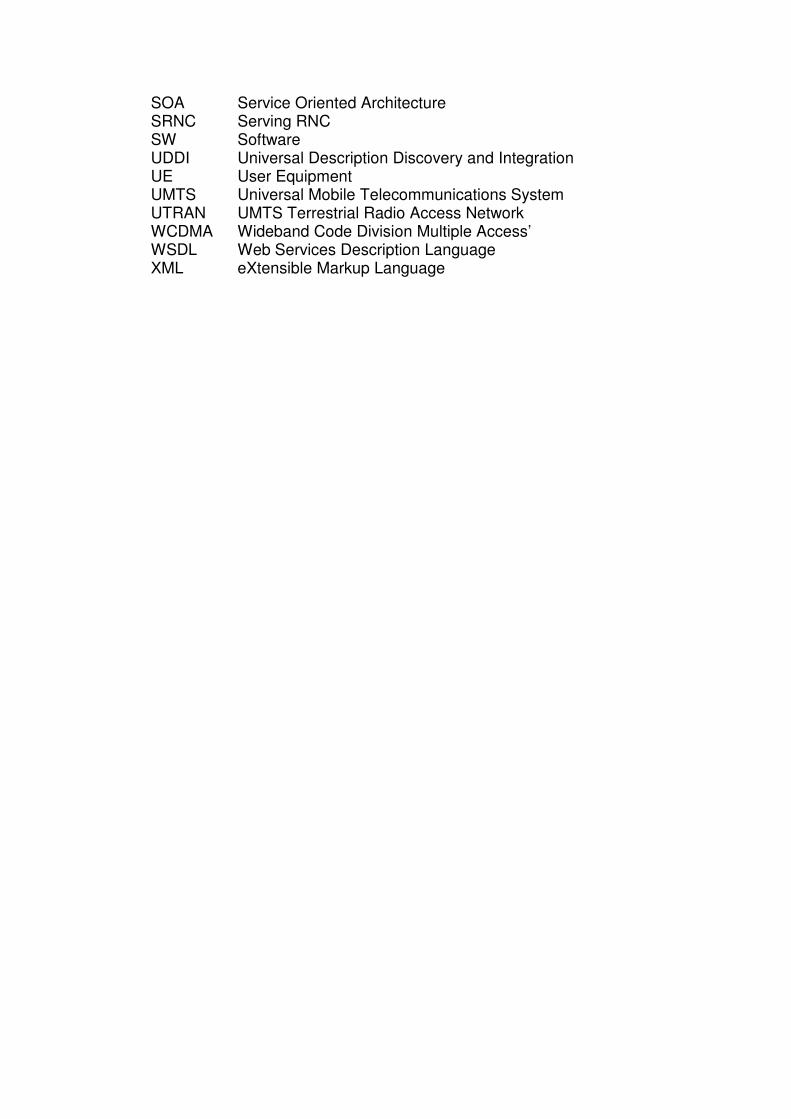
SOA Service Oriented Architecture SRNC Serving RNC SW Software UDDI Universal Description Discovery and Integration UE User Equipment UMTS Universal Mobile Telecommunications System UTRAN UMTS Terrestrial Radio Access Network WCDMA Wideband Code Division Multiple Access’ WSDL Web Services Description Language XML eXtensible Markup Language
1
1 INTRODUCTION
In the past few years there has been tremendous growth in mobile telecom-
munications. Increase in subscribers and introduction of games, music and
video downloading for end users, produces more traffic. This demands more
capacity from mobile networks.
Creating a new standard in mobile phone technology, the UMTS, also known
as 3G, was an answer to the problem. UMTS uses new technology for its air
interface, WCDMA, which enables higher traffic speeds and more subscrib-
ers. In mobile telecommunications system, a part which provides radio ac-
cess technology is called Radio Access Network (RAN). RAN which sup-
ports UMTS is called UTRAN.
RAN sits between the user equipment (UE) or a subscriber and core network
(CN). Its responsibility is to perform the radio functionality of the network.
The RAN typically includes a Radio Network Controller (RNC) and several
base stations, known as Node Bs. The role of RNC includes controlling of
the Node Bs connected to it.
As any embedded system, the RNC has system software which handles and
provides all of functionality. Nokia has invested a lot in research and devel-
opment of the software in its RNC. One field of the research and develop-
ment is Integration and Verification (I&V). I&V makes sure that system is
stable, working as expected and providing quality output. Performance
measurement is part of I&V in which Nokia wants to improve on and invest
time in.
Performance measurement is an evaluation of the behaviour of the network
element. It is presented in a form of performance data, which is collected
and recorded by the network element, e.g. the RNC. Performance data in-
cludes e.g. counters which provide information about different functions of
the network element, e.g. how many times the UE successfully established a
connection with the other party. While having a significant role in R&D it is
also the end user view that customers have on Nokia’s network elements.

2
In the current working environment there has been only one way of doing
performance measurement verification, in a manual manner. This means
that a person is expected to execute a test using several different tools.
Several tasks must be performed concurrently. In addition the output re-
ceived is also analyzed manually. All this makes a manual process very
complex. As a result over the last couple of years Nokia has put much effort
in developing Nokia Automation System (NAS), which adds automated test-
ing aside manual one.
In automated testing software is used to control the execution of tests, the
comparison of actual outcomes to predicted outcomes, the setting up of test
preconditions, and other test control and test reporting functions. Commonly,
test automation involves automating a manual process that already exists.
This final project aims to develop more features to the Nokia Automation
System by implementing performance measurement testing while keeping
the focus on the counters. The feature has been ordered by a customer of
NAS. Thus the implementation must meet the requirements specified by the
customer, as detailed in section 6. This leads to researching how well the
current technologies used in NAS support performance measurement testing
and add on new features that are missing from the current system.
The report is written in six sections. The first section (Chapter 2) provides
general information about the UMTS system for which the performance test-
ing is done. Section 2 (Chapter 3) gives an insight on to the method of per-
formance measurement. Section 3 (Chapter 4) describes the automation
testing in general. Section 4 (Chapter 5) introduces the NAS tool used for
automating testing. Section 5 (Chapters 6 and 7) include the information
about the technologies, such as SOAP and wxWidgets, used in the solution.
Section 6 (Chapter 8) describes the requirements for the improvement of
performance measurement testing and information about its implementation.
This is where the main emphasis of this project is placed on.
3
2 UMTS NETWORK
Nokia Automation System testing is run against the UMTS network ele-
ments. This section gives an overview about the UMTS network and its
structure.
As result of more and more subscribers and efficiency of the old Global Sys-
tem for Mobile Communications (GSM) mobile service not being enough to
support the demands of the subscribers and the features demanded, a new
standard had to be created to address those problems. To create a new
standard which would evolve from the current GSM system specifications, in
1998 3rd Generation Partnership Project (3GPP) was established. It is a co-
operation between different standardization organizations from all over the
world. Following organizations are members of the 3GPP [1]:
• European Telecommunications Standards Institute (ETSI) , Europe
• Association of Radio Industries and Businesses (ARIB), Japan
• Telecommunication Technology Committee (TTC), Japan
• China Communications Standards Association (CCSA), China
• Alliance for Telecommunications Industry Solutions (ATIS), North
America
• Telecommunications Technology Association (TTA), South Korea
As GSM is second-generation (2G) technology standard, the new standard,
for the globally applicable third generation (3G) mobile phone system speci-
fication, has been defined by the 3GPP as Universal Mobile Telecommuni-
cations System (UMTS).
2.1 Architecture of UMTS
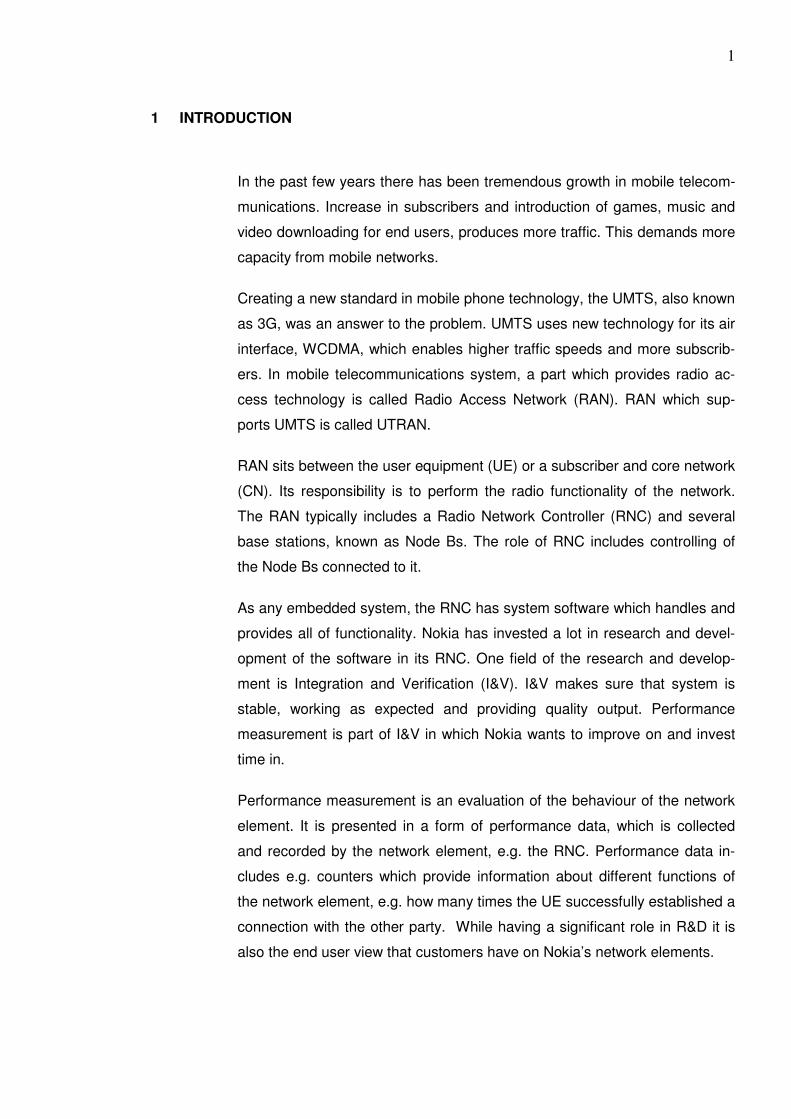
As presented in Figure 1, the UMTS network architecture consists of three
different parts.
4
Figure 1: UMTS system architecture
The first part is the Core Network (CN) which is the long-range network that
transports a user’s data to its respective destination [2]. Second part is the
UTRAN responsible for providing radio access technology. The third and the
final part is the UE which is usually the mobile phone of the subscriber.
All of the parts are described in more detail in the following.
2.2 Core Network
The main functionality of the CN is to provide switching, routing and transit
functionality for user traffic. Furthermore, it consists of databases which are
used for mobility management, user management and billing. From sub-
scriber’s point of view, perhaps the most valuable service it provides is the
connection to the outside world, the Internet.
CN is divided into two different domains: Circuit Switched (CS) and Packet
Switched (PS). Circuit-switched connections require dedicated network re-
sources to be allocated during a connection. Dedicated resources cannot be
used by other users. The Public Switched Telephone Network (PSTN) is a
good example of a CS network. On the other hand, PS connections do not
require such dedicated resources, as information is broken packets, which
are routed independently through the network to their destinations, where
5
they are reassembled into the original information streams. The best exam-
ple of a PS network is the Internet.
Basic elements included as a part of CN are Serving GPRS Support Node
(SGSN), Gateway GPRS Support Node (GGSN), which support PS connec-
tions, and Mobile Switching Center server (MSC) and Media Gateway
(MGW) which support CS connections. MGW is a translation element which
is used when connecting disparate mobile networks, i.e. GSM and UMTS. Its
main function is to convert between different transmission and coding tech-
niques. The MSC is an element responsible for all call control, e.g. handover
procedures. It also supports user mobility and location management, i.e.
storing the current location area of the user so that a connection can be set
up in the correct cell in the event of an incoming call. The SGSN is a GPRS
Support Node (GSN), which has similar responsibilities as the MSC. It also
keeps track of the location of the UE so that an incoming data packet can be
routed to the user. In addition it performs security functions and access con-
trol. The GGSN provides a connection to other PS networks, such as the
Internet.
2.3 UTRAN
The idea of UTRAN is to provide connection between UE and CN and in that
way isolate all radio issues from the CN. This enables one CN to support
multiple access technologies.
Main service offered by UTRAN is Radio Bearer (RB). RB is needed for
communication between UE and CN. It carries user data between the two,
e.g. when establishing a call connection between UE and Node B. The char-
acteristics of RB depend on what kind of information is being transported.
UTRAN Architecture
Figure 2 shows the UTRAN architecture.
6
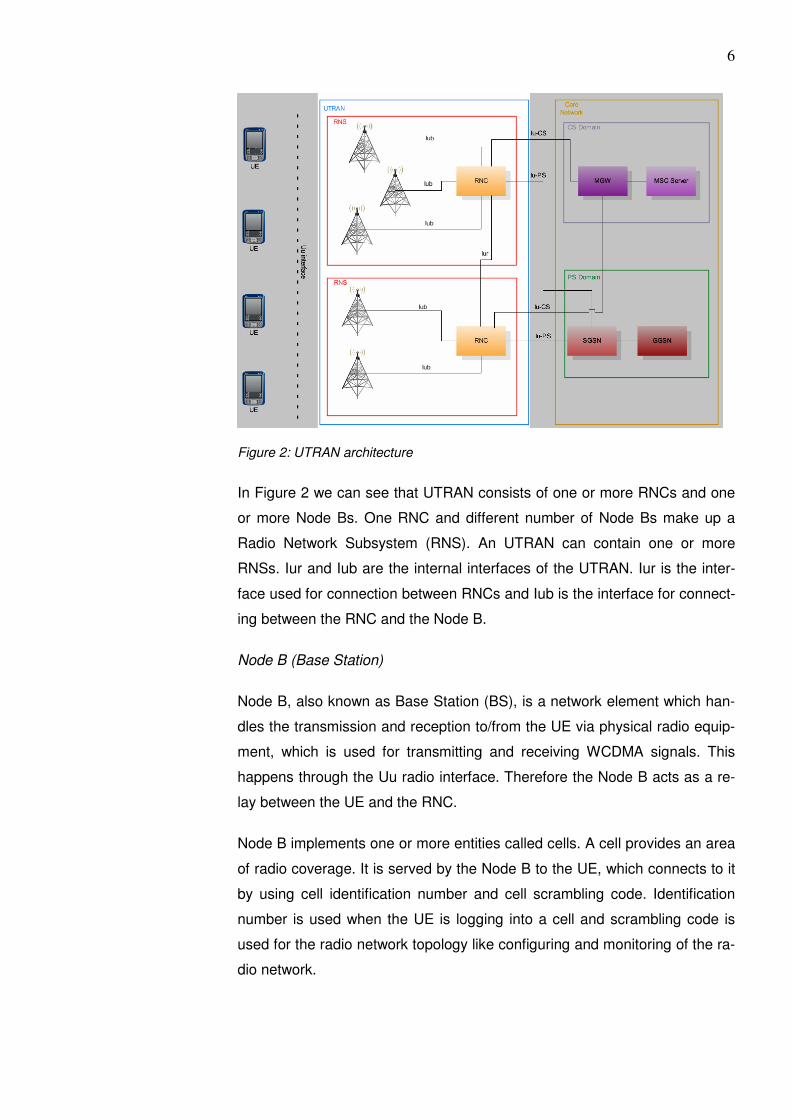
Figure 2: UTRAN architecture
In Figure 2 we can see that UTRAN consists of one or more RNCs and one
or more Node Bs. One RNC and different number of Node Bs make up a
Radio Network Subsystem (RNS). An UTRAN can contain one or more
RNSs. Iur and Iub are the internal interfaces of the UTRAN. Iur is the inter-
face used for connection between RNCs and Iub is the interface for connect-
ing between the RNC and the Node B.
Node B (Base Station)
Node B, also known as Base Station (BS), is a network element which han-
dles the transmission and reception to/from the UE via physical radio equip-
ment, which is used for transmitting and receiving WCDMA signals. This
happens through the Uu radio interface. Therefore the Node B acts as a re-
lay between the UE and the RNC.
Node B implements one or more entities called cells. A cell provides an area
of radio coverage. It is served by the Node B to the UE, which connects to it
by using cell identification number and cell scrambling code. Identification
number is used when the UE is logging into a cell and scrambling code is
used for the radio network topology like configuring and monitoring of the ra-
dio network.
7
As mentioned earlier, Node B is connected to and controlled by the RNC
over the Iub interface. The input tasks come from the RNC and tasks which
are directly related to the radio interface are handled in the Node B. CDMA
receiver is also included and its task is to convert incoming radio signals via
Uu into a data stream which is then forwarded to the RNC over the Iub inter-
face. Same principle is used in the opposite direction where the difference is
that CDMA transmitter prepares incoming data streams for transport over Uu
and routes it to the power amplifier.
At any given time, since the RNC has control over the Node B, the RNC has
to have as exact information as possible of the current situation in a cell, so
that it can make sensible decisions on handover, power and call admission
control and packet scheduling for the PS data. This is handled in a way that
Node B and UE periodically carry out measurements of the connection qual-
ity and interference levels. Results are then transmitted to the RNC.
Radio Network Controller
The RNC is the entity, which connects the UTRAN to the Core Network via
the Iu interface. Its main function is to control and manage the UTRAN and
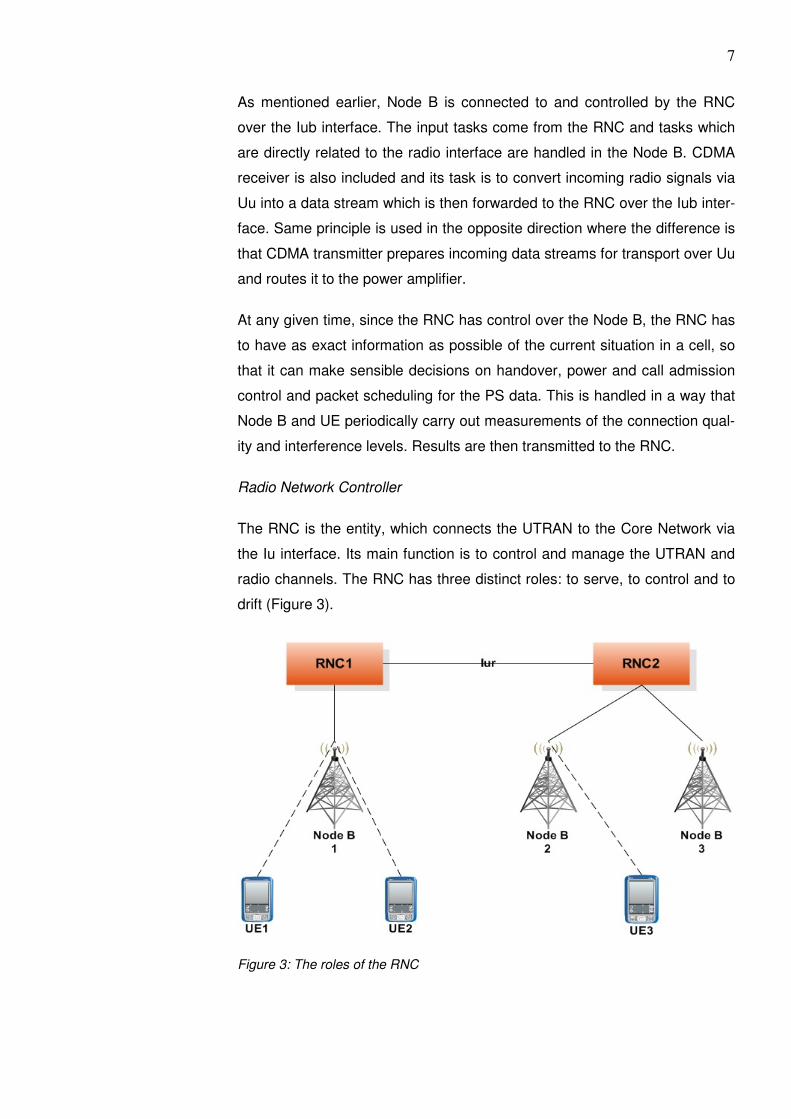
radio channels. The RNC has three distinct roles: to serve, to control and to
drift (Figure 3).
Figure 3: The roles of the RNC
8
In the figure, the RNC1 is the Serving RNC (SRNC) which controls the con-
nection on the Iu interface for UE1 and UE2. There is only one SRNC for
each UE connected to the UTRAN. Furthermore, it is at the same time the
Controlling RNC (CRNC) for the Node B 1. There is only one CRNC for any
Node B. The RNC2 is the SRNC for the UE3 and CRNC for Node Bs 2 and
3, equally. In a situation where the UE has to use resources not controlled
by its SRNC, i.e. in case of a call from UE1 to UE3, the SRNC for the UE1
(RNC1) must make a request from the CRNC of the UE3 (RNC2) for those
resources. The request is done via the Iur interface. At this moment the
RNC2 becomes the Drift RNC (DRNC). The DRNC (RNC2) supports the
SRNC (RNC1) with the radio resources requested. However, the control
over the connection remains on the SRNC (RNC1) [3].
All the tasks of the RNC related to data transmission over the Uu are classi-
fied as Radio Resource Management (RRM) functionality part. The other
part is control functions which include functions related to setup, mainte-
nance and release of radio bearers (RBs). To establish a connection be-
tween UE and UTRAN an RB is needed. RB is a data channel for transfer-
ring subscriber’s data between UE and UTRAN.
The most important RRM tasks of the RNC are listed below.
1. Call Admission Control (CAC): The transmission technology WCDMA
provides a number of possible channels at the Uu air-interface for the
UEs to use. However not all of these channels can be used at the same
time due to the problem of interference that increases as more channels
are used. The RNC must calculate the current traffic load for each cell.
Based on these calculations the CAC decides whether the interference
level, after the requested channel has been assigned, is acceptable and
rejects the call if necessary.
2. Radio Resource Management: The RNC manages radio resources in all
cells attached to it.
3. Radio Bearer setup and release: The RNC is responsible of setting up,
maintaining and releasing of the RBs.
9
4. Power control: The transmitter power of all users is controlled by the
RNC. The actual control process is performed by the Node B, but the
target control values are controlled by the RNC.
5. Packet scheduling: With PS data transmission several mobile stations
share the same resources at the radio interface. The RNC cyclically allo-
cates transmission capacity to the individual UEs while at the same time
taking into account the negotiated quality of service.
6. Handover: RNC detects whether a different cell is better for the current
UE connection, based on the measurements supplied by Node B and
UE.
7. SRNS relocation: There is a possibility that UE will move out of the area
managed by the RNC. In this situation another RNC must takeover the
control for the connection.
8. Encryption: Incoming data for transmission over the Uu is encrypted in
the RNC.
9. Protocol conversion: RNC must handle the communication between CN,
neighboring RNCs and its Node Bs.
10. ATM switching: The communication paths between Node Bs and the
RNC, between RNCs and between the RNC and the CN are based on
ATM routes. The RNC switches and connects ATM connections to en-
able communications between the various nodes.
In this thesis these tasks and their inner functionalities are the potential per-
formance measurement targets as described in section 2.
2.4 UMTS UE
The UMTS UE is the most visible network element of the UMTS system as
far as the end-user is concerned [2, p.195]. It is the element which provides
application interface and services to the end-user.
Besides supporting the UMTS standard, it can support also old standards,
such as GSM. It interacts simultaneously with the Node B, the RNC and the
CN.
10
In interaction with the Node B, the UE is responsible for processing the radio
signal. This task involves error correction, spreading and signal modulation
and radio processing to the power amplifier.
When interacting with the RNC, the UE takes part in the signaling for con-
nection setup and release and execution of handovers. Encryption and de-
cryption of the communication also takes place with the RNC in the UE.
As the involvement of the CN, the UE delivers information about the current
location area. This is called mobility management. Other task is negotiation
over the quality of service (QoS) required for service demanded and bilateral
authentication. This also occurs between the UE and the CN.
2.5 Interfaces
For connection between RNCs, Iur interface specified by the 3GPP is used.
With this interface the possibilities of mobility between RNCs and handovers
between Node Bs connected to different RNCs, is supported.
The Iub interface is used in connections between the RNC and the Node B.
It has a radio network layer which provides signaling between the RNC and
Node B and signaling traffic between the RNC and the UE. Also a transport
layer exists, which provides the transport functionalities.
The Uu interface provides interconnection between the RNC and the UE via
the Node B and it is the radio path between the UE and the Node B.
The Iu interface is used for connections between the UTRAN and the CN. It
is divided in two different sub-interfaces: Iu-CS, Iu-PS. Iu-CS connects the
RNC to the MGW and the MSC, in other words it is used towards the circuit
switched domain. Iu-PS interface is used towards packet switched domain,
thus it connects the RNC to the SGSN.
As all of these elements and interfaces in the UMTS network must function
properly before the release to the market, it is essential for vendors to vali-
date the functionality and the stability of one. One of the steps for the valida-
tion is performance measurement, which is described in the following sec-
tion.
11
3 PERFORMANCE MEASUREMENT
This section describes the basic concept of the performance measurement
(PM) and the utilization of one in the UMTS network. The RNC counters,
which are the performance data used in the implementation part of the thesis
as described in section 6, are discussed as well.
Performance measurement could be defined as follows: “Performance
measurement represents a new stage of monitoring data. In the past moni-
toring networks meant decoding messages and filtering which messages be-
long to the same call. Single calls were analyzed and failures were often
only found by chance. Performance measurement is an effective means of
scanning the whole network at any time and systematically searching for er-
rors, bottlenecks and suspicious behavior” [4, p.1].
The first reason behind performance measurement in UMTS network is for
vendors to show the customers, in this case network operators that their sys-
tem is reliable, is working as expected and the quality of service it provides
is as promised. Furthermore vendors can provide PM data to the customers
who can use it to compare with other vendors’ systems. The other reason
and a very important one, is that the vendors themselves can identify how
their system is working, troubleshoot and optimize it and improve the system
based on the PM results. In other words PM is very important phase of test-
ing the final product in the R&D before it gets released.
By looking from the network operator’s perspective, PM is the only “tool” with
which the network operators can identify the problems occurring in the net-
work functionality. Furthermore, the network operators can compare the per-
formance of the network to the other vendors’ products and compare the
new releases of the network software to the old ones. For executing the PM
testing, network operators have their own software for collecting the PM
data, their own way of calculating the Key Performance Indicators (KPIs)
and the performing of the analysis.
In UMTS networks PM data can be collected from many parameters and
events occurring in different elements of the network. As different events can
correlate and output different measurement data, a measurement data can
12
correlate with other measurement data and thus output an infinite number of
permutations of measurement data.
Before going on how to define the events / parameters to measure, attention
must be drawn to some of the important benefits of measurements pointed
out by the U.S. Department of Energy:
1. To identify whether the vendor is meeting customer requirements. How
does vendor know that it is providing the services/products that its custom-
ers require?
2. To help the vendor understand its processes. That is to provide vendor
with information on what it knows or reveal what it doesn't know. Does ven-
dor know where the problems reside?
3. To ensure decisions made on the product are based on fact, not on emo-
tion. Are the decisions based upon well documented facts and figures or on
intuition and gut feelings?
4. To show the vendor where improvements need to be made. Where and
how the system can be improved?
5. To show if improvements actually happened.
6. To reveal problems that bias, emotion, and longevity cover up. If the pro-
duction has been done for a long time without measurements, there might
be incorrect assumptions that things are going well.
As we can see, without dependable measurements, intelligent decisions
cannot be made according to [5, p.7].
3.1 Defining the Measurement Targets
Since there is an infinite number of measurement data to measure, the
question is how to narrow the data available to something usable and how to
specify the targets (events, parameters…etc) to perform measurements on?
Figure 4 shows an example of how to define the targets by looking at the
subject from the perspective of a network operator.
13
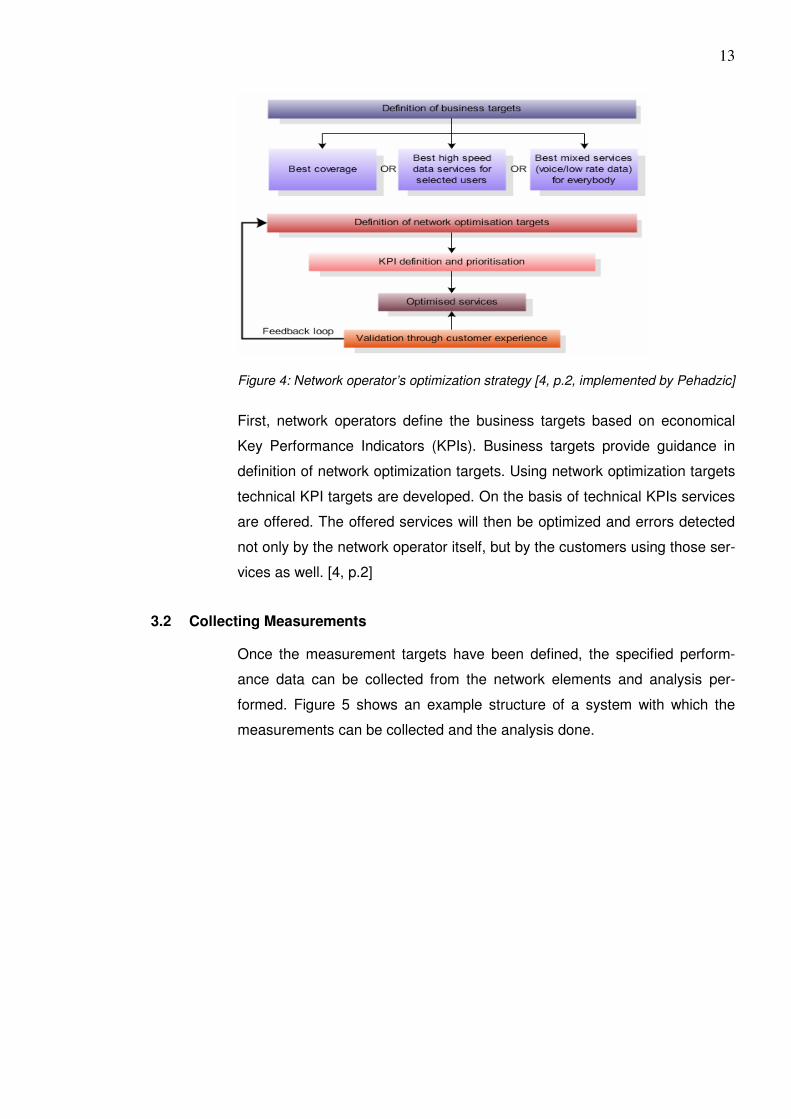
Figure 4: Network operator’s optimization strategy [4, p.2, implemented by Pehadzic]
First, network operators define the business targets based on economical
Key Performance Indicators (KPIs). Business targets provide guidance in
definition of network optimization targets. Using network optimization targets
technical KPI targets are developed. On the basis of technical KPIs services
are offered. The offered services will then be optimized and errors detected
not only by the network operator itself, but by the customers using those ser-
vices as well. [4, p.2]
3.2 Collecting Measurements
Once the measurement targets have been defined, the specified perform-
ance data can be collected from the network elements and analysis per-
formed. Figure 5 shows an example structure of a system with which the
measurements can be collected and the analysis done.
14
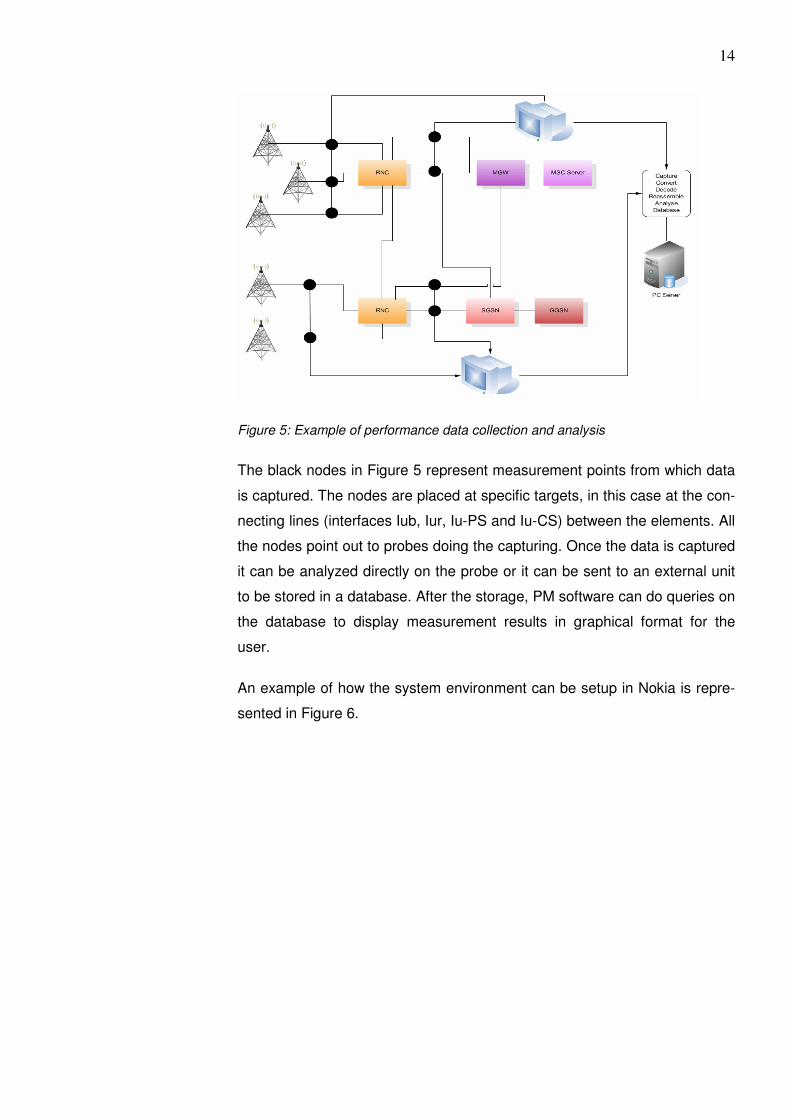
Figure 5: Example of performance data collection and analysis
The black nodes in Figure 5 represent measurement points from which data
is captured. The nodes are placed at specific targets, in this case at the con-
necting lines (interfaces Iub, Iur, Iu-PS and Iu-CS) between the elements. All
the nodes point out to probes doing the capturing. Once the data is captured
it can be analyzed directly on the probe or it can be sent to an external unit
to be stored in a database. After the storage, PM software can do queries on
the database to display measurement results in graphical format for the
user.
An example of how the system environment can be setup in Nokia is repre-
sented in Figure 6.
15
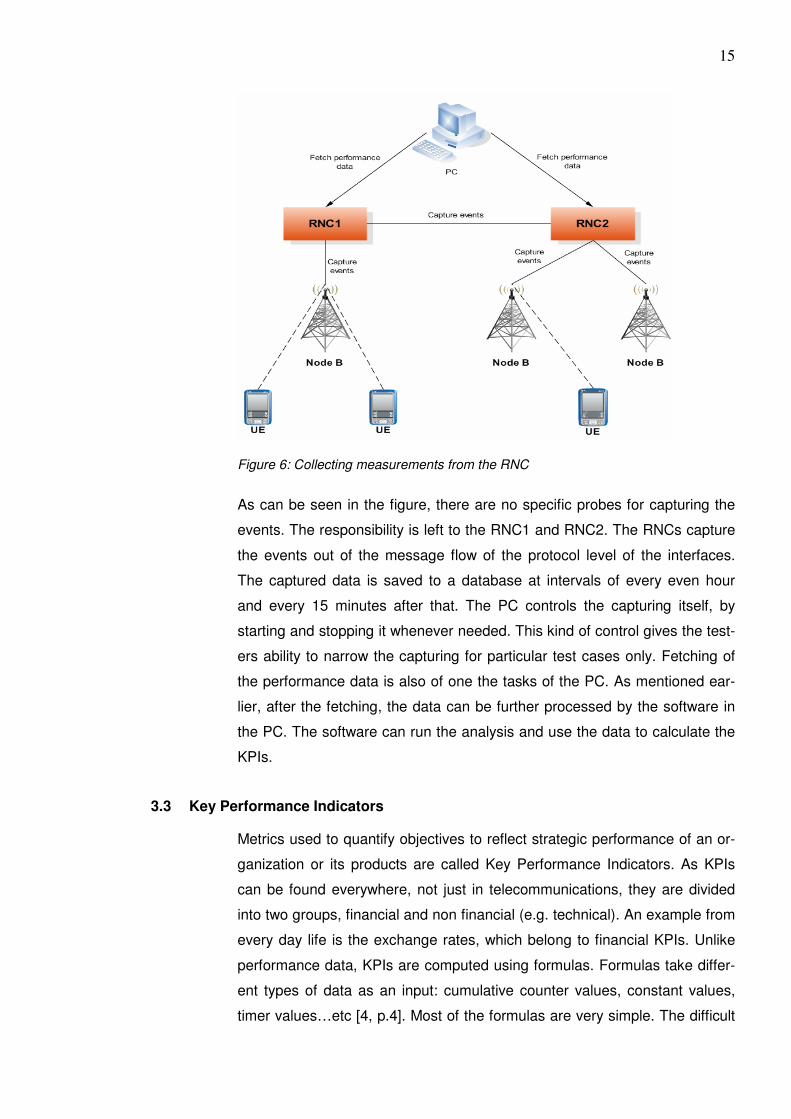
Figure 6: Collecting measurements from the RNC
As can be seen in the figure, there are no specific probes for capturing the
events. The responsibility is left to the RNC1 and RNC2. The RNCs capture
the events out of the message flow of the protocol level of the interfaces.
The captured data is saved to a database at intervals of every even hour
and every 15 minutes after that. The PC controls the capturing itself, by
starting and stopping it whenever needed. This kind of control gives the test-
ers ability to narrow the capturing for particular test cases only. Fetching of
the performance data is also of one the tasks of the PC. As mentioned ear-
lier, after the fetching, the data can be further processed by the software in
the PC. The software can run the analysis and use the data to calculate the
KPIs.
3.3 Key Performance Indicators
Metrics used to quantify objectives to reflect strategic performance of an or-
ganization or its products are called Key Performance Indicators. As KPIs
can be found everywhere, not just in telecommunications, they are divided
into two groups, financial and non financial (e.g. technical). An example from
every day life is the exchange rates, which belong to financial KPIs. Unlike
performance data, KPIs are computed using formulas. Formulas take differ-
ent types of data as an input: cumulative counter values, constant values,
timer values…etc [4, p.4]. Most of the formulas are very simple. The difficult
16
part is the way of filtering the performance data to feed as an input to the
formula.
RNC Counters
The KPI values, with which different functionality of an UMTS network can
be evaluated, are calculated using the counters which are maintained in the
RNC. A counter indicates how many times a certain function has been exe-
cuted and how many times it succeeded. Performance data that the RNC
maintains is presented in the form of counters. The RNC maintains thou-
sands of counters. To make the maintenance, readability and analyses of
the counters and at the same time the calculation of the KPIs easier, the
counters are bound to different measurement groups predefined by the ven-
dor. They also belong to a particular object from which the measurable func-
tion initiates or it belongs to. The object refers to a network element, e.g. the
Node B.
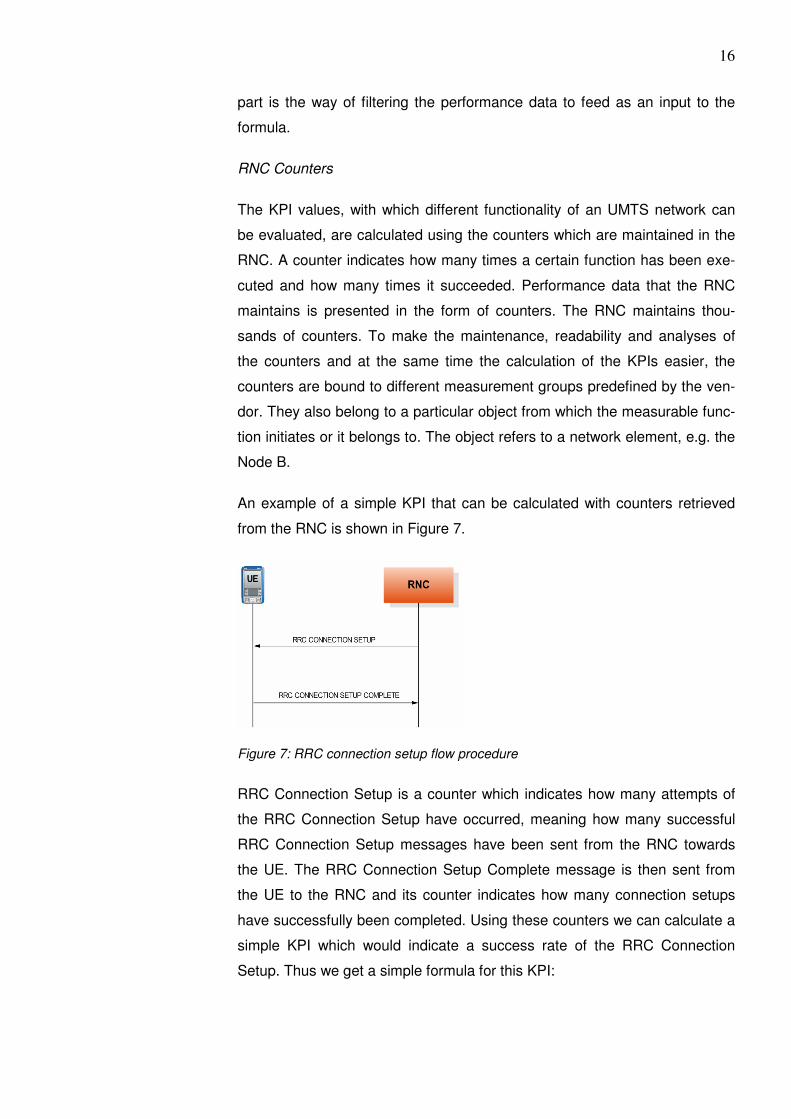
An example of a simple KPI that can be calculated with counters retrieved
from the RNC is shown in Figure 7.
Figure 7: RRC connection setup flow procedure
RRC Connection Setup is a counter which indicates how many attempts of
the RRC Connection Setup have occurred, meaning how many successful
RRC Connection Setup messages have been sent from the RNC towards
the UE. The RRC Connection Setup Complete message is then sent from
the UE to the RNC and its counter indicates how many connection setups
have successfully been completed. Using these counters we can calculate a
simple KPI which would indicate a success rate of the RRC Connection
Setup. Thus we get a simple formula for this KPI:
17
�
�
RRC Connection Setup Complete SuccessfulRRC Connection Setup Success Rate =
RRC Connection Setup
However, performance measurement within the RNC does not always nec-
essarily mean performing tests and then calculating KPIs. Single counters
can also be used to indicate a flawless functionality of the RNC, e.g. if there
are five UEs which make a voice call at the same time, the value of the RRC
Connection Setup counter must be equal to the number of voice calls, i.e. 5.
3.4 3GPP Definitions
When it comes to defining the measurement targets the 3GPP definitions of
performance data is a good start. However, the 3GPP has not defined any
performance KPIs at all. The definitions cover two major groups of perform-
ance data: radio-related measurements and protocol event counters.
Performance measurement is covered in the 3GPP 32.40X series docu-
ments. Documents cover two areas of performance measurement. One area
is the administration one, where the measurement procedures and manag-
ing of the measurement tasks are described. Second area deals with meas-
urement type definition and measurement result generation [6].
The 3GPP documents give a good general picture on how to store and
transport performance data already available. However they do not imply
how to get performance data or how to compute and analyze it.
A part of performance measurement, i.e. counter testing, is done manually in
Nokia. While definition of the measurement targets itself cannot be auto-
mated, the process of collecting the measurements, analysis and calculation
of the KPIs can be. Next section provides information about the automation
and the main concepts associated with the Nokia Automation System.
18
4 AUTOMATION OF TESTING
The counter testing described in section 2 is performed solely in a manual
manner by the customer. The testing needed to be automated and imple-
mented as a new feature for the Nokia Automation System. In this section
the concept of the automated testing is introduced.
As hardware and software evolve fast and get more and more complex
manual testing becomes less effective. This phenomenal growth is largely
attributable to increases in technology and the pressure created on the test-
ing effort by the improved productivity of development tools and languages.
For example, it could take several weeks to manually test a new software
feature that took developers only a week to design and update. But with
automation doing regression testing, same could take just couple of days.
This is why more and more vendors are taking test automation tools into
use.
When implemented the right way, by following the procedures and specifica-
tions correctly, not only productivity can be increased and costs reduced, but
quality and flexibility of the developing process as well. Unless careful and
detailed planning is used the expensive automation tool might end up being
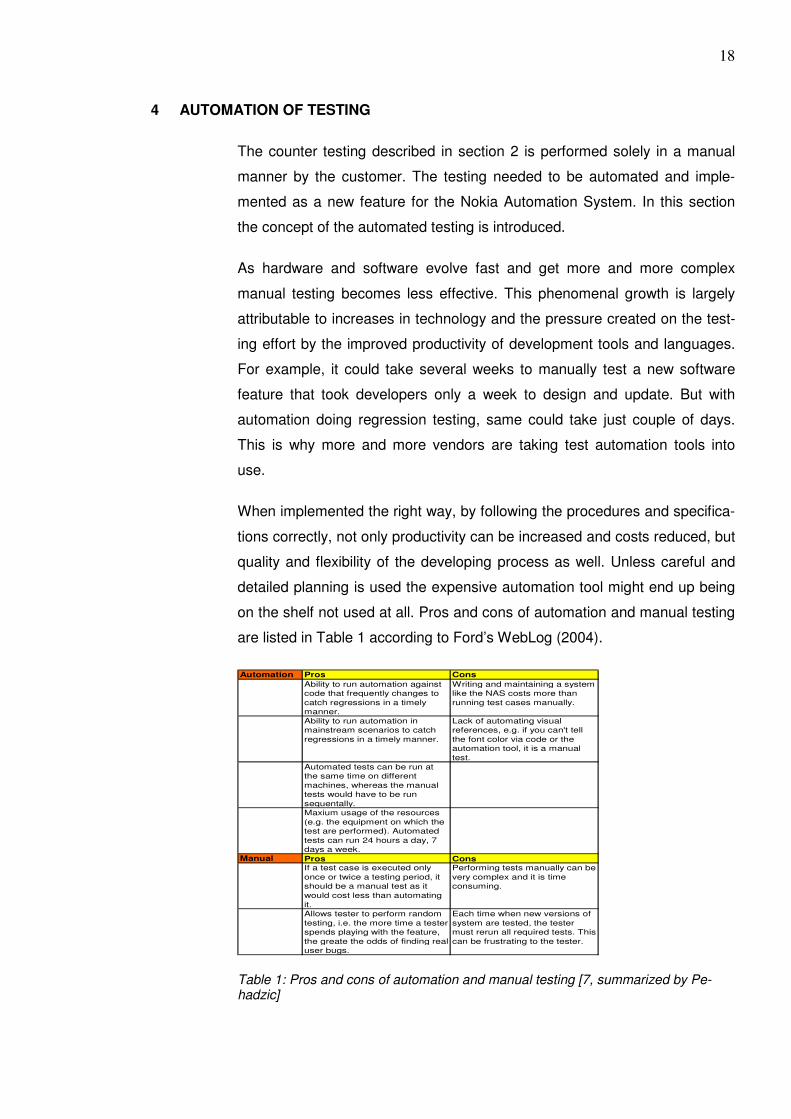
on the shelf not used at all. Pros and cons of automation and manual testing
are listed in Table 1 according to Ford’s WebLog (2004).
Automation Pros ConsAbility to run automation against
code that frequently changes to
catch regressions in a timely
manner.
Writing and maintaining a system
like the NAS costs more than
running test cases manually.
Ability to run automation in
mainstream scenarios to catch
regressions in a timely manner.
Lack of automating visual
references, e.g. if you can't tell
the font color via code or the
automation tool, it is a manual
test.
Automated tests can be run at
the same time on different
machines, whereas the manual
tests would have to be run
sequentally.
Maxium usage of the resources
(e.g. the equipment on which the
test are performed). Automated
tests can run 24 hours a day, 7
days a week.
Manual Pros ConsIf a test case is executed only
once or twice a testing period, it
should be a manual test as it
would cost less than automating
it.
Performing tests manually can be
very complex and it is time
consuming.
Allows tester to perform random
testing, i.e. the more time a tester
spends playing with the feature,
the greate the odds of finding real
user bugs.
Each time when new versions of
system are tested, the tester
must rerun all required tests. This
can be frustrating to the tester.
Table 1: Pros and cons of automation and manual testing [7, summarized by Pe-hadzic]
19
Based on these pros and cons we can make a decision on whether to auto-
mate a test case or not. If the test case is automatable, it will cost a little to
automate it, the importance of the test case is high and it must be tested
whenever possible (often) then the test case should be automated. If the test
case is automatable and it will cost a lot to automate it, the importance is
high and it needs to be tested regularly, it should be automated. If it is not
possible to automate the test case or if it needs to be tested once in a while
then the test case should not be automated.
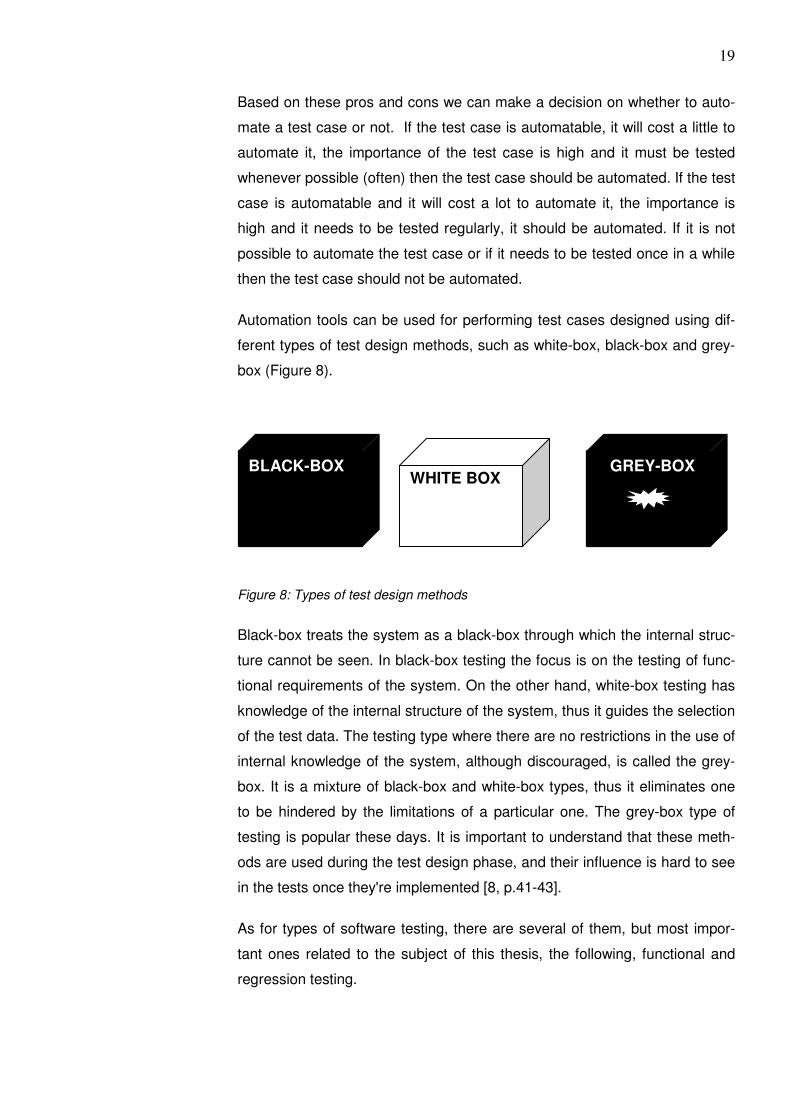
Automation tools can be used for performing test cases designed using dif-
ferent types of test design methods, such as white-box, black-box and grey-
box (Figure 8).
Figure 8: Types of test design methods
Black-box treats the system as a black-box through which the internal struc-
ture cannot be seen. In black-box testing the focus is on the testing of func-
tional requirements of the system. On the other hand, white-box testing has
knowledge of the internal structure of the system, thus it guides the selection
of the test data. The testing type where there are no restrictions in the use of
internal knowledge of the system, although discouraged, is called the grey-
box. It is a mixture of black-box and white-box types, thus it eliminates one
to be hindered by the limitations of a particular one. The grey-box type of
testing is popular these days. It is important to understand that these meth-
ods are used during the test design phase, and their influence is hard to see
in the tests once they're implemented [8, p.41-43].
As for types of software testing, there are several of them, but most impor-
tant ones related to the subject of this thesis, the following, functional and
regression testing.
BLACK-BOX WHITE BOX
GREY-BOX
20
Functional testing means validating that a product conforms to its specifi-
cations and that it correctly performs all its required functions. This entails a
series of tests which perform a feature by feature validation of behavior, us-
ing a wide range of normal and erroneous input data. Functional testing can
be performed on an automated or manual basis using black box or white box
methodologies.
The second, regression testing, allows a consistent, repeatable validation
of each new release of a product. It ensures that reported product defects
have been corrected for each new release and that no new quality problems
were introduced in the maintenance process. Though regression testing can
be performed manually an automated test suite is often used to reduce the
time and resources needed to perform the required testing.
The Nokia Automation System favors the black-box type of test case design
and it can be used for execution of both functional and regression testing.
As for conclusion, the manual testing will always be present, no matter how
efficient automation becomes. But if some of the testing can be automated, it
is a valuable addition, as it saves testing time and is cost-effective.
21
5 NOKIA AUTOMATION SYSTEM
This section describes the architecture and the functionality of the Nokia
Automation System (NAS). NAS is the automation tool that the implementa-
tion of the counter testing feature is implemented on in this thesis. The fea-
ture is implemented to the NAS core and a new tool is added to its Toolkit,
as described in section 6.
NAS is a highly flexible system for executing test steps automatically. The
system is multi-platform, distributed, scalable and modular. It is used for dif-
ferent test applications such as hardware tests, software tests, Layer 1 per-
formance tests, PC simulations, functional tests, application tests, black or
white box tests, tuning, flashing etc.
NAS is also an open and lightweight test platform. The openness allows de-
velopers to do almost whatever they want, as long as few simple rules and
the architecture are obeyed. The core of the NAS is programmed using Perl
programming language, but it is not limited to it. Thus the developers are
granted with freedom and flexibility in design and implementation while not
having to focus on the basic test case trivialities. The core is based on the
Service Oriented Architecture (SOA). The SOA is essentially a collection of
services which communicate with each other. The services are available re-
sources on a network that fulfill a well defined task in the whole system. In
case one service crashes it will not bring the whole system down. In SOA
environment, communication happens with clear open standardized mes-
sages that every component understands, in case of the NAS it is using the
SOAP technology described in section 5.
The NAS platform enables and eases the construction of fully customized
test systems. It is possible to control any test application, as long as it pro-
vides some kind of interface.
Business wise it enables cooperation and sharing between projects. This in-
creases effectiveness and efficiency, decreases overlapping work and en-
ables interoperability. Due to high modularity it is possible for projects to
work independently while sharing functionality.
22
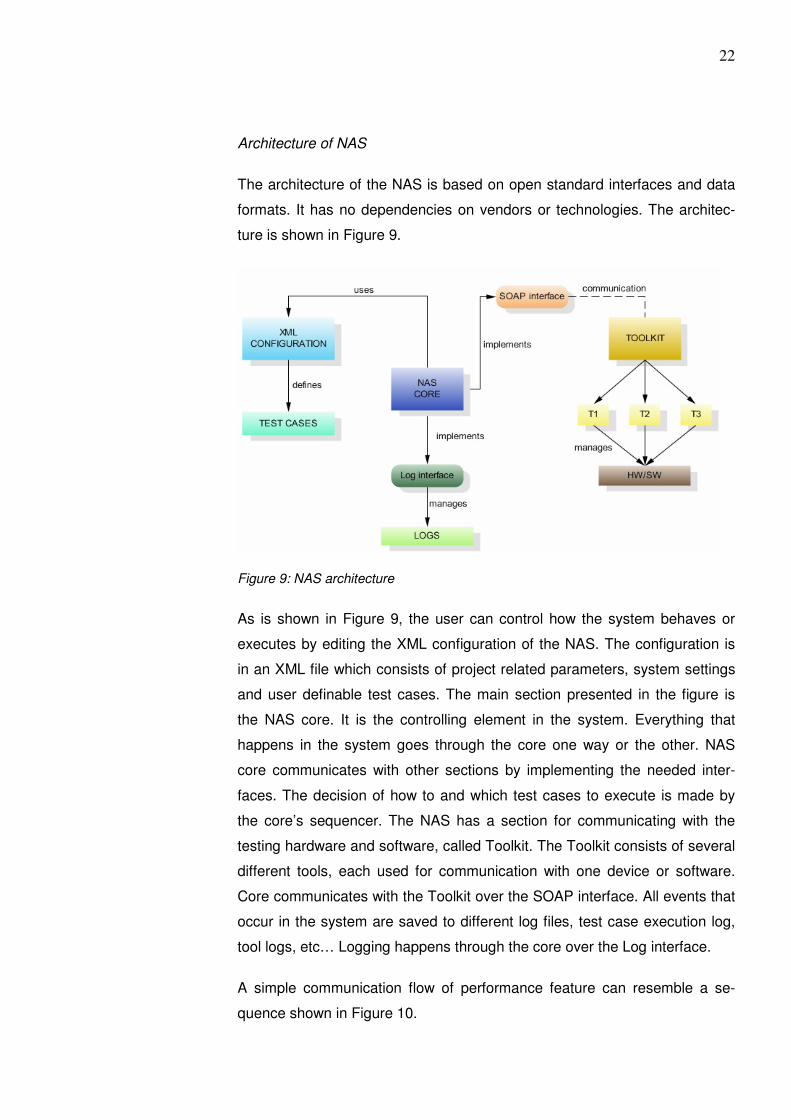
Architecture of NAS
The architecture of the NAS is based on open standard interfaces and data
formats. It has no dependencies on vendors or technologies. The architec-
ture is shown in Figure 9.
Figure 9: NAS architecture
As is shown in Figure 9, the user can control how the system behaves or
executes by editing the XML configuration of the NAS. The configuration is
in an XML file which consists of project related parameters, system settings
and user definable test cases. The main section presented in the figure is
the NAS core. It is the controlling element in the system. Everything that
happens in the system goes through the core one way or the other. NAS
core communicates with other sections by implementing the needed inter-
faces. The decision of how to and which test cases to execute is made by
the core’s sequencer. The NAS has a section for communicating with the
testing hardware and software, called Toolkit. The Toolkit consists of several
different tools, each used for communication with one device or software.
Core communicates with the Toolkit over the SOAP interface. All events that
occur in the system are saved to different log files, test case execution log,
tool logs, etc… Logging happens through the core over the Log interface.
A simple communication flow of performance feature can resemble a se-
quence shown in Figure 10.
23
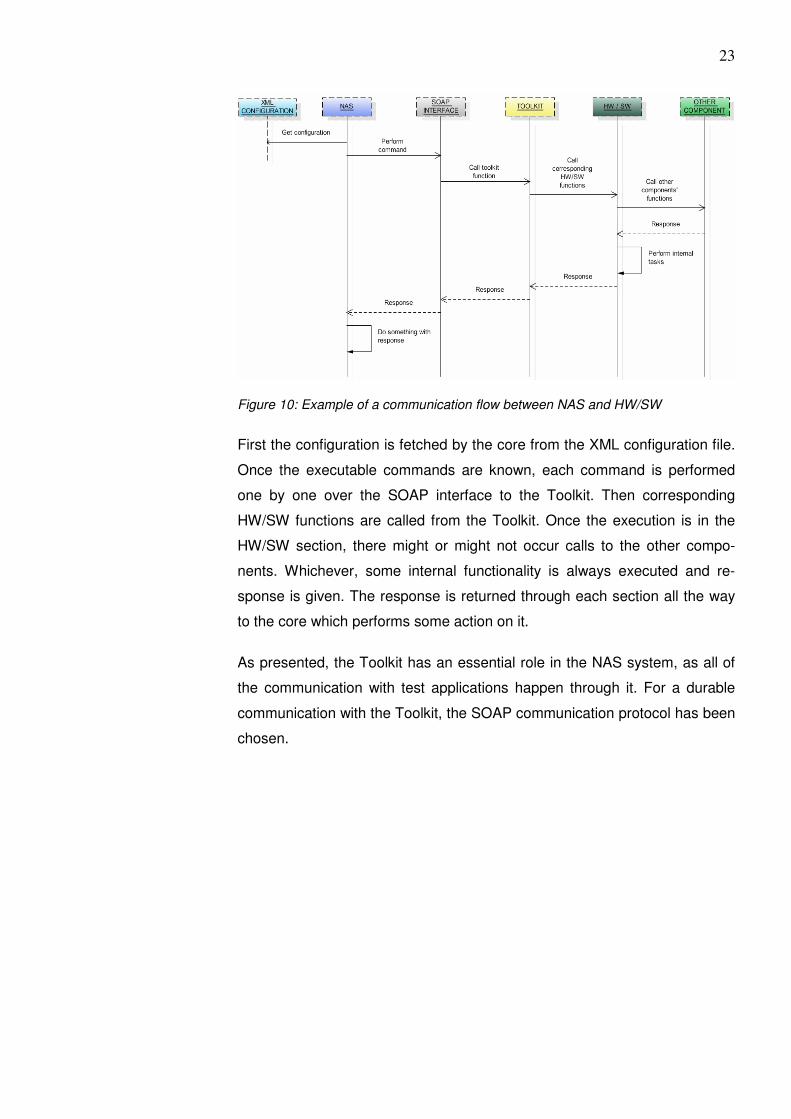
Figure 10: Example of a communication flow between NAS and HW/SW
First the configuration is fetched by the core from the XML configuration file.
Once the executable commands are known, each command is performed
one by one over the SOAP interface to the Toolkit. Then corresponding
HW/SW functions are called from the Toolkit. Once the execution is in the
HW/SW section, there might or might not occur calls to the other compo-
nents. Whichever, some internal functionality is always executed and re-
sponse is given. The response is returned through each section all the way
to the core which performs some action on it.
As presented, the Toolkit has an essential role in the NAS system, as all of
the communication with test applications happen through it. For a durable
communication with the Toolkit, the SOAP communication protocol has been
chosen.
24
6 GSOAP AND THE SOAP PROTOCOL
In this section the technology used for communication between Nokia Auto-
mation System and its Toolkit is described. The SOAP protocol is the foun-
dation of the gSOAP tool which is used to develop the SOAP based Ana-
lyzer Tool application. The tool uses SOAP protocol to communicate with the
Nokia Automation System, as described in section 6.
Software developers have relied on calling procedures to provide the
needed functionality. These and related procedures can be collected into
groups, i.e. objects. The objects can be created in a way that they can be
shared between different systems and different developers. Usually the ob-
jects are platform specific, which prevents different operating system specific
software to use from using the same object. Sharing them across different
networks is also very difficult. Several solutions for communication with and
exchanging of these objects were introduced. Distributed Component Object
Model (DCOM) and Common Object Request Broker Architecture (CORBA)
are the most known. However, they had some weak points, e.g. usage of
special ports to transmit data. The problem with this is that most firewalls will
block special ports. The best way for communication is port 80, which is not
usually blocked by the firewalls, since it is the default port used by the HTTP
protocol, i.e. the WWW servers. Opening of such special ports might pose to
security risks.
The solution for this is the SOAP protocol. SOAP provides a way to commu-
nicate between applications running on different operating systems, with dif-
ferent technologies and programming languages and it is also firewall-
friendly. The foundations of SOAP are the Extensible Markup Language and
HTTP protocol. HTTP is usually used as the transport protocol but other pro-
tocols are supported as well. The objects transferred between systems are
XML-encoded serialized data. [9, p.8-23]
SOAP offers a simple message structure in which the content can be any
type of XML-serialized data. The most usual use of the SOAP protocol is the
implementation of the Remote Procedure Call -style (RPCs) functions be-
tween the client and the server.
25
SOAP protocol can act as the foundation to the Web Services protocol
stack. This means that in the contents of the SOAP message, other Web
Services protocols, such as Web Services Description Language (WSDL)
and Universal Description, Discovery and Integration (UDDI), are transferred
as well.
Web service is a software system designed to support interoperable Ma-
chine to Machine interaction over a network. Web services are frequently
just Web Application Programming Interfaces (APIs) that can be accessed
over a network, such as the Internet, and executed on a remote system
hosting the requested services. [10]
WSDL is an XML-based Web services description language. It consists of
the following components [11]:
• message: describes the message sent or received by a web service
• portType: groups the messages of the web service into logical opera-
tions. Operation consists of several related messages. It describes
the real interface of the web service towards the user.
• binding: describes the interface binding to the used communications
protocol and format. That is, it defines the protocol and the format in
use in the transferring of the messages.
• service: defines the endpoints for the web service, i.e. the ports.
There can be one or more ports. Port stands for the service port of
the network address and the protocol and the format used by the ser-
vice.
• types: defines the data types used by the messages in terms of the
XML schema language.
UDDI is a platform-independent, XML-based registry for businesses world-
wide to list themselves on the Internet. UDDI enables businesses to publish
service listings and discover each other and define how the services or soft-
ware applications interact over the Internet.
The process of a Web service is shown in Figure 11.
26
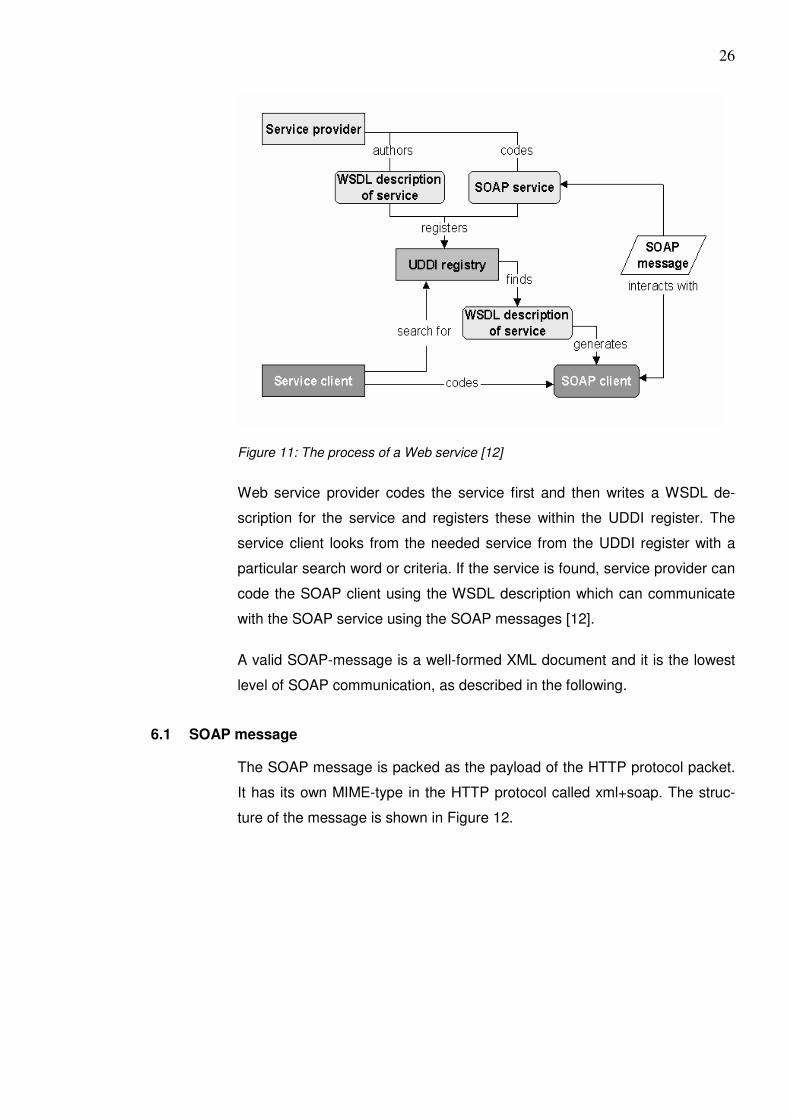
Figure 11: The process of a Web service [12]
Web service provider codes the service first and then writes a WSDL de-
scription for the service and registers these within the UDDI register. The
service client looks from the needed service from the UDDI register with a
particular search word or criteria. If the service is found, service provider can
code the SOAP client using the WSDL description which can communicate
with the SOAP service using the SOAP messages [12].
A valid SOAP-message is a well-formed XML document and it is the lowest
level of SOAP communication, as described in the following.
6.1 SOAP message
The SOAP message is packed as the payload of the HTTP protocol packet.
It has its own MIME-type in the HTTP protocol called xml+soap. The struc-
ture of the message is shown in Figure 12.
27
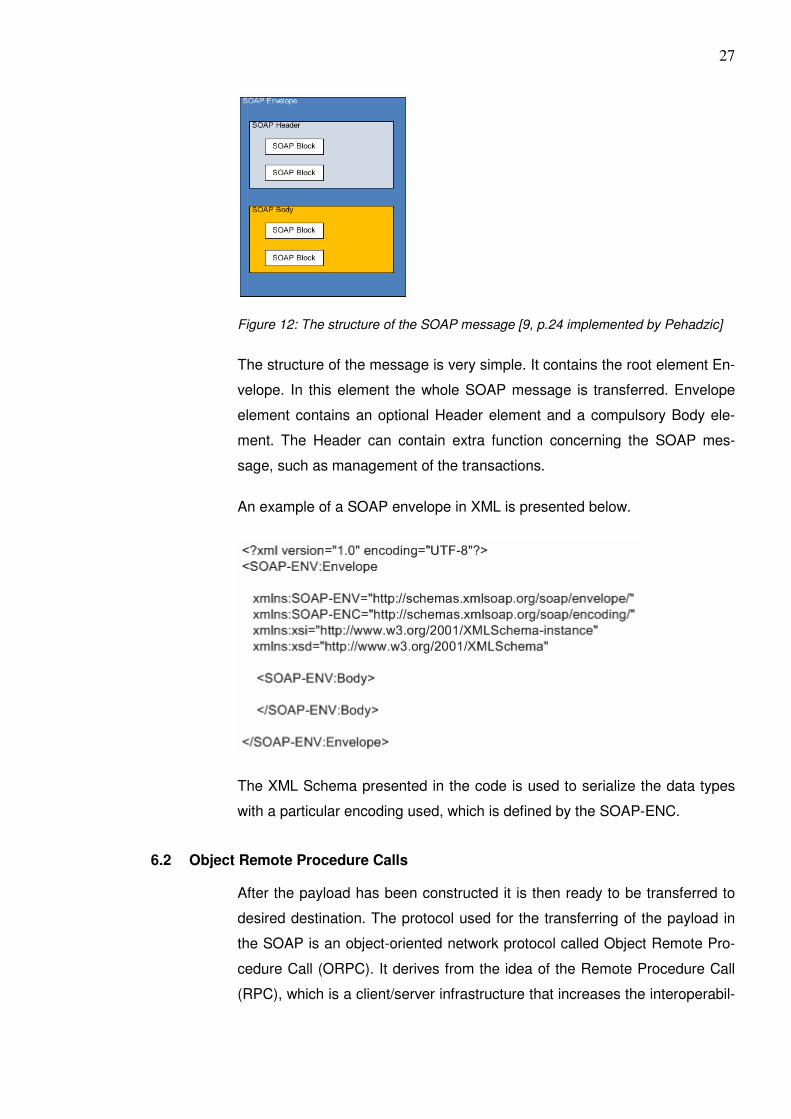
Figure 12: The structure of the SOAP message [9, p.24 implemented by Pehadzic]
The structure of the message is very simple. It contains the root element En-
velope. In this element the whole SOAP message is transferred. Envelope
element contains an optional Header element and a compulsory Body ele-
ment. The Header can contain extra function concerning the SOAP mes-
sage, such as management of the transactions.
An example of a SOAP envelope in XML is presented below.
The XML Schema presented in the code is used to serialize the data types
with a particular encoding used, which is defined by the SOAP-ENC.
6.2 Object Remote Procedure Calls
After the payload has been constructed it is then ready to be transferred to
desired destination. The protocol used for the transferring of the payload in
the SOAP is an object-oriented network protocol called Object Remote Pro-
cedure Call (ORPC). It derives from the idea of the Remote Procedure Call
(RPC), which is a client/server infrastructure that increases the interoperabil-
28
ity, portability, and flexibility of an application by allowing the application to
be distributed over multiple heterogeneous platforms. That is, the program-
mer would write essentially the same code whether the subroutine is local to
the executing program, or remote.
To reference a particular remote object over the network SOAP requires fol-
lowing information:
• Transport protocol: protocol used for transferring the SOAP payload
• Port number: the port number on which the object is served on
• IP/Host address: this is the machine where the remote object resides
• Object identifier: the object
• Interface and method identifier: interface is the URI of the service and
method is the method name being called
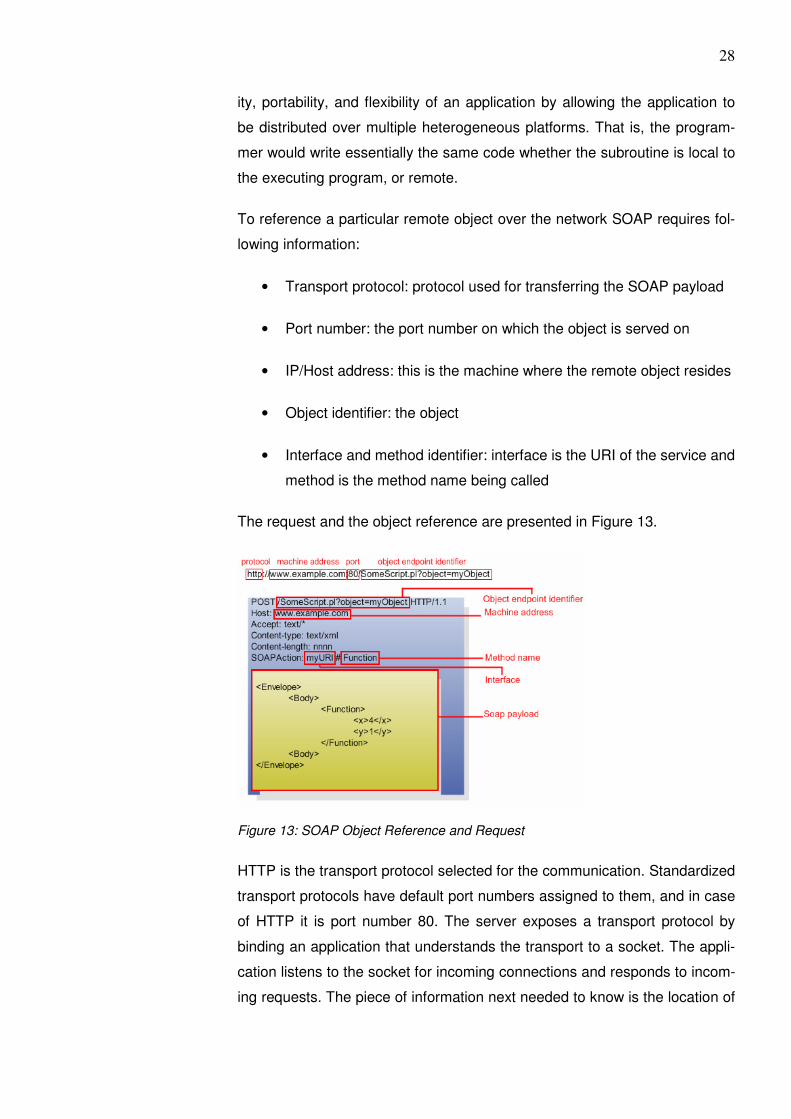
The request and the object reference are presented in Figure 13.
Figure 13: SOAP Object Reference and Request
HTTP is the transport protocol selected for the communication. Standardized
transport protocols have default port numbers assigned to them, and in case
of HTTP it is port number 80. The server exposes a transport protocol by
binding an application that understands the transport to a socket. The appli-
cation listens to the socket for incoming connections and responds to incom-
ing requests. The piece of information next needed to know is the location of
29
the remote machine. The remote machine is determined by the host, which
is naturally resolved to an IP address. The port number uniquely identifies
the service that will execute the Function on behalf of the client. In this case,
the port could have been left out, since it is a HTTP default port anyway, as
mentioned earlier. Then the server needs the information about the object
endpoint identifier. Its purpose is to identify the object on the server and can
be used by the server to execute a server-side script which actually creates
or obtains the object. The reference to the interface and the method which is
to be executed on the object is placed in the HTTP header field SOAPAction
[9, p.181].
6.3 Introduction to gSOAP
The gSOAP tools provide a SOAP/XML-to-C/C++ language binding to facili-
tate the development of SOAP/XML Web services and client application in C
and C++. Most toolkits for C++ Web services adopt a SOAP-centric view
and offer APIs that require the use of class libraries for SOAP-specific data
structures. This often forces a user to adapt the application logic to these li-
braries. In contrast, gSOAP provides a C/C++ transparent SOAP API
through the use of compiler technology that hides irrelevant SOAP-specific
details from the user. The gSOAP stub and skeleton compiler automatically
maps native and user-defined C and C++ data types to semantically equiva-
lent XML data types and vice-versa. As a result, full SOAP interoperability is
achieved with a simple API relieving the user from the burden of SOAP de-
tails, thus enabling him or her to concentrate on the application-essential
logic.
The gSOAP compiler enables the integration of (legacy) C/C++ and Fortran
codes (through a Fortran to C interface), embedded systems, and real-time
software in SOAP applications that share computational resources and in-
formation with other SOAP applications, possibly across different platforms,
language environments, and disparate organizations located behind firewalls
[13].
6.4 Developing gSOAP Applications
Developing of a Web Service application, is simple as running the gSOAP
compiler on a C/C++ header file that contains the function prototypes of the
application functions wanted to be exposed as SOAP/XML Web Service
30
methods. The compiler produces the skeleton routines to expose the appli-
cation as a Web Service. The compiler also generates a WSDL file that can
be readily used to advertise the Web Service.
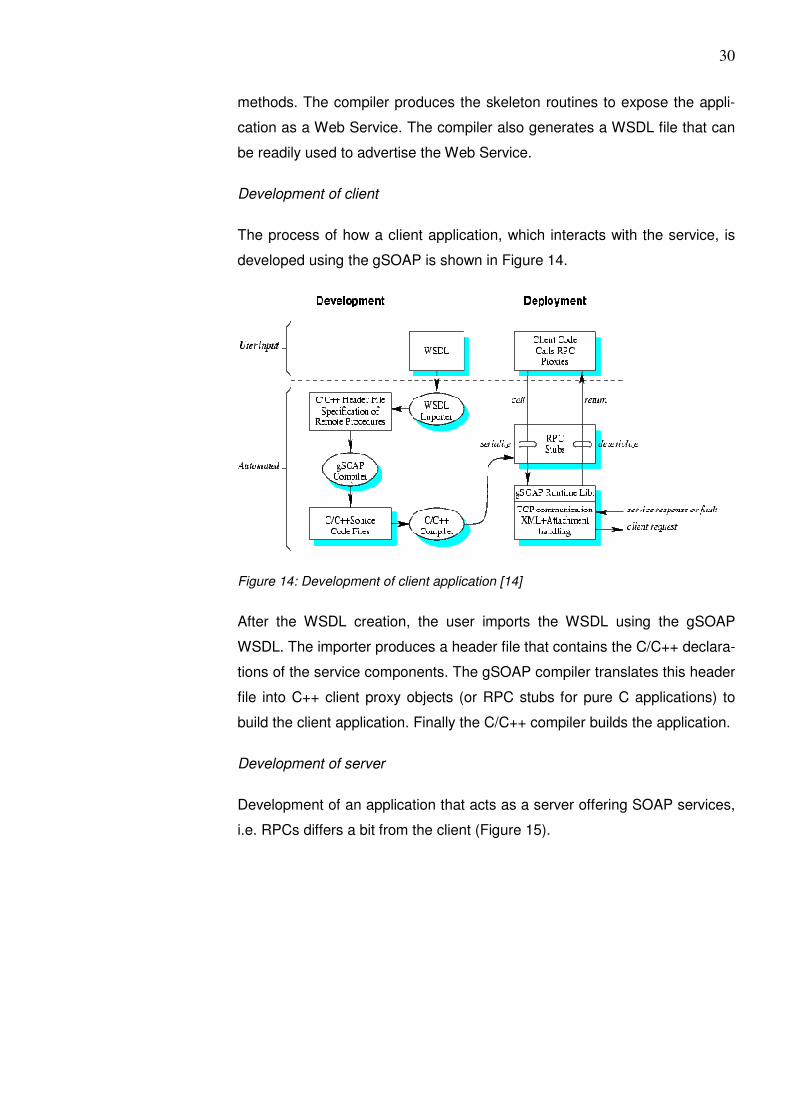
Development of client
The process of how a client application, which interacts with the service, is
developed using the gSOAP is shown in Figure 14.
Figure 14: Development of client application [14]
After the WSDL creation, the user imports the WSDL using the gSOAP
WSDL. The importer produces a header file that contains the C/C++ declara-
tions of the service components. The gSOAP compiler translates this header
file into C++ client proxy objects (or RPC stubs for pure C applications) to
build the client application. Finally the C/C++ compiler builds the application.
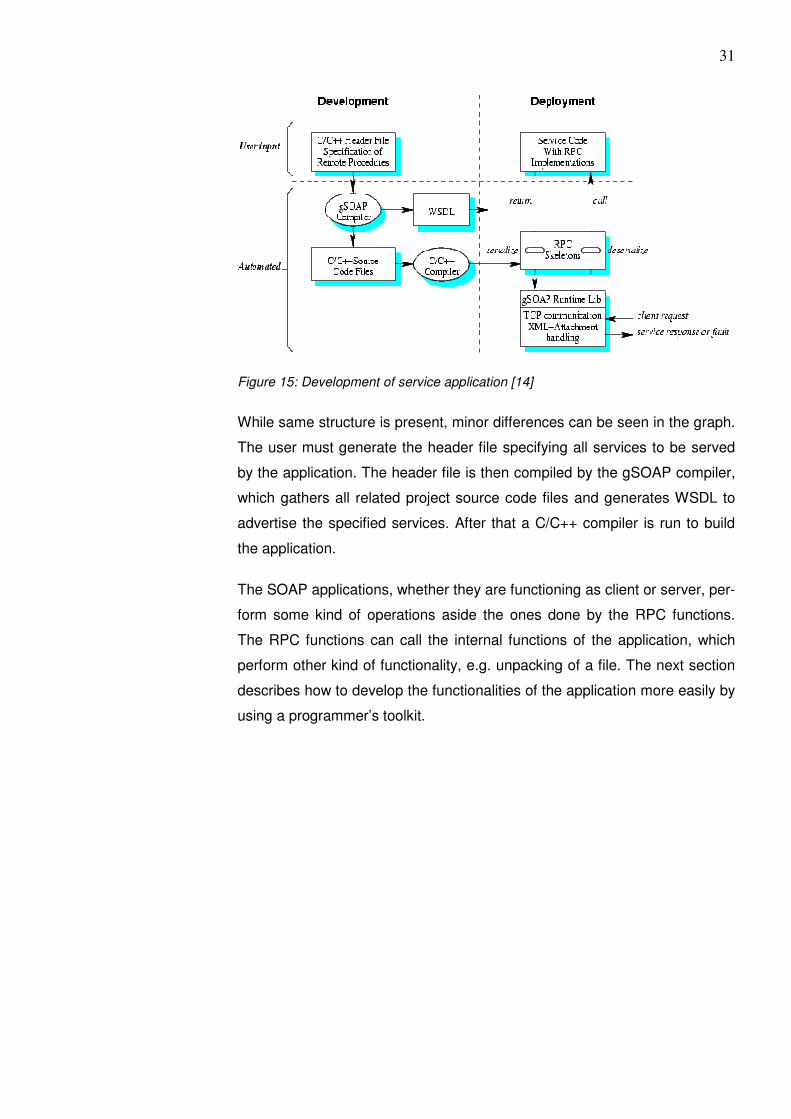
Development of server
Development of an application that acts as a server offering SOAP services,
i.e. RPCs differs a bit from the client (Figure 15).
31
Figure 15: Development of service application [14]
While same structure is present, minor differences can be seen in the graph.
The user must generate the header file specifying all services to be served
by the application. The header file is then compiled by the gSOAP compiler,
which gathers all related project source code files and generates WSDL to
advertise the specified services. After that a C/C++ compiler is run to build
the application.
The SOAP applications, whether they are functioning as client or server, per-
form some kind of operations aside the ones done by the RPC functions.
The RPC functions can call the internal functions of the application, which
perform other kind of functionality, e.g. unpacking of a file. The next section
describes how to develop the functionalities of the application more easily by
using a programmer’s toolkit.
32
7 WXWIDGETS
In this section the basic concept behind wxWidgets is introduced. wxWidgets
is an open source, cross-platform programmer’s toolkit, i.e. a library of basic
elements for building a graphical user interface (GUI) and console applica-
tions. The two wxWidgets classes, wxThread and wxSocket that are used for
developing some of the new functionality in Nokia Automation System, are
discussed as well.
wxWidgets is a programmer’s toolkit for writing desktop or mobile applica-
tions with graphical user interfaces (GUIs) or basic console ones. It is a
framework in a sense that it provides the default application behavior. The
wxWidgets library consists of classes and functions for the programmer to
use and customize the way he or she wants. By using wxWidgets it is easier
to write applications that do all the usual things the modern applications do,
such as showing the windows that contain standard controls, drawing of im-
ages and corresponding to the input of mouse, keyboard or other sources.
While having great features for the GUI development, it provides also fea-
tures that are useful for many aspects of application development. wx-
Widgets provides classes for files and streams, multiple threads, application
settings, interprocess communication, online help, database access and
more.
One outstanding feature of the wxWidgets development toolkit is that it is
multi-platform. It has an API that is the same on all supported platforms. This
enables, for example, writing of application on Windows and with very few
changes, if any, recompiling it on Linux. This is a huge cost benefit, because
the application does not need to be completely rewritten for each platform,
thus it is not needed to learn a different API for different platforms. Further-
more, as the computing landscape changes, wxWidgets changes with it, al-
lowing the application to be ported to the latest and greatest systems sup-
porting the newest features.
wxWidgets is an open source project. This means that it costs nothing to use
wxWidgets. Downside are of course the bugs in the toolkit, however they
can be always fixed by the developer, by changing the source code.
33
Many aspects of application development that might otherwise have to be
coded have been encapsulated in classes that can be plugged directly into
the code [15, p.1-7].
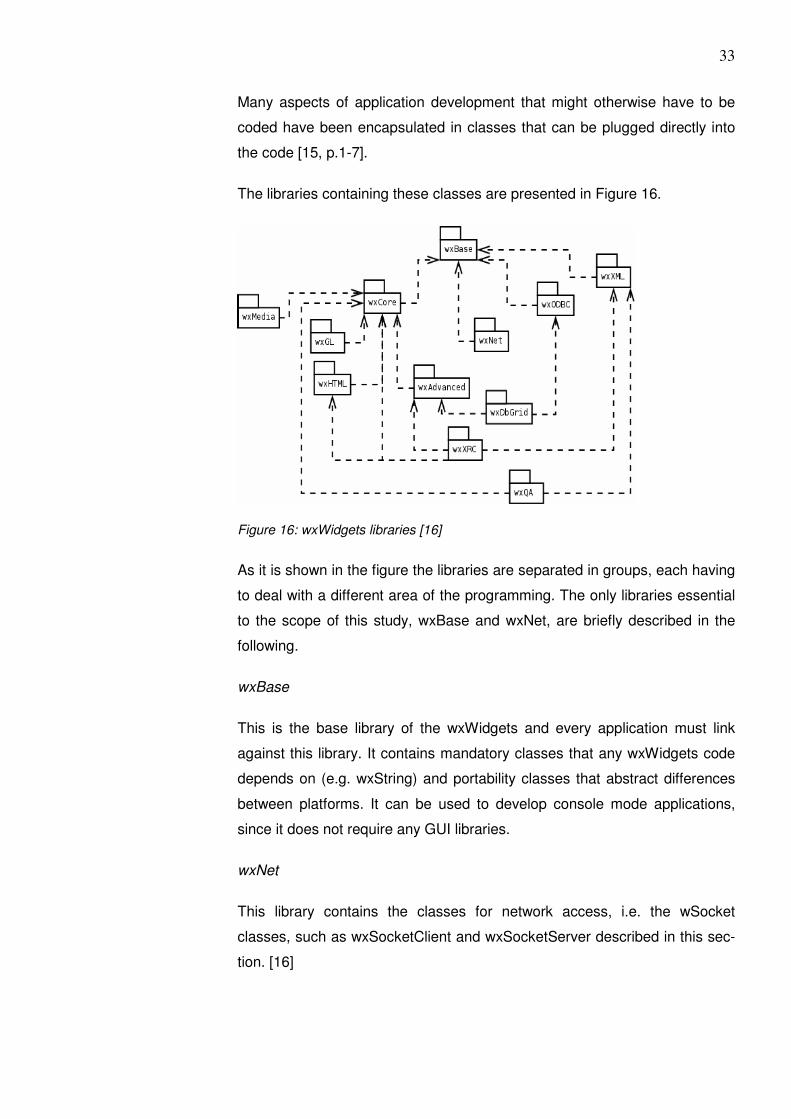
The libraries containing these classes are presented in Figure 16.
Figure 16: wxWidgets libraries [16]
As it is shown in the figure the libraries are separated in groups, each having
to deal with a different area of the programming. The only libraries essential
to the scope of this study, wxBase and wxNet, are briefly described in the
following.
wxBase
This is the base library of the wxWidgets and every application must link
against this library. It contains mandatory classes that any wxWidgets code
depends on (e.g. wxString) and portability classes that abstract differences
between platforms. It can be used to develop console mode applications,
since it does not require any GUI libraries.
wxNet
This library contains the classes for network access, i.e. the wSocket
classes, such as wxSocketClient and wxSocketServer described in this sec-
tion. [16]
34
7.1 wxThread
Most of the time, the event-driven nature of GUI programming maintains a
good illusion of handling multiple tasks simultaneously. Redrawing a window
usually takes a tiny fraction of a second, and user input can be handled rap-
idly. However, there are times when a task cannot easily be broken down in-
to small chunks handled by a single thread, and this is where multithreaded
programming becomes useful.
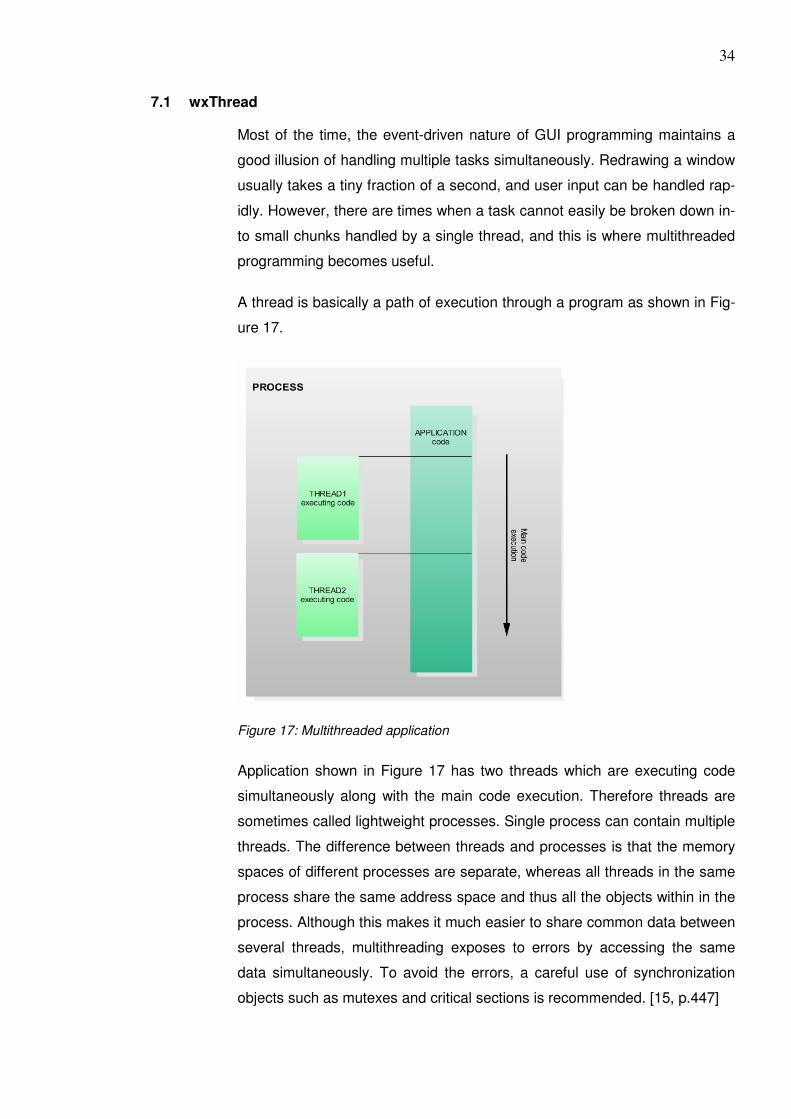
A thread is basically a path of execution through a program as shown in Fig-
ure 17.
Figure 17: Multithreaded application
Application shown in Figure 17 has two threads which are executing code
simultaneously along with the main code execution. Therefore threads are
sometimes called lightweight processes. Single process can contain multiple
threads. The difference between threads and processes is that the memory
spaces of different processes are separate, whereas all threads in the same
process share the same address space and thus all the objects within in the
process. Although this makes it much easier to share common data between
several threads, multithreading exposes to errors by accessing the same
data simultaneously. To avoid the errors, a careful use of synchronization
objects such as mutexes and critical sections is recommended. [15, p.447]
35
When used properly, multithreading enables the programmer to simplify the
application architecture by decoupling the user interface from the “real work.”
Note that this won’t result in faster applications unless the computer has
multiple processors, but the user interface will be more responsive.
wxWidgets provides both a thread class and the necessary synchronization
objects, such as mutexes and critical sections with conditions. These
classes make writing multithreaded applications easier, and they also pro-
vide some extra error checking compared with the native thread API. How-
ever, using threads is still a non-trivial undertaking, especially for large pro-
jects. Before starting a multithreaded application or adding multithreaded
features to an existing one, it is worth considering alternatives to threads to
implement the same functionality. In some situations, threads are the only
reasonable choice, such as an HTTP server application that launches a new
thread for each new client. However, using an extra thread to show a pro-
gress dialog during a long computation would be overkill. In this case, you
could do the calculations in an idle handler and periodically update the
screen [15, p.447].
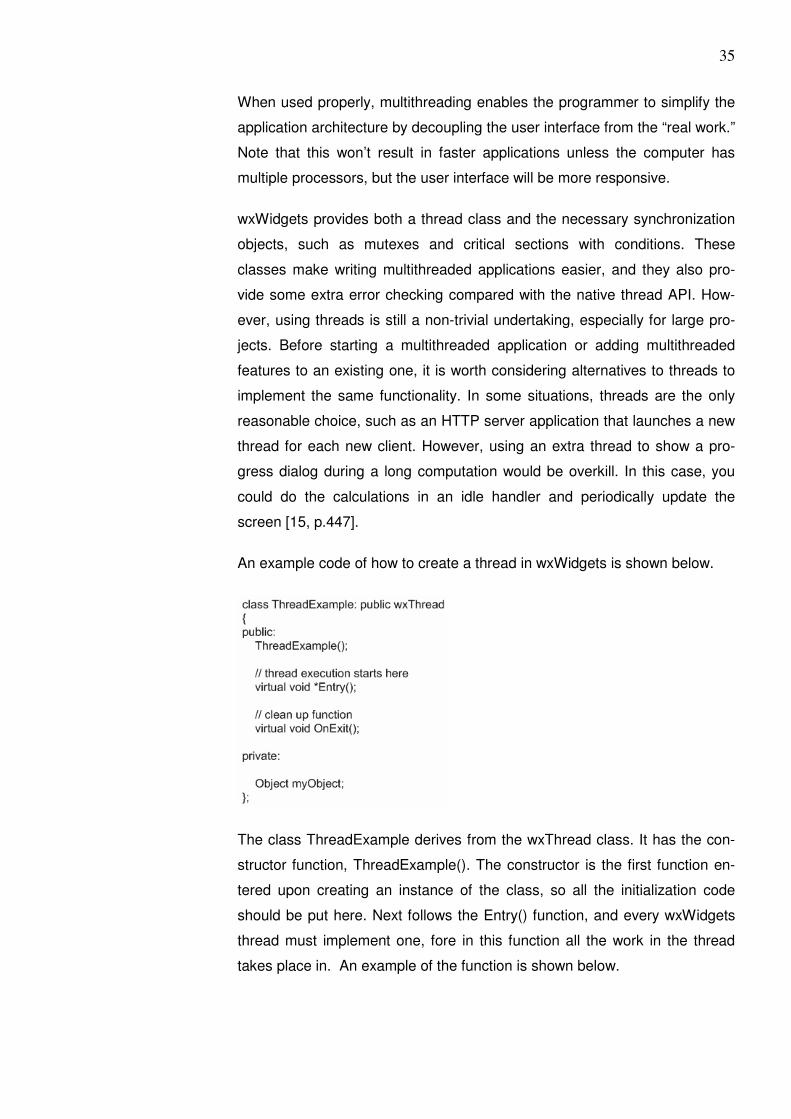
An example code of how to create a thread in wxWidgets is shown below.
The class ThreadExample derives from the wxThread class. It has the con-
structor function, ThreadExample(). The constructor is the first function en-
tered upon creating an instance of the class, so all the initialization code
should be put here. Next follows the Entry() function, and every wxWidgets
thread must implement one, fore in this function all the work in the thread
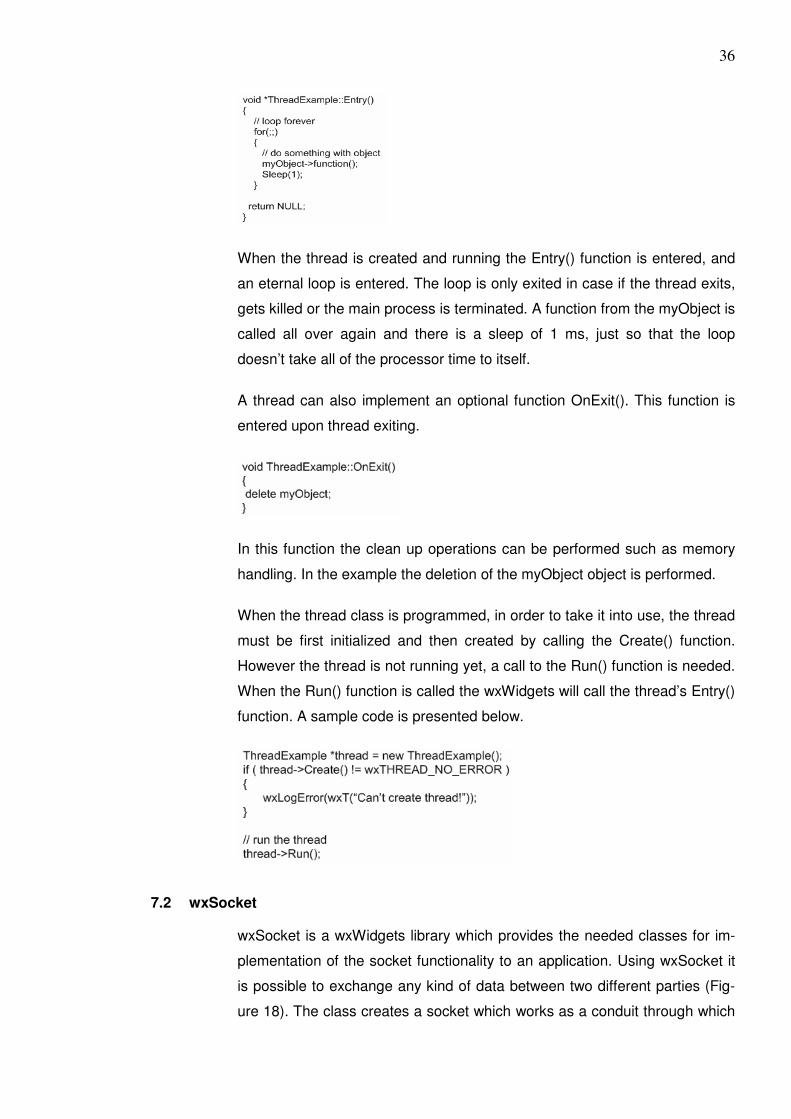
takes place in. An example of the function is shown below.
36
When the thread is created and running the Entry() function is entered, and
an eternal loop is entered. The loop is only exited in case if the thread exits,
gets killed or the main process is terminated. A function from the myObject is
called all over again and there is a sleep of 1 ms, just so that the loop
doesn’t take all of the processor time to itself.
A thread can also implement an optional function OnExit(). This function is
entered upon thread exiting.
In this function the clean up operations can be performed such as memory
handling. In the example the deletion of the myObject object is performed.
When the thread class is programmed, in order to take it into use, the thread
must be first initialized and then created by calling the Create() function.
However the thread is not running yet, a call to the Run() function is needed.
When the Run() function is called the wxWidgets will call the thread’s Entry()
function. A sample code is presented below.
7.2 wxSocket
wxSocket is a wxWidgets library which provides the needed classes for im-
plementation of the socket functionality to an application. Using wxSocket it
is possible to exchange any kind of data between two different parties (Fig-
ure 18). The class creates a socket which works as a conduit through which
37
the data is transported between the parties. Sockets are used in many con-
nections between two points, e.g. when surfing the web between the PC and
the web server. Any two devices that support sockets can be interconnected.
Thus the device does not necessarily need to be a computer [15, p.463].
Basic socket functionality, such as sending and receiving of data, is provided
by the wxSocketBase class. For establishing a listening socket, i.e. the
server, and a client to connect to that server, wxSocketServer and wxSock-
etClient classes are needed.
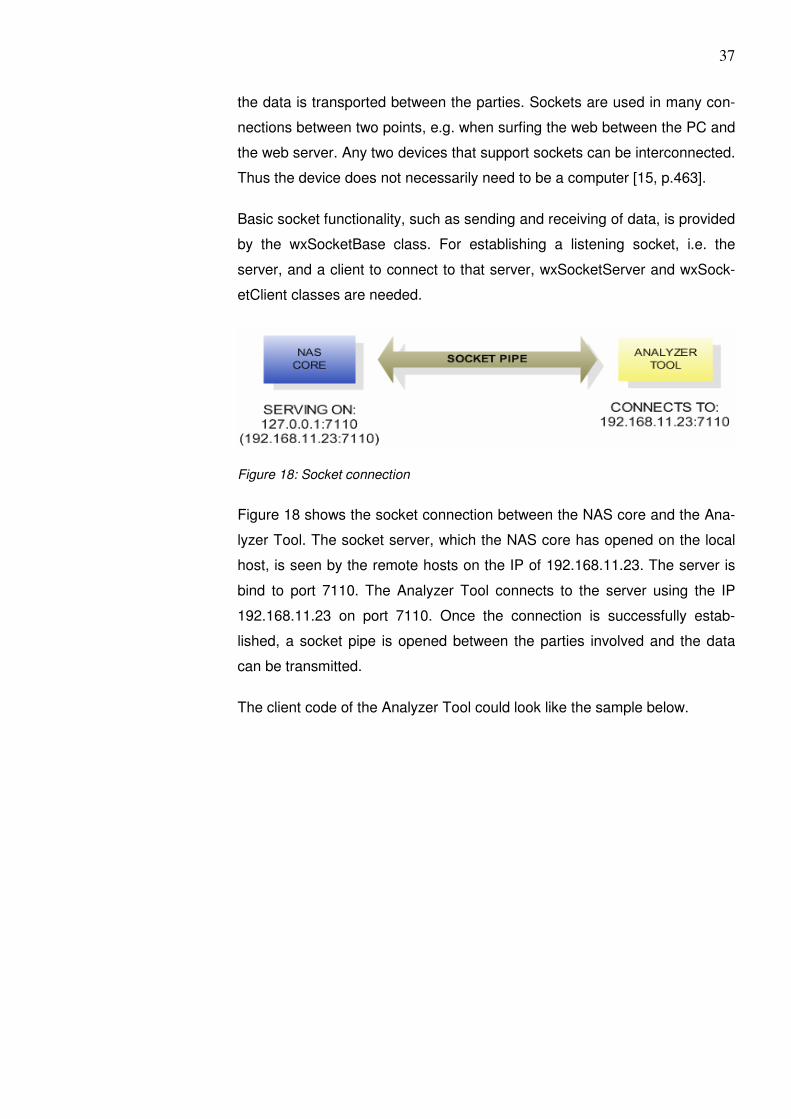
Figure 18: Socket connection
Figure 18 shows the socket connection between the NAS core and the Ana-
lyzer Tool. The socket server, which the NAS core has opened on the local
host, is seen by the remote hosts on the IP of 192.168.11.23. The server is
bind to port 7110. The Analyzer Tool connects to the server using the IP
192.168.11.23 on port 7110. Once the connection is successfully estab-
lished, a socket pipe is opened between the parties involved and the data
can be transmitted.
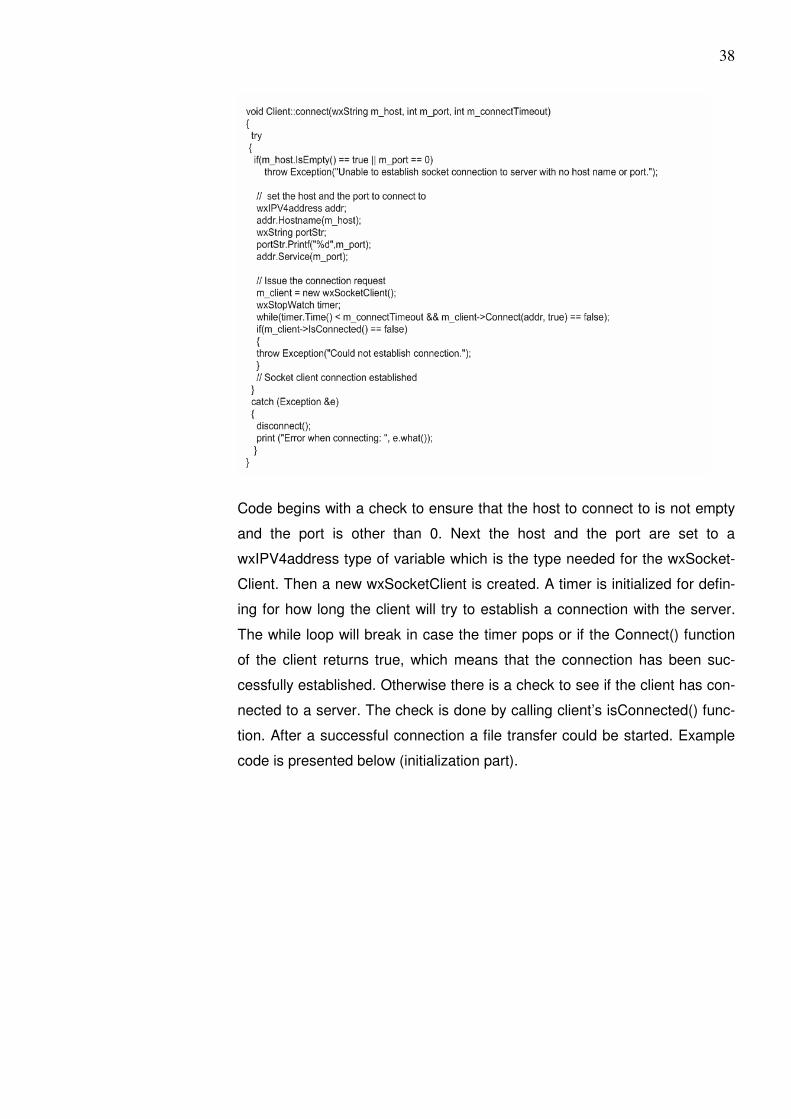
The client code of the Analyzer Tool could look like the sample below.
38
Code begins with a check to ensure that the host to connect to is not empty
and the port is other than 0. Next the host and the port are set to a
wxIPV4address type of variable which is the type needed for the wxSocket-
Client. Then a new wxSocketClient is created. A timer is initialized for defin-
ing for how long the client will try to establish a connection with the server.
The while loop will break in case the timer pops or if the Connect() function
of the client returns true, which means that the connection has been suc-
cessfully established. Otherwise there is a check to see if the client has con-
nected to a server. The check is done by calling client’s isConnected() func-
tion. After a successful connection a file transfer could be started. Example
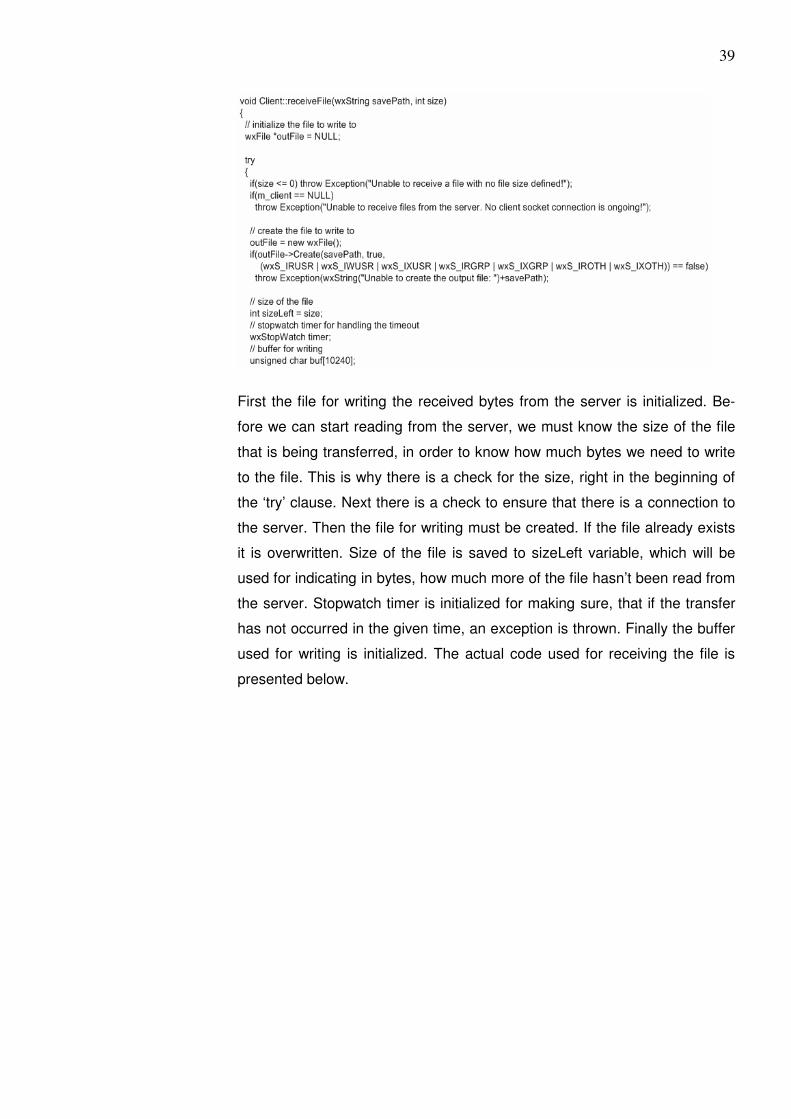
code is presented below (initialization part).
39
First the file for writing the received bytes from the server is initialized. Be-
fore we can start reading from the server, we must know the size of the file
that is being transferred, in order to know how much bytes we need to write
to the file. This is why there is a check for the size, right in the beginning of
the ‘try’ clause. Next there is a check to ensure that there is a connection to
the server. Then the file for writing must be created. If the file already exists
it is overwritten. Size of the file is saved to sizeLeft variable, which will be
used for indicating in bytes, how much more of the file hasn’t been read from
the server. Stopwatch timer is initialized for making sure, that if the transfer
has not occurred in the given time, an exception is thrown. Finally the buffer
used for writing is initialized. The actual code used for receiving the file is
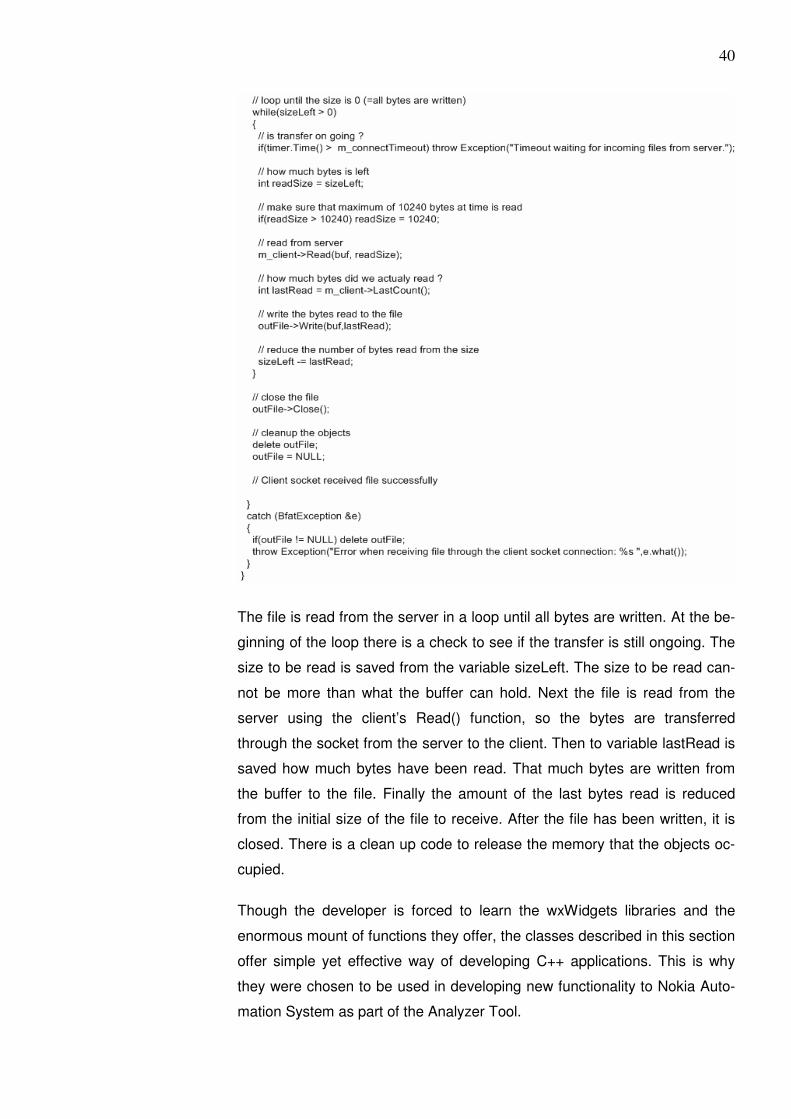
presented below.
40
The file is read from the server in a loop until all bytes are written. At the be-
ginning of the loop there is a check to see if the transfer is still ongoing. The
size to be read is saved from the variable sizeLeft. The size to be read can-
not be more than what the buffer can hold. Next the file is read from the
server using the client’s Read() function, so the bytes are transferred
through the socket from the server to the client. Then to variable lastRead is
saved how much bytes have been read. That much bytes are written from
the buffer to the file. Finally the amount of the last bytes read is reduced
from the initial size of the file to receive. After the file has been written, it is
closed. There is a clean up code to release the memory that the objects oc-
cupied.
Though the developer is forced to learn the wxWidgets libraries and the
enormous mount of functions they offer, the classes described in this section
offer simple yet effective way of developing C++ applications. This is why
they were chosen to be used in developing new functionality to Nokia Auto-
mation System as part of the Analyzer Tool.
41
8 IMPLEMENTING COUNTER TESTING
In this section the implementation of the counter testing in the Nokia Auto-
mation System is described. First the requirements for the feature are de-
scribed and then the suggested solution is presented.
8.1 Requirements and Specifications
In a meeting with the customer the requirements for the counter testing were
introduced (Table 2).
ID Description
CT-1001 For each test case a valid reference log can be defined.
CT-1002 When running a test case for the first time, if the reference log does not
exist, the analysis will be skipped. Collected counter data will be set to be
used as non-valid reference for later on. Thus, when next time the same
test case is run, the counter data collected from the second run will be
analyzed using the counter data from first run as reference.
CT-1003 There must be a function for starting, stopping and resetting of the
counters in the RNC.
CT-1004 The counters from the RNC must be collected into a user readable format.
CT-1005 The analysis is only run if the reference file exists.
CT-1006 A report containing detailed analysis results must be generated.
Table 2: Requirements for the automated counter testing
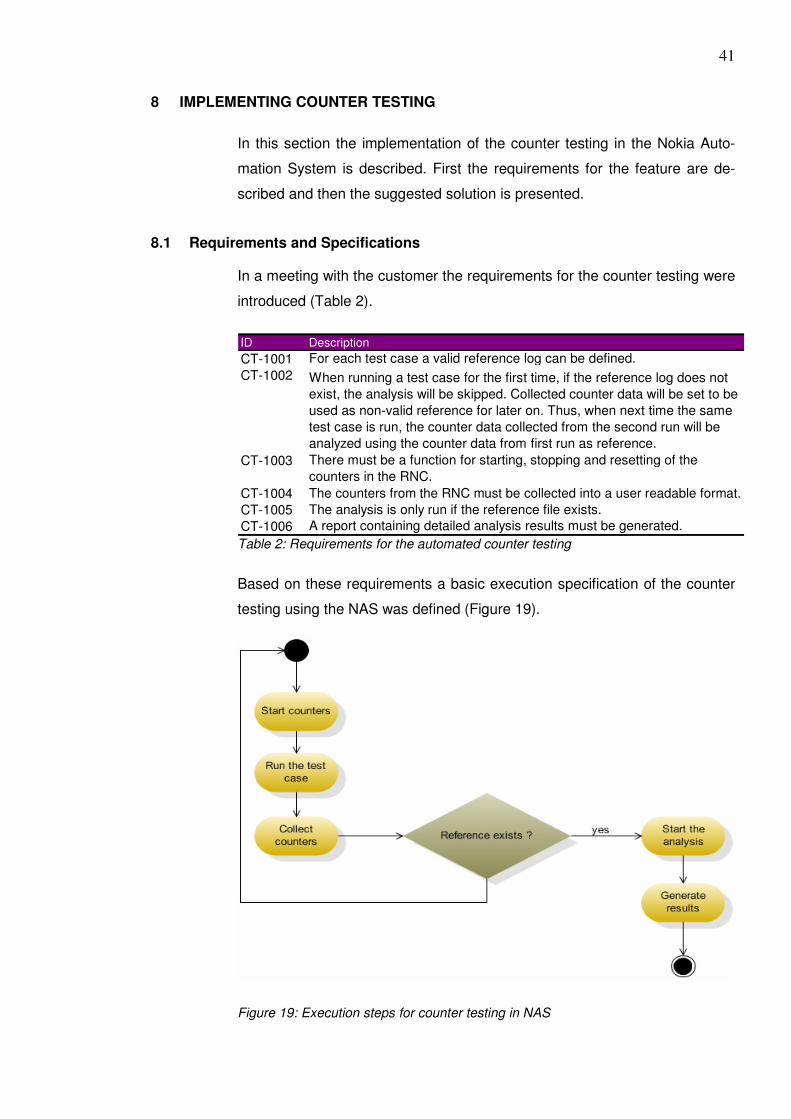
Based on these requirements a basic execution specification of the counter
testing using the NAS was defined (Figure 19).
Figure 19: Execution steps for counter testing in NAS
42
The execution begins with the starting of the counters in the RNC. Then a
particular test case is run. Immediately after the test case has finished the
counters are collected from the RNC. After that there is check to see
whether the reference file exists or not. If it does, the analysis is started and
the results are generated. However the execution of the NAS always contin-
ues, regardless of the outcome of the check for the reference file.
There can be two different reference logs: valid and non-valid. Valid refer-
ence is manually validated and assigned to a certain test case by the user,
while the non-valid is set from the log that was collected by the NAS on the
first test case run, in case that the valid one was not found. The reference
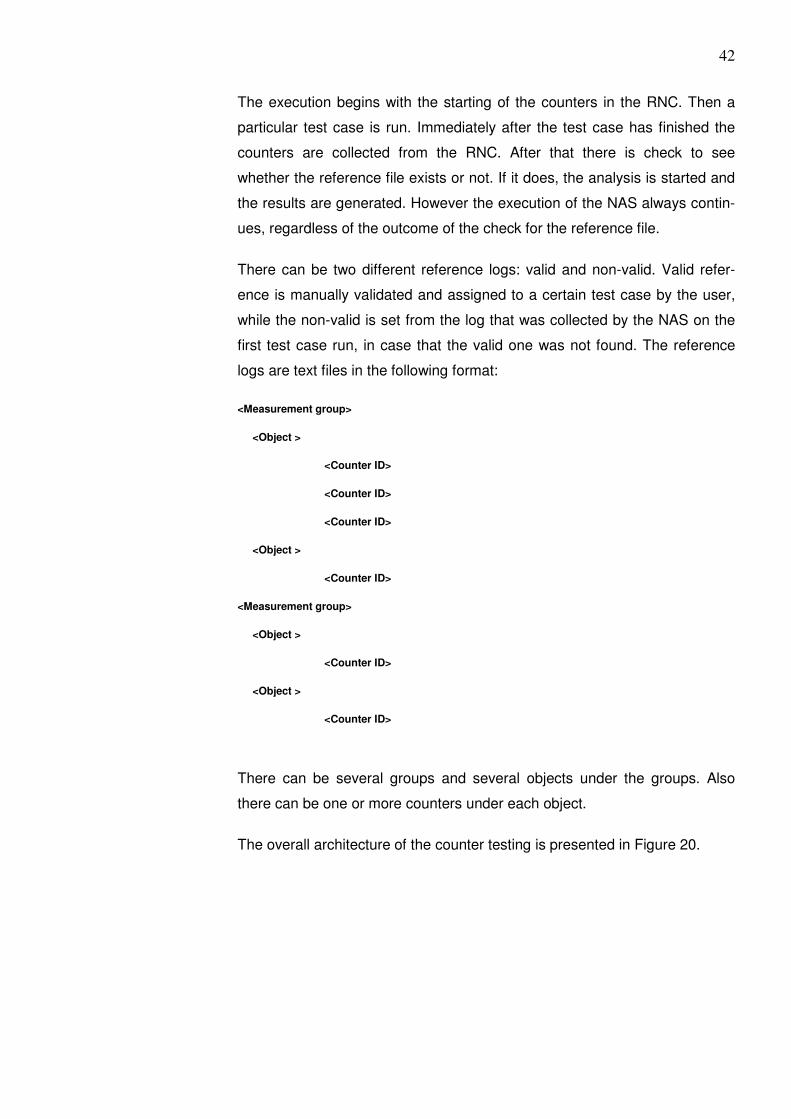
logs are text files in the following format:
<Measurement group>
<Object >
<Counter ID>
<Counter ID>
<Counter ID>
<Object >
<Counter ID>
<Measurement group>
<Object >
<Counter ID>
<Object >
<Counter ID>
There can be several groups and several objects under the groups. Also
there can be one or more counters under each object.
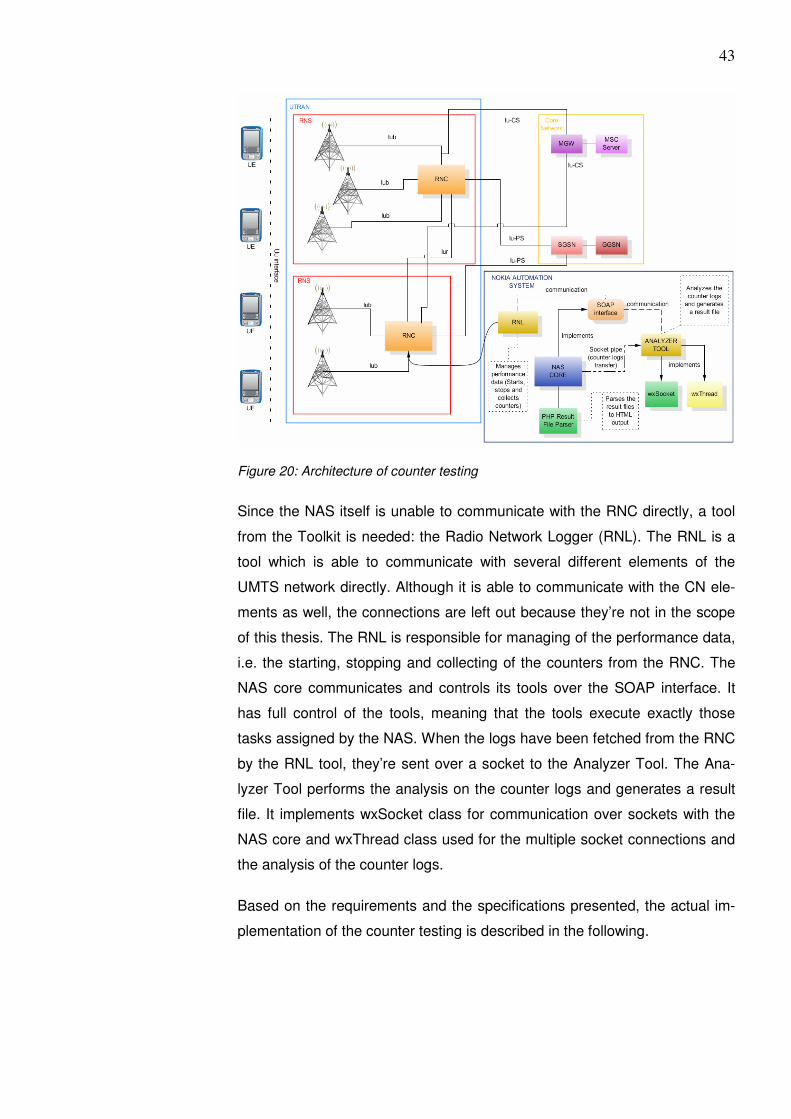
The overall architecture of the counter testing is presented in Figure 20.
43
Figure 20: Architecture of counter testing
Since the NAS itself is unable to communicate with the RNC directly, a tool
from the Toolkit is needed: the Radio Network Logger (RNL). The RNL is a
tool which is able to communicate with several different elements of the
UMTS network directly. Although it is able to communicate with the CN ele-
ments as well, the connections are left out because they’re not in the scope
of this thesis. The RNL is responsible for managing of the performance data,
i.e. the starting, stopping and collecting of the counters from the RNC. The
NAS core communicates and controls its tools over the SOAP interface. It
has full control of the tools, meaning that the tools execute exactly those
tasks assigned by the NAS. When the logs have been fetched from the RNC
by the RNL tool, they’re sent over a socket to the Analyzer Tool. The Ana-
lyzer Tool performs the analysis on the counter logs and generates a result
file. It implements wxSocket class for communication over sockets with the
NAS core and wxThread class used for the multiple socket connections and
the analysis of the counter logs.
Based on the requirements and the specifications presented, the actual im-
plementation of the counter testing is described in the following.
44
8.2 Handling of the Counter Data
In this subsection a method of handling, i.e. the retrieving and the transfer-
ring of the counter data is described.
As described previously, in order to get the counter data, for each test case
the counters in the RNC must be reset, then the chosen test case run and fi-
nally the counters need to be collected. As mentioned earlier, the NAS uses
the RNL tool for this. The RNL has its own simple scripting language, with
which users can create complex scripts for executing several different com-
mands to the connected device. Furthermore it gives the user the ability to
control the command I/O efficiently. The language itself enables the usage of
arrays, simple data types, such as strings and integers, and even functions.
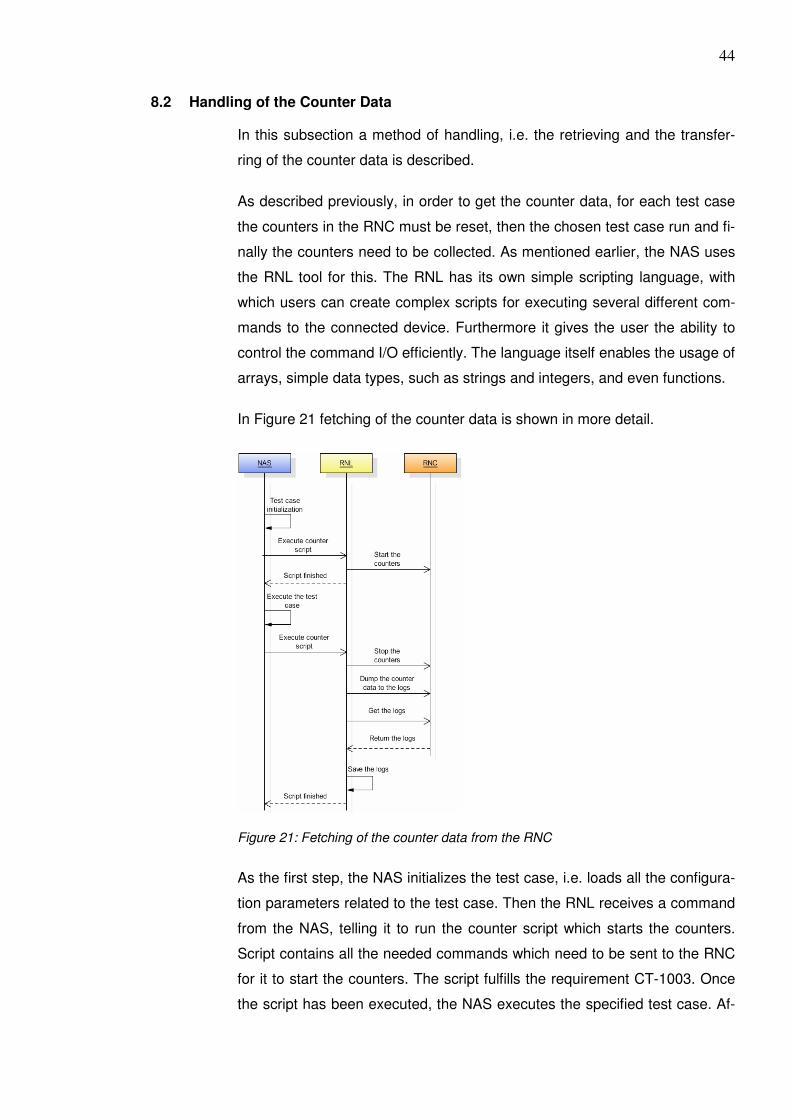
In Figure 21 fetching of the counter data is shown in more detail.
Figure 21: Fetching of the counter data from the RNC
As the first step, the NAS initializes the test case, i.e. loads all the configura-
tion parameters related to the test case. Then the RNL receives a command
from the NAS, telling it to run the counter script which starts the counters.
Script contains all the needed commands which need to be sent to the RNC
for it to start the counters. The script fulfills the requirement CT-1003. Once
the script has been executed, the NAS executes the specified test case. Af-

45
ter the execution, the RNL receives a command to run a script which stops
the counters and collects the counter data. This script fulfills the requirement
CT-1004. The counter data is dumped to the logs in the RNC. The logs are
then fetched by the RNL and saved to a local directory.
Now that the counter data has been saved, the NAS needs to make a deci-
sion, whether to start the preparations for the analysis of the counter data or
not, to fulfill the requirement CT-1002 and CT-1005. The implementation is
shown in Figure 22.
Figure 22: Implementation of the requirement CMDEAC001
As Figure 22 shows, there can be three different states depending on
whether the reference counter data exists or not. There can be only one
state per one test case. The state is carried along through the Analyzer Tool
all the way to the reporting of the analysis results. The NAS first checks if
there is a valid reference log available, as described by the requirement CT-
1001. If it cannot be found, there is a check to see if a non-valid reference
log exists. The non-valid reference is the log from the previous test case run.
If either one of these turns true, the state is saved and the counter data logs
are packed and transferred to the Analyzer Tool, which starts the analysis as
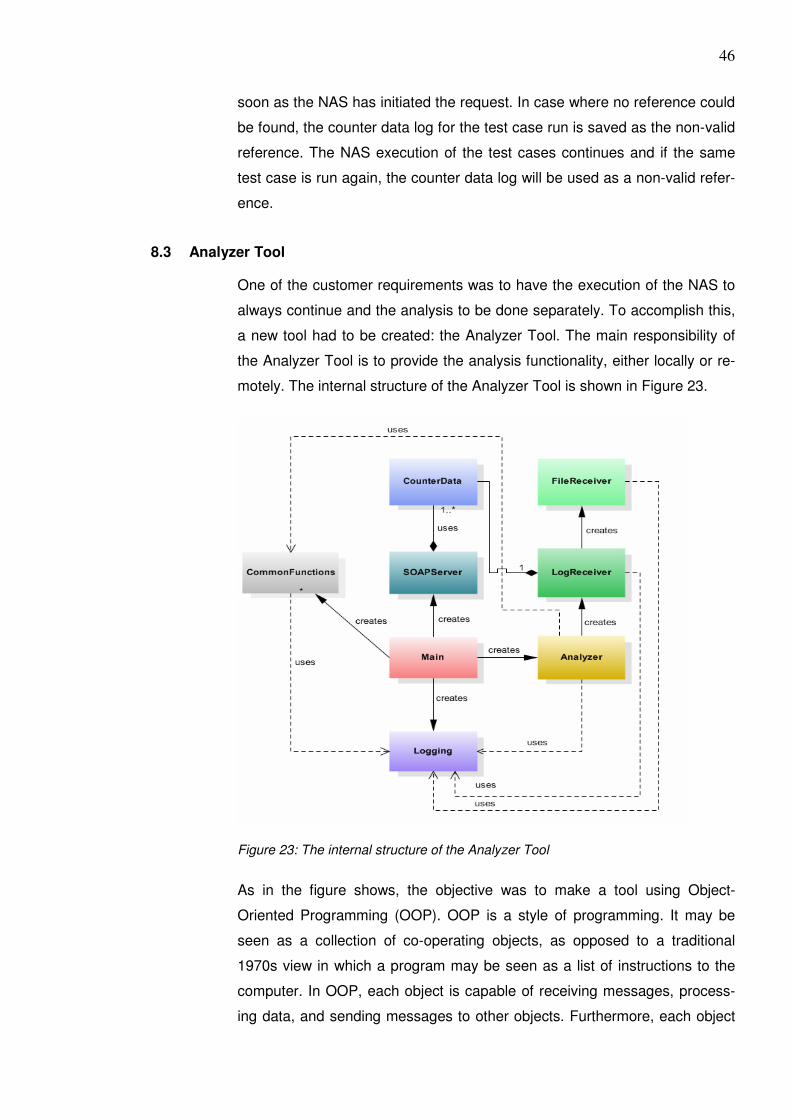
46
soon as the NAS has initiated the request. In case where no reference could
be found, the counter data log for the test case run is saved as the non-valid
reference. The NAS execution of the test cases continues and if the same
test case is run again, the counter data log will be used as a non-valid refer-
ence.
8.3 Analyzer Tool
One of the customer requirements was to have the execution of the NAS to
always continue and the analysis to be done separately. To accomplish this,
a new tool had to be created: the Analyzer Tool. The main responsibility of
the Analyzer Tool is to provide the analysis functionality, either locally or re-
motely. The internal structure of the Analyzer Tool is shown in Figure 23.
Figure 23: The internal structure of the Analyzer Tool
As in the figure shows, the objective was to make a tool using Object-
Oriented Programming (OOP). OOP is a style of programming. It may be
seen as a collection of co-operating objects, as opposed to a traditional
1970s view in which a program may be seen as a list of instructions to the
computer. In OOP, each object is capable of receiving messages, process-
ing data, and sending messages to other objects. Furthermore, each object
47
can be viewed as an independent little machine with a distinct role or re-
sponsibility.
The Analyzer Tool consists of several different objects. Each object is as-
signed a specific functionality, e.g. Analyzer object is responsible for the
analysis of the counter data logs. The eight objects are described in detail in
the following.
CounterData
The CounterData object stores all the information related to the NAS test
case on which the counter testing is done. It contains information such as
the test case name, the time and filenames of the counter data logs. The
class consists of the functions for setting and getting of the information con-
tained.
SOAPServer
The SOAPServer acts as the interface between the NAS and the tool itself.
Its task is to purge the SOAP packets received and based on the information
that was defined in the packets, call the corresponding functions. In this ob-
ject the RPCs for the application are defined. There are only two of them,
one for receiving the log files and one for starting the analysis of the counter
data logs.
FileReceiver
The FileReceiver object is used for the transferring of the counter data logs
between the NAS and the tool. The transfer of the data is done using sock-
ets, thus the object implements the wxSocket library. It can connect to any
socket server and receive any kind of data sent by the server. Received data
is always saved to a file.
LogReceiver
The LogReceiver object is the control object for the receiving of the counter
data logs. It is responsible for handling of several different socket connec-
tions for receiving the counter data logs at the same time. Therefore it im-
plements the wxThread library. In practice it creates a new FileReceiver ob-
ject for every incoming connection.
48
Analyzer
The task of the Analyzer object is to run the analysis on the counter data
logs. It also implements the thread functionality. As it runs separately in its
own space, it continuously polls the counter data queue. The incoming test
case counter data, i.e. the CounterData object is added to the counter data
queue. As the queue grows, it runs the analysis on all of the counter data
logs, based on the information found in CounterData objects. After all of the
objects have been processed, the counter data queue is emptied.
Logging
The Logging object is used throughout the application by all of the other ob-
jects. It implements the functionality for logging debug, error and information
messages to a file. This kind of functionality is not only useful for the devel-
opers, but also for the customers, to find the reasons behind the errors that
might occur in the application.
CommonFunctions
The CommonFunctions object contains functions which do not fit in any
other object. The implementation of the functions is such that they can be in-
cluded and used in any application. The functions include zip file handling,
ftp file transfer and starting of the external applications.
Main
Main is the object which is the base of the application. This object is the first
one created when starting the application. It is responsible for creating and
starting the SOAP server and the Analyzer object and creating the Com-
monFunctions object.
An example of the message flow between the objects is shown in Figure 24.
The figure illustrates the flow of the analysis within the tool.
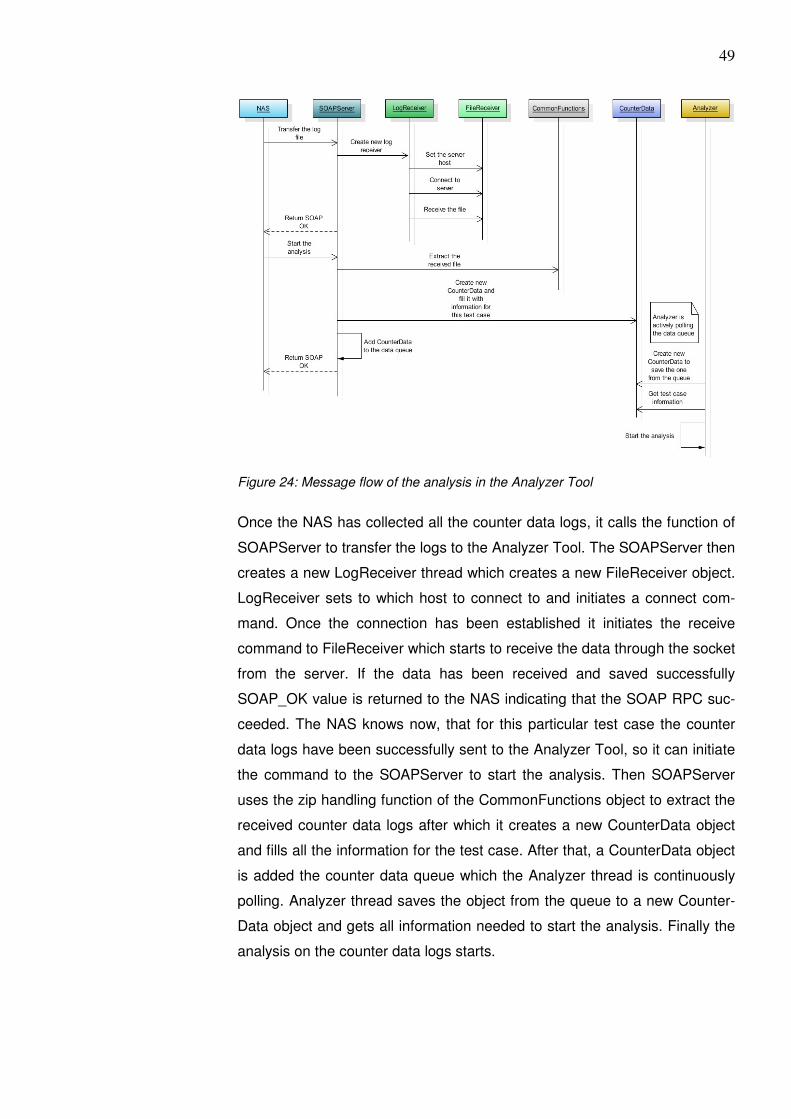
49
Figure 24: Message flow of the analysis in the Analyzer Tool
Once the NAS has collected all the counter data logs, it calls the function of
SOAPServer to transfer the logs to the Analyzer Tool. The SOAPServer then
creates a new LogReceiver thread which creates a new FileReceiver object.
LogReceiver sets to which host to connect to and initiates a connect com-
mand. Once the connection has been established it initiates the receive
command to FileReceiver which starts to receive the data through the socket
from the server. If the data has been received and saved successfully
SOAP_OK value is returned to the NAS indicating that the SOAP RPC suc-
ceeded. The NAS knows now, that for this particular test case the counter
data logs have been successfully sent to the Analyzer Tool, so it can initiate
the command to the SOAPServer to start the analysis. Then SOAPServer
uses the zip handling function of the CommonFunctions object to extract the
received counter data logs after which it creates a new CounterData object
and fills all the information for the test case. After that, a CounterData object
is added the counter data queue which the Analyzer thread is continuously
polling. Analyzer thread saves the object from the queue to a new Counter-
Data object and gets all information needed to start the analysis. Finally the
analysis on the counter data logs starts.
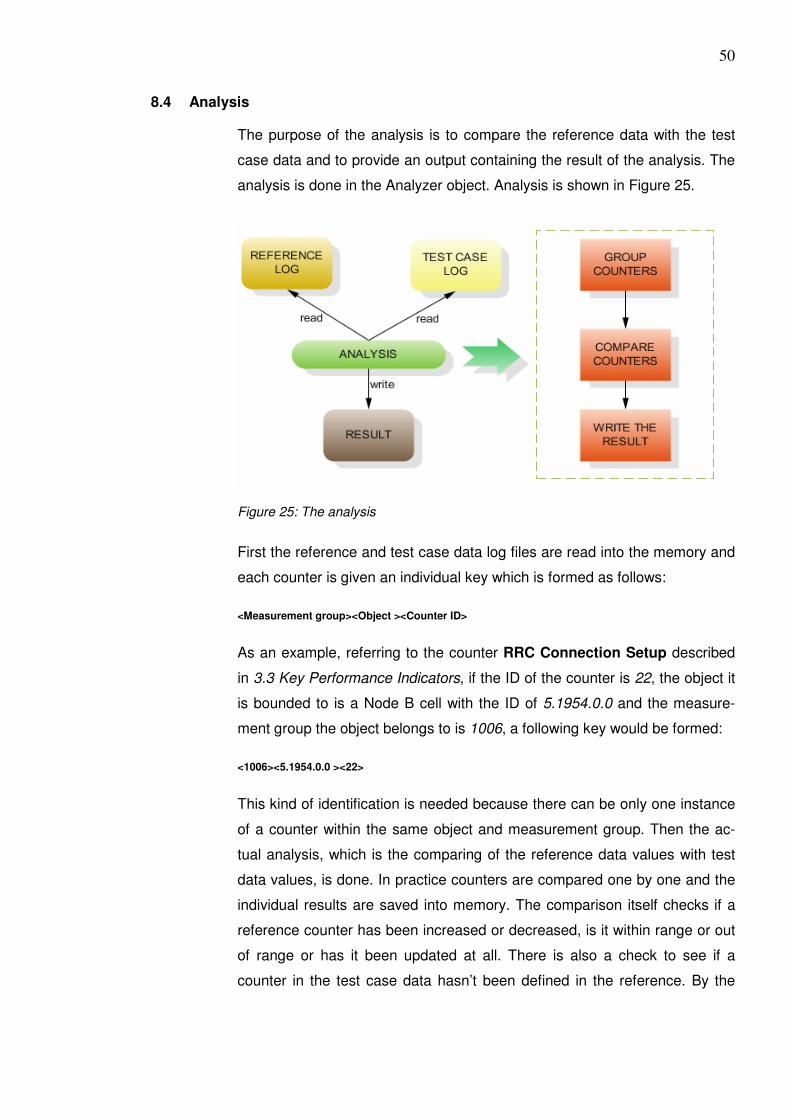
50
8.4 Analysis
The purpose of the analysis is to compare the reference data with the test
case data and to provide an output containing the result of the analysis. The
analysis is done in the Analyzer object. Analysis is shown in Figure 25.
Figure 25: The analysis
First the reference and test case data log files are read into the memory and
each counter is given an individual key which is formed as follows:
<Measurement group><Object ><Counter ID>
As an example, referring to the counter RRC Connection Setup described
in 3.3 Key Performance Indicators, if the ID of the counter is 22, the object it
is bounded to is a Node B cell with the ID of 5.1954.0.0 and the measure-
ment group the object belongs to is 1006, a following key would be formed:
<1006><5.1954.0.0 ><22>
This kind of identification is needed because there can be only one instance
of a counter within the same object and measurement group. Then the ac-
tual analysis, which is the comparing of the reference data values with test
data values, is done. In practice counters are compared one by one and the
individual results are saved into memory. The comparison itself checks if a
reference counter has been increased or decreased, is it within range or out
of range or has it been updated at all. There is also a check to see if a
counter in the test case data hasn’t been defined in the reference. By the
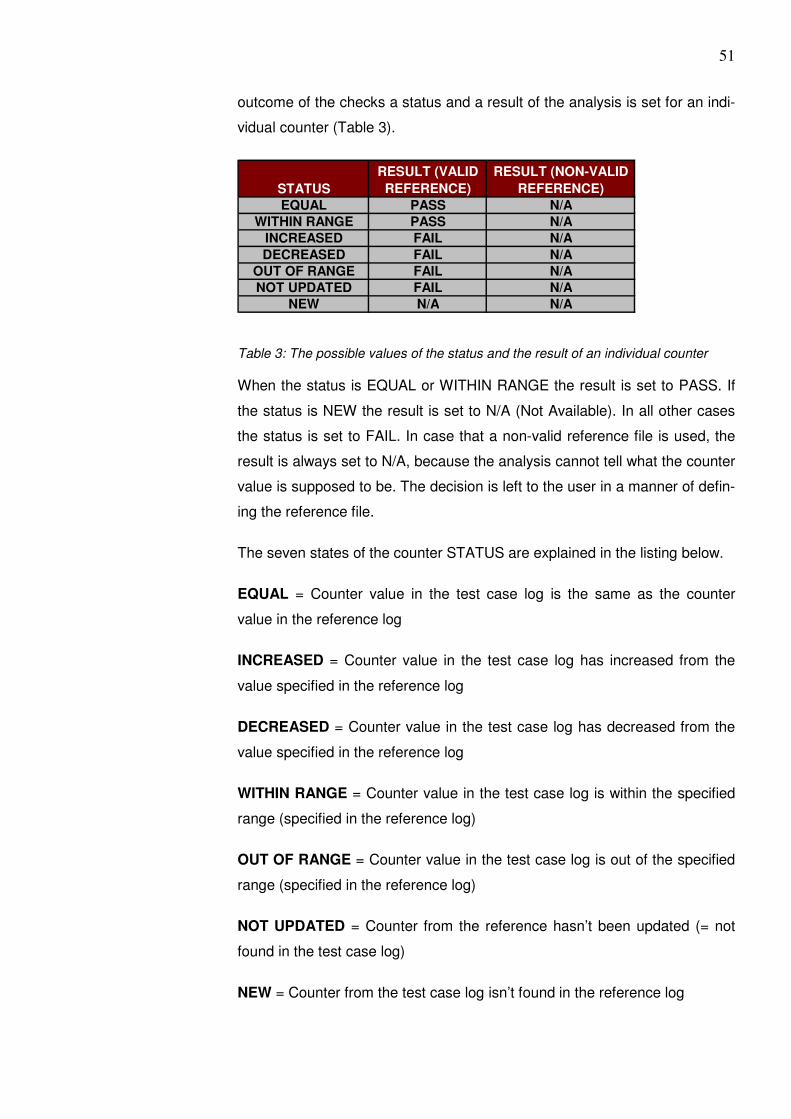
51
outcome of the checks a status and a result of the analysis is set for an indi-
vidual counter (Table 3).
STATUSRESULT (VALID REFERENCE)
RESULT (NON-VALID REFERENCE)
EQUAL PASS N/AWITHIN RANGE PASS N/A
INCREASED FAIL N/ADECREASED FAIL N/A
OUT OF RANGE FAIL N/ANOT UPDATED FAIL N/A
NEW N/A N/A
Table 3: The possible values of the status and the result of an individual counter
When the status is EQUAL or WITHIN RANGE the result is set to PASS. If
the status is NEW the result is set to N/A (Not Available). In all other cases
the status is set to FAIL. In case that a non-valid reference file is used, the
result is always set to N/A, because the analysis cannot tell what the counter
value is supposed to be. The decision is left to the user in a manner of defin-
ing the reference file.
The seven states of the counter STATUS are explained in the listing below.
EQUAL = Counter value in the test case log is the same as the counter
value in the reference log
INCREASED = Counter value in the test case log has increased from the
value specified in the reference log
DECREASED = Counter value in the test case log has decreased from the
value specified in the reference log
WITHIN RANGE = Counter value in the test case log is within the specified
range (specified in the reference log)
OUT OF RANGE = Counter value in the test case log is out of the specified
range (specified in the reference log)
NOT UPDATED = Counter from the reference hasn’t been updated (= not
found in the test case log)
NEW = Counter from the test case log isn’t found in the reference log
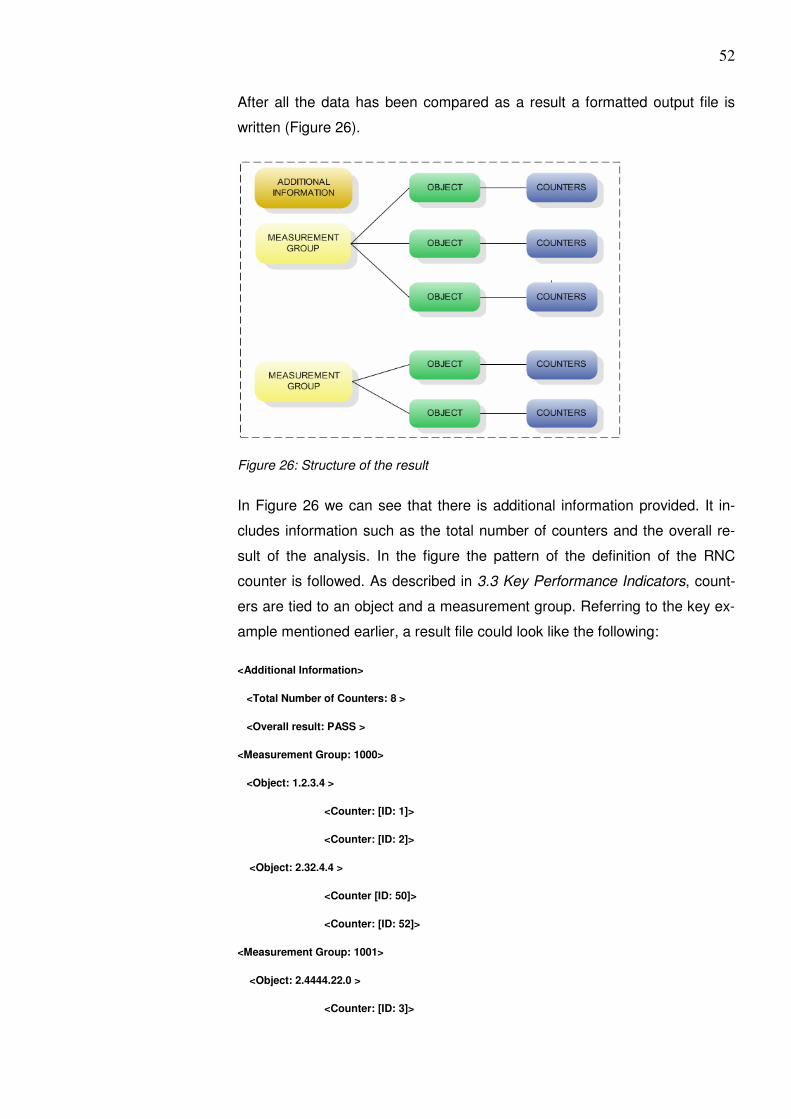
52
After all the data has been compared as a result a formatted output file is
written (Figure 26).
Figure 26: Structure of the result
In Figure 26 we can see that there is additional information provided. It in-
cludes information such as the total number of counters and the overall re-
sult of the analysis. In the figure the pattern of the definition of the RNC
counter is followed. As described in 3.3 Key Performance Indicators, count-
ers are tied to an object and a measurement group. Referring to the key ex-
ample mentioned earlier, a result file could look like the following:
<Additional Information>
<Total Number of Counters: 8 >
<Overall result: PASS >
<Measurement Group: 1000>
<Object: 1.2.3.4 >
<Counter: [ID: 1]>
<Counter: [ID: 2]>
<Object: 2.32.4.4 >
<Counter [ID: 50]>
<Counter: [ID: 52]>
<Measurement Group: 1001>
<Object: 2.4444.22.0 >
<Counter: [ID: 3]>
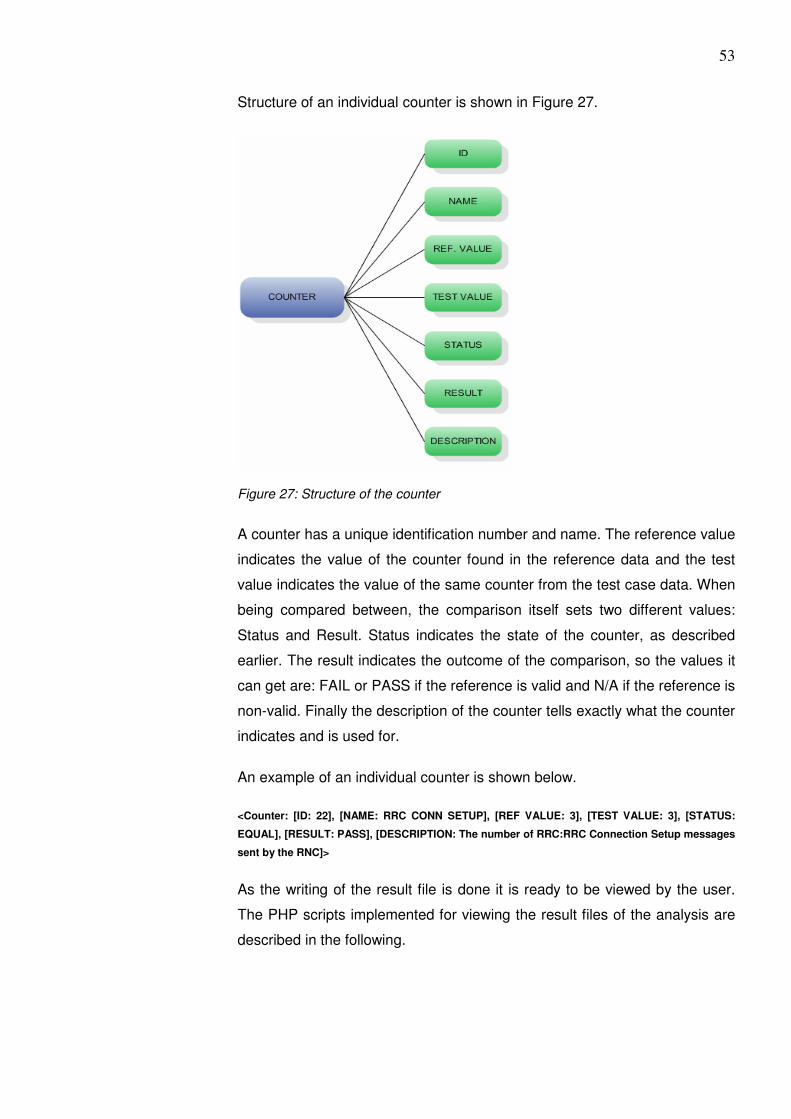
53
Structure of an individual counter is shown in Figure 27.
Figure 27: Structure of the counter
A counter has a unique identification number and name. The reference value
indicates the value of the counter found in the reference data and the test
value indicates the value of the same counter from the test case data. When
being compared between, the comparison itself sets two different values:
Status and Result. Status indicates the state of the counter, as described
earlier. The result indicates the outcome of the comparison, so the values it
can get are: FAIL or PASS if the reference is valid and N/A if the reference is
non-valid. Finally the description of the counter tells exactly what the counter
indicates and is used for.
An example of an individual counter is shown below.
<Counter: [ID: 22], [NAME: RRC CONN SETUP], [REF VALUE: 3], [TEST VALUE: 3], [STATUS:
EQUAL], [RESULT: PASS], [DESCRIPTION: The number of RRC:RRC Connection Setup messages
sent by the RNC]>
As the writing of the result file is done it is ready to be viewed by the user.
The PHP scripts implemented for viewing the result files of the analysis are
described in the following.
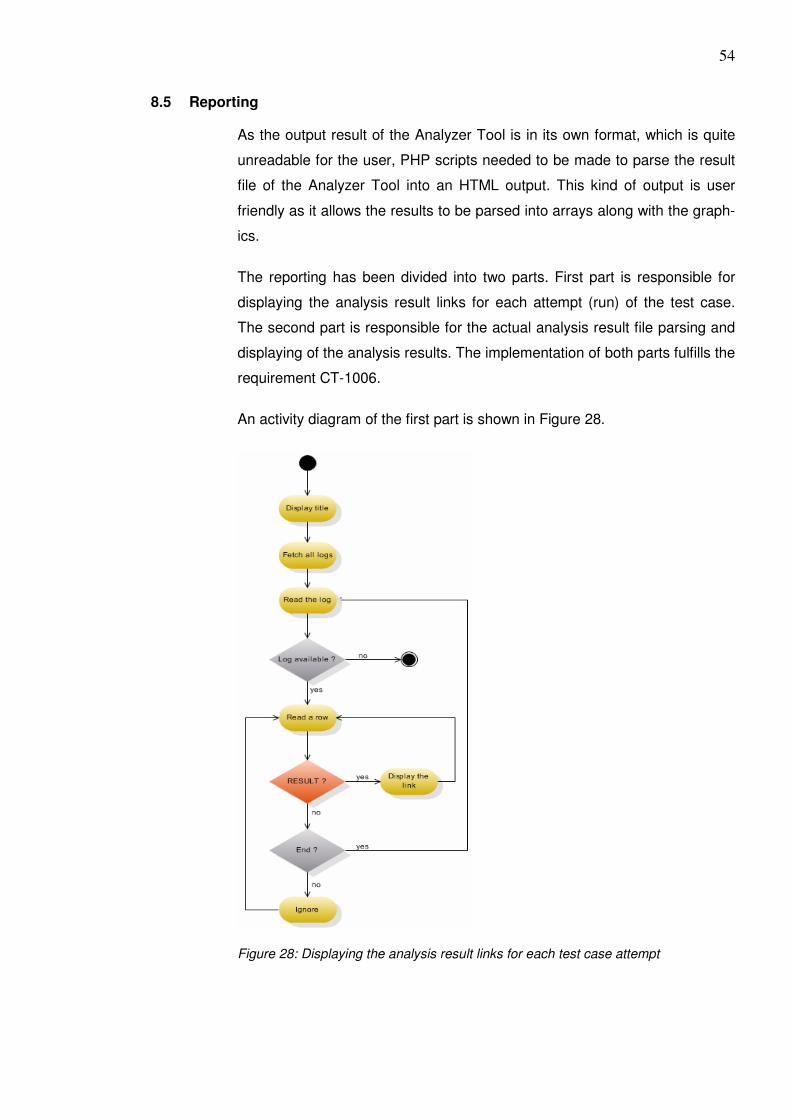
54
8.5 Reporting
As the output result of the Analyzer Tool is in its own format, which is quite
unreadable for the user, PHP scripts needed to be made to parse the result
file of the Analyzer Tool into an HTML output. This kind of output is user
friendly as it allows the results to be parsed into arrays along with the graph-
ics.
The reporting has been divided into two parts. First part is responsible for
displaying the analysis result links for each attempt (run) of the test case.
The second part is responsible for the actual analysis result file parsing and
displaying of the analysis results. The implementation of both parts fulfills the
requirement CT-1006.
An activity diagram of the first part is shown in Figure 28.
Figure 28: Displaying the analysis result links for each test case attempt
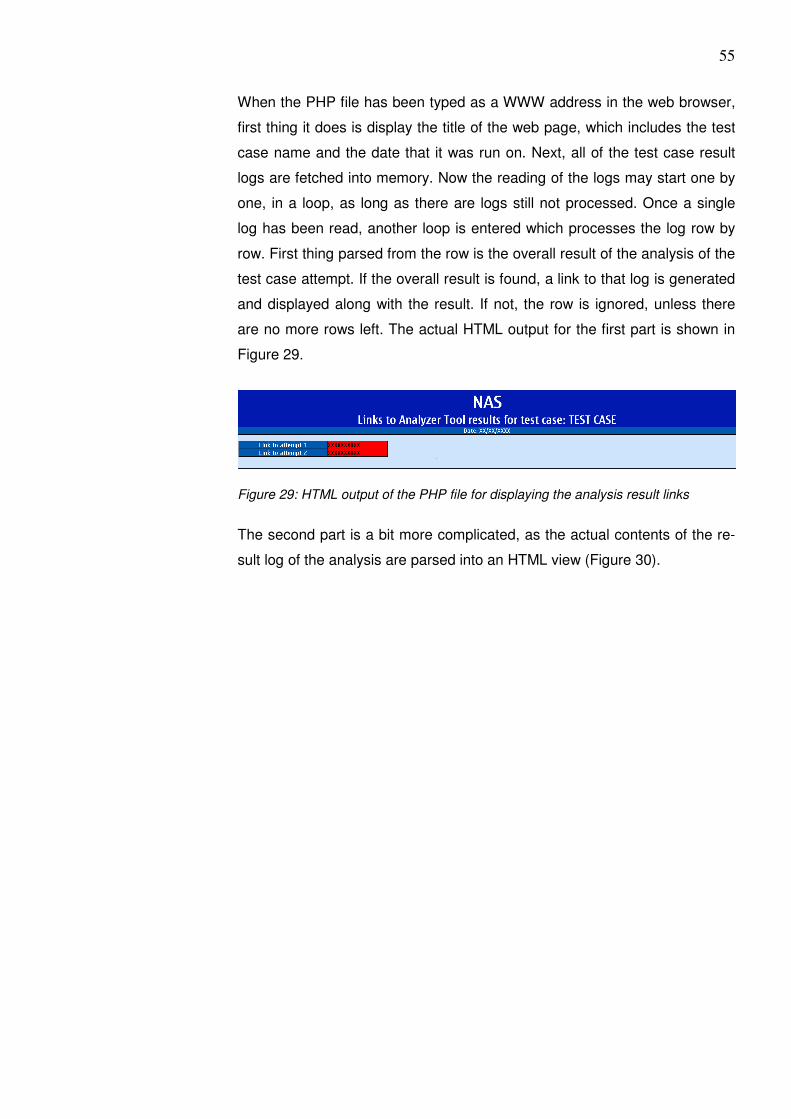
55
When the PHP file has been typed as a WWW address in the web browser,
first thing it does is display the title of the web page, which includes the test
case name and the date that it was run on. Next, all of the test case result
logs are fetched into memory. Now the reading of the logs may start one by
one, in a loop, as long as there are logs still not processed. Once a single
log has been read, another loop is entered which processes the log row by
row. First thing parsed from the row is the overall result of the analysis of the
test case attempt. If the overall result is found, a link to that log is generated
and displayed along with the result. If not, the row is ignored, unless there
are no more rows left. The actual HTML output for the first part is shown in
Figure 29.
Figure 29: HTML output of the PHP file for displaying the analysis result links
The second part is a bit more complicated, as the actual contents of the re-
sult log of the analysis are parsed into an HTML view (Figure 30).
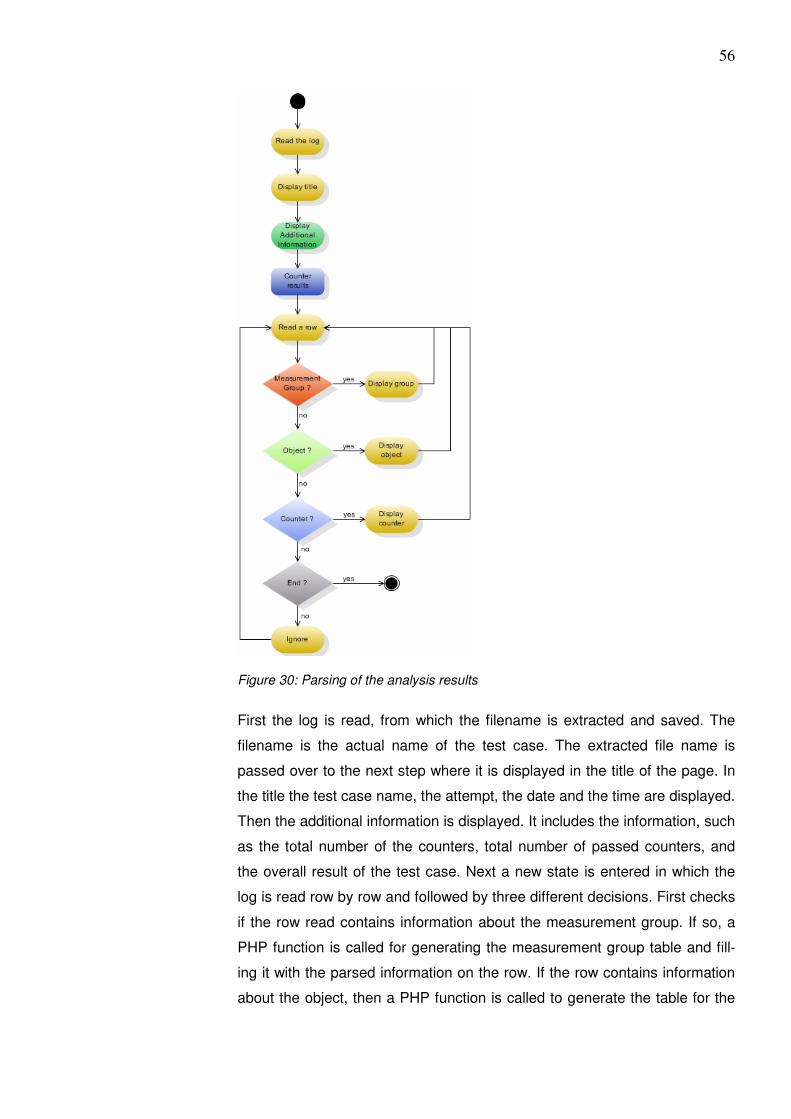
56
Figure 30: Parsing of the analysis results
First the log is read, from which the filename is extracted and saved. The
filename is the actual name of the test case. The extracted file name is
passed over to the next step where it is displayed in the title of the page. In
the title the test case name, the attempt, the date and the time are displayed.
Then the additional information is displayed. It includes the information, such
as the total number of the counters, total number of passed counters, and
the overall result of the test case. Next a new state is entered in which the
log is read row by row and followed by three different decisions. First checks
if the row read contains information about the measurement group. If so, a
PHP function is called for generating the measurement group table and fill-
ing it with the parsed information on the row. If the row contains information
about the object, then a PHP function is called to generate the table for the
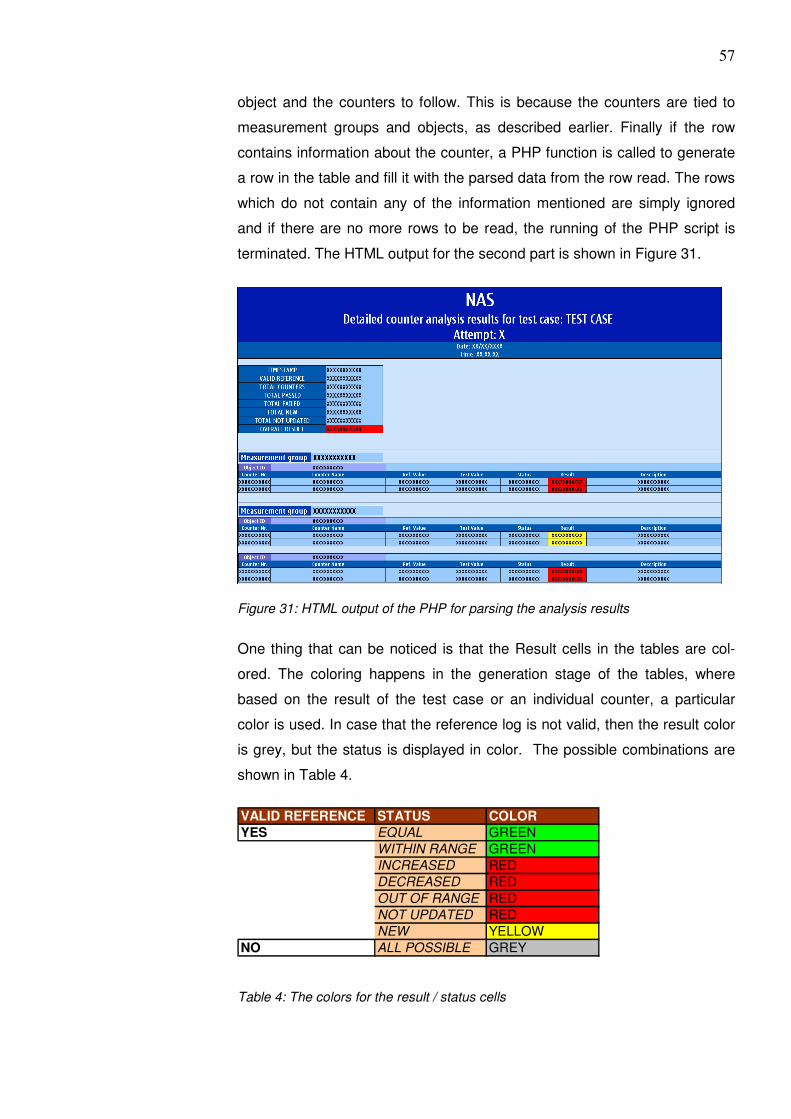
57
object and the counters to follow. This is because the counters are tied to
measurement groups and objects, as described earlier. Finally if the row
contains information about the counter, a PHP function is called to generate
a row in the table and fill it with the parsed data from the row read. The rows
which do not contain any of the information mentioned are simply ignored
and if there are no more rows to be read, the running of the PHP script is
terminated. The HTML output for the second part is shown in Figure 31.
Figure 31: HTML output of the PHP for parsing the analysis results
One thing that can be noticed is that the Result cells in the tables are col-
ored. The coloring happens in the generation stage of the tables, where
based on the result of the test case or an individual counter, a particular
color is used. In case that the reference log is not valid, then the result color
is grey, but the status is displayed in color. The possible combinations are
shown in Table 4.
VALID REFERENCE STATUS COLORYES EQUAL GREEN
WITHIN RANGE GREEN
INCREASED RED
DECREASED RED
OUT OF RANGE RED
NOT UPDATED RED
NEW YELLOW
NO ALL POSSIBLE GREY
Table 4: The colors for the result / status cells
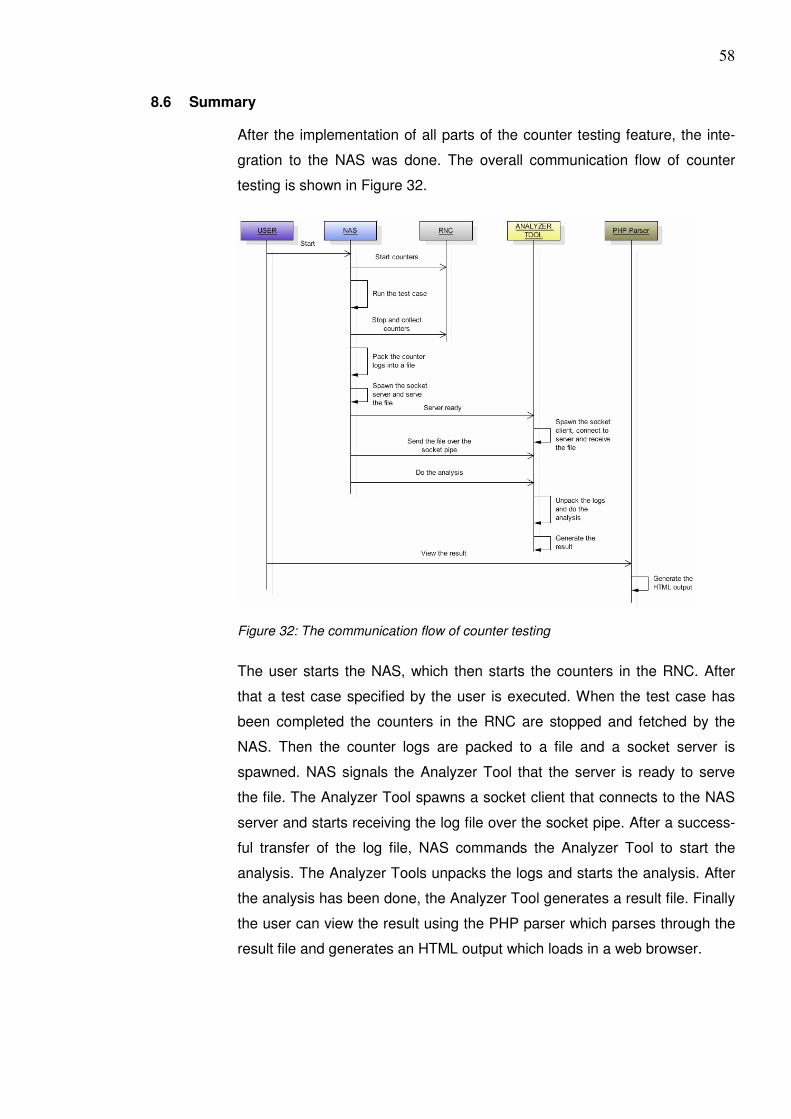
58
8.6 Summary
After the implementation of all parts of the counter testing feature, the inte-
gration to the NAS was done. The overall communication flow of counter
testing is shown in Figure 32.
Figure 32: The communication flow of counter testing
The user starts the NAS, which then starts the counters in the RNC. After
that a test case specified by the user is executed. When the test case has
been completed the counters in the RNC are stopped and fetched by the
NAS. Then the counter logs are packed to a file and a socket server is
spawned. NAS signals the Analyzer Tool that the server is ready to serve
the file. The Analyzer Tool spawns a socket client that connects to the NAS
server and starts receiving the log file over the socket pipe. After a success-
ful transfer of the log file, NAS commands the Analyzer Tool to start the
analysis. The Analyzer Tools unpacks the logs and starts the analysis. After
the analysis has been done, the Analyzer Tool generates a result file. Finally
the user can view the result using the PHP parser which parses through the
result file and generates an HTML output which loads in a web browser.
59
9 CONCLUSIONS
The process of the implementation of counter testing feature is developed in
this study for the Nokia Automation System (NAS). The implementation of
the feature was divided in three parts: the implementation of the handling of
the counter data, development of a new tool to the NAS Toolkit and devel-
opment of counter testing results reporting.
The new technology introduced in this study, wxWidgets, proved to be a rich
addition for developing platform independent C++ applications. The devel-
oper can implement new functionality rapidly using the wxWidgets, as the
technology is reliable and infallible. All three parts of the implementation
were successful. All of the requirements and specifications defined by the
customer were fulfilled. The counter analysis performed by the Analyzer Tool
proved to be valid. The customer was extremely satisfied with the outcome
of this study, especially of the way how viewing of the counter results was
implemented.
Several improvements to the counter testing feature were identified based
on this study. The definition of the counter data, that is the decision of which
counters to test, can be improved in such a way that the counters could be
defined directly in the XML configuration of the Nokia Automation System.
However, this kind of feature would only be useful if the user needed to test
few counters, as typing of the information such as measurement group, ob-
ject and counter information itself for each counter would be a tedious work.
Another feature worth investigating would be the counter testing for several
test cases, as the current feature encompasses only a particular test case.
This would enable user to run several different test cases, which would cre-
ate different circumstances in the UMTS network. Then the counters would
be analyzed for a particular circumstance.

REFERENCES
[1] 3rd Generation Partnership Project (2006). About 3GPP (April 24) [WWW docu-ment] http://www.3gpp.org/About/about.htm (Accessed Mar 20, 2007). [2] Kaaranen, H., Ahtiainen, A., Laitinen, L., Naghian S. and Niemi V. (2005) UMTS Networks: Architecture, Mobility and Services. 2nd Edition. John Wiley & Sons Ltd. 207pp. [3] 3rd Generation Partnership Project (2007). 3GPP TS 25.401 V7.3.0. [WWW document] http://www.3gpp.org/ftp/Specs/html-info/25401.htm (Accessed Mar 20, 2007) Downloaded at http://www.3gpp.org/ftp/Specs/archive/25_series/25.401/25401-730.zip (Accessed Mar 20, 2007) [4] Kreher Ralf (2006) UMTS Performance Measurement: A practical guide to KPIs for the UTRAN Environment. John Wiley & Sons Ltd. 207pp. [5] U.S. Department of Energy (1995). How to Measure Performance: A Handbook of Techniques and Tools. http://www.orau.gov/pbm/documents/handbook1a.html (Accessed Mar 19, 2007)
[6] 3rd Generation Partnership Project (2004). 3GPP TS 32.401 V4.5.0. [WWW document] http://www.3gpp.org/ftp/Specs/html-info/32401.htm (Accessed Mar 25, 2007) Downloaded at http://www.3gpp.org/ftp/Specs/archive/32_series/32.401/32401-450.zip (Accessed Mar 25, 2007) [7] Sara Ford’s WebLog (2004) Automation Testing versus Manual Testing Guide-
lines (May 5) [WWW document] http://blogs.msdn.com/saraford/archive/2004/05/05/368833.aspx (Accessed Mar 25, 2007) [8] Kaner C., Falk J., Nguyen Q.H. (1999). Testing Computer Software. 2nd edition. Wiley. 480pp. [9] Scribner K. and Stiver M.C. (2000) Understanding SOAP. 1st Edition. Sams Publishing. 491pp. [10] Web service (2007). Web service. [WWW document] http://en.wikipedia.org/wiki/Web_services (Accessed Apr 4, 2007) [11] Web Service Definition Language (2001). Web Services Description Lan-guage (WSDL) 1.1. [WWW Document] http://www.w3.org/TR/wsdl (Accessed Apr 4, 2007)
[12] Web Services (2003). Web-palvelut. [WWW document] http://myy.helia.fi/~atk90d/soap/webservices.html (Accessed Apr 4, 2007) [13] Engelen van R. (2007). gSOAP 2.7.9 User Guide. [WWW document] http://www.cs.fsu.edu/~engelen/soapdoc2.html (Accessed Apr 4, 2007). [14] gSOAP: C++ Web Services (2007) A Quick How To [WWW document] http://www.cs.fsu.edu/~engelen/soap.html (Accessed Apr 4, 2007) [15] Smart J., Hock K. and Csomor S. (2006). Cross-platform GUI Programming with wxWidgets. Pearson Education, Inc. 663pp. [16] Libraries list (2007). wxWidgets Libraries List. [WWW document] http://www.wxwidgets.org/manuals/stable/wx_librarieslist.html#librarieslist (Ac-cessed Apr 5, 2007)