information technology audit and fraud prevention among
TRANSCRIPT

i
INFORMATION TECHNOLOGY AUDIT AND FRAUD PREVENTION AMONG
COMMERCIAL BANKS IN KENYA
JULIA M. NDUNGU
A RESEARCH PROJECT SUBMITTED IN PARTIAL FULFILLMENT OF THE
REQUIREMENTS OF MASTER OF BUSINESS ADMINISTRATION, SCHOOL
OF BUSINESS, UNIVERSITY OF NAIROBI
NOVEMBER 2013

ii
DECLARATION
This research project is my original work and has not been presented for an award in any
other University.
Signed by: ____________________________ Date: ________________________
NDUNGU, J. M.
D61/66676/2010
The research project has been submitted for examination with my approval as the
University Supervisor.
Signed by: ____________________________ Date: ________________________
JOEL K. LELEI
Lecturer
Department of Management Science
University of Nairobi

iii
DEDICATION
I dedicate this project to my entire family and my supervisor for their hard work and
encouragement through the entire project.

iv
ACKNOWLEDGEMENT
This project would not have been possible without the support of people, to whom I
recognize below for their contribution.
I would like to express my warm and sincere gratitude to my supervisor, Joel K. Lelei,
for his continuous guidance and support. His knowledge on research projects and the
advise he offered was of great help to me. His suggested approaches gave me direction
and facilitated in completion of the project. I am extremely grateful and fortunate to have
benefited from his skill and brilliance. I would like to thank him for reading my
numerous revisions and tirelessly ensured I followed the university guidelines.
I would as well thank all the respondents who took time to fill the questionnaires. It is
through their efforts that I was able to collect and analyze the data on my study.
I would like to thank my family and friends for believing in my interests to pursue an
MBA and supporting me.
Most importantly, I thank God for giving me the wisdom, strong courage and
determination that has seen me through this MBA course.

v
TABLE OF CONTENTS
DECLARATION................................................................................................................. ii
DEDICATION....................................................................................................................iii
ACKNOWLEDGEMENT ................................................................................................. iv
LIST OF FIGURES .........................................................................................................viii
LIST OF TABLES ............................................................................................................. ix
LIST OF ABBREVIATIONS ............................................................................................ x
ABSTRACT ....................................................................................................................... xii
CHAPTER ONE: INTRODUCTION ............................................................................... 1
1.1 Background to the Study ............................................................................................... 1
1.1.1 Information Technology Audit .......................................................................... 2
1.1.2 Detection and Prevention of Fraud .................................................................... 3
1.1.3 Commercial Banks in Kenya ............................................................................. 4
1.2 Statement of the Problem .............................................................................................. 6
1.3 Objectives of the Study ................................................................................................. 8
1.4 Value of the Study ......................................................................................................... 8
CHAPTER TWO: LITERATURE REVIEW .................................................................. 9
2.1 The Extent of IT Related Fraud ..................................................................................... 9
2.2 Information Technology Auditing ............................................................................... 12
2.3 Challenges Faced and Measures Implemented in Fraud Prevention ........................... 13
2.3.1 Strategic Fraud Detection Model .................................................................... 17
2.3.2 Technology Acceptance Model (TAM) 2 ....................................................... 18
2.4 Relationship between IT Auditing and Fraud Prevention ........................................... 19
CHAPTER THREE: RESEARCH METHODOLOGY ............................................... 22
3.1 Introduction ................................................................................................................. 22
3.2 Research Design .......................................................................................................... 22
3.3 Population of the Study ............................................................................................... 22
3.4 Data Collection ............................................................................................................ 22
3.5 Data Analysis .............................................................................................................. 23
vi
CHAPTER FOUR: DATA ANALYSIS, FINDINGS AND DISCUSSION ................. 24
4.1 Introduction ................................................................................................................. 24
4.1.1 Response Rate ................................................................................................. 24
4.2 Demographic Information ........................................................................................... 25
4.2.1 Gender of the Respondents .............................................................................. 25
4.2.2 Age Bracket ..................................................................................................... 26
4.2.3 Position/Designation in the Bank .................................................................... 27
4.2.4 Academic Qualification ................................................................................... 28
4.2.5 Professional Qualification ............................................................................... 28
4.2.6 Period of Working in the Bank ........................................................................ 29
4.2.7 Period the Bank has Been in Operation ........................................................... 30
4.2.8 Current Shareholding Structure of the Bank ................................................... 31
4.2.9 Size of the Bank in Terms of Total Assets Value in Kenya Shillings ............. 32
4.2.10 Number of Branches Owned by the Bank in Kenya ....................................... 33
4.2.11 Reporting by the IS Audit Team ..................................................................... 34
4.3 Extent of IT-Related Frauds ........................................................................................ 34
4.3.1Introduction ......................................................................................................... 34
4.3.2 Factor Analysis (Communalities) ....................................................................... 36
4.3.2.1 Introduction ..................................................................................................... 36
4.3.2.2 Factor Extraction (Total Variance) .................................................................. 37
4.3.2.3 Scree Plot ......................................................................................................... 39
4.3.2.4 Component Matrix .......................................................................................... 40
4.3.2.5 Factor Isolation ................................................................................................ 43
4.4 Challenges Faced in IT Auditing ................................................................................. 45
4.5 Countermeasures Implemented in Preventing Fraud through IT Auditing ................. 46
4.5.1 IT Audit Detection and Prevention Approaches ............................................. 46
4.5.1.1 Introduction ..................................................................................................... 46
4.5.1.2 Factor Analysis (Communalities) .................................................................... 48
4.5.1.2.1 Introduction ................................................................................................... 48
4.5.1.2.2 Factor Extraction (Total Variance) ............................................................... 49
4.5.1.2.3 Scree Plot ...................................................................................................... 50

vii
4.5.1.2.4 Component Matrix ........................................................................................ 51
4.5.1.2.5 Factor Isolation ............................................................................................. 53
4.5.2 IT Audit Strategies Implemented .................................................................... 54
4.5.2.1 Introduction ..................................................................................................... 54
4.5.2.2 Factor Analysis (Communalities) .................................................................... 56
4.5.2.2.1 Introduction ................................................................................................... 56
4.5.2.2.2 Factor Extraction (Total Variance) ............................................................... 57
4.5.2.2.3 Scree Plot ...................................................................................................... 59
4.5.2.2.4 Component Matrix ........................................................................................ 60
4.5.2.2.5 Factor Isolation ............................................................................................. 63
4.6 IT Auditing and Fraud Prevention Relationship ......................................................... 65
4.6.1 Extent to which IT-Audit Prevents Fraud in the Bank .................................... 65
4.6.2 Factors affecting the Effectiveness of IT Auditing in Preventing Fraud ........ 66
4.6.2.1 Regression Analysis ........................................................................................ 67
4.7 Discussion of the Findings .......................................................................................... 69
CHAPTER FIVE: SUMMARY, CONCLUSION AND RECOMMENDATIONS .... 72
5.1 Introduction ................................................................................................................. 72
5.2 Summary of the Findings ............................................................................................ 72
5.3 Conclusions ................................................................................................................. 72
5.4 Limitations of the Study .............................................................................................. 73
5.5 Recommendation for Further Research ....................................................................... 74
REFERENCES .................................................................................................................. 75
APPENDIX ONE: Research Questionnaire ................................................................... 79
APPENDIX TWO: List of Commercial Banks in Kenya.............................................. 88

viii
LIST OF FIGURES
Figure 2.1: A Bank's Network Infrastructure ...................................................................... 10
Figure 2.2: Technology Acceptance Model 2 ..................................................................... 19
Figure 2.3: Proposed Conceptual Model ............................................................................ 20
Figure 4.1: Scree plot on Types of IT-Related Frauds........................................................ 39
Figure 4.2: Scree Plot on IT Audit Detection and Prevention Approaches against Fraud . 50
Figure 4.3: Scree Plot on IT-Audit Strategies implemented ............................................... 59

ix
LIST OF TABLES
Table 4.1: Gender.............................................................................................................. 25
Table 4.2: Age Bracket ..................................................................................................... 26
Table 4.3: Position/Designation in the Bank .................................................................... 27
Table 4.4: Academic Qualification ................................................................................... 28
Table 4.5: Professional Qualification ............................................................................... 28
Table 4.6: Period of Working in the Bank ........................................................................ 29
Table 4.7: Period the Bank has Been in Operation ........................................................... 30
Table 4.8: Current Shareholding Structure of the Bank ................................................... 31
Table 4.9: Size of the Bank in Terms of Total Assets Value in Kenya Shillings ............. 32
Table 4.10: Number of Branches Owned by the Bank in Kenya ...................................... 33
Table 4.11: Reporting by the IS Audit Team .................................................................... 34
Table 4.12: Extent of IT-Related Frauds .......................................................................... 35
Table 4.13: Factor Analysis (Communalities) .................................................................. 36
Table 4.14: Factor Extraction (Total Variance) ................................................................ 38
Table 4.15: Component Matrix ......................................................................................... 40
Table 4.16: Rotated Component Matrix ........................................................................... 42
Table 4.17: Factor Isolation .............................................................................................. 43
Table 4.18: Challenges faced in IT-Auditing ................................................................... 45
Table 4.19: IT Audit Detection and Prevention Approaches ............................................ 47
Table 4.20: Factor Analysis (Communalities) .................................................................. 48
Table 4.21: Factor Extraction (Total Variance) ................................................................ 49
Table 4.22: Component Matrix ......................................................................................... 51
Table 4.23: Rotated Component Matrix ........................................................................... 52
Table 4.24: Factor Isolation .............................................................................................. 53
Table 4.25: IT Audit Strategies Implemented................................................................... 54
Table 4.26: Factor Analysis (Communalities) .................................................................. 56
Table 4.27: Factor Extraction (Total Variance) ................................................................ 58
Table 4.28: Component Matrix ......................................................................................... 60
Table 4.29: Rotated Component Matrix ........................................................................... 61
Table 4.30: Factor Isolation .............................................................................................. 63
Table 4.31: Extent to which IT Audit Prevents Fraud in the Bank ................................... 66
Table 4.32: Factors affecting the Effectiveness IT Auditing in Preventing Fraud ........... 66
Table 4.33: Model Summary ............................................................................................ 67
Table 4.34: ANOVA (Analysis of Variance) ................................................................... 68
Table 4.35: Estimated Coefficients ................................................................................... 68

x
LIST OF ABBREVIATIONS
ACL- Audit Command Language
ATMs- Automated Teller Machines
BFIU- Banking Fraud Investigation Unit
CAATs- Computer Aided Audit Techniques
CBK- Central Bank of Kenya
CPA- Certified Public Accountant
DMZ- Demilitarized Zone
EFTs- Electronic Funds Transfers
FTP- File Transfer Protocol
GECS- Global Economic Crime Survey
ICPAK- Institute of Certified Public Accountants of Kenya
ICT- Information, Communication and Technology
IDEA- Interactive Data Extraction and Analysis
IDS- Intrusion Detection System
IP- Internet Protocol
IPS- Intrusion Prevention System
IS- Information Systems
ISA- International Standards on Auditing
ISACA- Information Systems Audit and Control Association
ISGA- Information Standards and Guidelines on Auditing
ISO- International Standards Organization
IT- Information Technology
ITGI- Information Technology Governance Institute
INTOSAI- International Organization of Supreme Audit Institutions
KBA- Kenya Bankers Association

xi
Kes- Kenya Shillings
KRA- Kenya Revenue Authority
KRAAC- Kenya Revenue Authority Anti-fraud and Corruption Policy
POS- Point of Sale
RBI- Reserve Bank of India
RMG- Risk Management Guidelines
SMTP- Simple Mail Transfer Protocol
STAR- Statistical Techniques for Analytical Review
TAM- Technology Acceptance Model
VoIP- Voice over Internet Protocol
VPN- Virtual Private Network

xii
ABSTRACT
The study focused on commercial banks in Kenya, as they are dependent on technology
in carrying out their banking operations. The reliance on technology has resulted to
numerous challenges such as multiplicity and complexity of systems, insider security
threats, as well as more exposure to fraud risks. Thus, the need for this study arose, and it
aimed to find ways of curbing the various types of IT-related risks and challenges. The
study sought to determine the extent of IT related fraud in Kenyan commercial banks, to
establish the challenges faced during IT auditing by the IS auditor, to establish the
countermeasures implemented in preventing fraud through IT auditing and to determine
the relationship between IT auditing and fraud prevention. The study made use of the
descriptive survey design. Questionnaires were used to gather data from IS auditors of
various commercial banks in Kenya. Statistical methods such as mean, standard
deviation, factor analysis and regression analysis were utilized to analyze the data
collected from the respondents. From the findings, it was evident that banks had
encountered IT-related fraud. As a result, IS auditors utilize different IT audit approaches
and mitigation strategies in the detection and prevention of fraud and most of the
respondents concurred, to a great extent, that there is a relationship between IT audit and
fraud prevention. It was however noted that most IS auditors did not possess the right
tools to perform effective IT audits. This largely inhibited the effectiveness of detecting
fraud early. In this regard, it is imperative that banks put in place mitigation strategies to
help reduce the prevalent fraud risk. Banks should also ensure that IS auditors are well
equipped with tools to effectively perform their duties. Further, IS auditors should
perform appropriate risk assessments when planning for IT-audits on areas that may be
affected by frauds.

1
CHAPTER ONE
INTRODUCTION
1.1 Background to the Study
In the last decade, environmental factors such as high competition and technological
development, have led to the diversification of banking operations from the traditional
brick and mortar branches to branchless banking (Perspective Magazine, 2009). There is
now a greater dependency on technology in carrying out banking operations. Banks are
encouraging their customers to embrace newer service delivery platforms like the use of
Automated Teller Machines (ATMs), electronic funds transfers (EFTs), mobile banking,
internet banking and agency banking (RBI, 2011). These channels have enabled the faster
moving of funds in the economy, resulting to enhanced efficiency and cost-savings.
The technological-dependency has however resulted in innumerable challenges and risks.
For instance, different types of controls are now required for different computer systems,
there is more multiplicity and complexity of systems, there is more dependency on
vendors due to outsourced IT services, there is an increase in threats from computer-
related fraud and there is need for governance processes to adequately manage
technology and information security (RBI, 2011). Consequently, banks are now more
vulnerable to computer-related fraud since fraudsters are using the computers as tools
through which fraud is perpetrated.
As defined by the KRA Anti-fraud and Corruption Policy (2006), computer fraud occurs
where IT equipment is used to manipulate programs or data dishonestly. Manipulation
occurs where the programs or data are altered, substituted or destroyed. It also occurs
where the use of an IT system becomes a substantial factor in the perpetration of the
fraud and theft of fraudulent use of computer time and resources, including unauthorized
personal browsing on the internet (KRAAC Policy, 2006).

2
From a global fraud study carried out in 2010, it was established that banking and
financial services industry had the most cases of fraud as compared to other industries
(www.acfe.org). The amount of money stolen from commercial banks in Kenya in the
year 2012 according to BFIU, was Kes 1.12B, out of which Kes 393M was recovered. A
BFIU report on trends of fraud cases in the Kenyan banking industry, covering the period
April to June 2013, indicated that electronic crimes continue to be widespread compared
to other types of frauds. Because of these worrying trends, CBK revised the RMG and
gave a recommendation that banks should ensure that an effective internal audit of IT
risks is carried out. The RMG require the IS auditor to identify IT risks by determining
all kinds of threats and exposures present in the ICT system configuration. The auditor is
also expected to review all IT components such as networks, hardware, software,
applications, systems interfaces, operations and human elements.
1.1.1 Information Technology Audit
Information technology (IT) audit involves the collection and evaluation of audit
evidence by the Information Systems (IS) auditor, to determine whether a computer
system is designed to preserve data integrity and safeguard organization’s assets by
allowing effective achievement of organizational goals and efficient use of organization’s
resources (INTOSAI 2008). The IS auditor examines and evaluates an organization’s
information systems, internal controls and procedures so as to ensure that the records are
accurate and information controls are in place (www.ISACA.org). She is responsible for
assessing the risk of irregularities or illegal acts occurring by evaluating the impact of
identified deviations (ISGA No. 9). The auditor performs an audit review by gathering
evidence, which is used in the evaluation of how well an audit criteria has been met. An
IT audit must be objective, impartial and independent and the audit process must be both
systematic and documented (ISO 19011:2011).
When carrying out an IT audit, the IS auditor is expected to design appropriate
procedures to detect illegal acts or irregularities based on the assessed level of risk that
they could occur. She is required to have certain skills to enable her carry out an effective
assessment, which include an understanding of general computer controls, data analytics,

3
basic knowledge of the system infrastructure and risk assessment acumen
(www.theiia.org).
The next step for the IS auditor is to execute the designed procedures and identify the
risks. She is then expected to put in countermeasures to seal loopholes in order to prevent
fraud. Countermeasures can be defined as actions taken in response to an event or
occurrence in order to negate the preliminary action, and are most often a defensive
response (www.businessdictionary.com).
While carrying out her duties, the IS auditor may experience some challenges that may
hinder the effectiveness of the audit. These challenges include inadequate time allocation
for an audit, failure to understand the business processes and systems properly and
inadequate aptitude and skills to perform IT audit work (Chakrabarty, 2013). She should
therefore come up with measures to deal with such challenges such as continuous
learning to enhance her skills and competencies, proper planning prior to the
commencement of an audit and continuous review of the plan during the audit (RBI,
2011). In view of the foregoing, the IS auditor must always keep herself abreast with new
advancements in technology as well as possess the essential IT audit skills, for her to be
effective in her work.
1.1.2 Detection and Prevention of Fraud
Brink and Witt (1982), as cited by Oyinlola (2010), notes that fraud is an ever-present
threat that hampers effective utilization of an organization’s resources. Early detection
and prevention of fraud is therefore becoming an increasingly important subject to
auditors, management, the public and regulators (Albrecht and Albrecht, 2002).
In this regard, ISGA No. 9 stipulates that, management and those charged with
governance have the primary responsibility of preventing and detecting fraud. The
standard however emphasizes that IT auditors should exercise professional skepticism
while performing their work. Although, this is not their primary responsibility, IT

4
auditors are required to identify any fraud risks that may result in material misstatement
of the organization’s reports.
According to Albrecht and Albrecht (2002), the identification of fraud risks requires the
IT auditor to follow an 8-step strategic method, which consists having an understanding
of the process/ business; identification of possible frauds that could exist; identification of
possible fraud symptoms; use of technology to gather data on the identified symptoms;
analysis and refinement of results; investigation of the symptoms; follow up and iteration
of the cycle; and finally the automation of detection procedures. Mukinda (2011) further
denotes that understanding and knowing past frauds is a springboard to combating new
ones, since current frauds are simply old recurring fraud schemes, sometimes with a
twist.
Welch et al (1986), as quoted by Muslimat and Hamid (2012), asserts that there is a
significant relationship between auditing and fraud detection and prevention. The study
indicated that organizations that had an internal audit function presence were more
effective in detecting fraud when compared with those without the audit function. It was
also revealed that, the procedures and tools used must be effective and efficient for the
auditor to detect fraud. Further, a fraud survey conducted by KPMG in 2003 shows that
65% of the frauds were detected by the internal audit while 12% were discovered by
external audit. Coram et al (2006) concurred that there was a positive relationship
between an organization having an internal audit and the number of frauds uncovered by
the audit function.
1.1.3 Commercial Banks in Kenya
Commercial banks in Kenya represent a vibrant link in the flow of funds and the
facilitation of trade and investments. Banks act as financial intermediaries by mobilizing
deposits from the public and investing the funds through lending and other types of
investments. They play an important role in the safeguarding and helping grow

5
customers’ resources, while extending credit facilities for customers’ economic benefit
(www.kba.co.ke).
In pursuant to the Banking Act (Cap.488), Kenyan banks are licensed and regulated by
the Central Bank of Kenya (CBK). CBK regulates banks by enforcing compliance with
the Prudential and Risk Management Guidelines. These guidelines ensure that there is
transparency in the banking industry and that identified risks are mitigated.
(www.centralbank.go.ke). Currently there are 43 commercial banks in Kenya
(www.kba.co.ke).
In the recent years, there has been an increase in technological innovation in Kenyan
commercial banks. Significant milestones have been achieved in the industry for example
the Cheque Truncation System, the Real Time Gross Settlement Scheme, the Automation
of the Clearing House, the sharing of data through Credit Reference Bureaus, and the
sharing of Automated Teller Machine (ATM) networks between banks (www.kba.co.ke).
To support the aforementioned innovations, banks must have a robust ICT system
configuration. Typically, a bank’s IT network infrastructure comprises of firewalls,
routers, switches, phone systems, servers, remote access connections, computers and
printers (Launius, 2009). The network infrastructure enables the bank to transact and
communicate with its branch networks, customers, central bank, other local and
international banks, outsourced vendors and telecommunication companies. Using the
network, commercial banks are able to perform online transactions with their customers,
such as cash withdrawals, cash deposits, remittance of funds, the use of plastic cards
through Point of Sale (POS) and customer account updates. Banks are also able to
transfer data files to other banks or to transmit statements and advices to their customers
(RBI, 2011).
Although the network infrastructure has led to an increase in the speed of transacting and
greater efficiencies, these technological innovations have increased the levels of
vulnerabilities within the banks and augmented the avenues for exploitation (Mulwa,

6
2012). Against this backdrop, it is now imperative for the banking industry to be armed
with tools to protect its resources and avert the risk of being victims to fraud.
1.2 Statement of the Problem
The banking industry is heavily reliant on technology to carry out its operations. This has
resulted in diverse delivery channels that have increased the options offered to customers
to carry out their transactions with ease, speed and convenience (RBI, 2011). These
developments have however led to various challenges such as dependence on vendors
due to outsourced IT services, multiplicity and complexity of systems, insider security
threats, as well as more exposure to fraud risks (RBI, 2011).
In December 2010 alone, it was reported that Kenyan commercial banks lost Kes 500
Million through fraud (Mukinda, 2011). Further, Pricewaterhouse Coopers conducted a
global economic survey in November 2011 on fraud in the Kenyan market. The report
indicated that 34% of the respondents had experienced a computer network related fraud
in 2011, a 13% increase since the last survey conducted in 2009 (GECS, 2011). The
analysis of the survey indicated that, in Kenya, there was a 9% increase in levels of
computer related fraud in 2011 as compared to 2009.
To thwart electronic frauds that are on the increase (BFIU, 2013), there has been a high
implementation rate of IT auditing in the Kenyan banking industry because banks are
required to comply with the CBK Risk Management Guidelines of January 2013. Other
reasons leading to the surge of IT auditing include, automation of most of the banking
processes (KBA, 2013); the heightened threat from hacking and information theft (Solms,
2005); and the need to manage fraud, IT systems failures and disruptions (RMG, 2013).
In this context, the IS auditor is faced with different tasks of providing audit assurance on
IT systems as well as adding value through early detection and prevention of frauds. The
audit tools available combined with deductive reasoning can enable the IS auditor to be
more proactive in detecting fraud. The IS auditor should, therefore, prudently assess

7
fraud risk because of the high costs that are associated with either too little or too much
investigation (Albrecht and Albrecht, 2002). There is little economic value where too
much investigation is done and no fraud is present, while failure to judiciously investigate
where fraud is present results in significantly astronomical costs (Palmrose 1987;
Nieschwietz et al, 2000).
There has, however, been much controversy on what is expected from IT auditors in the
prevention and detection of fraud. Gay et al (1997) points out that the assertion that the
auditor has the responsibility in the prevention and detection of fraud, is a controversial
topic and this has been a subject that is most often debated by auditors, regulators and the
public. Further, there seem to be discord between the audit profession and the
management, on the responsibility of the IS auditor in detecting and preventing fraud.
The audit profession guidelines stipulate that the management has the primary
responsibility to prevent and detect irregularities and illegal acts (ISGA No. 9; ISA 240).
Other studies however, reveal that there is a wide performance-expectation gap since
auditors feel that the detection of fraud is management’s responsibility, whilst the
management disagrees (Alleyne and Howard, 2005; Lee et al, 2009). Literature reviews
on the study have further cast reservations on what is expected from auditors and there
are varied opinions amongst auditors on the expectation-performance gap (Sherer and
Turley, 2007).
Therefore, this study sought to fill in the disparities in the studies, apprehensions and
approaches relating to role of the IS auditor in the early detection and prevention of fraud
by addressing the following research questions: What is the extent of IT related fraud in
commercial banks in Kenya? What challenges are faced in an IT audit? What are the
countermeasures implemented by the IS auditor in curbing fraud? Is there a relationship
between IT auditing and the fraud prevention?

8
1.3 Objectives of the Study
The objectives of the study are to:
1. Determine the extent of IT related fraud in Kenyan commercial banks.
2. Establish the challenges faced during IT auditing by the IS auditor in Kenyan
commercial banks.
3. Establish the countermeasures implemented in preventing fraud through IT
auditing in Kenyan commercial banks.
4. Determine the relationship between IT auditing and fraud prevention in Kenyan
commercial banks.
1.4 Value of the Study
Although IT auditing is a relatively new concept in Kenya, its implementation rate is high
in Kenyan commercial banks due to different factors, as mentioned under Section 1.2. In
researching on the concept, literature on IT audit effectiveness and the detection and
prevention of fraud was reviewed in order to answer the four research questions.
The researcher’s objective was to establish whether there is a relationship between IT
audit and detection and prevention of fraud. The study adopted the technology-oriented
model of carrying out audits that is dependent on the fraud risk assessments results. Both
qualitative and quantitative data collection and analysis methods were used to establish
the relationship.
The outcome of the study is expected to provide comprehensive findings for IT audit
professionals that shall further their tactical knowledge, as they carry out their duties. It
shall also be useful to users, such as the government, CBK, ICPAK and ISACA, who
develop control frameworks, as well as Kenyan commercial banks, who are complying
with the CBK Risk Management Guidelines. The study shall also add to the body of
knowledge for scholars.

9
CHAPTER TWO
LITERATURE REVIEW
2.1 The Extent of IT Related Fraud
The banking industry is heavily dependent on technology to carry out its operations, and
as such, banking business and technology cannot be discussed in isolation (RBI, 2011).
Diverse delivery channels have immensely increased the options offered to customers to
carry out their transactions with ease, speed and convenience. These developments have
led to various challenges such as dependence on vendors due to outsourced IT services,
multiplicity and complexity of systems, insider security threats, as well as more exposure
to fraud risks (RBI, 2011).
With these IT growth and development, fraud techniques have also evolved over time,
and fraudsters are now targeting computer networks to perpetrate fraud. In a bank, frauds
can either be perpetrated by an insider, an external party or both parties can collude to
defraud the bank. Baker et al. (2008), as quoted by Mulwa (2012) indicates that insider
threats are a big threat since they have access to information and assets and can easily
pounce on vulnerabilities. Schultz (2002), as cited by Mulwa (2012), further asserts that
external threats receive a lot of attention due to their frequency, magnitude or complexity
and they include physical security breaches, hacking attempts, system sabotage amongst
others. Richards (2008), as mentioned by Launius (2009), notes that unauthorized access
to the network can be through war-driving, where criminals drive around with laptops
looking for vulnerable wireless access points. War-dialing is also another threat, where
hackers get unauthorized access into private networks through a modem, asserts Gunn
(2006), as cited by Launius (2009).
Other ways to commit fraud include sniffing, which allows the criminal to see plain text
login credentials and confidential information transferred over networks; malware
program which hackers can use to obtain credentials that can facilitate access to
confidential information. Wilson (2005), as quoted by Launius (2009) annotates that

10
phishing attacks lure victims to a website masquerading as the legitimate web page. This
form of attack affects the internet-banking channel of service delivery. A malware
programme known as root kit is usually accompanied by keyloggers to capture sensitive
information such as log-in credentials.
Typically, the ICT system configuration in a bank comprises of internal and external
networks, hardware, software, applications, system interfaces, operations and human
elements, RMG (2013). The internal network infrastructure components include,
firewalls, routers, switches, phone systems, servers, remote access connections,
computers and printers (Launius, 2009), refer to Figure 2.1. RBI (2009) points out that
the security of the network depends on having a secure configuration being defined for
applications, servers and platforms.
Figure 2.1: A Bank's Network Infrastructure
Source: Launius (2009)

11
Aeran (2006) has further reviewed the different types of security threats that an
organization may have to face, and this includes; theft of intellectual property and an
organization’s confidential information, for instance extracting a list of high networth
customers and selling them to competitors for commercial gain; password cracking and
getting users passwords through illegal installations like keyloggers in order to carry out
transactions through identity theft. RBI 2011, points out that criminals commit frauds
such as phishing, database and server hacking, network attacks, cross site scripting, card
cloning, obtaining confidential information through social engineering and insider
threats, that may result in financial and reputational loss.
To show the extent of fraud in the Kenyan market, Pricewaterhouse Coopers conducted a
global economic survey in November 2011. The report indicated that 34% of the
respondents had experienced a computer network related fraud in 2011, a 13% increase
since the last survey conducted in 2009 (GECS, 2011). The analysis of the survey
indicated that, in Kenya, there was a 9% increase in levels of computer related fraud in
2011 as compared to 2009.
From another survey conducted by a consulting firm, Deloitte, in May 2011, the report
indicated that banking fraud had tripled in 2010 to a massive Kes 3 Billion when
compared to 2009. BFIU report for the 2nd
quarter of 2013, have also shown that
electronics crimes continue to be rampant compared to other frauds, with numerous cases
on forgery of application from for RTGS, internet banking and easy 24/7, being reported.
To curb the different types of IT-related fraud, the Banking Act (Cap.488), through CBK,
has mandated Kenyan commercial banks to ensure that customers’ information is kept
confidential from intruders. The CBK Risk Management Guideline No. 7 requires
commercial banks to ensure that they protect their ICT system configuration from attacks
by identifying possible breaches to the network infrastructure through IT risks analysis.
The guideline further denotes that security threats such as malware infestation and
internal sabotage could cause severe disruptions to banking operations with huge losses

12
being incurred and therefore vigilant monitoring of security risks is crucial in containing
IT related risks through IT auditing.
2.2 Information Technology Auditing
The IT Governance Institute (ITGI) defines IT governance as “the leadership and
organizational structures and processes that ensure that the organization’s information
technology sustains and extends the organization’s strategies and objectives”. IT audit is
a subset of the IT governance framework that involves collecting and evaluating audit
evidence and it helps determine whether a computer system is designed to preserve data
integrity and safeguard the assets of the organization by allowing effective achievement
of organizational goals and the efficient use of the organization’s resources (INTOSAI,
2008). The IT audit process requires the IS auditor to work together with management in
identifying controls weaknesses and risks that arise due to the use of technology in
running business operations.
Across the globe, the adoption of IT auditing by organizations has been accelerated by
regulations and compliance requirements such as Basel II and Sarbanes-Oxley Act
(Nicho, 2008). These frameworks were developed to act as points of reference to
organizations in managing risks after the financial scandals that led to the collapse of
high profile corporations such as Enron and Worldcom (Coram et al., 2006). In Kenya,
commercial banks are required to carry out an effective audit of IT risks, by the CBK
Risk Management Guidelines of January 2013. This has been necessitated by factors such
as the automation of most of the banking processes (KBA, 2013) and the need to thwart
electronic frauds that are on the increase (BFIU, 2013).
There are different types of IT audits that can be performed depending on the audit
criteria (ISACA, 2013). These includes audits of systems and applications, information
processing facilities, system development, management of IT and enterprise architecture,
and client/server, telecommunications, intranets, and extranets. A systems and
applications audit seeks to establish whether systems and applications are efficient and

13
that they are adequately controlled to ensure the output from the system is reliable and
timely. An information processing facilities audit, verifies the processing facility to
ensure that there is efficient processing of inputs that shall generate accurate and reliable
output. A systems development audit ensures that the developed system is in accordance
with requirements in order to meet organization’s goals. Management of IT and
enterprise architecture audit involves checking whether the IT management has
developed an organizational structure and procedures to ensure a controlled and efficient
environment for information processing. A client/server, telecommunications, intranets,
and extranets audit seeks to verify that there are adequate controls on the IT network
infrastructure (ISACA, 2013).
In order to perform this audits, the IS auditor is required to adopt a systematic process of
planning, studying and understanding controls, testing and evaluating controls, reporting
and follow up (ISO 19011:2011). This process assists the auditor in improving and
implementing quality systems, in the face of different types of IT audits, by applying a
risk-based audit approach, use of computer-aided audit tools and techniques, and
application of standards like ISO 90003 and ISO 17799 in order to draw valid
conclusions (Gallegos et al, 1998).
2.3 Challenges Faced and Measures Implemented in Fraud
Prevention
In 2008, ITGI carried out a global survey to determine the challenges faced by those
charged with IT governance. The key findings of the survey indicated that
communication flow between IT staff and users is still slow, but improving; the
alignment between IT governance and business strategy needed to be improved; IT-
related problems still persisted in organizations and while IT security was an issue,
people were the most critical problem; and IT expertise appreciation and delivery
capability was average (ISC Journal, 2008).

14
Chakrabarty (2013), points out that audit of systems has not been effective in early the
detection of fraud due to various factors. These include, inadequate time allocated for an
audit, poor sampling methods used in checking of transactions, and lack of trained
personnel with the required skill and aptitude to perform IT audit work, poor planning of
audit work, not understanding the business processes and systems properly. The June
2008 CPA Journal cited that some of the reasons why auditors fail to identify red flags
during an audit were lack of experience; lack of awareness or recognition of an
observable condition indicating fraud; failure to brainstorm potential fraud schemes and
scenarios; overreliance on client representations and lack of effort to detect fraud
(www.nysscpa.org).
To counter these challenges, RBI (2011) pointed out that fraud detection and prevention
is a specialized function and as such, IT auditors must undergo continuous training to
enhance their skills and competencies. The auditors should also properly plan the audit,
and the audit plan should be reviewed in the course of the audit to check if it is still
addressing the intended audit objective. Further, the IS auditor must possess essential
skills, which include an understanding of general computer controls, data analytics,
knowledge of the system infrastructure and an excellent risk acumen (www.theiia.org).
General computer controls involve understanding the internal controls around IT systems
and applications and the review of controls that mitigate the risk of threats to the systems.
Data analytics skill requires the IS auditor to inspect, clean, transform and model data and
highlight useful information and suggest recommendations. The knowledge about
networks, hardware, operating systems, databases and applications is essential for the IS
auditor, so that she can be able to assess the risks and ensure that they addressed
appropriately.
Detective measures can be reactive or proactive. Albrecht and Albrecht (2002) denote
that “most of the traditional fraud detection methods are reactive since they are initiated
by tips or complaints, control overrides or other indicators that someone observes or
hears”. Instead of using reactive measures such as relying on whistleblowers and
anonymous calls, the IS auditor should be more proactive by taking on a hands-on

15
approach to fraud detection (Coderre, 2009). The proactive approach requires the IS
auditor to aggressively target specific types of frauds and look for indicators, symptoms
or red flags (Albrecht and Albrecht, 2002).
In his research, Launius (2009) reiterates that, “understanding the threats present to a
private network is important to properly design the perimeter protection for banks”. ISO
27001 and ISO 27002:2005 explicitly require risk assessments to be carried out by
examining the security policy, organization of information security, physical and
environmental security, access controls amongst others.
The IS auditor, can use various statistical methods and tools in detecting fraud which
includes Deloitte’s Statistical Techniques for Analytical Review (STAR) tool, which
helps in the identification of abnormal patterns such as significant fluctuations on data
(Deloitte’s, 2013); ACL for data analysis used for testing relevant transactions across all
applicable business systems and applications (Coderre, 2009). From an assessment
carried out in 2011, RBI recommended that the IS auditor should consider fraud
vulnerability assessments while identifying fraud risk factors as part of IT risk assessment
and audit process. Further, CBK RMG (2013) recommends the use of vulnerability
scanners, penetration testing tools and operational and management controls when testing
and evaluating the effectiveness of IT controls. Banks are therefore expected to
implement tools and techniques that shall help support the procedure that the IS auditors
will be performing to increase efficiency and effectiveness of the IT audit.
The RBI report further pointed out that IS auditors must enhance the use of Computer
Aided Audit Techniques (CAATs), which may be used effectively in areas such as
detection of revenue leakage, the assessment of control weakness and the monitoring of
customer transactions for any abnormal patterns RBI (2011). Practices that need to be
followed to enable early detection and prevention of fraud include review of new
products and processes; creation of fraud awareness amongst staff and customers;
enforcing know your employee/vendor procedures; ensuring there is adequate physical
security on IT assets; ensuring that there are strict password account management

16
practices; and ensuring there is proper segregation of duties and dual control is
implemented. Other mechanisms that the IS auditor can implement to detect fraud
include establishing a confidential way of reporting suspected fraud such as having a
dedicated email id and phone number for whistleblowing; mystery shopping and reviews;
monitoring of transactions for any irregular patterns; implement a software that shall
generate alerts where fraud is suspected (RBI, 2011).
To find vulnerabilities in a network, the IS auditor can use tools such Nmap, a free tool
used for network surveying and scanning by probing an IP address or a range of IP
addresses and gathering useful information such as the operating system used, the type of
devise or the service being provided (Launius, 2009). Network reconnaissance and port
scanning reveals the potential holes in the network infrastructure, such as ports that are
accessible, that can be used by criminals to launch an attack. Launius, (2009) has listed
other security tools that can be used by the IS auditor which include: Kismet, another free
wireless scanning tool, which can detect any wireless network, whether the network
broadcast is hidden or not; Aircrack-ng, which can break certain encryption algorithms
that are meant to protect data travelling on a wireless network. Wireshark and Tcpdump
are free tools that are used for sniffing any plain text information transferred over
networks from programs like FTP. Nessus is used for vulnerability scanning that
identifies security problems in remote computers. Lemos (2009) notes that “a tool named
Warvox can be used to speed up war-dialing by using VoIP Lines.”
The IS auditor needs to also regularly review the IT strategy, policies and procedures
covering areas such as the network architecture, procurement of hardware and software,
processes of out-sourcing, in-sourcing and in-house development of solutions (RBI,
2011). Two models have been discussed below to supplement literature reviews on
measures the IS auditor needs embrace in order to be effective in early fraud detection
and prevention.

17
2.3.1 Strategic Fraud Detection Model
To guide the IS auditor to early detection of fraud, Albrecht and Albrecht (2002) came up
with the Strategic Fraud Detection Model, which is an 8-step process that an IS auditor
should follow. The model combines both deductive reasoning and technology to provide
a more effective way to detecting fraud.
The first step denotes that each business environment is different and there is no generic
fraud detection procedure that can apply to all businesses. The IS auditor is therefore
required to gain an understanding of the business by familiarizing herself with the
policies and procedures, interviewing key personnel and performing data analysis. The
second step requires the IS auditor to identify possible frauds that could exist in that
business environment. This is achieved through risk assessment through data analysis,
interviews with personnel and brainstorming sessions with other auditors.
The IS auditor is expected to carry out careful analysis in the third step, by considering if
there are symptoms in the identified fraud cases. Once the symptoms are defined,
supporting data is extracted in the fourth step. Queries run on data should be on the whole
population and not on a sampling basis. The fifth step calls for analysis and refining the
results. Once anomalies are highlighted and identified as fraud indicators the IS auditor
can then investigate them further. The seventh step requires the auditor to follow up on
all the identified symptoms and improve or implement new controls to increase efficiency
and effectiveness of processes. The last step requires the IS auditor to automate the
detection procedures. Once refined, these can be integrated to the business processes in
order to prevent anomalies before they occur.

18
2.3.2 Technology Acceptance Model (TAM) 2
Although the concept of IT auditing is new in the Kenyan market, the implementation
rate has been high due to various factors such as the automation of business processes
and the increase in electronic crimes (KBA, 2013). These factors, amongst others, have
compelled the auditor to use technological tools and techniques in the review of security
risks. Some of the challenges that IS auditors face in the detection and prevention on
fraud as mentioned in Section 2.3 include lack of trained personnel with the required skill
and aptitude to perform IT audit work and lack of effort to detect fraud (Chakrabarty,
2013).
TAM 2, developed by Venkatesh and Davis in 2000, is a good theoretical tool that seeks
to establish the effectiveness of IT auditing through application of technology tools and
techniques. This model, as depicted in Figure 2.2, has two processes, the social influence
process, which includes subjective norm, voluntariness and image; and the cognitive
instrumental processes, which includes job relevance, output quality, result
demonstrability and perceived usefulness (upload.wikipedia.org).
This study focused on the cognitive instrumental process. Huang et al. (2011) elaborates
the factors under cognitive instrumental process as follows: job relevance has been
defined as “an individual’s perception regarding the degree to which the target system is
applicable to her job”, that assisted in establishing the effect of IT auditing on the IS
auditor; output quality has been defined as “the degree to which an individual judges the
effect of a new system”; result demonstrability has been defined as “tangibility of the
results of using the innovation”; and perceived usefulness implies that users will have a
good perception of the system which shall lead to more effectiveness.

19
Figure 2.2: Technology Acceptance Model 2
Source: upload.wikipedia.org
2.4 Relationship between IT Auditing and Fraud Prevention
Welch et al (1986), as cited by Muslimat and Hamid (2012), noted that there is a
significant relationship between auditing and fraud detection and prevention. The study
indicated that organizations that had an internal audit function presence were more
effective in detecting fraud when compared with those without the audit function. It was
also revealed that, the procedures and tools used must be effective and efficient for the
auditor to detect fraud.
Technology Acceptance Model

20
From a study on the importance of the internal audit in fraud detection, Coram et al.
(2006) concluded that there is “a significant positive relation between an organization
having an internal audit function and the number and value of self-reported frauds.”
Luehlfing et al. (2003), Marden and Edwards (2005) and Belloli (2006), as quoted by
Coram et al. (2006), agree that, “internal audit is a vital tool in fraud detection when
assets are misappropriated by employees or outsiders” and the ability to detect fraud is
therefore more augmented for organizations that have an internal audit department than
those without.
Using the proposed conceptual model in Figure 2.3, the study sought to confirm whether
there is a direct relationship between IT auditing and detection and prevention of fraud,
and whether the use of technological tools and techniques in performing tests from a
fraud risk perspective, is an effective way that leads to early detection of fraud.
Source: Researcher (2013)
Early Fraud Detection
and Prevention
Tools Used Management
Support
Skills Possessed
� Proper
communication
between audit
and management
� Prompt
implementation
of IT audit
recommendations
Availability of
tools for:
� Data analysis
� Vulnerability
testing
� Penetration
testing
� Risk acumen
� Communication
skills
� Data analytics
� An
understanding
of the IT
infrastructure
Time Allocated
� Adequate
time
allocated to
audit
Figure 2.3: Proposed Conceptual Model

21
From the proposed conceptual model, the independent variables are skills that the IS
auditor must possess, the tools used in data analysis and vulnerability testing, time
allocated for IT audit assignments and management support in the implementation of IT
audit recommendations. The dependent variable is early fraud detection and prevention.
The IS auditor must possess skills that enable her to adequately review the IT network
infrastructure, properly gain an understanding of the business processes, which eventually
assist in determining the fraud risks present. She should then prepare a log of the
identified fraud risks, categorized the risks after taking into consideration the Bank’s risk
appetite and come up with a risk matrix. During the risk analysis exercise, the IS auditor
must brainstorm with the team members as well as work closely with the management in
order to ensure that all fraud risks are identified and addressed. The auditor should then
choose an appropriate tool to use, for instance, she can use ACL for data analysis or
Nmap for network vulnerability testing.
As mentioned earlier, the IS auditor faces various challenges in her work such as
inadequate time being allocated for an audit, poor sampling methods being used,
overreliance on client representations amongst others (CPA Journal, 2008). It is therefore
imperative, for the auditor to ensure all these challenges are addressed in a timely fashion
to facilitate an effective audit. Once completed, a report on findings must be prepared
with the necessary recommendation. Where control gaps are identified, the IS auditor
must implement countermeasures to seal the loopholes which ultimately lead to the early
detection and prevention of fraud.

22
CHAPTER THREE
RESEARCH METHODOLOGY
3.1 Introduction
This chapter sets out various stages and phases that were followed in the collection,
measurement and analysis of data. The following subsections are included; research
design, population of the study, data collection and data analysis.
3.2 Research Design
This study made use of a descriptive survey design. This design was used since it is more
flexible and it enabled the researcher to collect both qualitative and quantitative data.
3.3 Population of the Study
The study was conducted on all the 43 commercial banks in Kenya and the questionnaires
were distributed to selected representatives. A census approach was used and all the
representatives of the entire population (the respondents) were targeted. Refer to
Appendix I.
3.4 Data Collection
The data was collected with structured questionnaires. IS auditors were requested to fill
in the questionnaires which contained both closed and open-ended questions to extract
accurate information from the respondents.
The questionnaire had five sections, Section A which covered the respondent’s
background, Section B which covered the types of computer-related frauds, Section C

23
which covered the challenges the IS auditor faced in managing fraud, Section D which
covered the detection and prevention strategies employed by the IS auditor in commercial
banks in Kenya and Section E which covered the relationships of auditing and detection
and prevention of fraud.
A “drop-and-pick latter” approach was employed to collect data from IS auditors in
various banks. This enabled the researcher in assisting the respondents in case of any
issues in filling the questionnaires and ensuring maximum or high response rates.
The questionnaires underwent a test run to ensure effective data capture and reliability
before the official roll out.
3.5 Data Analysis
On receiving the questionnaires from the respondents, the data was checked to ensure
completeness and consistency. The data was then coded and tabulated to facilitate data
analysis and subjected to various analyses.
Descriptive statistic such as mean scores, standard deviation and percentages were used
to analyze the data collected for Section A, B, C and D. Factor analysis was further done
to rank the various factors for each research objective in order of suitability. Regression
analysis was used on the data collected in Section E, to establish if there was a
relationship between IT audit and prevention and detection of fraud.

24
CHAPTER FOUR
DATA ANALYSIS, FINDINGS AND DISCUSSIONS
4.1 Introduction
This chapter discusses the analysis of data and the findings thereof. Apoyo (2011) defines
data analysis as the process of reducing large amount of collected data, to data that
addresses the initial proposition of the study. The research findings relate to the research
objectives that guided the study. The data from the completed questionnaires was
analyzed and a summary of the key findings presented. Statistical methods which
included mean, standard deviation and factor analysis were used.
The chapter is divided into five sections: Section One highlights the demographic
information of the population, Section Two reports on the various types of IT related
frauds facing commercial banks in Kenya, Section Three covers the challenges faced in
IT auditing, Section Four which highlights the detection and prevention measures in IT
auditing against fraud and Section Five covers the IT auditing and fraud prevention
relationship.
4.1.1 Response Rate
From the study, 36 out of 43 sample respondents filled in and returned the questionnaires
making a response rate 83.72%. This reasonable response rate was made a reality after
the researcher made personal calls and visits to remind the respondents to fill in and
return the questionnaires. According to Mugenda and Mugenda (1999) a response rate of
50% is adequate for analysis and reporting; a rate of 60% is good and a response rate of
70% and over is excellent; therefore, this response rate was excellent for analysis and
reporting.

25
4.2 Demographic Information
An analysis of demographic data was done and from the questionnaires respondents gave
their personal details like Gender, Age, position and duration of their services. Data
which related to the organization such as number of branches, ownership structure, period
of operation and size of the organization. These demographic information was essential
in providing a background of both the respondents and the banks under study.
4.2.1 Gender of the Respondents
Data on gender was collected from 36 respondents, the data was analyzed and the
outcome was as presented on Table 4.1.
Table 4.1: Gender Gender Frequency Percent
Male 35 97.2
Female 1 2.8
Total 36 100.0
Source: Researcher (2013)
According to the findings, 97.2% of the respondents were male while 2.8% of the
respondents were female. Generally, this information may be useful in drawing
conclusions about the gender distribution in the IT auditing field.

26
4.2.2 Age Bracket
Data related to the age of the respondents was collected and tabulated as presented on
Table 4.2.
Table 4.2: Age Bracket Age Bracket Frequency Percent
Between 25 and 30 2 5.6
Between 31 and 35 8 22.2
Between 36 and 40 16 44.4
Between 41 and 45 8 22.2
46 and above 2 5.6
Total 36 100.0
Source: Researcher (2013)
The findings indicate that most of the IT auditing professionals were aged between 36
and 40 years, having had a representation of 44.4%. 22.2% of the respondents were aged
between 31 and 35 years and between 41 and 45 years, respectively, while 5.6% of the
respondents were aged between 25 and 30 years and 46 and above years, respectively.

27
4.2.3 Position/Designation in the Bank
Data on respondent’s designation was collected and analyzed as presented in Table 4.3.
Table 4.3: Position/Designation in the Bank Position/ Designation Frequency Percent
IS Audit Manager 25 69.4
IS Audit Officer 1 2.8
IT Manager 8 22.2
IT Project Manager 2 5.6
Total 36 100.0
Source: Researcher (2013)
From the findings, 69.4% of the respondents were IS audit managers whose main
responsibility is ensuring that IT-related risks are addressed in a timely manner in order
to avert IT fraud. 22.2% of the respondents were IT managers, 5.6% of the respondents
were IT project managers while 2.8% of the respondents were IS audit officers. There
were respondents who did not have audit-related designation, that is, their designations
were IT managers and IT Project Managers. These respondents as depicted in Table 4.5
had however completed certification courses in security and auditing, to enable them
perform the IT-auditing role.

28
4.2.4 Academic Qualification
Data on respondent’s academic qualification was collected and analyzed as presented in
Table 4.4.
Table 4.4: Academic Qualification Academic Qualification Frequency Percent
Master Degree 4 11.1
Undergraduate Degree 32 88.9
Total 36 100.0
Source: Researcher (2013)
According to the findings, 88.9% of the respondents had an undergraduate degree while
11.1% of the respondents had a master degree.
4.2.5 Professional Qualification
Data on respondent’s professional qualification was collected and analyzed as presented
in Table 4.5.
Table 4.5: Professional Qualification Professional Qualification Frequency Percent
Certified Information Systems Audit 18 50.0
Certified Fraud Examiner 2 5.6
Certified Public Accountant 9 25.0
Certified Information Security Manager 4 11.1
Microsoft Certified Systems Engineer 1 2.8
Cisco Certified Network Administrator 2 5.6
Total 36 100.0
Source: Researcher (2013)
The findings established that 50% of the professionals had a qualification in Certified
Information Systems Audit, 25% of the respondents had a Certified Public Accountant
qualification, 11.1% of the respondents had a Certified Information Security Manager

29
qualification, 5.6% of the respondents had a Certified Fraud Examiner and Cisco
Certified Network Administrator qualification respectively, while 2.8% of the
respondents had a Microsoft Certified Systems Engineer qualification. Certification in
information security, auditing and accounting is key in ensuring that the IS auditor
possesses the necessary skills in order to perform the IT audit role effectively.
4.2.6 Period of Working in the Bank
Table 4.6: Period of Working in the Bank Period worked Frequency Percent
Below 5 years 22 61.1
Between 5 and 10 years 4 11.1
Between 10 and 15 years 2 5.6
Between 16 and 20 years 6 16.7
Over 20 years 2 5.6
Total 36 100.0
Source: Researcher (2013)
Table 4.6 shows that majority of the respondents (61.1%) had worked in the bank below
5 years. This is an indicator that in the last five years most banks have embraced the IT
audit profession. 16.7% of the respondents indicated that they had worked in the bank for
between 16 and 20 years, 11.1% of the respondents indicated that they had worked in the
bank for between 5 and 10 years while 5.6% of the respondents indicated that they had
worked in the bank for between 10 and 15 years and over 20 years, respectively.

30
4.2.7 Period the Bank has Been in Operation
Data relating to the period of operation was collected and the analysis presented in Table
4.7.
Table 4.7: Period the Bank has Been in Operation Bank’s period in operation Frequency Percent
10 years and below 4 11.1
Between 21 and 30 years 15 41.7
Between 31 and 40 years 1 2.8
Over 40 years 16 44.4
Total 36 100.0
Source: Researcher (2013)
The analyzed data show that 44.4% of the respondents indicated that the bank had been in
operation for over 40 years, 41.7% of the respondents indicated that the bank had been in
operation for between 21 and 30 years, 11.1% of the respondents indicated that the bank
had been in operation for 10 years and below while 2.8% of the respondents indicated
that the bank had been in operation for between 31 and 40 years.

31
4.2.8 Current Shareholding Structure of the Bank
Data on bank’s ownership was collected and presented in Table 4.8.
Table 4.8: Current Shareholding Structure of the Bank Shareholding Structure Frequency Percent
Locally owned institution 7 19.4
Government controlled
majority shares institution
2 5.6
Foreign owned but locally
incorporated
8 22.2
Foreign owned NOT locally
incorporated
1 2.8
Owned by both local and
foreigners
18 50.0
Total 36 100.0
Source: Researcher (2013)
According to the findings, 50% of the respondents indicated that the bank was owned by
both local and foreigners, 22.2% of the respondents indicated that the bank was foreign
but locally incorporated, 19.4% of the respondents indicated that the bank was a local
owned institution, 5.6% of the respondents indicated that the Government controlled
majority shares institution while 2.8% of the respondents indicated that the bank was
foreign owned but not locally incorporated.

32
4.2.9 Size of the Bank in Terms of Total Assets Value in Kenya
Shillings
Respondents gave response on the size of their bank as analyzed and presented on Table
4.9.
Table 4.9: Size of the Bank in Terms of Total Assets Value in Kenya
Shillings Total Assets Value (Kes) Frequency Percent
10 billion and below 3 8.3
Between 11 and 20 billion 3 8.3
Between 21 and 30 billion 11 30.6
Between 31 and 40 billion 2 5.6
Above 50 billion 17 47.2
Total 36 100.0
Source: Researcher (2013)
From the findings, 47.2% of the respondents indicated that the total asset value was
above 50 billion, 30.6% of the respondents indicated that the total asset value was
between 21 and 30 billion, 8.3% of the respondents indicated that the total asset value
was between 11 and 20 billion and 10 billion and below, respectively while 5.6% of the
respondents indicated that the total asset value was between 31 and 40 billion. This is an
indication that banks are compliant with the regulations on capital requirements and that
the shareholders have invested and expect high returns.

33
4.2.10 Number of Branches Owned by the Bank in Kenya
Data on the number of branches owned by the Bank was analyzed and presented on Table
4.10.
Table 4.10: Number of Branches Owned by the Bank in Kenya Branches Owned Frequency Percent
20 and below 19 52.8
Between 21 and 40 5 13.9
Between 41 and 60 7 19.4
Between 61 and 80 2 5.6
Above 80 3 8.3
Total 36 100.0
Source: Researcher (2013)
From the findings, 52.8% of the respondents indicated that the bank owned 20 and below
branches, 19.4% of the respondents indicated that the bank owned between 41 and 60
branches, 13.9% of the respondents indicated that the bank owned between 21 and 40
branches, 8.3% of the respondents indicated that the bank owned above 80 branches
while 5.6% of the respondents indicated that the bank owned between 61 and 80
branches.

34
4.2.11 Reporting by the IS Audit Team
From the findings on Table 4.11, 80.6% of the respondents indicated that IS audit team
reported to the Board Audit Committee while 19.4% of the respondents indicated that IS
audit team reported to the Head of Internal Audit.
Table 4.11: Reporting by the IS Audit Team Reporting by the IS Audit Team Frequency Percent
Board Audit Committee 29 80.6
Head of Internal Audit 7 19.4
Total 36 100.0
Source: Researcher (2013)
4.3 Extent of IT-Related Frauds
4.3.1 Introduction
The first objective of the study sought to find out the extent to which banks had
encountered the following IT-related fraud. The data collected was analyzed and
presented on Table 4.12. Responses were measured using a five point Likert scale as
follows; 1 represented no extent at all, 2 represented little extent, 3 represented moderate
extent, 4 represented great extent and 5 represented very great extent. To consolidate and
give presentation of the data, the study used the statistical functions of mean and standard
deviation. The mean represents the average rating of all the respondents to the IT-related
fraud while the corresponding standard deviation shows the range within which the
individual ratings are from the mean.

35
Table 4.12: Extent of IT-Related Frauds No. IT-Related Frauds Mean
Score
Standard
Deviation
1 Unauthorized network access 2.75 0.77
2 Hacking (accessing a computer network by circumventing its
security system)
1.92 1.27
3 Malware programs 2.30 1.19
4 Sniffing (being able to seeing plain text login credentials and
confidential information)
1.67 0.86
5 Cross site scripting (bypassing access controls by use of scripts) 2.17 0.65
6 Hardware-based key loggers (they capture keystrokes) 1.53 0.69
7 Destruction of critical data 1.83 0.73
8 Password cracking 1.47 0.77
9 Tampering with data (unauthorized changes of data or records) 2.86 0.96
10 Theft (stealing information) 3.33 0.76
11 Installation of unauthorized software 2.75 1.34
12 Sabotage 2.31 1.60
13 Intellectual property theft 2.97 1.06
14 Software-based key loggers (they capture keystrokes) 2.19 1.17
15 Password cracking 2.11 1.17
16 Identity theft 3.00 1.33
17 Data interception and manipulation 3.33 1.29
18 Phone call/ Short Messaging System (SMS) interception 2.78 1.33
19 Data interception during file uploads 3.58 1.34
20 Spoofing (pretending to be something or someone that one is
not)
3.97 1.08
21 Phishing (acquiring information and/or money from people
without their knowledge)
4.06 1.04
22 Insider threats (e.g. selling employer’s confidential information
to the competitors)
3.75 1.03
Source: Researcher (2013)
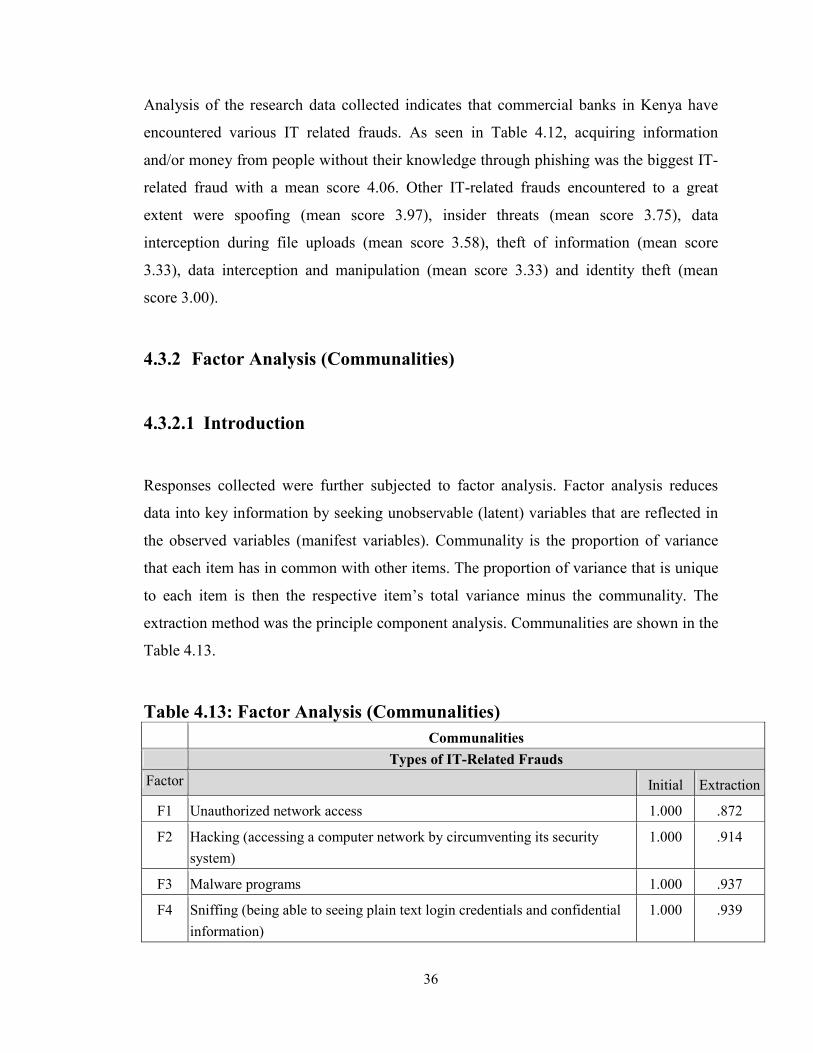
36
Analysis of the research data collected indicates that commercial banks in Kenya have
encountered various IT related frauds. As seen in Table 4.12, acquiring information
and/or money from people without their knowledge through phishing was the biggest IT-
related fraud with a mean score 4.06. Other IT-related frauds encountered to a great
extent were spoofing (mean score 3.97), insider threats (mean score 3.75), data
interception during file uploads (mean score 3.58), theft of information (mean score
3.33), data interception and manipulation (mean score 3.33) and identity theft (mean
score 3.00).
4.3.2 Factor Analysis (Communalities)
4.3.2.1 Introduction
Responses collected were further subjected to factor analysis. Factor analysis reduces
data into key information by seeking unobservable (latent) variables that are reflected in
the observed variables (manifest variables). Communality is the proportion of variance
that each item has in common with other items. The proportion of variance that is unique
to each item is then the respective item’s total variance minus the communality. The
extraction method was the principle component analysis. Communalities are shown in the
Table 4.13.
Table 4.13: Factor Analysis (Communalities)
Communalities
Types of IT-Related Frauds
Factor Initial Extraction
F1 Unauthorized network access 1.000 .872
F2 Hacking (accessing a computer network by circumventing its security
system)
1.000 .914
F3 Malware programs 1.000 .937
F4 Sniffing (being able to seeing plain text login credentials and confidential
information)
1.000 .939

37
F5 Cross site scripting (bypassing access controls by use of scripts) 1.000 .790
F6 Hardware-based key loggers (they capture keystrokes) 1.000 .829
F7 Destruction of critical data 1.000 .974
F8 Password cracking 1.000 .903
F9 Tampering with data (unauthorized changes of data or records) 1.000 .854
F10 Theft (stealing information) 1.000 .878
F11 Installation of unauthorized software 1.000 .927
F12 Sabotage 1.000 .975
F13 Intellectual property theft 1.000 .765
F14 Software-based key loggers (they capture keystrokes) 1.000 .745
F15 Password cracking 1.000 .835
F16 Identity theft 1.000 .889
F17 Data interception and manipulation 1.000 .808
F18 Phone call/ Short Messaging System (SMS) interception 1.000 .838
F19 Data interception during file uploads 1.000 .846
F20 Spoofing (pretending to be something or someone that one is not) 1.000 .913
F21 Phishing (acquiring information and/or money from people without their
knowledge)
1.000 .884
F22 Insider threats (e.g. selling employer’s confidential information to the
competitors)
1.000 .781
Source: Researcher (2013)
4.3.2.2 Factor Extraction (Total Variance)
In the case of the Types of IT-Related Frauds, principle analysis component was used to
extract 22 factors. Eigen values indicate the relative importance of each factor accounting
for a particular set and hence those with small Eigen values were omitted. As depicted on
Table 4.14, only 4 factors were significant for the analysis.

38
Table 4.14: Factor Extraction (Total Variance)
Total Variance Explained
Types of IT-Related Frauds C
om
po
nen
t
Initial Eigen values
Extraction Sums of Squared
Loadings
Rotation Sums of Squared
Loadings
Total
% of
Variance
Cumulative
% Total
% of
Variance
Cumulative
% Total
% of
Variance
Cumulative
%
1 13.046 59.299 59.299 13.046 59.299 59.299 6.301 28.640 28.640
2 2.852 12.962 72.261 2.852 12.962 72.261 6.108 27.765 56.405
3 1.719 7.815 80.076 1.719 7.815 80.076 4.359 19.813 76.218
4 1.480 6.729 86.804 1.480 6.729 86.804 2.329 10.586 86.804
5 .722 3.284 90.088
6 .655 2.979 93.067
7 .528 2.400 95.467
8 .398 1.809 97.276
9 .213 .969 98.245
10 .180 .818 99.063
11 .111 .504 99.567
12 .095 .433 100.000
13 8.436E-16 3.835E-15 100.000
14 7.447E-16 3.385E-15 100.000
15 3.020E-16 1.373E-15 100.000
16 1.683E-16 7.648E-16 100.000
17 6.857E-17 3.117E-16 100.000
18 6.406E-18 2.912E-17 100.000
19 -1.621E-16 -7.367E-16 100.000
20 -2.520E-16 -1.145E-15 100.000
21 -6.210E-16 -2.823E-15 100.000
22 -8.166E-16 -3.712E-15 100.000
Source: Researcher (2013)

39
4.3.2.3 Scree Plot
The scree plot is a plot of the factor Eigen value against the component numbers.
According to the scree plot on Figure 4.1, we only considered 4 factors because the
curves tend to flatten from the fourth component onwards, due to relatively low Eigen
values.
Figure 4.1: Scree plot on Types of IT-Related Frauds
Source: Researcher (2013)

40
4.3.2.4 Component Matrix
Component matrix contains the relative Eigen values in respect of each factor. Each
factor belongs to one of the set of factors extracted and is determined by the Eigen values
of the factors relative to each set. Table 4.15 shows which set each factor falls into.
Table 4.15: Component Matrix
Types of IT-Related Frauds Component
1 2 3 4 5
Unauthorized network access .803 -.098 .213 -.414
Hacking (accessing a computer network by circumventing its
security system)
.789 -.513 .034 .168
Malware programs .723 -.186 -.340 -.514
Sniffing (being able to seeing plain text login credentials and
confidential information)
.913 -.251 -.207 .017
Cross site scripting (bypassing access controls by use of scripts) .748 .222 .159 -.395
Hardware-based key loggers (they capture keystrokes) .669 -.503 .240 .265
Destruction of critical data .364 -.177 .899 .037
Password cracking .677 -.256 -.304 .535
Tampering with data (unauthorized changes of data or records) .766 .450 -.248 -.060
Theft (stealing information) .829 -.077 .380 .202
Installation of unauthorized software .819 -.337 -.371 -.070
Sabotage .903 -.309 -.249 -.050
Intellectual property theft .770 .324 .256 -.040
Software-based key loggers (they capture keystrokes) .727 -.287 .132 -.343
Password cracking .789 -.397 -.014 .234
Identity theft .917 .161 .074 -.127
Data interception and manipulation .842 .302 .033 -.079
Phone call/ Short Messaging System (SMS) interception .899 -.105 -.118 .075
Data interception during file uploads .668 .623 -.086 -.070
Spoofing (pretending to be something or someone that one is not) .791 .491 .089 .195
Phishing (acquiring information and/or money from people
without their knowledge)
.769 .498 .001 .212
Insider threats (e.g. selling employer’s confidential information to
the competitors)
.547 .560 -.084 .401
Source: Researcher (2013)

41
Table 4.15 presents the factor analysis on the first objective of determining the extent of
IT related fraud in Kenyan commercial banks using the extraction method: principal
component analysis with 4 components extracted. Each component represents the
correlation between item and the unrotated factor (e.g. in the case of types of IT- related
Frauds, the correlation between Malware programs and factor 1 is 0.723). These
correlations help formulate an interpretation of the factors of components. This is done by
looking for a common thread among the variables that have large loadings for a particular
factor or components. The table shows that majority of the factors had high loadings.
From the results in Table 4.16, the variables that measured IT audit and fraud prevention
in commercial banks in Kenya in one way or the other are highly correlated with this
factor.

42
Table 4.16: Rotated Component Matrix
Types of IT-Related Frauds Component
1 2 3 4
Unauthorized network access .744
Hacking (accessing a computer network by circumventing
its security system)
.846
Malware programs .855
Sniffing (being able to seeing plain text login credentials
and confidential information)
.756
Cross site scripting (bypassing access controls by use of
scripts)
.660
Hardware-based key loggers (they capture keystrokes) .762
Destruction of critical data .975
Password cracking .889
Tampering with data (unauthorized changes of data or
records)
.794
Theft (stealing information) .575
Installation of unauthorized software .752
Sabotage .763
Intellectual property theft .689
Software-based key loggers (they capture keystrokes) .680
Password cracking .821 .250 .237
Identity theft .635
Data interception and manipulation .712
Phone call/ Short Messaging System (SMS) interception .665
Data interception during file uploads .864
Spoofing (pretending to be something or someone that one
is not)
.888
Phishing (acquiring information and/or money from people
without their knowledge)
.886
Insider threats (e.g. selling employer’s confidential
information to the competitors)
.847
Extraction Method: Principal Component Analysis. Rotation Method: Varimax with Kaiser
Normalization.
Source: Researcher (2013)

43
4.3.2.5 Factor Isolation
Factor analysis involves isolating each of the variable factors and grouping them by the four
extracted factors based on their factor loading on each set. Table 4.17 shows the summary of the
factor isolation.
Table 4.17: Factor Isolation Factor Group Types of IT-Related Frauds
Factor 1 Data Theft and Manipulation
� Tampering with data (unauthorized changes of data or records)
� Intellectual property theft
� Identity theft
� Data interception and manipulation
� Data interception during file uploads
� Spoofing (pretending to be something or someone that one is not)
� Phishing (acquiring information and/or money from people without
their knowledge)
� Insider threats (e.g. selling employer’s confidential information to
the competitors)
Factor 2 IT Systems Insecurity
� Hacking (accessing a computer network by circumventing its
security system)
� Sniffing (being able to seeing plain text login credentials and
confidential information)
� Hardware-based key loggers (they capture keystrokes)
� Password cracking
� Installation of unauthorized software
� Sabotage
� Password cracking
� Phone call/ Short Messaging System (SMS) interception
Factor 3 Unauthorized Access
� Unauthorized network access
� Malware programs
� Cross site scripting (bypassing access controls by use of scripts)
� Software-based key loggers (they capture keystrokes)
� Password cracking

44
Factor 4 Data Loss
� Destruction of critical data
� Theft (stealing information)
� Password cracking
Source: Researcher (2013)
Table 4.17 shows that there are 4 extracted groups on the extent of IT-related frauds.
Data theft and manipulation, IT systems security and unauthorized access are the
extracted group factors 1, 2 and 3 which contain the most number of variable
components. Factor 1 isolates data theft and manipulation as listed in Table 4.17 and
includes (i) Tampering with data (ii) Intellectual property theft (iii) Identity theft (iv)
Data interception and manipulation (v) Data interception during file uploads (vi)
Spoofing (vii) Phishing; and (viii) Insider threats.
Factor 2 elements comprises IT systems insecurity and it includes (i) hacking (ii) sniffing
(iii) hardware-based key loggers (iv) password cracking (v) installation of unauthorized
software (vi) Sabotage (vii) Password cracking; and (viii) Phone call/ Short Messaging
System interception. Factor 3 elements comprises unauthorized access and includes (i)
unauthorized network access (ii) malware programs (iii) cross site scripting (iv) software-
based key loggers; and (v) password cracking. Factor 4 elements comprises of the
following IT-related frauds (i) destruction of critical data (ii) theft (stealing information)
(iii) password cracking.
It is clear that most of the 22 factors listed in the questionnaire were grouped together by
their correlation with each other and brought down to four main group factors. The most
number of factor elements were in groups 1, 2 and 3 while few elements fell in factor
group 4.

45
4.4 Challenges Faced in IT Auditing
The second objective of the study sought to establish the challenges faced during IT
auditing by the IS auditor in Kenyan commercial banks. The data collected was analyzed
and presented in Table 4.18. Responses were measured using a five point Likert scale as
follows; 1 represented no extent at all, 2 represented little extent, 3 represented moderate
extent, 4 represented great extent and 5 represented very great extent. To consolidate and
give presentation of the data, the study used the statistical functions of mean and standard
deviation. The mean represents the average rating of all the respondents to the IT-related
fraud while the corresponding standard deviation shows the range within which the
individual ratings are from the mean.
Table 4.18: Challenges faced in IT-Auditing No Challenges faced in IT-Auditing Mean
Score
Standard
Deviation
1 Lack of audit tools to use during an IT audit 3.03 0.77
2 Insufficient time being allocated per IT audit assignment 2.31 0.75
3 Lack of technical expertise in using vulnerability tools 2.83 0.74
4 Lack of adequate knowledge on the banks IT policies and
procedures
1.25 0.44
5 Failure of management in implementing and carrying out
staff training on fraud
1.94 0.53
6 Failure by management in implementing IT audit
recommendations
1.75 0.77
7 The absence of a formal fraud policy in place 1.00 0.00
8 Fraud policy not regularly being referred to in employee
communications
1.39 0.69
Source: Researcher (2013)
According to the findings, the respondents indicated that they faced lack of audit tools to
use during an IT audit (mean score 3.03) and lack of technical expertise in using
vulnerability tools (mean score 2.83) to a great extent. The respondents indicated that

46
they faced insufficient time being allocated per IT audit assignment, failure of
management in implementing and carrying out staff training on fraud and failure by
management in implementing IT audit recommendations to a little extent as shown by
mean scores of 2.31, 1.94 and 1.75 respectively. The respondents indicated that they
faced fraud policy not regularly being referred to in employee communications, lack of
adequate knowledge on the banks IT policies and procedures and the absence of a formal
fraud policy in place to a very little extent as shown by mean scores of 1.39, 1.25 and
1.00 respectively.
4.5 Countermeasures Implemented in Preventing Fraud through IT
Auditing
The third objective sought to establish the countermeasures implemented in preventing
fraud through IT auditing in Kenyan commercial banks. Data was collected on IT audit
detection and prevention approaches against fraud and on IT audit strategies implemented
to curb fraud.
4.5.1 IT Audit Detection and Prevention Approaches
4.5.1.1 Introduction
Responses were measured using a five point Likert scale as follows; 1 represented no
extent at all, 2 represented little extent, 3 represented moderate extent, 4 represented great
extent and 5 represented very great extent. To consolidate and give presentation of the
data, the study used the statistical functions of mean and standard deviation. The mean
represents the average rating of all the respondents to the IT-related fraud while the
corresponding standard deviation shows the range within which the individual ratings are
from the mean. Data collected was analyzed and presented in Table 4.19.

47
Table 4.19: IT Audit Detection and Prevention Approaches No IT Audit Detection and Prevention Approaches Mean
Score
Standard
Deviatio
n
1 Network surveying
(to obtain information on the network map such as
domain names, server names, internet service provider
information, IP addresses of hosts)
3.97 0.77
2 Network reconnaissance
(scanning a network for available information such as
ports that are accessible)
3.97 0.77
3 Port scanning
(to obtain information about closed and open ports that
are running on the network)
3.97 0.77
4 Vulnerability scanning
(by attempting to analyze the weaknesses noted from the
scans to launch an attack)
3.97 0.77
5 Password cracking 1.78 1.27
6 Social engineering
(attempting to obtain security information from staff/
customers)
2.81 0.79
7 Physical security checks on IT assets 2.97 1.11
8 Use of data analytics
(to analyze financial data for fraud patterns)
3.17 1.54
Source: Researcher (2013)
According to the findings, the respondents indicated that network surveying; network
reconnaissance; port scanning and vulnerability scanning were largely used by banks as
shown by a mean score of 3.97 respectively. The respondents indicated that the use of
data analytics, physical security checks on IT assets and social engineering were applied
to a moderate extent as shown by mean scores of 3.17, 2.97 and 2.81, respectively. The
respondents further indicated that password cracking was used to a little extent (mean
score of 1.78).

48
4.5.1.2 Factor Analysis (Communalities)
4.5.1.2.1 Introduction
Responses collected were further subjected to factor analysis. Factor analysis reduces
data into key information by seeking unobservable (latent) variables that are reflected in
the observed variables (manifest variables). Communality is the proportion of variance
that each item has in common with other items. The proportion of variance that is unique
to each item is then the respective item’s total variance minus the communality. The
extraction method was the principle component analysis. Communalities are shown in the
Table 4.20.
Table 4.20: Factor Analysis (Communalities)
Communalities
IT Audit Detection and Prevention Approaches
F1 Network surveying (to obtain information on the network map such as
domain names, server names, internet service provider information, IP
addresses of hosts)
1.000 .995
F2 Network reconnaissance (scanning a network for available information
such as ports that are accessible)
1.000 .995
F3 Port scanning (to obtain information about closed and open ports that are
running on the network)
1.000 .995
F4 Vulnerability scanning (by attempting to analyze the weaknesses noted
from the scans to launch an attack)
1.000 .995
F5 Password cracking 1.000 .891
F6 Social engineering (attempting to obtain security information from staff/
customers)
1.000 .728
F7 Physical security checks on IT assets 1.000 .774
F8 Use of data analytics (to analyze financial data for fraud patterns) 1.000 .856
Source: Researcher (2013)

49
4.5.1.2.2 Factor Extraction (Total Variance)
In the case of the IT Audit Detection and Prevention Approaches, principle analysis
component was used to extract 8 factors. Eigen values indicate the relative importance of
each factor accounting for a particular set and hence those with small Eigen values were
omitted. As depicted on Table 4.21, only 3 factors were significant for the analysis.
Table 4.21: Factor Extraction (Total Variance)
Total Variance Explained
IT Audit Detection and Prevention Approaches
Co
mp
onen
t Initial Eigen values
Extraction Sums of Squared
Loadings
Rotation Sums of Squared
Loadings
Total
% of
Variance
Cumulative
% Total
% of
Variance
Cumulative
% Total
% of
Variance
Cumulative
%
1 4.636 57.954 57.954 4.636 57.954 57.954 4.145 51.808 51.808
2 1.586 19.825 77.778 1.586 19.825 77.778 1.674 20.931 72.739
3 1.006 12.578 90.356 1.006 12.578 90.356 1.409 17.617 90.356
4 .528 6.603 96.958
5 .243 3.042 100.000
6 .000 .000 100.000
7 .000 .000 100.000
8 .000 .000 100.000
Source: Researcher (2013)

50
4.5.1.2.3 Scree Plot
The scree plot is a plot of the factor Eigen value against the component numbers.
According to the scree plot in Figure 4.2, we only considered 3 factors because the curves
tend to flatten from the third component onwards, due to relatively low Eigen values.
Figure 4.2: Scree Plot on IT Audit Detection and Prevention
Approaches against Fraud
Source: Researcher (2013)

51
4.5.1.2.4 Component Matrix
Component matrix contains the relative Eigen values in respect of each factor. Each
factor belongs to one of the set of factors extracted and is determined by the Eigen values
of the factors relative to each set. Table 4.22 shows which factor each set falls into.
Table 4.22: Component Matrix
IT Audit Detection and Prevention Approaches against
Fraud
Component
1 2 3 4 5
Network surveying (to obtain information on the network
map such as domain names, server names, internet service
provider information, IP addresses of hosts)
.980 .071 -.173
Network reconnaissance (scanning a network for available
information such as ports that are accessible)
.980 .071 -.173
Port scanning (to obtain information about closed and open
ports that are running on the network)
.980 .071 -.173
Vulnerability scanning (by attempting to analyze the
weaknesses noted from the scans to launch an attack)
.980 .071 -.173
Password cracking .447 .608 .567
Social engineering (attempting to obtain security
information from staff/ customers)
-.360 .756 .166
Physical security checks on IT assets -.194 .765 -.389
Use of data analytics (to analyze financial data for fraud
patterns)
.656 -.199 .622
Source: Researcher (2013)
Table 4.22 presents the factor analysis of the Information Technology Audit and Fraud
Prevention in Commercial Banks in Kenya. Each component represents the correlation
between item and the unrotated factor (e.g. in the case of IT Audit Detection and
Prevention Approaches against Fraud, the correlation between Port scanning and factor 1
is 0.980). These correlations help formulate an interpretation of the factors of
components. This is done by looking for a common thread among the variables that have
large loadings for a particular factor or components.

52
From the results in Table 4.23, the variables that measured Information Technology
Audit and Fraud Prevention in Commercial Banks in Kenya in one way or the other are
highly correlated with this factor.
Table 4.23: Rotated Component Matrix
IT Audit Detection and Prevention Approaches against
Fraud
Component
1 2 3
Network surveying (to obtain information on the network
map such as domain names, server names, internet service
provider information, IP addresses of hosts)
.979
Network reconnaissance (scanning a network for available
information such as ports that are accessible)
.979
Port scanning (to obtain information about closed and open
ports that are running on the network)
.979
Vulnerability scanning (by attempting to analyze the
weaknesses noted from the scans to launch an attack)
.979
Password cracking .890
Social engineering (attempting to obtain security
information from staff/ customers)
.672
Physical security checks on IT assets . .879
Use of data analytics (to analyze financial data for fraud
patterns)
.590
Extraction Method: Principal Component Analysis. Rotation Method: Varimax with Kaiser
Normalization.
Source: Researcher (2013)

53
4.5.1.2.5 Factor Isolation
Factor analysis involves isolating each of the variable factors and grouping them by the eight
extracted factors based on their factor loading on each set. Table 4.24 shows the summary of the
factor isolation.
Table 4.24: Factor Isolation Factor Group Detection and Prevention Measures in IT-Audit against Fraud
Factor 1 Network scanning
� Network surveying (to obtain information on the network map such
as domain names, server names, internet service provider
information, IP addresses of hosts)
� Network reconnaissance (scanning a network for available
information such as ports that are accessible)
� Port scanning (to obtain information about closed and open ports
that are running on the network)
� Vulnerability scanning (by attempting to analyze the weaknesses
noted from the scans to launch an attack)
Factor 2 IT Security Checks
� Social engineering (attempting to obtain security information from
staff/ customers)
� Physical security checks on IT assets
Factor 3 Password Cracking and Data Analysis
� Password cracking
� Use of data analytics (to analyze financial data for fraud patterns)
Source: Researcher (2013)
Table 4.24 shows that there are 3 extracted groups on Detection and Prevention Measures
in IT-audit against Fraud. Factor 1 covering network scanning isolates most of the
detection and prevention approaches in IT-Audit against fraud as follows (i) network
surveying (ii) network reconnaissance (iii) port scanning (iv) vulnerability scanning.
Factor 2 elements comprise of the following IT security checks and includes (i) social
engineering (ii) physical security checks on IT assets. Factor 3 on system access and data
analysis isolated the following elements (i) password cracking (ii) use of data analytics.

54
Most of the 8 factors listed in the questionnaire were grouped together by their
correlation with each other and brought down to 3 main group factors. The most number
of factor elements were in group 1 whilst a few elements fell in factor group 2 and 3.
4.5.2 IT Audit Strategies Implemented
4.5.2.1 Introduction
The study sought to find out the IT audit strategies implemented by the bank in
preventing IT-related fraud. Table 4.25 presents the findings on the data collected.
Responses were measured using a five point Likert scale as follows; 1 represented no
extent at all, 2 represented little extent, 3 represented moderate extent, 4 represented great
extent and 5 represented very great extent. To consolidate and give presentation of the
data, the study used the statistical functions of mean and standard deviation. The mean
represents the average rating of all the respondents to the IT-related fraud while the
corresponding standard deviation shows the range within which the individual ratings are
from the mean.
Table 4.25: IT Audit Strategies Implemented No IT Audit Strategies Implemented Mean
Score
Standard
Deviation
1 Ensuring a formal fraud policy is in place 4.78 0.42
2 Carrying our regular reviews of information security
processes, policies and standards and providing
recommendations to seal loopholes that may lead to fraud
4.58 0.50
3 Application of robust fraud risk assessment, during the
planning phase of the IT audit
4.39 0.65
4 Enforcing compliance of the policies and controls 4.67 0.48
5 Ensuring that duly executed Service Level Agreements,
with third party service providers, are in place
4.67 0.48
6 Ensuring that the bank has implemented strict password 4.78 0.42

55
and account management policies and practices
7 Ensuring that role based access controls and/or dual access
controls are instituted
4.86 0.35
8 Ensuring that there is proper segregation of duties 4.69 0.62
9 Ensuring that data loss prevention suites are used (e.g.
restrictions on removal media like flash disks, CDs, etc.)
4.28 0.61
10 Ensuing that the bank has secure backup and recovery
processes in place
4.69 0.47
11 Ensuring prompt deactivation of computer access
following staff termination
4.61 0.49
12 Recommending built in controls during software
development
4.56 0.50
13 Enforcing the use of data encryption 4.44 0.50
14 Ensuring that there is use of structured defense against
remote attacks (e.g. installation of firewalls)
4.69 0.47
15 Establishing a confidential mechanism of reporting of
suspected fraud cases (e.g. through whistle blowing,
anonymous calls)
4.58 0.50
16 Ensuring that system change controls are implemented 4.11 0.32
17 Ensuring that there is tracking and securing of the physical
environment (e.g. by use biometric systems)
4.36 0.49
18 Recommending the need of staff fraud awareness training 3.92 0.65
Source: Researcher (2013)
From the findings, the respondents indicated that to a very great extent, banks had
implemented IT audit strategies by ensuring that role based access controls and/or dual
access controls are instituted (mean score of 4.86), formal fraud policy was is in place
(mean score of 4.78) and strict password and account management policies and practices
implementation (mean score of 4.78). The respondents further indicated that banks had
implemented IT audit strategies by ensuring that there is proper segregation of duties, by
ensuring that there are secure backup and recovery processes in place and that there is use

56
of structured defense against remote attacks (mean score of 4.69) respectively. The
respondents also pointed out that banks had implemented IT audit strategies by enforcing
compliance of the policies and controls and ensuring that duly executed Service Level
Agreements, with third party service providers, are in place to a very great extent (mean
score of 4.67).
4.5.2.2 Factor Analysis (Communalities)
4.5.2.2.1 Introduction
Responses collected were further subjected to factor analysis. Factor analysis reduces
data into key information by seeking unobservable (latent) variables that are reflected in
the observed variables (manifest variables). Communality is the proportion of variance
that each item has in common with other items. The proportion of variance that is unique
to each item is then the respective item’s total variance minus the communality. The
extraction method was the principle component analysis. Communalities are shown in the
Table 4.26.
Table 4.26: Factor Analysis (Communalities)
Communalities
IT Audit Strategies Implemented
F1 Ensuring a formal fraud policy is in place 1.000 .935
F2 Carrying our regular reviews of information security
processes, policies and standards and providing
recommendations to seal loopholes that may lead to
fraud
1.000 .851
F3 Application of robust fraud risk assessment, during
the planning phase of the IT audit
1.000 .832
F4 Enforcing compliance of the policies and controls 1.000 .965
F5 Ensuring that duly executed Service Level
Agreements, with third party service providers, are
in place
1.000 .965

57
F6 Ensuring that the bank has implemented strict
password and account management policies and
practices
1.000 .935
F7 Ensuring that role based access controls and/or dual
access controls are instituted
1.000 .931
F8 Ensuring that there is proper segregation of duties 1.000 .852
F9 Ensuring that data loss prevention suites are used
(e.g. restrictions on removal media like flash disks,
CDs, etc.)
1.000 .910
F10 Ensuing that the bank has secure backup and
recovery processes in place
1.000 .919
F11 Ensuring prompt deactivation of computer access
following staff termination
1.000 .900
F12 Recommending built in controls during software
development
1.000 .925
F13 Enforcing the use of data encryption 1.000 .864
F14 Ensuring that there is use of structured defense
against remote attacks (e.g. installation of firewalls)
1.000 .919
F15 Establishing a confidential mechanism of reporting
of suspected fraud cases (e.g. through whistle
blowing, anonymous calls)
1.000 .951
F16 Ensuring that system change controls are
implemented
1.000 .736
F17 Ensuring that there is tracking and securing of the
physical environment (e.g. by use biometric
systems)
1.000 .837
F18 Recommending the need of staff fraud awareness
training
1.000 .938
4.5.2.2.2 Factor Extraction (Total Variance)
In the case of IT-audit strategies implemented, 18 factors were extracted of which five
were significant for the analysis. Eigen values indicate the relative importance of each
factor accounting for a particular set and hence those with small Eigen values were
omitted. According to Table 4.27, only 5 factors were significant for the analysis.

58
Table 4.27: Factor Extraction (Total Variance)
Total Variance Explained
IT Audit Strategies Implemented C
om
po
nen
t Initial Eigen values
Extraction Sums of Squared
Loadings
Rotation Sums of Squared
Loadings
Total
% of
Variance
Cumulative
% Total
% of
Variance
Cumulative
% Total
% of
Variance
Cumulative
%
1 7.665 42.584 42.584 7.665 42.584 42.584 5.873 32.629 32.629
2 3.280 18.224 60.808 3.280 18.224 60.808 3.882 21.568 54.198
3 2.489 13.830 74.638 2.489 13.830 74.638 2.569 14.273 68.471
4 1.417 7.872 82.510 1.417 7.872 82.510 2.488 13.823 82.294
5 1.314 7.300 89.809 1.314 7.300 89.809 1.353 7.515 89.809
6 .761 4.229 94.038
7 .341 1.896 95.933
8 .295 1.639 97.572
9 .215 1.195 98.767
10 .175 .971 99.738
11 .047 .262 100.000
12 8.862E-16 4.923E-15 100.000
13 1.297E-16 7.207E-16 100.000
14 6.260E-17 3.478E-16 100.000
15 2.436E-17 1.353E-16 100.000
16 -3.250E-34 -1.806E-33 100.000
17 -2.666E-16 -1.481E-15 100.000
18 -1.707E-15 -9.482E-15 100.000
Extraction Method: Principal Component Analysis.
Source: Researcher (2013)

59
4.5.2.2.3 Scree Plot
This is a plot of the factor Eigen value against the component numbers. According to the
scree plot in Figure 4.3, we only considered 5 factors because the curves tend to flatten
from the fifth component onwards, due to relatively low Eigen values.
Figure 4.3: Scree Plot on IT Audit Strategies implemented
Source: Researcher (2013)

60
4.5.2.2.4 Component Matrix
Component matrix contains the relative Eigen values in respect of each factor. Each
factor belongs to one of the sets of factors extracted and is determined by the Eigen
values of the factors relative to each set. Table 4.28 shows which set each factor falls
into.
Table 4.28: Component Matrix
IT Audit Strategies Implemented Component
1 2 3 4 5
Ensuring a formal fraud policy is in place .883 -.235 .308 .070 -.017
Carrying our regular reviews of information security
processes, policies and standards and providing
recommendations to seal loopholes that may lead to fraud
.843 .243 -.194 -.143 .149
Application of robust fraud risk assessment, during the
planning phase of the IT audit
.266 .267 .686 -.443 .151
Enforcing compliance of the policies and controls .882 .134 .098 -.360 -.172
Ensuring that duly executed Service Level Agreements, with
third party service providers, are in place
.882 .134 .098 -.360 -.172
Ensuring that the bank has implemented strict password and
account management policies and practices
.883 -.235 .308 .070 -.017
Ensuring that role based access controls and/or dual access
controls are instituted
.741 .157 .368 .462 -.092
Ensuring that there is proper segregation of duties .415 .272 -.254 .581 .450
Ensuring that data loss prevention suites are used (e.g.
restrictions on removal media like flash disks, CDs, etc.)
.725 -.296 -.480 -.255 .039
Ensuing that the bank has secure backup and recovery
processes in place
.771 -.535 .149 .110 .066
Ensuring prompt deactivation of computer access following
staff termination
.488 .514 -.139 .097 -.607
Recommending built in controls during software
development
-.035 .223 .848 .381 -.103
Enforcing the use of data encryption .316 .842 -.062 .087 .209
Ensuring that there is use of structured defense against
remote attacks (e.g. installation of firewalls)
.771 -.535 .149 .110 .066
Establishing a confidential mechanism of reporting of
suspected fraud cases (e.g. through whistle blowing,
anonymous calls)
.572 .650 -.420 .156 .025

61
Ensuring that system change controls are implemented .310 .193 .092 -.248 .729
Ensuring that there is tracking and securing of the physical
environment (e.g. by use biometric systems)
.701 .014 -.559 .077 -.165
Recommending the need of staff fraud awareness training -.274 .874 .239 -.192 -.069
Extraction Method: Principal Component Analysis.
Source: Researcher (2013)
Table 4.28 presents the factor analysis of the Information Technology Audit and Fraud
Prevention in Commercial Banks in Kenya. Each component represents the correlation
between item and the unrotated factor (e.g. in the case of IT Audit Strategies
Implemented, the correlation between ensuring that role based access controls and/or dual
access controls are instituted and factor 1 is 0.741). These correlations help formulate an
interpretation of the factors of components. This is done by looking for a common thread
among the variables that have large loadings for a particular factor or components.
From the results in Table 4.29, the variables that measured Information Technology
Audit and Fraud Prevention in Commercial Banks in Kenya in one way or the other are
highly correlated with this factor.
Table 4.29: Rotated Component Matrix
IT Audit Strategies Implemented Component
1 2 3 4 5
Ensuring a formal fraud policy is in place .909
Carrying our regular reviews of information security
processes, policies and standards and providing
recommendations to seal loopholes that may lead to fraud
.595
Application of robust fraud risk assessment, during the
planning phase of the IT audit
.714
Enforcing compliance of the policies and controls .701
Ensuring that duly executed Service Level Agreements,
with third party service providers, are in place
.701
Ensuring that the bank has implemented strict password
and account management policies and practices
.909

62
Ensuring that role based access controls and/or dual access
controls are instituted
.700
Ensuring that there is proper segregation of duties .733
Ensuring that data loss prevention suites are used (e.g.
restrictions on removal media like flash disks, CDs, etc.)
.739
Ensuing that the bank has secure backup and recovery
processes in place
.946
Ensuring prompt deactivation of computer access following
staff termination
.617
Recommending built in controls during software
development
.149
Enforcing the use of data encryption .842
Ensuring that there is use of structured defense against
remote attacks (e.g. installation of firewalls)
.946
Establishing a confidential mechanism of reporting of
suspected fraud cases (e.g. through whistle blowing,
anonymous calls)
.934
Ensuring that system change controls are implemented .786
Ensuring that there is tracking and securing of the physical
environment (e.g. by use biometric systems)
.571
Recommending the need of staff fraud awareness training .450
Extraction Method: Principal Component Analysis. Rotation Method: Varimax with Kaiser
Normalization.
Source: Researcher (2013)

63
4.5.2.2.5 Factor Isolation
Factor analysis involves isolating each of the variable factors and grouping them by the
eight extracted factors based on their factor loading on each set. Table 4.30 shows the
summary of the factor isolation.
Table 4.30: Factor Isolation IT Audit Strategies Implemented
Factor 1 Compliance to Policies and Procedures
� Ensuring a formal fraud policy is in place
� Ensuring that the bank has implemented strict password and
account management policies and practices
� Ensuring that role based access controls and/or dual access controls
are instituted
� Ensuring that the bank has secure backup and recovery processes in
place
� Recommending built in controls during software development
� Ensuring that there is use of structured defense against remote
attacks (e.g. installation of firewalls)
Factor 2 IT-Audit Checks
� Carrying out regular reviews of information security processes,
policies and standards and providing recommendations to seal
loopholes that may lead to fraud
� Ensuring that there is proper segregation of duties
� Ensuring prompt deactivation of computer access following staff
termination
� Enforcing the use of data encryption
� Establishing a confidential mechanism of reporting of suspected
fraud cases (e.g. through whistle blowing, anonymous calls)
Factor 3 IT Security Checks
� Ensuring that data loss prevention suites are used (e.g. restrictions
on removal media like flash disks, CDs, etc.)
� Ensuring that there is tracking and securing of the physical
environment (e.g. by use biometric systems)

64
Factor 4 IT Audit Planning and Audit Recommendations
� Application of robust fraud risk assessment, during the planning
phase of the IT audit
� Enforcing compliance of the policies and controls
� Ensuring that duly executed Service Level Agreements, with third
party service providers, are in place
� Recommending the need of staff fraud awareness training
Factor 5 Change Controls Implementation
� Ensuring that system change controls are implemented
Source: Researcher (2013)
Table 4.30 shows there are 5 extracted group factors. Extracted group factors 1 and 2
contain the most number of variable components. Factor 1 on compliance to policies and
procedures shows the following isolated IT-audit strategies (i) ensuring a formal fraud
policy is in place (ii) ensuring that the bank has implemented strict password and account
management policies and practices (iii) ensuring that role based access controls and/or
dual access controls are instituted (iv) ensuring that the bank has secure backup and
recovery processes in place (v) recommending built in controls during software
development; and (vi) ensuring that there is use of structured defense against remote
attacks.
IT audit checks make up factor 2 elements which comprises of the following (i) carrying
out regular reviews of information security processes, policies and standards and
providing recommendations to seal loopholes that may lead to fraud (ii) ensuring that
there is proper segregation of duties (iii) ensuring prompt deactivation of computer access
following staff termination (iv) enforcing the use of data encryption; and (v) establishing
a confidential mechanism of reporting of suspected fraud cases.
Factor 3 are IT security checks elements and they comprise of the following IT-audit
strategies (i) ensuring that data loss prevention suites are used (ii) ensuring that there is
tracking and securing of the physical environment. Factor 4 elements, IT audit planning
and audit recommendations comprises of the following (i) application of robust fraud risk

65
assessment, during the planning phase of the IT audit (ii) enforcing compliance of the
policies and controls (iii) ensuring that duly executed Service Level Agreements, with
third party service providers, are in place (iv) recommending the need of staff fraud
awareness training. Factor 5 element comprises of one IT-audit strategies of ensuring that
system change controls are implemented.
Most of the 18 factors listed in the questionnaire were grouped together by their
correlation with each other and brought down to 5 main group factors. The most number
of factor elements were in groups 1 and 2 whilst a few elements fell in factor group 3, 4
and 5.
4.6 IT Auditing and Fraud Prevention Relationship
The fourth objective pursued to determine the relationship between IT auditing and fraud
prevention in Kenyan commercial banks. The data collected in establishing the
relationship between IT auditing and fraud were analyzed and presented in Table 4.31
and Table 4.32.
4.6.1 Extent to which IT-Audit Prevents Fraud in the Bank
With regard to the extent to which IT audit prevented fraud in the bank, Table 4.31
indicates that 61.1% of the respondents concurred that IT audit prevented fraud in the
bank to a great extent while 38.9% of the respondents indicated that IT audit prevented
fraud in the bank to a very great extent.
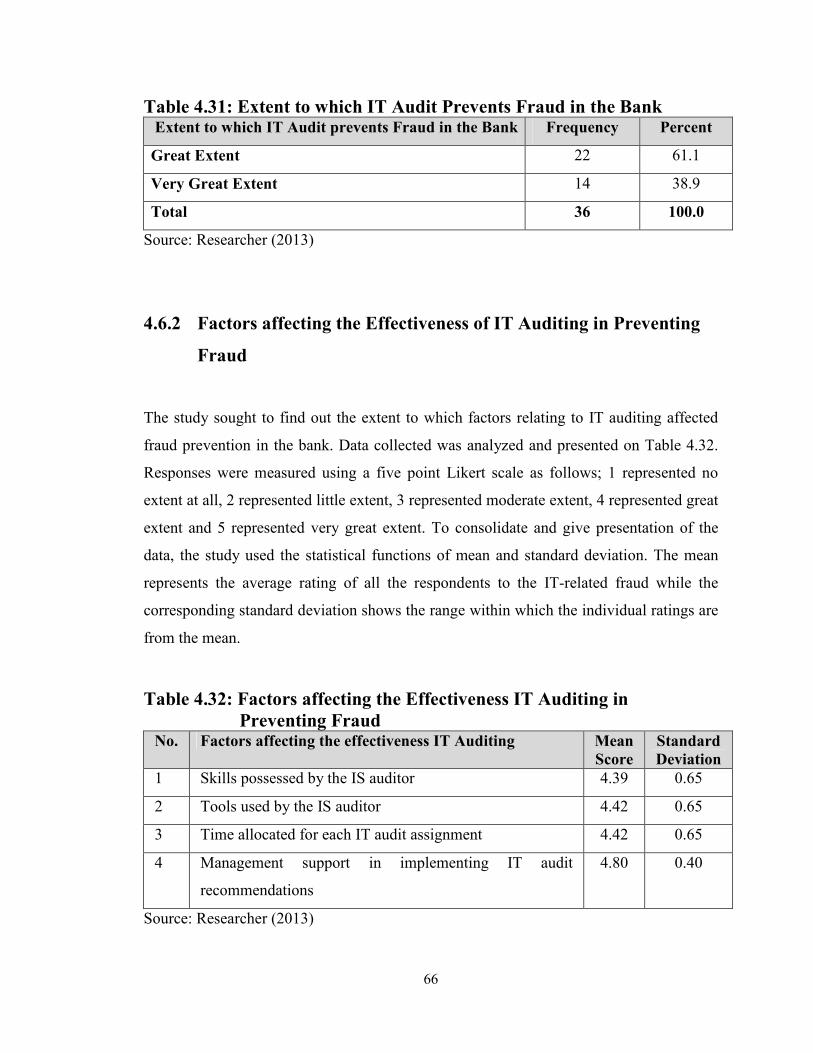
66
Table 4.31: Extent to which IT Audit Prevents Fraud in the Bank Extent to which IT Audit prevents Fraud in the Bank Frequency Percent
Great Extent 22 61.1
Very Great Extent 14 38.9
Total 36 100.0
Source: Researcher (2013)
4.6.2 Factors affecting the Effectiveness of IT Auditing in Preventing
Fraud
The study sought to find out the extent to which factors relating to IT auditing affected
fraud prevention in the bank. Data collected was analyzed and presented on Table 4.32.
Responses were measured using a five point Likert scale as follows; 1 represented no
extent at all, 2 represented little extent, 3 represented moderate extent, 4 represented great
extent and 5 represented very great extent. To consolidate and give presentation of the
data, the study used the statistical functions of mean and standard deviation. The mean
represents the average rating of all the respondents to the IT-related fraud while the
corresponding standard deviation shows the range within which the individual ratings are
from the mean.
Table 4.32: Factors affecting the Effectiveness IT Auditing in
Preventing Fraud No. Factors affecting the effectiveness IT Auditing Mean
Score
Standard
Deviation
1 Skills possessed by the IS auditor 4.39 0.65
2 Tools used by the IS auditor 4.42 0.65
3 Time allocated for each IT audit assignment 4.42 0.65
4 Management support in implementing IT audit
recommendations
4.80 0.40
Source: Researcher (2013)

67
From the findings, the respondents indicated that management support in implementing
IT audit recommendations affected fraud prevention in the bank to a very great extent
(mean score 4.80). The respondents indicated that tools used by the IS auditor, time
allocated for each IT audit assignment and skills possessed by the IS auditor affected
fraud prevention in the bank to a great extent as shown by a mean score of 4.42, 4.42 and
4.39 respectively.
4.6.2.1 Regression Analysis
In this study, a multiple regression analysis was conducted to test the influence among
predictor variables. The research used Statistical Package for Social Sciences (SPSS V
17.0) to code, enter and compute the measurements of the multiple regressions.
Table 4.33: Model Summary
Model R R Square Adjusted R Square
Standard Error of
the Estimate
1 0.763 0.746 0.578 0.1076
a. Predictors (Constant): Skills, Tools, Time and Management support
Source: Researcher (2013)
R-Square (coefficient of determination) is a commonly used statistic to evaluate model
fit. R-square is 1 minus the ratio of residual variability. The adjusted R2, also called the
coefficient of multiple determinations, is the percent of the variance in the dependent
explained uniquely or jointly by the independent variables. Table 4.33 shows that 74.6%
of the changes in fraud prevention could be attributed to the combined effect of the
predictor variables.

68
Table 4.34: ANOVA (Analysis of Variance) Model Sum of Squares df Mean Square F Sig.
Regression 821.593 4 205.398 20.24 .000a
Residual 324.723 32 10.15
Total 1146.316 36
Source: Researcher (2013)
a. Predictors (Constant): Skills, Tools, Time and Management Support.
b. Dependent Variable: Fraud Prevention.
Table 4.34 shows that the residual sum of squares (the sum of squared deviations from
the least squares line) is 324.723, while the total sum of squares (the sum of squared
deviations from the mean) is 1146.316. The probability value of 0.001 indicates that the
regression relationship was highly significant in predicting how Skills, Tools, Time and
Management Support led to fraud prevention. The F critical at 5% level of significance
was 3.671 since F calculated is greater than the F critical (value = 20.24), this shows that
the overall model was significant.
Table 4.35: Estimated Coefficients Model Unstandardized coefficients(B) p-Value
Const. 18.79 3.25e-09 ***
Skills 0.708 0.0133 ***
Tools 0.642 0.0395 ***
Time 0.706 0.0236 ***
Management support 0.710 0.0154 ***
Source: Researcher (2013)

69
* Significant at 1%
** Significant at 5%
*** Significant at 10%
The “coefficients” on Table 4.35 provides the regression equations. Under
“unstandardized coefficients,” the “Constant” (18.79 ) is the “a” coefficient. The
remaining values in this column are the “b” coefficients. Rewriting this in standard
algebraic form, the unstandardized regression equation is:
FP= 18.79+ 0.708 S+ 0.642TL+ 0.706TI+0.710MS + e
Where FP is fraud prevention, S is Skills, TL is tools, TI is time and MS is Management
support.
A unit change in skills will lead to a 0.708 change in fraud prevention. A unit change in
tools will lead to a 0.642 change in fraud prevention. A unit change in time will lead to a
0.706 change in fraud prevention while a unit change in the management support will
lead to a 0. 710 change in fraud prevention.
Table 4.35 shows that skills, tools, time and management support at 1%, 5% and 10%
level of significance, they are significant in explaining the variations in fraud prevention.
4.7 Discussion of the Findings
From the above data analysis and findings, it is apparent that IT-related fraud is prevalent
in Kenyan commercial banks, and most banks have largely encountered phishing,
spoofing, insider threats and data interception during file uploads. Due to this increase in
electronic frauds (BFIU, 2013), most banks have put in a key measure of implementing
IT auditing in order to manage fraud, IT systems failures and disruptions (RMG, 2013).

70
Thus, to address the likelihood of electronic fraud risk IS auditors in Kenyan commercial
banks, largely ensure that role based access controls and/or dual access controls are
instituted, formal fraud policy is in place and the banks have implemented strict password
and account management policies and practices. The findings showed that the IT audit
approaches and mitigation strategies implemented by the IS auditors incline towards
early detection and prevention of fraud. However, most IS auditors in Kenyan
commercial banks indicated that they have encountered various challenges such as lack
of audit tools (mean score 3.03), lack of technical expertise in using vulnerability tools
(mean score 2.83) and insufficient time allocation on audit assignments (mean score 2.31)
and this largely affected the effectiveness of IT auditing in preventing fraud.
As aforementioned in the statement of the problem, there are varied opinions amongst
auditors on the expectation-performance gap (Sherer and Turley, 2007) and the assertion
that auditors have responsibility in the prevention and detection of fraud is a controversial
topic amongst auditors, regulators and the public. From the findings, 61.1% of the IS
auditors concurred that IT audit prevented fraud in the bank to a great extent, while
38.9% assented that IT audit prevented fraud in the bank to a very great extent. It is
therefore evident that IS auditors have a significant role in the early detection and
prevention of fraud. The regression analysis findings further affirmed that there is a direct
relationship between IT auditing and fraud prevention in Kenyan commercial banks.
Other researchers, as discussed in the literature review, have concurred that audit is a
vital tool in fraud detection and the ability to detect fraud is therefore more augmented
for organizations that have an internal auditors than those without (Coram et al., 2006).
The resulting conceptual model as shown in Figure 2.3 has been supported by the
findings which show that a unit change in management support, skills, time and tools
used, lead to 0.710, 0.708, 0.706 and 0.642 change in fraud prevention, respectively.
These findings are also consistent with the strategic fraud detection and TAM 2 models
used. These models combine the use of technology based tools and deductive reasoning
which were perceived as useful by the IS auditors in effectively detecting and preventing
fraud.

71
While the initial objective of the study was to determine the effectiveness of IT auditing
in fraud prevention and detection amongst Kenyan commercial banks, the resultant
concept has provided findings on myriad IT audit challenges, IT audit approaches and
mitigation strategies that shall enhance the body of knowledge for scholars and give rise
to further research in the IT auditing field. It shall also provide a holistic view on IT
auditing to banks, government and other regulators such CBK, ICPAK and ISACA in the
fight against fraud. Moreover, it shall provide further impetus for banks and other
organizations to adopt the resulting conceptual model, which will help increase the
productivity, efficiency and effectiveness of IS auditors leading to early detection and
prevention of fraud.

72
CHAPTER FIVE
SUMMARY, CONCLUSION AND RECOMMENDATIONS
5.1 Introduction
The objectives of this study were to determine the extent of IT related fraud in
Kenyan commercial banks, establish the challenges faced during IT auditing by the IS
auditor, establish the countermeasures implemented in preventing fraud through IT
auditing and determine the relationship between IT auditing and fraud prevention. This
research study was conducted on IS auditors in Kenyan commercial banks, and the
response rate achieved was 83.72%. Although the entire population of 43 banks was
targeted, 36 respondents did fill the questionnaire.
5.2 Summary of the Findings
The study found out that most of the respondents had certification in auditing, accounting
and information security. It also became apparent that the IT auditing field is largely
dominated by male professionals (97.2%). The study also pointed out that banks had
encountered phishing, spoofing, insider threats and data interception during file uploads
to a great extent. The study established that the common IT audit approaches used
include network surveying, network reconnaissance, port scanning and vulnerability
scanning. The study also revealed that the banks had implemented IT audit strategies by
ensuring that role based access controls and/or dual access controls are instituted,
ensuring a formal fraud policy was in place and by ensuring that the bank has
implemented strict password and account management policies and practices.
5.3 Conclusions
The study concludes that since the most common IT-related frauds were phishing,
spoofing, insider threats and data interception during file uploads, IS auditors should put

73
more focus while planning for IT-audits on areas that could be affected by these types of
frauds. Since all the respondents had encountered an IT-related fraud, it imperative that
each bank puts in place mitigation strategies to help reduce fraud risk.
From the research, these mitigation strategies were notably, the carrying out regular
reviews of information security processes, policies and standards and providing
recommendations to seal loopholes that may lead to fraud; ensuring that there is proper
segregation of duties; ensuring prompt deactivation of computer access following staff
termination; enforcing the use of data encryption; establishing a confidential mechanism
of reporting of suspected fraud cases; ensuring a formal fraud policy was in place;
ensuring that the bank has implemented strict password and account management policies
and practices; ensuring that role based access controls and/or dual access controls are
instituted; ensuring that the bank has secure backup and recovery processes in place;
recommending built in controls during software development and ensuring that there is
use of structured defense against remote attacks.
5.4 Limitations of the Study
From the study it was noted that some banks have not recruited IS auditors to perform IT
auditing work but instead they use IT managers and IT project managers to perform this
role. Such staff may not have the expertise required to perform the IT-audit role
effectively and therefore the information provided on the questionnaire may have been
limited since it was difficult to get sufficient time to go through the questionnaires with
these respondents. Further, some respondents may not have given focused attention while
completing the questionnaire due to the qualitative nature of the study.
Another limitation is that some of the banks with majority foreign ownership have their
data stored and managed outside the country hence local staff may not have full
knowledge of the controls in place. Further, this study is limited to commercial banks in

74
Kenya and excludes other financial intermediation players such as the forex bureaus,
mortgage banks, micro finance institutions and pension funds.
5.5 Recommendation for Further Research
The study recommends that banks should continue to enforce, practice and maintain high
ethical standards in performance of the duties as well as ensure that fraud governance is
in place. The study therefore recommends that articulating a fraud and corruption control
policy is a vital step, but a policy will only be effective if implemented with the support
of appropriate procedures and operating guidelines. Further, good communication and
extensive consultation with internal and external stakeholders at each stage of the process
are very important. The success in fighting frauds as a whole depends on the extent to
which everyone contributes to the assessment of risk and embraces the philosophy of
actively managing it. Better work could be achieved in future by using information from
other industries, such as the forex bureaus, mortgage banks, micro finance institutions
and pension funds, in order to generalize on the effectiveness of IT auditing and fraud
prevention in the Kenyan context.

75
REFERENCES
Aeran A. (2006): Comprehensive overview of Insider Threats and their controls
Albrecht C.C. and Albrecht W.S. (2002): Strategic Fraud Detection- A Technology-
Based Model. Rollins Center for eBusiness
Albrecht C.C. and Albrecht W.S. (2001b): Conducting a Pro-active Fraud Audit: A Case
Study. The Journal of Forensic Accounting I: (January-June) pp 1-12
Alleyne P. and Howard M. (2005): An Exploratory Study of Auditors’ Responsibility for
Fraud Detection in Barbados. Managerial Auditing Journal
Apoyo, H. (2011). Management of reputation risks among commercial banks in Kenya.
Unpublished MBA Thesis, University of Nairobi.
Association of Certified Fraud Examiners (2010): Global Fraud Study: Report to the
Nations on Occupational Fraud and Abuse
Baker, W.H., Hylender, C.D. and Valentine, J.A. (2008). Data Breach Investigations
Report
Banking Fraud Investigation Unit: Second Quarter Report on Trend of Fraud Cases
Committed in the Banking Industry- April to June 2013
Bostley R.W.B. and Dover C.B. (1972): Sheldon’s Practice and Law of Banking, 10th
ed,
London, Macdonald and Evans
Boynton W., Johnson R. and Kell W. (2005): Assurance and the integrity of financial
reporting, 8th
ed. New York, John Wiley & Sons Inc
Brink V.Z. and Witt H. (1982): Internal Auditing. New York, John Wiley & Sons
Central Bank of Kenya (CBK) Risk Management Guidelines (RMG) No.7 of January
2013: Information and Communication Technology (ICT) Risk, pp 54-70
Chakrabarty K.C. (2013): Fraud in the banking sector- causes, concerns and cures
Coderre D.G. (2009): Fraud Analysis Techniques using ACL. John Wiley & Sons
Coram P., Ferguson C. and Moroney R. (2006): The Importance of Internal Audit in
Fraud Detection. A thesis of The University of Melbourne and Monash University

76
Delloite, 2011: A Survey- Kenyan Banks Suffer Brunt of Theft
Gallegos F., Senft S., Manson D.P. and Gonzales C. (1998): Information Technology
Control and Audit, 2nd
ed., New York: Auerbach Publications, pp.41-43
Gay G., Schelluch P. and Reid I. (1997): Users Perception of the Auditing
Responsibilities for the Prevention, Detection and Reporting of Fraud, other illegal acts
and error. Australian Accouting Review
GECS (Global Economic Crime Survey), November 2011, Price Waterhouse Coopers.
www.pwc.com/crimesurvey (Date Accessed: 16 August 2013)
http://www.businessdictionary.com/definition/countermeasures.html (Date Accessed: 14
August 2013)
http://www.centralbank.go.ke/index.php/regulations-and-guidelines (Date Accessed: 19
August 2013)
http://www.centralbank.go.ke/images/docs/Bank%20Supervision%20Reports/Quarterly
%20Performance%20Reports/2nd%20quarter%20of%202012%20Banking%20Sector%2
0Performance%20%20Development%20-Revised.pdf (Date Accessed: 19 August 2013)
http://daf.csulb.edu/offices/univ_svcs/internalauditing/audits.html (Date Accessed: 20
August 2013)
http://www.theiia.org/intAuditor/itaudit/2012-articles/so-you-want-to-be-an-it-auditor/
(Date Accessed: 24 August 2013)
http://www.nysscpa.org/cpajournal/2008/608/essentials/p20.htm (Date Accessed: 21
August 2013)
http://upload.wikipedia.org (Date Accessed: 23 August 2013)
http://www.kba.co.ke/index.php?option=com_contentand view=articleand
id=129:working-together-to-make-banking-betterand catid=57:slideshow (Date
Accessed: 19 August 2013)
http://www.kba.co.ke/component/content/article/57-slideshow/131-increasing-access-to-
credit (Date Accessed: 19 August 2013)
Huang Y., Weng Y.C., Chou H. and Wu M. (20011): TAM2 based study of website user
behavior – Using Web 2.0 Websites as an Example. Chung-Hua University

77
Information Systems Control (ISC) Journal (2008): The Magazine for IT Governance
Professionals. Volume 3 pp.14
Information Standards Guidelines on Auditing No. 9: Audit Considerations for
Irregularities and Illegal Acts
International Standards on Auditing No.240: The Auditor’s Responsibilities to Consider
Fraud in an Audit of Financial Statement (Revised)
ISACA (2013): http://www.ISACA.org (Date Accessed: 23 August 2013)
ISO 19011:2011 Guidelines for auditing management systems
IT Audit Monograph Series # 1 (2008): Information Technology Audit-General
Principles
http://intosaiitaudit.org/India_GeneralPrinciples.pdf (Date Accessed: 19 August 2013)
Kenneth C. Brancik (2008): Inside Computer Fraud. An In-depth Framework for
Detecting and Defending Against Insider I.T. Attacks
Kenya Revenue Authority Anti-fraud and Corruption Policy, July 2006
Launius S.M.(2009): Securing the Network Perimeter of a Community Bank. SANS
Institute
Lee T.H., Ali A.M. and Bien D., (2009): Towards an Understanding of the Audit
Expectation Gap. A Published Journal of The International Institute for Science,
Technology and Education
Mugenda. O. A. and Mugenda A. G. (1999). Research methods: Quantitative and
Qualitative approaches, Nairobi, Act Press
Mukinda Fred, “Sh 500 Million lost to Kenya Bank Fraud in just a month”, January 13,
2011. Daily Nation:
http://www.nation.co.ke/News/Sh500m%20lost%20to%20bank%20fraud%20in%20just
%20a%20month%20/-/1056/1089298/-/s98rt1/-/index.html (Date Accessed: 23 August
2013)
Mulwa D. (2012): A Survey of Insider Information Security Threats Management in
Commercial Banks in Kenya. A thesis of University of Nairobi

78
Muslimat A.S. and Hamid K.T. (2012): The Role of Internal Audit Unit in Fraud
Prevention in Government Owned Hospitals in a Nigerian Setting
Nicho M. (2008): Information Technology Audit- Systems Alignment and Effectiveness
Measures. A thesis of AUT University
Nieschwietz R.J., Joseph J. and Schultz J. (2000): Empirical Research on External
Auditor’s Detection of Financial Statement Fraud. Journal of Accounting Literature 19
pp 190-246
Oyinlola A. O. (2010): The Role of Auditors in Fraud Detection, Prevention and
Reporting in Nigeria. An e-journal of Tai Solarin University
Palmrose Z. (1987): Litigation and Independent Auditors-The Role of Business Failures
and Management Fraud. Auditing: A Journal of Practice and Theory 6 pp 90-103
Perspective Magazine, 2009: The Future of Branchless Banking in the United Kingdom
Reserve Bank of India (2011): Working Group on Information Security, Electronic
Banking, Technology Risk Management and Cyber Frauds
Schultz, E. E. (2002). A framework for understanding and predicting insider attacks.
Computers and Security 21 (6), pp 526-531
Sherer M. and Turley S. (2007): Current Issues in Auditing, 3rd ed.
Simpson B. (2011): An Introduction to Computer Auditing
Welch S.T., Holmes S.A. and Strawser R.H. (1996): The Inhibiting Effect of Internal
Auditors on Fraud
Wagner H.J. (2001): Information Systems Auditing and Electronic Commerce. A thesis of
University of Illinois

79
APPENDIX ONE
Research Questionnaire
I am undertaking a research on Information Technology Audit and Fraud Prevention in
Commercial Banks in Kenya as part of my academic qualifying requirement. Your
assistance, through completion of this questionnaire will be highly appreciated. Any
information provided shall be in confidence. Thank you in advance for taking the time to
fill in the questionnaire.
SECTION A: DEMOGRAPHIC INFORMATION
1. Please tick to indicate your Gender.
Male ………..( )
Female………( )
2. Please tick the age bracket in years in which your age falls.
Below 25…………………( )
Between 25 and 30……….( )
Between 31 and 35……….( )
Between 36 and 40……….( )
Between 41 and 45……….( )
46 and above……………..( )
3. Please indicate your Position/Designation in the bank.
IS Audit Manager……….( )
IS Audit Officer………...( )
Others [Specify] …………………………………
4. Please indicate your academic qualification.
Master Degree ……………( )
Undergraduate Degree……( )

80
Others [Specify] ………………………………
5. Please indicate your professional qualification.
Certified Information Systems Audit………( )
Certified Fraud Examiner…………………..( )
Certified Public Accountant ………………( )
Certified Information Security Manager……( )
Microsoft Certified Systems Auditor….……( )
Microsoft Certified Systems Engineer………( )
Cisco Certified Network Administrator ……( )
Cisco Certified Network Engineer …… ……( )
Others [Specify] …………………………………
6. For how long have you worked in the bank? ………………
7. For how long has your bank been in operation?
10 years and below..………..( )
Between 11 and 20 years……( )
Between 21 and 30 years……( )
Between 31 and 40 years……( )
Over 40 years ……………….( )
8. What is the current shareholding structure of your bank?
Locally owned institution……………………………( )
Government controlled majority shares institution….( )
Foreign owned but locally incorporated……………..( )

81
Foreign owned NOT locally incorporated…………...( )
Owned by both local and foreigners…………………( )
Other [Specify]……………………………………………
9. What is the size of the bank in terms of total assets value in Kenya Shillings?
10 billion and below…………….( )
Between 11 and 20 billion………( )
Between 21 and 30 billion………( )
Between 31 and 40 billion………( )
Between 41 and 50 billion………( )
Above 50 billion………………...( )
10. Please tick to indicate the number of branches owned by the bank in Kenya.
20 and below……………( )
Between 21 and 40……...( )
Between 41 and 60………( )
Between 61 and 80………( )
Above 80………………...( )
11. To who does the IS audit team report?
Board Audit Committee………………………………( )
Board Information and Technology Committee………( )
Chief Executive Officer (CEO)……………………….( )
Others [Specify] ………………………………………( )

82
SECTION B: TYPES OF IT-RELATED FRAUDS
12. Please tick to indicate the extent to which the bank has encountered each of the
following IT-related fraud.
IT-Related Fraud
No
Ex
ten
t
at
All
Lit
tle
Ex
ten
t
Mo
der
ate
Ex
ten
t
Gre
at
Ex
ten
t
Ver
y G
reat
Ex
ten
t
1 2 3 4 5
Network Related Fraud
Unauthorized network access
Hacking (accessing a computer network by
circumventing its security system)
Malware programs
Sniffing (being able to seeing plain text login credentials
and confidential information)
Cross site scripting (bypassing access controls by use of
scripts)
Hardware Related Fraud
Hardware-based key loggers (they capture keystrokes)
Destruction of critical data
Password cracking
Tampering with data (unauthorized changes of data or
records)
Theft (stealing information)
Software Related Fraud
Installation of unauthorized software
Sabotage
Intellectual property theft
Software-based key loggers (they capture keystrokes)

83
Applications Related Fraud
Password cracking
Identity theft
Systems Interfaces Related Fraud
Data interception and manipulation
Phone call/ Short Messaging System (SMS) interception
IT Operational Frauds
Data interception during file uploads
Spoofing (pretending to be something or someone that
one is not)
Phishing (acquiring information and/or money from
people without their knowledge)
Insider threats (e.g. selling employer’s confidential
information to the competitors)
Others [Specify and Rate accordingly]

84
SECTION C: CHALLENGES FACED IN IT AUDITING
13. Please tick to indicate the extent to which you have experienced each of the
following challenges in IT auditing in the bank.
Challenges Faced
No
Ex
ten
t
at
All
Lit
tle
Ex
ten
t
Mo
der
ate
Ex
ten
t
Gre
at
Ex
ten
t
Ver
y G
reat
Ex
ten
t
1 2 3 4 5
Lack of audit tools to use during an IT audit
Insufficient time being allocated per IT audit assignment
Lack of technical expertise in using vulnerability tools
Lack of adequate knowledge on the banks IT policies and
procedures
Failure of management in implementing and carrying out
staff training on fraud
Failure by management in implementing IT audit
recommendations
The absence of a formal fraud policy in place
Fraud policy not regularly being referred to in employee
communications
Others [Specify and Rate accordingly]

85
SECTION D: DETECTION AND PREVENTION APPROACHES IN
IT AUDIT AGAINST FRAUD
14. Please tick to indicate the extent to which you use each of the following approaches
in detecting and preventing fraud related to computer networks in the bank.
IT Audit Approaches Used
No
Ex
ten
t
at
All
Lit
tle
Ex
ten
t
Mo
der
ate
Ex
ten
t
Gre
at
Ex
ten
t
Ver
y G
reat
Ex
ten
t
1 2 3 4 5
Network surveying
(to obtain information on the network map such as:
- domain names
- server names
- internet service provider information
- IP addresses of hosts)
Network reconnaissance
(scanning a network for available information such
as ports that are accessible)
Port scanning
(to obtain information about closed and open ports
that are running on the network)
Vulnerability scanning
(attempting to analyze the weaknesses noted from
the scans to launch an attack)
Password cracking
Social engineering
(attempting to obtain security information from
staff/ customers)
Physical security checks on IT assets
Use of data analytics
(to analyze financial data for fraud patterns)
Others [Specify and Rate accordingly]

86
15. To what extent has each of the following IT audit strategies been implemented by
the bank in preventing IT-related fraud?
Mitigation Strategies
No
Ex
ten
t
at
All
Lit
tle
Ex
ten
t
Mo
der
ate
Ex
ten
t
Gre
at
Ex
ten
t
Ver
y G
reat
Ex
ten
t
1 2 3 4 5
Ensuring a formal fraud policy is in place
Carrying our regular reviews of information security
processes, policies and standards and providing
recommendations to seal loopholes that may lead to fraud
Application of robust fraud risk assessment, during the
planning phase of the IT audit
Enforcing compliance of the policies and controls
Ensuring that duly executed Service Level Agreements, with
third party service providers, are in place
Ensuring that the bank has implemented strict password and
account management policies and practices
Ensuring that role based access controls and/or dual access
controls are instituted
Ensuring that there is proper segregation of duties
Ensuring that data loss prevention suites are used (e.g.
restrictions on removal media like flash disks, CDs, etc.)
Ensuing that the bank has secure backup and recovery
processes in place
Ensuring prompt deactivation of computer access following
staff termination
Recommending built in controls during software development
Enforcing the use of data encryption
Ensuring that there is use of structured defense against remote
attacks (e.g. installation of firewalls)
Establishing a confidential mechanism of reporting of
suspected fraud cases (e.g. through whistle blowing,
anonymous calls)
Ensuring that system change controls are implemented
Ensuring that there is tracking and securing of the physical
environment (e.g. by use biometric systems)
Recommending the need of staff fraud awareness training
Others [Specify and Rate accordingly]

87
SECTION E: IT AUDITING AND FRAUD PREVENTION
RELATIONSHIP
16. To what extent is IT audit preventing fraud in the bank?
Tick to indicate the extent in the boxes given below:
No extent at all………. ( )
Little extent………….. ( )
Moderate extent……… ( )
Great extent………….. ( )
Very great extent……...( )
17. Please tick to indicate the extent to which each of the following IT related factors
affect fraud prevention in the bank.
Independent Variables
No
Ex
ten
t
at
All
Lit
tle
Ex
ten
t
Mo
der
ate
Ex
ten
t
Gre
at
Ex
ten
t
Ver
y G
reat
Ex
ten
t
1 2 3 4 5
Skills possessed by the IS auditor
Tools used by the IS auditor
Time allocated for IT audit assignments
Management support in implementing IT audit
recommendations
Others [Specify and Rate accordingly]

88
APPENDIX TWO
List of Commercial Banks in Kenya
1. African Banking Corporation Ltd
2. Bank of Africa Kenya Ltd.
3. Bank of Baroda (K) Ltd.
4. Bank of India
5. Barclays Bank of Kenya Ltd.
6. CFC Stanbic Bank Ltd.
7. Charterhouse Bank Ltd
8. Chase Bank (K) Ltd.
9. Citibank N.A Kenya
10. Commercial Bank of Africa Ltd.
11. Consolidated Bank of Kenya Ltd.
12. Co-operative Bank of Kenya Ltd.
13. Credit Bank Ltd.
14. Development Bank of Kenya Ltd.
15. Diamond Trust Bank (K) Ltd.
16. Dubai Bank Kenya Ltd.
17. Eco bank Kenya Ltd
18. Equatorial Commercial Bank Ltd
19. Equity Bank Ltd.
20. Family Bank Ltd
21. Fidelity Commercial Bank Ltd
22. Fina Bank Ltd
23. First community Bank Limited
24. Giro Commercial Bank Ltd.
25. Guardian Bank Ltd
26. Gulf African Bank Limited
27. Habib Bank A.G Zurich
28. Habib Bank Ltd.
29. Imperial Bank Ltd
30. I and M Bank Ltd
31. Jamii Bora Bank Ltd.
32. Kenya Commercial Bank Ltd
33. K-Rep Bank Ltd
34. Middle East Bank (K) Ltd
35. National Bank of Kenya Ltd
36. NIC Bank Ltd
37. Oriental Commercial Bank Ltd
38. Paramount Universal Bank Ltd
39. Prime Bank Ltd
40. Standard Chartered Bank (K) Ltd
41. Trans-National Bank Ltd
42. Victoria Commercial Bank Ltd
43. UBA Kenya Bank Ltd

89