information systems investment decision making using
TRANSCRIPT

i
Information Systems Investment Decision
Making using Return of Investment
Sérgio David da Silva Formigo
Dissertation presented as partial requirement
for obtaining the Master’s degree in Information
Management
Application of CRUDi framework with eTOM business
process framework in Portuguese
Telecommunication Industry
ii
NOVA Information Management School
Instituto Superior de Estatística e Gestão de Informação
Universidade Nova de Lisboa
INFORMATION SYSTEMS INVESTMENT DECISION MAKING USING
RETURN OF INVESTMENT
by
Sérgio Formigo
Dissertation presented as partial requirement for obtaining the master’s degree in Information
Management, with a specialization in Information Systems and Technologies Management.
Advisor: Vitor Santos
Advisor: Jorge Pereira
11 2018
iii
ABSTRACT
To increase the success and grow of an organization, the Information Systems should support and be
aligned with the business needs. This work is a continuation of a previous PhD thesis. This thesis uses
the CRUDi framework to identify the Information Systems importance in a company. The framework
was already applied in the banking, insurance and telecommunication industries using the APQC
business process framework.
Our study presents the application of the CRUDi framework in the Portuguese telecommunication
industry, using a business process framework designed for this industry (eTOM). The application of
the methods and tools will characterize the business processes identified by eTOM framework and
applied in the company’s available Information Systems.
KEYWORDS
CRUD; APQC; CRUDi; eTOM; Investments; Return of Investment; Information Systems; Survey;
Telecommunication;

iv
INDEX
1. Introduction .................................................................................................................. 1
1.1. Motivation ............................................................................................................. 1
1.2. Objectives .............................................................................................................. 1
1.3. Document Organization ........................................................................................ 2
2. Literature Review ......................................................................................................... 3
2.1. Business and IS alignment ..................................................................................... 3
2.1.1. Alignment Models .......................................................................................... 3
2.2. CRUDi as alignment model .................................................................................... 5
2.3. Telecommunication Industry................................................................................. 6
2.4. TM Forum Frameworx ........................................................................................... 7
2.4.1. Shared Information/Data (SID)....................................................................... 8
2.4.2. Telecom Application Map (TAM) ................................................................... 9
2.4.3. Business Process Framework (eTOM) ............................................................ 9
2.5. APQC framework for telecommunication ........................................................... 16
2.6. CRUDi and APQC framework for telecommunication industry .......................... 17
3. Research metodology ................................................................................................. 22
4. Application of CRUDi with eTOM ............................................................................... 23
4.1. CRUDi-Matrix ....................................................................................................... 23
4.2. Calibration ........................................................................................................... 23
4.3. Discussion ............................................................................................................ 28
5. Conclusion .................................................................................................................. 29
5.1. Synthesis of the developed work ........................................................................ 29
5.2. Limitations and Future work ............................................................................... 29
Bibliography..................................................................................................................... 30
Annexes ........................................................................................................................... 34
Annex 1– Survey answers ........................................................................................... 34
Annex 2 – Normalized Impact values ......................................................................... 35
Annex 3 – Calibration Values ...................................................................................... 38

v
LIST OF FIGURES
Figure 1 Document Organization Diagram ................................................................................. 2
Figure 2 CRUDI framework (J. M. G. Pereira et al., 2012) .......................................................... 6
Figure 3 CRUDi cube (J. M. G. Pereira et al., 2012) .................................................................... 6
Figure 4 “Dynamics of growth of the volume of rendered Internet services” (Ilchenko et al.,
2017) ................................................................................................................................... 7
Figure 5 Frameworx components (TM Forum, 2018) ................................................................ 8
Figure 6 Shared Information/Data (SID) 17.5 Level 1 (Forum, 2018c) ..................................... 12
Figure 7 Telecom Application Map (TAM) 17.5 Level 1 (Forum, 2018a) ................................ 13
Figure 8 eTOM Business Process Framework Conceptual Structure 17.5 Level 1 (Forum,
2018b) .............................................................................................................................. 14
Figure 9 eTOM Process Hierarchy (Figueiredo & Pereira, 2016) ............................................. 15
Figure 10 APQC Process for cross Industry, from (APQC & IBM, 2017) – Version 7.1.0 .......... 17
Figure 11 APQC Process for telecommunication industry, from (APQC & IBM, 2008) – Version
5.0.2 .................................................................................................................................. 18
Figure 12 Information Systems their dependencies and values (Adelabu et al., 2016) .......... 19
Figure 13 eTOM Information Systems and their dependencies .............................................. 26
Figure 14 Information Systems and their values ..................................................................... 26
Figure 15 Information Systems and interfaces ........................................................................ 27
vi
LIST OF TABLES
Table 1 Researches on Conceptual Alignment Models .............................................................. 4
Table 2 Information System (calibrated) importance for the Telecommunication Industry
(Adelabu et al., 2016) ....................................................................................................... 20
Table 3 eTOM CRUD Matrix part 1 ........................................................................................... 24
Table 4 eTOM CRUD Matrix Part 2 ........................................................................................... 25
Table 5 IS calibrated importance for the Telecommunication Industry using eTOM .............. 27
vii
LIST OF ABBREVIATIONS AND ACRONYMS
APQC American Productivity & Quality Centre – www.apqc.com
CEO Chief Executive Officer
CIO Chief Information Officer
CRUD Classify the process operations on entities as Create, Read, Update, Delete
CRUDi CRUD with the importance extra dimension
COBIT Control Objectives for Information and Related Technologies
CMMI Capability Maturity Level Information
eTOM Enhanced Telecom Operations Map
IS Information Systems
IT Information Technologies
ITIL Information Technology Infrastructure Library
NGOSS New Generation Operation System and Software
OSS Operation Support Systems
SAM Strategic Alignment Model
SID Shared Information/Data Framework
TAM Telecom Application Framework
TMF TeleManagement Forum

1
1. INTRODUCTION
The importance of the Information Systems applications is subject of constant discussion between
business managers and CIOs. The definition of the Information Systems Strategic Plan (Feeny,
Edwards, & Simpson, 1992; King, 1978) must take into account the objectives of the organization.
The alignment between Business and Information Systems can help organizations, including
maximizing the Return on Investment (Avison, Jones, Powell, & Wilson, 2004; J Pereira, Martins,
Goncalves, & Santos, 2014; Jorge Pereira, Martins, Goncalves, & Santos, 2014)
The information systems relative importance definition through the CRUDi approach (Jorge Pereira,
Martins, Santos, & Gonçalves, 2012), with new business indicators, allows to calculate the relative
importance of the information systems. This approach has been previously applied in banking,
insurance and telecommunication companies in Portugal using the business process identified in the
APQC framework (APQC & IBM, 2008).
This work presents a study on telecommunication industry with a different set of business processes
and data entities. We used a process framework specific for telecommunication industry, the eTOM.
We studied the CRUDi application approach in a telecommunication organization in Portugal, using in
eTOM business process framework (Forum, 2018b) and compared the findings against a previous
work that used the business process identified in APQC framework for telecommunication industry
(Adelabu, Santos, & Pereira, 2017).
1.1. MOTIVATION
The value added by ITIL - Information Technology Infrastructure Library (Miller, 2013) and the COBIT
- Control Objectives for Information and related Technology (Oparaugo, 2016) frameworks as
management approaches for Information Technology Systems does not solve the problems of
alignment between business and Information Systems (Jorge Pereira, Gonçalves, & Santos, 2012).
Due to different views on the investment, it is difficult to create consensus in the Information
Systems investments planning. It is complex to estimate the impact of IS on the organization, either
when they are improved or when they have a huge problem.
This work adds another approach to allow managers and CIOs to make better decisions regarding the
development of IS architectures in their telecommunication organizations. It measures the
importance of an application or Information System in the different business units (Scheepers &
Scheepers, 2008), using the business process identified in a framework specifically created for
telecommunication industry, eTOM (Forum, 2018b).
1.2. OBJECTIVES
This work aims to help telecommunication organizations to identify applications or Information
Systems relative importance to make investments align with the business needs, that will directly or
indirectly generate the best Return on Investment. Using the business processes from the CRUDi
model together with eTOM business process framework. The studied will be compared to a previous
work that used the process identified by APQC framework.
The study should answer the research questions:
2
Q1: Is it possible to use CRUDi framework with eTOM business process to calculate the relative
importance of Information Systems in Telecommunication Industry?
Q2: Using CRUDi with eTOM approach and taking the budget into account (limitations), is it possible
to determine which projects should precede?
Q3: What are the main differences between the application of CRUDi with eTOM and with the APQC
framework?
1.3. DOCUMENT STRUCTURE
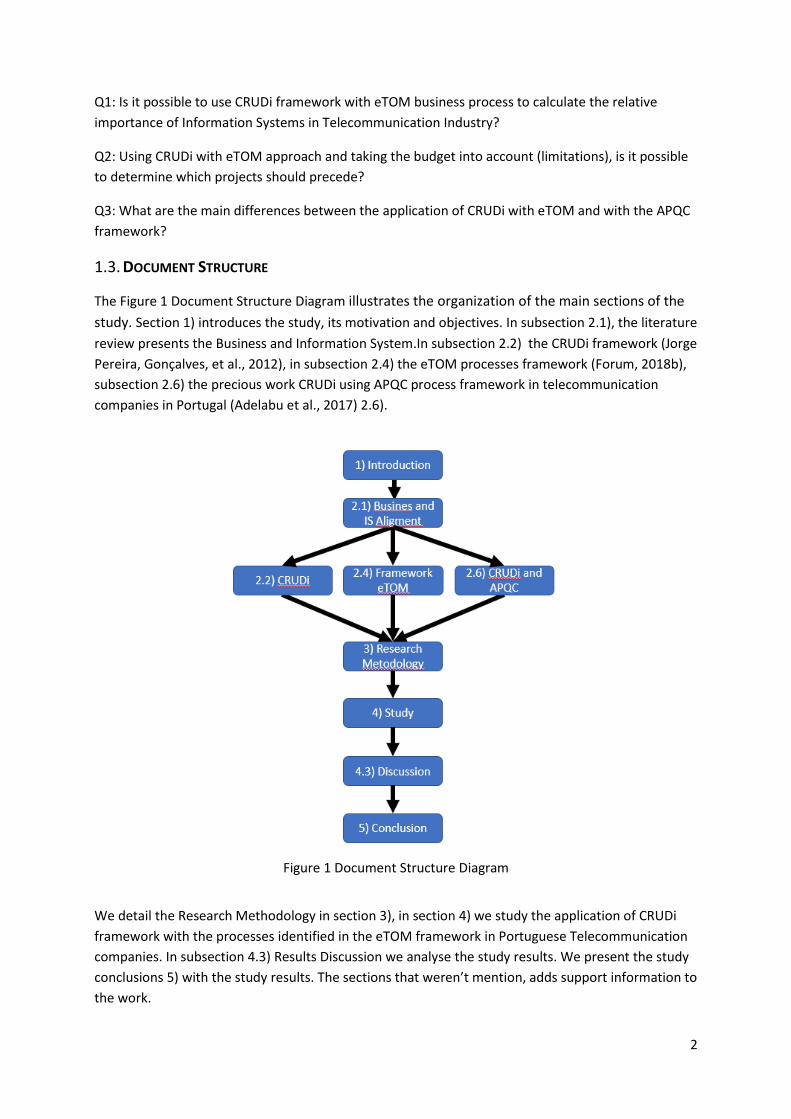
The Figure 1 Document Structure Diagram illustrates the organization of the main sections of the
study. Section 1) introduces the study, its motivation and objectives. In subsection 2.1), the literature
review presents the Business and Information System.In subsection 2.2) the CRUDi framework (Jorge
Pereira, Gonçalves, et al., 2012), in subsection 2.4) the eTOM processes framework (Forum, 2018b),
subsection 2.6) the precious work CRUDi using APQC process framework in telecommunication
companies in Portugal (Adelabu et al., 2017) 2.6).
We detail the Research Methodology in section 3), in section 4) we study the application of CRUDi
framework with the processes identified in the eTOM framework in Portuguese Telecommunication
companies. In subsection 4.3) Results Discussion we analyse the study results. We present the study
conclusions 5) with the study results. The sections that weren’t mention, adds support information to
the work.
Figure 1 Document Structure Diagram

3
2. LITERATURE REVIEW
In this section, we summarize a literature review on the achieving business/IS alignment subject, the
CRUDi framework, the telecommunication sector and its present challenges, and the eTOM and
APQC business process classification for telecommunication industry.
2.1. BUSINESS AND IS ALIGNMENT
The IS technology can be viewed as a factor of production, reducing costs by affecting the quantity
and quality of information (Laudon & Laudon, 2016). For Lane (Lane, 2011), strategic alignment are
the IT organization changes necessary to support the business needs. The Society for Information
Management trends study (Kappelman et al., 2017) demonstrates that since 1984 the IT and
business alignment is in the top 10 management concerns, increasing its importance over the years
and was the first concern in 2016. The IS should be aligned with business objectives to maximize its
value (Colisto, 2012). When selecting the projects to be implemented, the management team prefers
to use the expected return on investment criteria rather than the use of larger or complex evaluation
strategies (McFarlane, 1984).
The alignment problem between the business and the IS was defined by four strategic areas:
business, information technologies, infrastructure organization and processes, infrastructure of
business technologies and processes(Henderson & Venkatraman, 1991). The study done by Benson
(Benson, Bugnitz, & Walton, 2004) reveals the CEO should change its concerns from the costs of IS to
the resulting return of Investment. The CEO should make the question “Which IT-enabled business
initiatives give the most business bang for the buck?” to the CIO. Alignment between business and IT
can be disaggregated into four different dimensions: Business Process Architecture, Information
Architecture, Application Architecture and Information Technology (C. M. Pereira & Sousa, 2005). In
2011 Boza, Ortiz and Ortiz, defined four alignment building blocks: IT conceptualisation, alignment
heuristics, strategic dependencies model and the strategic dependencies model(Cuenca, Boza, &
Ortiz, 2011). Although Majstorcovic (Majstorović, 2016), concluded there is no single definition for
the concept of business and IT alignment, there are formal models and intuitive informal definitions
which help to explain the alignment but are difficult to articulate and measure.
The studies on business and information system conceptual alignment models are more detailed in
the next section.
2.1.1. Alignment Models
There are several works and studies which identify problems with alignment between Business, IS
and Technology and propose methodologies and tools to better support this alignment (Information
Systems Strategic Planning; Strategic Alignment Model; Information Systems Strategic Planning
Support System; Methodology: Business Driven Information Management; Framework: Business-IT
Alignment). The main literature and some research studies regarding conceptual knowledge and
models are resumed in Table 1.
As it can be observed in Table 1, the first important reference to alignment between business
strategy and IS strategy was introduced by Albert Lederer (Lederer & Sethi, 1988), with the proposal
of ISSP which determines the organizational goals and identifies potential applications where the

4
organization should invest. In the same year, Henderson and Sifonis (Henderson & Sifonis, 1988)
added the Top-Down approach to the ISSP model as a mean to decompose a complex system into
smaller representations. Three years later, Henderson and Venkatraman (Henderson &
Venkatraman, 1991) provided one of the major contributions introducing the SAM model and its
dimensions: strategic perspectives, strategy execution, competitive potential Service level,
technology potential and IT strategic management. Several improvements were done to the ISSP
model, namely in the works of MacDonald (MacDonald, 1991), Cash (Cash, Jr., & McKenney, 1992),
Kovacevic and Majluf (Kovacevic & Majluf, 1993), Lederer (Lederer & Salmela, 1996) and Zviran
(Zviran, 1990).
Table 1 Research on Conceptual Alignment Models (chronological order)
Author Year Model Issues addressed
Lederer & Sethi 1988 ISSP Information Systems Strategic Planning. Top-Down.
Henderson &
Sifonis
1988 ISSP Top-Down.
Henderson &
Venkatraman
1991 SAM The Strategic Alignment Model - SAM. Acknowledges
influence of the involvement of top executives on the
quality of strategic choice.
MacDonald 1991 Extends SAM Takes into account both internal and external factors.
Cash, McFarlan &
McKenney
1992 Extends ISSP Top Management involvement.
Kovacevic &
Majluf
1993 Extends ISSP Six-Stages.
Lederer & Hannu 1996 Extends ISSP Anderson Consulting “Method/1”.
Henderson &
Venkatraman
1999 Extends SAM Views alignment as a “process of continuous adaption
and change.”
Zviran 2002 ISSPSS Description of Information Systems Strategic Planning
Support System (ISSPSS), and experience of
implementation.
Moura &
Bartolini
2008 BDIM Methodology: Business Driven Information
Management.
Singh & Woo 2009 3g framework Framework: Business-IT Alignment.
J. M. G. Pereira 2012 CRUDi Framework: Information systems importance.
Belalcázar 2017 SAM and COBIT SAM and COBIT to align the organization and IS.

5
Moura and Bartolini (Moura, Sauvé, & Bartolini, 2008) proposed the BDIM methodology regarding
the concept of business driven information management and Singh and Woo (Singh & Woo, 2009)
proposed the 3g Framework for Business-IT alignment. Pereira (Jorge Pereira, Gonçalves, et al., 2012)
defined a framework to evaluate the importance of information systems. Belalcázar (Belalcázar,
Merchán, Díaz, & Molinari, 2017) proposed a model which uses the strategic perspectives of SAM in
conjunction with the COBIT processes.
2.2. CRUDI AS ALIGNMENT MODEL
The CRUD is a technique to model processes used by IBM (Business Strategic Planning) (Chen,
Mocker, Preston, & Teubner, 2010), and their activities regarding Creation, Reading, Update and
Deletion of data (Moody, 1998; Veryard, 1994). It added dimensions like Time and Security (Lunsford
& Collins, 2008). Methodologies and techniques as CMMI, ITIL, COBIT, BPM, don't solve the
alignment problem. The CRUDi framework uses importance of each system and application, and their
interdependencies (Jorge Pereira, Gonçalves, et al., 2012). This model allows the characterization of
an Information System based in its relative importance in the organization.
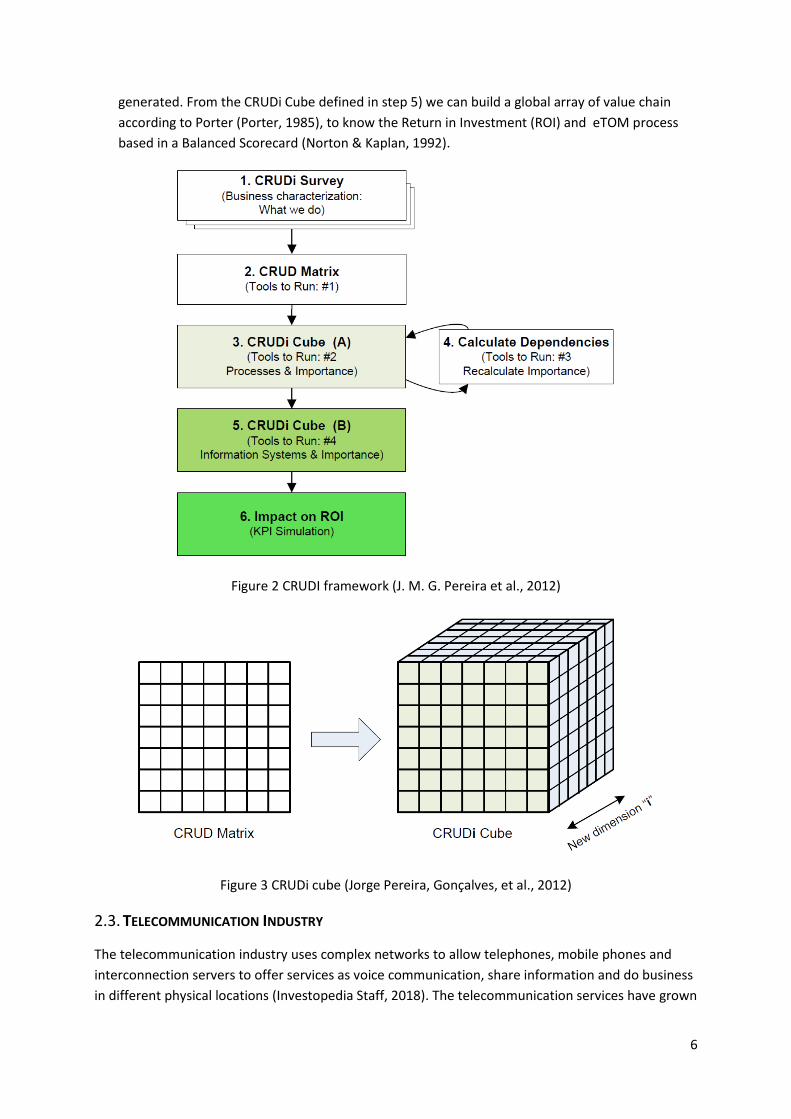
The CRUDi framework approach is implemented in six steps, see Figure 2:
1. Survey is send to the CIOs and business managers to identify the importance of each system. The
survey is divided in three parts: introduction; the overall framework and the initial set of
questions to validate the existence of a problem and the questions regarding relative importance
qualification for business processes. The business process characterization used a Likert scale
from 1 to 5, which considers the number 5 “always” and number 1 “never” (Bahri-Ammari &
Bilgihan, 2017; Jacoby & Matell, 1971).
2. Create a CRUD matrix based on identified processes and information entities. The processes are
characterized based on each industry process and business (Lunsford & Collins, 2008; Moody,
1998; Veryard, 1994). C= Create, R = Read, U = Update and D = Delete.
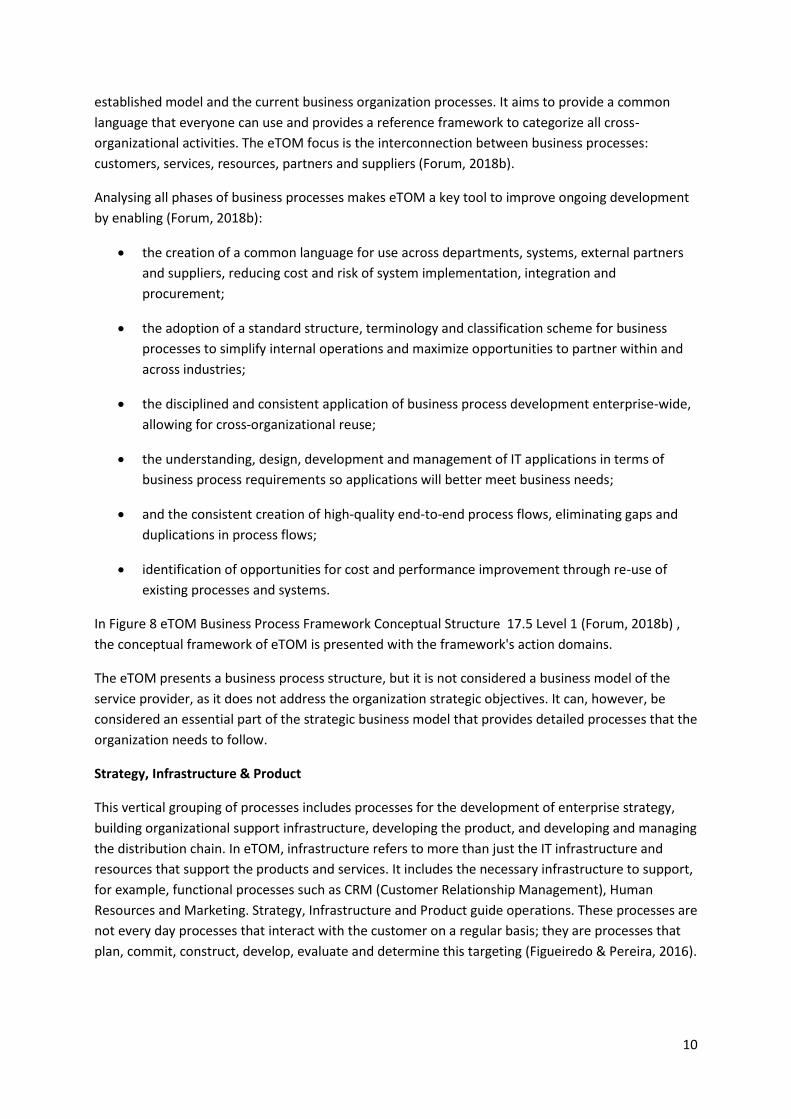
3. Create the Cube CRUDi by combining the results of the steps 1) and 2). Figure 3 represents the
two dimensions (business processes and information entities) of the CRUD matrix, with the third
dimension, the importance (Dictionaries, 2018), creating the CRUDi cube.
4. Calculate the importance for each relationship between processes and entities. This step is
important to adjust the dependencies between some processes and some entities, and can
change the importance provided by the survey. The relative importance between process/entity
pairs can potentiate changes due to dependencies between them. This network is similar to an
artificial neural network, because in neurons networks, the neurons influence others and are
under influence of others (Lippmann, 1987). An Information System have its own importance (in
this work referred to as "intrinsic") and the additional importance given by the systems which
depends or influences (in this work referred to as "calibrated").
5. With the data of the previous step, the CRUDi Cube is defined: the processes are associated with
the corresponding Information System.
6. Calculate the impact on the Return of Investment through the simulation based on the CRUDi
cube. For each investment in the Information System, new Key Business Indicators will be
6
generated. From the CRUDi Cube defined in step 5) we can build a global array of value chain
according to Porter (Porter, 1985), to know the Return in Investment (ROI) and eTOM process
based in a Balanced Scorecard (Norton & Kaplan, 1992).
Figure 2 CRUDI framework (J. M. G. Pereira et al., 2012)
Figure 3 CRUDi cube (Jorge Pereira, Gonçalves, et al., 2012)
2.3. TELECOMMUNICATION INDUSTRY
The telecommunication industry uses complex networks to allow telephones, mobile phones and
interconnection servers to offer services as voice communication, share information and do business
in different physical locations (Investopedia Staff, 2018). The telecommunication services have grown

7
with the increase of information and decrease of transmission delay. The most popular services are:
Internet, voice communication, digital television and data transmission (Ilchenko, Uryvsky, &
Moshinskaya, 2017). Between 2015 and 2016, the number of users in the world increased tree times,
see Figure 4.
Figure 4 “Dynamics of growth of the volume of rendered Internet services” (Ilchenko et al., 2017)
The telecommunication companies have a controlled structural growing. The investments should be
the ones to produce a competitive advantage: products and process should be simplified to focus the
resources in products with more profit and customer retention capability. It must be easy to
introduce new products; use the latest technologies to reduce the time, resources and increase the
customer experience, and finally, update the core network to better reponde to the growing data
transmission speed and quantity required by the customers (Deloitte Perspectives, 2017).
2.4. TM FORUM FRAMEWORX
In 1995, a group of telecommunication professionals created the TM FORUM, to define a set of
standard processes aiming to obtain a common language for all those involved in the business
development process in the telecommunication industry. The Frameworx, formerly known as New
Generation Operation System and Software (NGOSS), provides a set of best practices to support
companies to develop their internal and external business processes. It consists on several elements:
• the Information Framework (SID), which operates on all information flowing through the
organization and between service providers and their business partners:
• the Integration Framework, which provides guidance on how operational processes can be
automated using information definitions;
• the Application Framework (TAM), which supports successful business transformation and
provides a common language and means of identification for buyers and suppliers in all areas
of application development;

8
• the Enhanced Telecom Operations Map (eTOM) which provides a common framework for
defining and sharing business processes, enabling service providers and their suppliers to
work together to understand the current state of business activities, identifying
improvements and defining new processes to streamline their business (TM Forum, 2018).
This set of standards comes as a response to the growing complexity of new services. It allows users
to analyse their operations through the application of market benchmarks. Frameworx presents a set
of guidelines and specifications for the software creation industry, by analysing historical data and
current projects, thus responding to the growing technological evolution and consumer demands
(TM Forum, 2018). The framework main components can be represented as Figure 5:
Figure 5 Frameworx components (TM Forum, 2018)
Next, we will present in more detail each core components.
2.4.1. Shared Information/Data (SID)
The Information Framework (SID) is a component of Frameworx, the TM Forum’s blueprint for
enabling successful business transformation. It provides standard definitions for all the information
that flows through the enterprise and between service providers and their business partners
The Information Framework (SID) provides a reference model and common vocabulary for all the
information required to implement Business Process Framework (eTOM) processes. It reduces
complexity in service and system integration, development and design by providing an off the shelf
information model that can be quickly adopted by all parties (Forum, 2018c).
The Information Framework allows to:
• Reduce integration costs by adopting standards-based information models and use them in
applications and interfaces;

9
• save project hours, through a mature structure and 1500 entities developed and evaluated
by subject matter experts;
• Reduce time-to-market, using easy-to-understand integration interfaces based on the
Information Framework, eliminating the need to convert data between systems;
• Avoid unnecessary discussions with project teams, partners and suppliers, resulting in loss of
implementation time, by adopting a rich and extensible industry-accepted information
model;
• Comply with Information Framework, thus saving time and money during vendor evaluation
and procurement processes.
The Figure 6 Shared Information/Data (SID) 17.5 Level 1 (Forum, 2018c), presents the SID framework
process structure and domains.
2.4.2. Telecom Application Map (TAM)
The Application Framework (TAM) is a Frameworx subcomponent made available by TMF to support
business transformation successfully. Provides a common language and means of identification for
buyers and suppliers in all areas of application development (Forum, 2018a).
The TAM provides a bridge between eTOM and SID, which together create the "heart" of Frameworx
(Forum, 2018a).
The Application Framework can be used for the following purposes (Forum, 2018a):
• Optimize procurement using definitions and common language to specify and evaluate
solutions;
• Document and rationalize the application inventory during the project transformation phase;
• Integrate quickly and at lower costs by clearly defining and communicating the functions
provided within each application;
• Reduce development costs by modelling and standardizing application requirements;
• Increase automation and efficiency with standard, deployable components.
The Figure 7 shows the process structure that is part of TAM, as well as the domains that comprise it.
2.4.3. Business Process Framework (eTOM)
Service providers feel the increasing competition in the market, thus contributing to higher customer
expectations, reduced market share and increasing price pressures. As a result, they feel pressure to
clearly define and understand the business processes they use to provide converged services in this
competitive environment. All elements of the value chain require a business-oriented approach so
they can develop the complete understanding of their customer’s needs. This understanding
depends on the OSS, vital to support its customers. By applying this, service providers can integrate
OSS, thereby improving their own systems.
The eTOM is a standard developed and documented by TMF contributors. However, the practical
application of eTOM may not be carried out in an easy way, since it is necessary to know in detail the
10
established model and the current business organization processes. It aims to provide a common
language that everyone can use and provides a reference framework to categorize all cross-
organizational activities. The eTOM focus is the interconnection between business processes:
customers, services, resources, partners and suppliers (Forum, 2018b).
Analysing all phases of business processes makes eTOM a key tool to improve ongoing development
by enabling (Forum, 2018b):
• the creation of a common language for use across departments, systems, external partners
and suppliers, reducing cost and risk of system implementation, integration and
procurement;
• the adoption of a standard structure, terminology and classification scheme for business
processes to simplify internal operations and maximize opportunities to partner within and
across industries;
• the disciplined and consistent application of business process development enterprise-wide,
allowing for cross-organizational reuse;
• the understanding, design, development and management of IT applications in terms of
business process requirements so applications will better meet business needs;
• and the consistent creation of high-quality end-to-end process flows, eliminating gaps and
duplications in process flows;
• identification of opportunities for cost and performance improvement through re-use of
existing processes and systems.
In Figure 8 eTOM Business Process Framework Conceptual Structure 17.5 Level 1 (Forum, 2018b) ,
the conceptual framework of eTOM is presented with the framework's action domains.
The eTOM presents a business process structure, but it is not considered a business model of the
service provider, as it does not address the organization strategic objectives. It can, however, be
considered an essential part of the strategic business model that provides detailed processes that the
organization needs to follow.
Strategy, Infrastructure & Product
This vertical grouping of processes includes processes for the development of enterprise strategy,
building organizational support infrastructure, developing the product, and developing and managing
the distribution chain. In eTOM, infrastructure refers to more than just the IT infrastructure and
resources that support the products and services. It includes the necessary infrastructure to support,
for example, functional processes such as CRM (Customer Relationship Management), Human
Resources and Marketing. Strategy, Infrastructure and Product guide operations. These processes are
not every day processes that interact with the customer on a regular basis; they are processes that
plan, commit, construct, develop, evaluate and determine this targeting (Figueiredo & Pereira, 2016).

11
Strategy & Commit - This vertical subgrouping of processes is responsible for the generation of
strategies supporting the life cycle, infrastructure and product processes. It is also responsible for
establishing business commitments within the company to support these strategies.
Infrastructure Lifecycle Management - This vertical subgrouping of processes is responsible for the
definition, planning and implementation of all necessary infrastructure (application, IT and network),
as well as for all support infrastructure and business operation, architectures, etc.).
Product Lifecycle Management - This vertical subgrouping of processes is responsible for the
definition, planning, design and implementation of all products in the company's Product Lifecycle
Management.
Operations
The Operations processes group is the main area of eTOM. It includes all operations processes that
support customer operations, management and those that allow direct operations with the
customer. These processes include both day-to-day operations and support processes. Operations
also include sales management and supplier / partner relationship management. The Operations
process area (OPS) contains the Operations Support & Readiness, Fulfilment, Assurance and Billing &
Revenue Management. FAB (Fulfilment, Assurance and Billing) processes are often referred to as
Customer Operations processes (Figueiredo & Pereira, 2016).
Operations Support & Readiness - This vertical subgrouping of processes is responsible for
administrative and logistical support and availability assurance for the fulfilment, assurance, and
billing processes groups, front-line customer service. It addresses, for example, the processes
required to ensure efficient operation of call centres.

12
Figure 6 Shared Information/Data (SID) 17.5 Level 1 (Forum, 2018c)

13
Figure 7 Telecom Application Map (TAM) 17.5 Level 1 (Forum, 2018a)

14
Figure 8 eTOM Business Process Framework Conceptual Structure 17.5 Level 1 (Forum, 2018b)
15
Fulfilment - This vertical subgrouping of processes is responsible for providing customers with the
requested products in a timely and correct manner. It translates the customer's business or personal
need into a solution, which can be delivered using specific products in the company's portfolio. This
process give feedback to customers about the status of their purchase order, ensures timely
completion, and ensures customer satisfaction.
Assurance - This vertical subgrouping of processes is responsible for performing proactive and
reactive maintenance activities to ensure the customer services are continuously available and in
accordance with SLA (Service Level Agreement) or QoS (Quality of Service). Continuously monitors
resources and performance to proactively detect possible failures. It collects performance data and
analyses it to identify and resolve potential issues without impacting the customer. This process
manages SLA performance and customer service reports. Receives problem reports from the
customer and informs the customer about the status of these problems by ensuring their correctness
as well as customer satisfaction.
Billing & Revenue Management - This vertical grouping is responsible for collecting appropriate
records, determining billing, accurate account production to provide billing information to
customers, and processing payments. In addition, it handles customer inquiries about accounts,
provides billing status, and is responsible for solving billing issues that ensure timely customer
satisfaction. This grouping of processes also supports pre-payment of services.
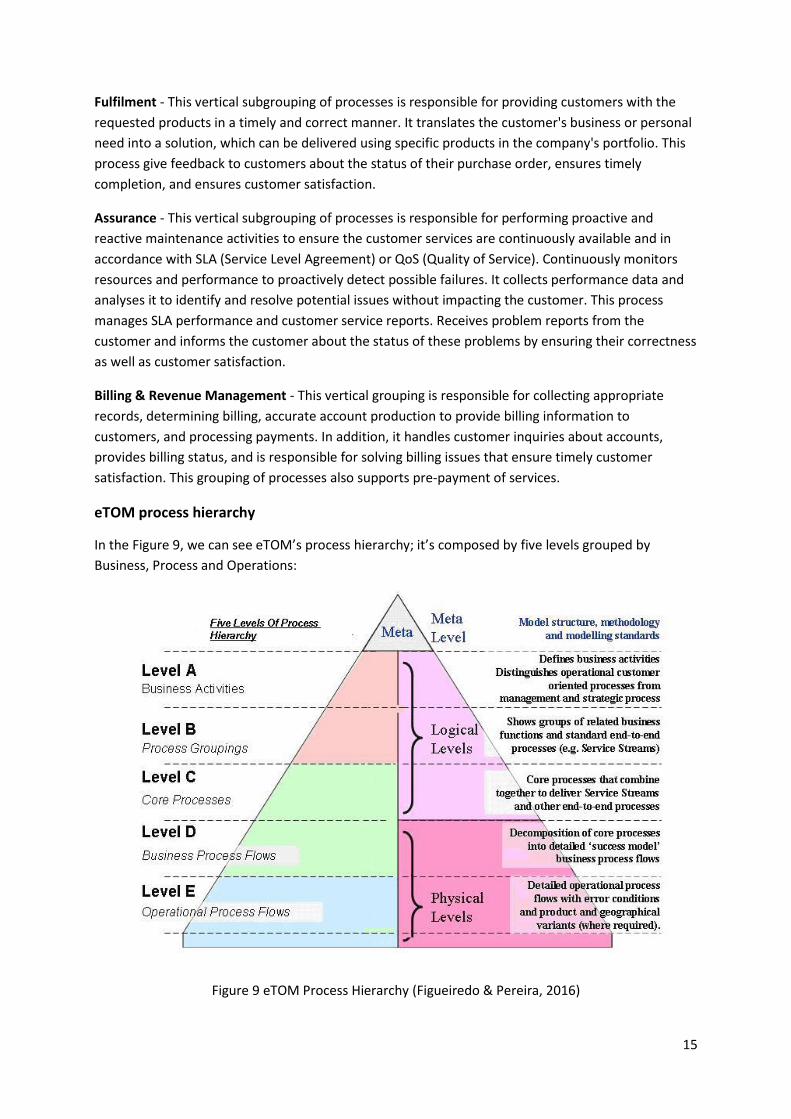
eTOM process hierarchy
In the Figure 9, we can see eTOM’s process hierarchy; it’s composed by five levels grouped by
Business, Process and Operations:
Figure 9 eTOM Process Hierarchy (Figueiredo & Pereira, 2016)

16
eTOM process levels
Level A - Business Activities - Identify and model: business objectives, value flows, environmental and
fiscal constraints; develop the balance scorecard and product lines. These are the business objectives
that processes and systems solutions must deliver.
Level B - Process Groupings - Design: product structure, product delivery and current support
processes, enterprise-level data model, organizational structure. Identify business knowledge.
Level C - Core Processes - Identify industry standard reference models; develop: generic processes,
hierarchy of processes; identify and model definitions of business model, system structure; define
the business functions. The processes are the key to achieving business objectives.
Level D - Business Process Flow - Detailed process design; assign function business; identify support
systems, data flows. Mapping business models to data models. Consider failures; queues and
bottlenecks. Detail is essential to ensure that each action generates value for the business (which
means to the customer) or is an essential requirement.
Level E- Operational Process Flow - Detailed sub process design; define operational functions;
processes point to written procedures; identify detailed systems, equipment and resource utilization.
2.5. APQC FRAMEWORK FOR TELECOMMUNICATION
The APQC Process Classification Framework is a common language for organizations to communicate
and define work processes. There is a “cross industry” and customizations for different industries,
each customization have the processes optimized for the specific industry. The generic version is
used when there is no specific Process Classification Framework definition available for a industry.
The framework identifies the activities and classifies in categories, process groups and process. The
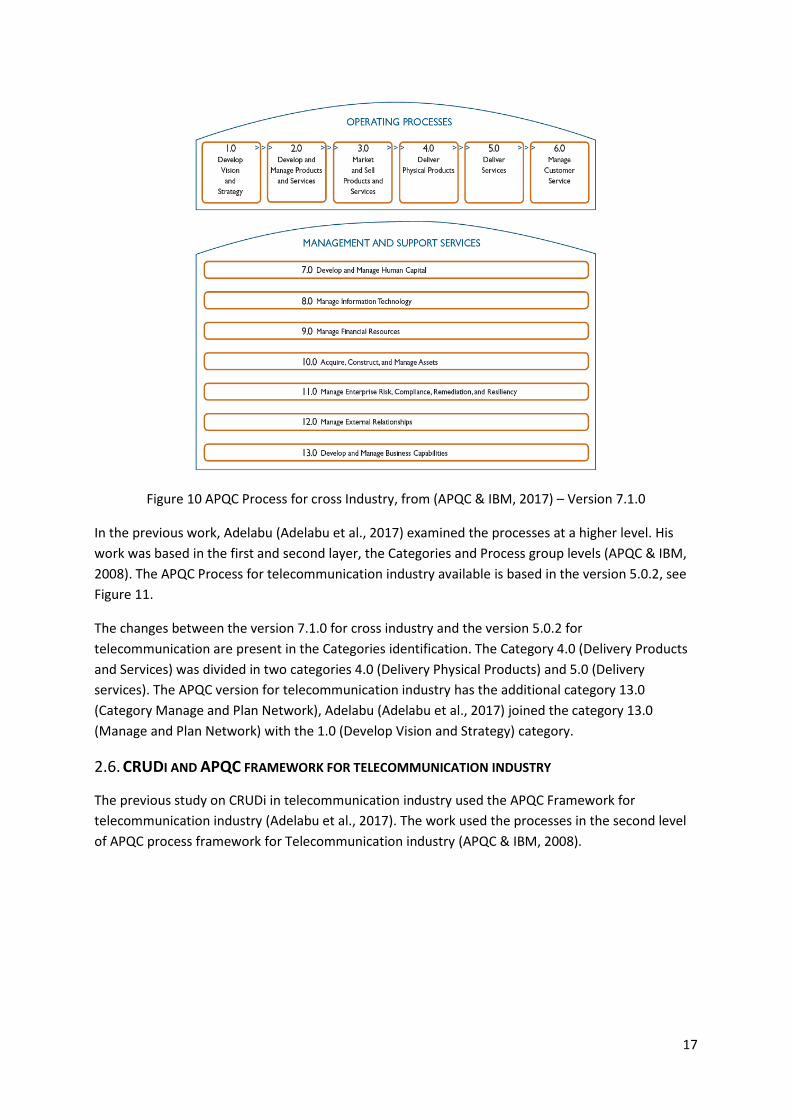
APQC categories are divided in two groups (Figure 10):
1. Operating process: one (1.0) to six (6.0)
2. Management and support services: seven (7.0) to thirteen (13.0)
17
Figure 10 APQC Process for cross Industry, from (APQC & IBM, 2017) – Version 7.1.0
In the previous work, Adelabu (Adelabu et al., 2017) examined the processes at a higher level. His
work was based in the first and second layer, the Categories and Process group levels (APQC & IBM,
2008). The APQC Process for telecommunication industry available is based in the version 5.0.2, see
Figure 11.
The changes between the version 7.1.0 for cross industry and the version 5.0.2 for
telecommunication are present in the Categories identification. The Category 4.0 (Delivery Products
and Services) was divided in two categories 4.0 (Delivery Physical Products) and 5.0 (Delivery
services). The APQC version for telecommunication industry has the additional category 13.0
(Category Manage and Plan Network), Adelabu (Adelabu et al., 2017) joined the category 13.0
(Manage and Plan Network) with the 1.0 (Develop Vision and Strategy) category.
2.6. CRUDI AND APQC FRAMEWORK FOR TELECOMMUNICATION INDUSTRY
The previous study on CRUDi in telecommunication industry used the APQC Framework for
telecommunication industry (Adelabu et al., 2017). The work used the processes in the second level
of APQC process framework for Telecommunication industry (APQC & IBM, 2008).

18
Figure 11 APQC Process for telecommunication industry, from (APQC & IBM, 2008) – Version 5.0.2
The CRUD matrix was developed by crossing the processes (second level) against the Information
Entities. The Informational Entities were defined as being any person, place, thing or business aspect
which interacts with the processes. The 13th processes were merged with 1st processes, both sub-
processes are involved in planning for how the service delivery as related to the technological
infrastructure is achieved. After, the relationship between the processes and business entities
(Lunsford & Collins, 2008), identified 12 first level processed :
1. Planning
2. Products and Services
3. Sales and Marketing
4. Service Delivery
5. Customer Service
6. Human Resources
7. Information Technology
8. Finance
9. Property

19
10. Environmental Health and Safety
11. External Relationship
12. Knowledge Management
To calibrate the influence of each Information system and dependencies, they built a diagram that
can be compared to a Neural Network where the nodes are connected in unison to solve a specific
problem. Then, a survey was conducted to gather the values for each node intrinsic importance and
their interfaces. In the survey, the participants defined the value of importance of each system and
the interfaces in a scale between 0 and 5, based in their influence and dependency between them:
0- No influence.
1- Little influence (only some secondary functions from B require information from A).
2- Average Influence (most secondary functions from B require A).
3- Great Influence (some primary functions from B require information from A).
4- Critical Influence (most functions from B require information from A).
5- Total Dependence (B only works if A works).
The next diagram contains the identified Information Systems and their intrinsic values, the
interfaces and their values used to calibrate the system, see Figure 12.
Figure 12 Information Systems their dependencies and values (Adelabu et al., 2017)

20
Each information system was affected and influenced by its inputs from interfaces that changed its
final value (calibrated) for importance. The maximum impact from all interfaces (inputs) in each
information system can reduce its “intrinsic” value of relative importance by 80% (Jorge Pereira,
Martins, Santos, & Gonçalves, 2014). In this way, every information system can keep a calibrated
remaining importance value even if it has a low intrinsic importance and a great dependence from
other information systems. Similarly, each information system affected others with its outputs
(interfaces) but without maximum limits. The resulting information system calibration is present in
Table 2.
The results gathered from the three major telecommunication companies in Portugal, demonstrated
the IT and IS are crucial for the business development and grow of the companies. The investments
set the company to a competitive advantage to their competitors. The study also concluded the IT
plays a role in the definition of business strategy (Adelabu et al., 2017).
Table 2 Information System (calibrated) importance for the Telecommunication Industry (Adelabu et al., 2017)
Information System Importance Calibrated Importance
Information Technology 4.75 9.14
Customer Service 4 6.15
Human Resources 4 6
Planning 3.25 5.62
Products and Services 3.5 5.14
Service Delivery 4.25 5.06
Sales and Marketing 3.25 4.74
Property 3.5 4.2
Finance and Accounts 3.75 3.94
Knowledge Management 3.5 3.02
A Likert scale was used in the third survey to characterize its importance. The resulting most
important APQC sub-processes were:
• 7.7 Deliver and support information technology services – average 4.5
• 5.2 Plan and manage customer service operations – 4.25
• 7.5 Develop and maintain information technology solutions – 4.25

21
The results demonstrated that in Telecommunication companies, the delivering and supporting
information technology should have a durable management process for IT infrastructure and its
delivery. The most important process identified in the survey was customer service management.
The result can be easily understood by top performers, the backbone for telecommunication industry
is the technology to provide products and services for customers.
22
3. RESEARCH METODOLOGY
This work followed the Design Science (Arnott & Pervan, 2012) as the previous works in the banking
industry and insurance (Jorge Pereira, Martins, Santos, et al., 2014) and telecommunication industry
(Adelabu et al., 2017).
In 1964, Fuller (Fuller & McHale, 1963) described design science as systematic form of design. Later it
was distinguished design and design scientific study (Gregory, 1966). The term Design Science was
used as arguments for artifacts study instead of the usual meaning (Simon, 1969). The artifacts were
described as constructs, models, methods and implemented and prototype systems, representing
specific ways to understand and analyse the use of IS inside organizations (Nunamaker, Chen, &
Purdin, 1990). To construct the application of an artefact is necessary to acquire knowledge and
understanding of a problem and it’s environment (Hevner, March, Park, & Ram, 2004). Design
Science Research was defined as analytical techniques to create new artifacts in Information Systems
research (Kuechler & Vaishnavi, 2008).
This study uses a similar approach to the CRUDi framework as described in CRUDi as alignment
model section. The survey asked for the previously identified Information Systems importance
instead of the individual business process importance:
1. identify the Information Systems. A CRUD table was created with the eTOM process framework
and SID framework, following the Business systems planning method (Chen et al., 2010) to define
the Information Systems and the IS interfaces.
2. The survey was sent to one Senior Product Manager with experience in several areas in
telecommunication industry to identify the IS intrinsic of their dependencies/interfaces value.
3. A CRUDi cube was created by combining the results of the steps 1) and 2).
4. Calibrate the IS importance using calibrated importance.
5. Calculate the impact on the Return of Investment through the simulation based on the CRUDi
cube.

23
4. APPLICATION OF CRUDI WITH ETOM
4.1. CRUDI-MATRIX
To define a CRUDi matrix for Telecommunication Industry using eTOM process definition, we created
a CRUD matrix based in eTOM’s Business Activities and Process Groupings (1st and 2nd level), and
Shared Information/Data Aggregated business entities. The matrix is a map of process and entities
with C, R, U, D and X, where C means Create, R - Read, U - Update, D - Delete and X – All operations.
During the matrix construction we didn’t consider the Business Activities and Share Information/Data
that were too generic and affected all other Information Systems. For this motive, the Process
Groups in Enterprise and Common Process Patterns Domain and the Aggregated Business Entities
subgroups of Enterprise and Common Business Entities Domain weren’t analysed in the study.
For more convenience the CRUD matrix is presented in two tables in the information Systems were
defined using the Business System Planning (Plains, 1984) , Table 3 and Table 4.
4.2. CALIBRATION
To calculate the importance of each Information Systems we need to identify the interdependency
between the Information systems and their weights. The diagram at Figure 13 can be analysed as a
Neural Network where all nodes, or, in this study, the Information Systems, are connected in unison
to solve a specific problem or series of processes (Gupta & Singh, 2011).
The importance of each Information System was recalculated by its influence on other systems.
Therefore, an Information System that entirely or partially helps other systems to operate, has its
intrinsic value plus the importance given by the other information Systems. The calibration is
important to increase the importance when the system when its used by others system.
A survey was conducted to retrieve the Information Systems (intrinsic) and their interface
importance values. The survey (Adelabu et al., 2017) qualified the importance of each Information
System in a scale between 1 and 5, the interface values in a scale between 0 and 5. We used the
same scale to easily compare the studies. The Figure 14 presents the values gathered in the survey in
one of the major Portuguese telecommunication organization; see Annex 1– Survey answers for the
answers gathered through the survey. Give the high number of Information Systems dependencies,
we present a graph like a neuronal network.
To calculate the calibration values, the IS “intrinsic” value initial time (t=0) is affected by the
interfaces. The “intrinsic”value of one IS increases when it offers output to others IS and reduces
when needs inputs from others IS to function. The “intrinsic” importance of an IS is incremented by
the sum of ( output IS “intrinsic” value* the interface value) and reduced by the sum of (input IS
“intrinsic” value * the interface value)*0,8 (Jorge Pereira, Martins, Santos, et al., 2014)/(number of
outpus/number of inputs). The reduction is limited to 80% so every IS can keep a calibrated lasting
importance value even if it as low intrinsic importance and a great dependence from other IS.

24
Table 3 eTOM CRUD Matrix part 1
Process IdentifierName
Mark
et Se
gmen
t ABE
Mark
et St
rateg
y Plan
ABE
Sales
Chan
nel A
BE
Com
petit
or A
BE
Cont
act P
rope
cts AB
E
Sales
Stati
stics
ABE
Mark
eting
Cam
paign
ABE
Custo
mer
ABE
Custo
mer
Inter
ation
ABE
Custo
mer
Order
ABE
Custo
mer
Statis
tic A
BE
Custo
mer
Prob
lem A
BE
Applie
d Cus
tom
er Bil
ling R
ate A
BE
Custo
mer
Bill A
BE
Custo
mer
Bill C
ollec
tion A
BE
Custo
mer
Bill In
quiry
ABE
Custo
mer
Serve
r Lev
el Agre
emen
t ABE
Prod
uct A
BE
Prod
uct S
pecif
icatio
n ABE
Strate
gic Pr
oduc
t Por
tfolio
Plan
ABE
Prod
uct O
fferin
g ABE
Prod
uct P
erfor
man
ce AB
E
Prod
uct U
sage
ABE
Prod
uct C
onfig
urat
ion A
BE
Loya
lty A
BE
Prod
uct T
est A
BE
Serv
ice A
BE
Serv
ice Sp
ecific
ation
ABE
Serv
ice Pe
rform
ance
ABE
Serv
ice Te
st ABE
Serv
ice St
rateg
y & Pl
an A
BE
Serv
ice Co
nfigu
ration
ABE
Serv
ice U
sage
ABE
Serv
ice Pr
oblem
ABE
Reso
uce A
BE
Reso
urce
Spec
ificati
on AB
E
Reso
urce
Confi
gura
tion A
BE
Reso
urce
Strat
egy a
nd Pl
an AB
E
Reso
urce
Test
ABE
Reso
urce
Topo
logy A
BE
Reso
urce
Trou
ble A
BE
Reso
urce
Perfo
rman
ce A
BE
Reso
urce
Usa
ge A
BE
Party
Stra
tegy A
BE
Party
ABE
Party
Stati
stics
ABE
Party
Ord
er AB
E
Party
Rev
eneu
ABE
Party
Prob
lem A
BE
Party
Inter
actio
n ABE
Party
Priva
cy A
BE
Agreem
ent A
BE
Party
Prod
uct S
pecia
lizati
on an
d Offe
ring A
BE
Adicion
al Pa
rty En
tities
ABE
Party
Servi
ce Le
vel A
greem
ent A
BE
1.1.1 Market Strategy & Policy R X R R R
1.1.2 Sales Strategy & Planning X X R U R U U R R U U
1.1.5 Sales Development X R R R R C R R
1.1.17 Market Research X R R R R
1.1.16 Brand Management X R R R R R R R U
1.1.12 Market Performance Management R X R R
1.1.3 Sales Forecasting R R
1.1.11 Contact/Lead/Prospect Management X C C C C C
1.1.13 Sales Performance Management R X R
1.1.18 Advertising R X
1.1.15 Marketing Campaign Management X R R R R R R R
1.1.7 Market Sales Support & Readiness R R X R R X R X
1.1.14 Marketing Communications R R R R R X R
1.1.9 Selling U R X R R R R R R R U X U
1.1.19 Loyalty Program Management R R R X R R
1.3.2 Customer Experience Management R R
1.3.1 Customer Support & Readiness R CRU R R
1.3.3 Order Handling R CRU X X R
1.3.4 Customer Management R R CRU R
1.3.5 Customer Interaction Management U CRU R
1.3.6 Customer Information Management U R X R R
1.3.7 Problem Handling CRU R R R R
1.3.15 Customer Experience Management Strategy and Planning R CRU
1.3.11 Bill Inquiry Handling R X
1.3.9 Bill Invoice Management X CRU R R R RU
1.3.10 Bill Payments & Receivables Management R X CRU CRU
1.3.12 Manage Billing Events R CRU
1.3.14 Manage Balances R
1.3.8 Customer QoS/SLA Management R R R R R R R
1.3.13 Charging R R
1.2.2 Product & Offer Capability Delivery R R R R X X X X X
1.2.4 Product Support & Readiness R R R X U U
1.2.6 Product Performance Management R R R X
1.2.1 Product & Offer Portfolio Planning R R X
1.2.5 Product Configuration Management C X X R R U R R U
1.2.7 Product Specification & Offering Development & Retirement X X X X X X X X X
1.2.10 Product Lifecycle Management X R R X R R
1.2.8 Product Capacity Management X R R
1.2.9 Product Offering Purchasing R R U R X
Sales and Marketing
Customer Relationship Management
Billing
Product Development and Management

25
Table 4 eTOM CRUD Matrix Part 2
Process IdentifierName
Mark
et Se
gmen
t ABE
Mark
et St
rateg
y Plan
ABE
Sales
Chan
nel A
BE
Com
petit
or A
BE
Cont
act P
rope
cts AB
E
Sales
Stati
stics
ABE
Mark
eting
Cam
paign
ABE
Custo
mer
ABE
Custo
mer
Inter
ation
ABE
Custo
mer
Order
ABE
Custo
mer
Statis
tic A
BE
Custo
mer
Prob
lem A
BE
Applie
d Cus
tom
er Bil
ling R
ate A
BE
Custo
mer
Bill A
BE
Custo
mer
Bill C
ollec
tion A
BE
Custo
mer
Bill In
quiry
ABE
Custo
mer
Serve
r Lev
el Agre
emen
t ABE
Prod
uct A
BE
Prod
uct S
pecif
icatio
n ABE
Strate
gic Pr
oduc
t Por
tfolio
Plan
ABE
Prod
uct O
fferin
g ABE
Prod
uct P
erfor
man
ce AB
E
Prod
uct U
sage
ABE
Prod
uct C
onfig
urat
ion A
BE
Loya
lty A
BE
Prod
uct T
est A
BE
Serv
ice A
BE
Serv
ice Sp
ecific
ation
ABE
Serv
ice Pe
rform
ance
ABE
Serv
ice Te
st ABE
Serv
ice St
rateg
y & Pl
an A
BE
Serv
ice Co
nfigu
ration
ABE
Serv
ice U
sage
ABE
Serv
ice Pr
oblem
ABE
Reso
uce A
BE
Reso
urce
Spec
ificati
on AB
E
Reso
urce
Confi
gura
tion A
BE
Reso
urce
Strat
egy a
nd Pl
an AB
E
Reso
urce
Test
ABE
Reso
urce
Topo
logy A
BE
Reso
urce
Trou
ble A
BE
Reso
urce
Perfo
rman
ce A
BE
Reso
urce
Usa
ge A
BE
Party
Stra
tegy A
BE
Party
ABE
Party
Stati
stics
ABE
Party
Ord
er AB
E
Party
Rev
eneu
ABE
Party
Prob
lem A
BE
Party
Inter
actio
n ABE
Party
Priva
cy A
BE
Agreem
ent A
BE
Party
Prod
uct S
pecia
lizati
on an
d Offe
ring A
BE
Adicion
al Pa
rty En
tities
ABE
Party
Servi
ce Le
vel A
greem
ent A
BE
1.4.1 Service Strategy & Planning X X X CRU CRU CRU CRU
1.4.2 Service Capability Delivery R R R
1.4.3 Service Development & Retirement X CRU CRU
1.4.4 SM&O Support & Readiness R CRU R
1.4.5 Service Configuration & Activation CRU CRU CRU
1.4.6 Service Problem Management R X
1.4.7 Service Quality Management R X R
1.4.8 Service Guiding & Mediation R R R R
1.5.1 Resource Strategy & Planning R R R X X X X
1.5.2 Resource Capability Delivery X
1.5.3 Resource Development & Retirement C CRU R
1.5.4 RM&O Support & Readiness CRU CRU R
1.5.5 Workforce Management
1.5.6 Resource Provisioning R R CRU R
1.5.7 Resource Data Collection & Distribution R R R R
1.5.8 Resource Trouble Management R R R R R X
1.5.9 Resource Performance Management R X
1.5.10 Resource Mediation & Reporting R
1.6.1 Party Strategy & Planning R X
1.6.3 Party Relationship Development & Retirement X X
1.6.8 Party Order Handling R X
1.6.10 Party Problem Handling R R R R X
1.6.2 Party Tender Management R CRU D
1.6.4 Party Offering Development & Retirement R X X
1.6.7 Party Privacy Management R X
1.6.5 Party Agreement Management R R R R R X
1.6.9 Party Interaction Management R X
1.6.11 Party Performance Management R RU R R R R
1.6.12 Party Revenue Management R R X R
1.6.14 Party Special Event Management RU R RU
1.6.13 Party Training and Education R X
1.6.6 Party Support & Readiness CRU
Service Delivery
Party Management
Resouce Development
Resource Management
Party Development

26
Figure 13 eTOM Information Systems and their dependencies
Figure 14 Information Systems and their interface values
For example, the IS Billing with the intrinsic value of 5, depends on Resource Manager (with intrinsic
value of 4) and the interface have the classification of 3. If the interface is not present, then value is
0. To better

27
In Figure 15, the labels “IS.X” identifies the Information Systems importance “X” and “IF.Y” the
importance for the interface number “Y”.
Figure 15 Information Systems and interfaces
Each interface influence has been normalized by dividing it by 10, the normalized values are in
Annex 2 – Normalized Impact values. The calibrated IS importance was calculated as follows:
Sales and Marketing = IS.1 + (IS.2xIF.6+IS.6xIF.27+IS.4xIF.18+IS.8xIF.35+IS.9xIF.36)-
0,8xIS.1x(IS.2xIF.4+IS.4xIF.5+IS.5xIF.3+IS.8xIF.1+IS.9xIF.2)/(number of output* number of inputs)
Therefore, Sales and Marketing = 3+(5x0.2+4x0.2+3x0.3+3x0.3+3x0.3)-
0.8x3x(5x0.5+3x0.3+4x0.4+3x0.3+3x0.3)/(5x5)
The Table 5 IS calibrated importance for the Telecommunication Industry using eTOM, presents the
calibrated importance values for each IS from the highest to the lowest importance
Table 5 IS calibrated importance for the Telecommunication Industry using eTOM
Information System Importance Calibrated Importance
Service Delivery 4
10,82
Party Development 3 10,57
Party Management 5 10,09
Product Development and Management 3 9,05

28
Information System Importance Calibrated Importance
Customer Relationship Management 4 8,87
Billing 5 8,13
Resource Management 3 7,39
Resource Development 3 7,36
Sales and Marketing 4 6,85
The values in the table will be discussed in the following section.
4.3. DISCUSSION
With the results of the work of Adelabu (Adelabu et al., 2017), the Information Systems relative
importance using the APQC (APQC & IBM, 2008) framework, in section 2.6. We compared it with the
Information Systems relative importance created using CRUDi framework eTOM framework.
To ensure the best results, the survey was presented to a business manager in one of the major
telecommunication company in Portugal. The survey asked to qualify in a 5-point Likert scale (Jacoby
& Matell, 1971) the Information Systems intrinsic importance and their dependencies. The
Information Systems were identified by the creation of a CRUD table with the eTOM business process
framework and SID framework.
This work identified the most important Information Systems:
• Service Delivery – 10,82
• Party Development – 10,57
• Party Management – 10,09
The identified IS with the higher relative importance was Service Delivery. Although, the initial high
importance of Customer Relationship Management and Billing Information Systems, with the
calibration it reduced the importance compared to other IS. The Party Development IS had a low
intrinsic importance became the second higher relative important, as it had a high influence on
others Information System.
When considering the IS with high dependencies and low output to others Information Systems, the
Sales and Marketing IS didn’t have a significative increase in its importance, which contributed to be
the IS with the lowest relative importance.

29
5. CONCLUSION
5.1. SYNTHESIS OF THE DEVELOPED WORK
The alignment between business and Information Systems is a priority for top management. The IS
should be aligned with the business objectives in order to maximize its value. The alignment is a top
concern for management teams. The Information Systems investment decisions should identify and
prioritize the Information Systems investments based on importance for the organization.
This study used an implementation of the CRUDi framework with eTOM framework. The CRUDi
framework adds the third dimension on the CRUD matrix, the importance. A CRUD matrix was
created from the eTOM business process framework and the Shared/Information Data framework.
The CRUDi created from the matrix with the importance dimension allows telecommunication
companies to identify the Information System with higher Return on Investment. This work
demonstrated the CRUDi with eTOM business framework can be used to identify the Information
System with the higher relative importance. The work suggested that the telecommunication
industries should invest in Service Delivery, Party Development and Party Management Information
Systems as they have a higher Return on Investment.
The CRUD matrix created for this work uses the eTOM business process and the Entities defined in
the SID framework, the CRUD matrix in the CRUDi with APQC business process for
telecommunication industry and the informational entities (any person, place, thing or business
aspect) created different Information Systems. The difference is mainly because the eTOMs business
process can be categorized in the AQPC’s operating process, however eTOM framework have a
higher detail of operational business processes than APQC.
5.2. LIMITATIONS AND FUTURE WORK
The Information Systems identified using eTOM framework mostly matches the APQC operation
process, which limits the matches between the identified Information Systems. The Enterprise and
Common Process Patterns domains were not used in the study, as they were too generic. A future
work should include these domains as it may be possible to identify more Information Systems like
the ones identified using the APQC process framework.
This study should be repeated in a few years with the latest eTOM framework available, to see if the
Information Systems importance and relative importance changes or new Information Systems can
be identified with a newest eTOM framework.
30
BIBLIOGRAPHY
Adelabu, B., Santos, V., & Pereira, J. (2017). Maximizing ROI in information systems investment decisions : CRUDi implementation for telecommunication organizations. Universidade Nova de Lisboa. https://doi.org/http://hdl.handle.net/10362/24454
APQC & IBM. (2008). THE TELECOMMUNICATIONS PROCESS CLASSIFICATION FRAMEWORK. Retrieved from https://www.apqc.org/knowledge-base/download/32921/PCF_Telecom_Ver_5.0.2.pdf
APQC & IBM. (2017). CROSS INDUSTRY PROCESS CLASSIFICATION FRAMEWORK. Retrieved from https://www.apqc.org/knowledge-base/download/407328/K08204_PCF_Cross Industry_v710.pdf
Arnott, D., & Pervan, G. (2012). Design Science in Decision Support Systems Research: An Assessment using the Hevner, March, Park, and Ram Guidelines., 13(11 OP-Journal of the Association for Information Systems. Nov2012, Vol. 13 Issue 11, p923-949. 27p. 15 Charts.), 923. Retrieved from http://search.ebscohost.com/login.aspx?direct=true&site=eds-live&db=bth&AN=87717507
Avison, D., Jones, J., Powell, P., & Wilson, D. (2004). Using and validating the strategic alignment model. The Journal of Strategic Information Systems, 13(3), 223–246. https://doi.org/https://doi.org/10.1016/j.jsis.2004.08.002
Bahri-Ammari, N., & Bilgihan, A. (2017). The effects of distributive, procedural, and interactional justice on customer retention: An empirical investigation in the mobile telecom industry in Tunisia. Journal of Retailing and Consumer Services, 37, 89–100. https://doi.org/10.1016/j.jretconser.2017.02.012
Belalcázar, A., Merchán, V., Díaz, J., & Molinari, L. (2017). Towards complement strategy in the business-IT alignment. In 2017 CHILEAN Conference on Electrical, Electronics Engineering, Information and Communication Technologies (CHILECON) (pp. 1–6). https://doi.org/10.1109/CHILECON.2017.8229588
Benson, R., Bugnitz, T., & Walton, W. (2004). Moving from business strategy to IT action. Journal of Corporate Accounting & Finance (Wiley), 15(5 OP-Journal of Corporate Accounting & Finance (Wiley); Jul/Aug2004, Vol. 15 Issue 5, p39-45, 7p), 39. Retrieved from http://search.ebscohost.com/login.aspx?direct=true&site=eds-live&db=edb&AN=17073045
Cash, J. I., Jr., F. W. M., & McKenney, J. L. (1992). Corporate Information Systems Management: Issues Facing Senior Executives. 3rd Ed. Homewood, IL: Business One Irwin, 34(4), 77–88.
Chen, D. Q., Mocker, M., Preston, D. S., & Teubner, A. (2010). INFORMATION SYSTEMS STRATEGY: RECONCEPTUALIZATION, MEASUREMENT, AND IMPLICATIONS., 34(2 OP-MIS Quarterly. Jun2010, Vol. 34 Issue 2, p233-A8. 35p. 3 Diagrams, 7 Charts.), 233. Retrieved from http://search.ebscohost.com/login.aspx?direct=true&site=eds-live&db=heh&AN=50033964
Colisto, N. R. (2012). The CIO Playbook. (Willey, Ed.). https://doi.org/10.1002/9781119203766
Cuenca, L., Boza, A., & Ortiz, A. (2011). An enterprise engineering approach for the alignment of business and information technology strategy., 24(11 OP-International Journal of Computer Integrated Manufacturing. Nov2011, Vol. 24 Issue 11, p974-992. 19p.), 974. https://doi.org/10.1080/0951192X.2011.579172

31
Deloitte Perspectives. (2017). 2017 Telecommunications Industry Outlook | Deloitte US. Retrieved from https://www2.deloitte.com/us/en/pages/technology-media-and-telecommunications/articles/telecommunications-industry-outlook.html
Dictionaries, O. L. (2018). Importance definition. Retrieved from https://en.oxforddictionaries.com/definition/importance
Feeny, D. F., Edwards, B. R., & Simpson, K. M. (1992). Understanding the CEO/CIO Relationship., 16(4 OP-MIS Quarterly. Dec1992, Vol. 16 Issue 4, p435-448. 14p. 2 Charts.), 435. Retrieved from http://search.ebscohost.com/login.aspx?direct=true&site=eds-live&db=heh&AN=9604010643
Figueiredo, R. H. C. de, & Pereira, C. (2016). Processo de Implementação do Modelo eTOM em Empresas de Telecomunicações. Retrieved from http://www.rcaap.pt/detail.jsp?id=oai:comum.rcaap.pt:10400.26/15260
Forum, T. (2018a). Application Framework (TAM). Retrieved from https://www.tmforum.org/application-framework/
Forum, T. (2018b). Business Process Framework (eTOM). Retrieved from https://www.tmforum.org/business-process-framework/
Forum, T. (2018c). Information Framework (SID). Retrieved from https://www.tmforum.org/information-framework-sid/
Fuller, R. B., & McHale, J. (1963). World Design Science Decade, 1965-1975: Five Two Year Phases of a World Retooling Design Proposed to the International Union of Architects for Adoption by World Architectural Schools (Vol. 2). World Resources Inventory, Southern Illinois University.
Gregory, S. A. (1966). Design science. In The design method (pp. 323–330). Springer.
Gupta, A. K., & Singh, Y. P. (2011). Analysis of Hamming Network and MAXNET of Neural Network Method in the String Recognition. In 2011 International Conference on Communication Systems and Network Technologies (pp. 38–42). https://doi.org/10.1109/CSNT.2011.15
Henderson, J. C., & Sifonis, J. G. (1988). The Value of Strategic IS Planning: Understanding Consistency, Validity and IS Markets. MIS Quarterly, 12(2), 187–200. https://doi.org/10.2307/248843
Henderson, J. C., & Venkatraman, N. (1991). Understanding strategic alignment. Business Quarterly.
Hevner, A. R., March, S. T., Park, J., & Ram, S. (2004). Design Science in Information Systems Research. MIS Quarterly, 28(1), 75–105. https://doi.org/10.2307/25148625
Ilchenko, M., Uryvsky, L., & Moshinskaya, A. (2017). Developing Telecommunication Strategies Based on Scenarios in the Information Community. Cybernetics & Systems Analysis, 53(6 OP-Cybernetics & Systems Analysis; Nov2017, Vol. 53 Issue 6, p905-913, 9p), 905. https://doi.org/10.1007/s10559-017-9992-9
Investopedia Staff. (2018). The Industry Handbook: The Telecommunications Industry. Retrieved from https://www.investopedia.com/features/industryhandbook/telecom.asp
Jacoby, J., & Matell, M. S. (1971). Three-Point Likert Scales Are Good Enough. Journal of Marketing Research, 8(4), 495. https://doi.org/10.2307/3150242
Kappelman, L., McLean, E. R., Johnson, V., Torres, R. R., Nguyen, Q., Maurer, C., & Snyder, M. (2017). The 2016 SIM IT Key Issues and Trends Study. MIS Quartely Executive, 16(1), 47–80.
32
King, W. R. (1978). Strategic planning for management information systems. MIS Quarterly, 27–37.
Kovacevic, A., & Majluf, N. (1993). Six Stages of IT Strategic Management. Sloan Management Review, 34(4), 77–88.
Kuechler, B., & Vaishnavi, V. (2008). On theory development in design science research: Anatomy of a research project. European Journal of Information Systems, 17(5), 489–504. https://doi.org/10.1057/ejis.2008.40
Lane, D. (2011). The Chief Information Officer’s Body of Knowledge (September). John Wiley & Sons. Retrieved from https://www.wiley.com/en-us/The+Chief+Information+Officer%27s+Body+of+Knowledge%3A+People%2C+Process%2C+and+Technology-p-9781118043257
Laudon, K. C., & Laudon, J. P. (2016). Management Information Systems: Managing the Digital Firm. New Jersey (Vol. 14). https://doi.org/10.1590/S1415-65552003000100014
Lederer, A., & Salmela, H. (1996). Toward a theory of strategic information systems planning. Journal of Strategic Information Systems, 5(3), 237–253. https://doi.org/10.1016/S0963-8687(96)80005-9
Lederer, A., & Sethi, V. (1988). The Implementation of Strategic Information Systems Planning Methodologies. MIS Quarterly, 12(3), 445. https://doi.org/10.2307/249212
Lippmann, R. P. (1987). An Introduction to Computing with Neural Nets. IEEE ASSP Magazine, 4(2), 4–22. https://doi.org/10.1109/MASSP.1987.1165576
Lunsford, D. L., & Collins, M. R. (2008). The CRUD security matrix: A technique for documenting access rights. In 7th Annual Security Conference (pp. 2–4).
MacDonald, H. (1991). Business Strategy Development, Alignment and Redesign. Corporation of the 1990s: Information Technology and Organizational Transformation.
Majstorović, M. N. (2016). BUSINESS AND IT ALIGNMENT., 64(2 OP-Military Technical Courier / Vojnotehnicki Glasnik. 2016, Vol. 64 Issue 2, p496-512. 17p.), 496. https://doi.org/10.5937/vojtehg64-9263
McFarlane, F. W. (1984). Information technology changes the way you compete. Harvard Business Review, 62(3), 98–103. https://doi.org/Article
Miller, S. P. (2013). Information Technology Infrastructure Library (ITIL). Retrieved from http://search.ebscohost.com/login.aspx?direct=true&site=eds-live&db=ers&AN=89550589 OP - Salem Press Encyclopedia, September, 2013. 1p.
Moody, D. (1998). Metrics for Evaluating the Quality of Entity Relationship Models. Springer, Berlin, Heidelberg. https://doi.org/ttps://doi.org/10.1007/978-3-540-49524-6_18
Moura, A., Sauvé, J., & Bartolini, C. (2008). Business-Driven IT Management — Upping the Ante of IT: Exploring the Linkage between IT and Business to Improve Both IT and Business Results. IEEE Communications Magazine, 46(10), 148–153. Retrieved from http://search.ebscohost.com/login.aspx?direct=true&db=edb&AN=34772155&site=eds-live
Norton, D., & Kaplan, R. (1992). Translating Strategy into Action: The Balanced Scorecard. Harvard Business Review, (January-February), 71–79. https://doi.org/ieeexplore.ieee.org
Nunamaker, J., Chen, M., & Purdin, T. D. M. (1990). Systems Development in Information Systems

33
Research. Journal of Management Information Systems, 7(3), 89–106. https://doi.org/10.1080/07421222.1990.11517898
Oparaugo, C. (2016). COBIT 5 Mapping Exercise for Establishing Enterprise IT Strategy., 1. Retrieved from http://search.ebscohost.com/login.aspx?direct=true&site=eds-live&db=bth&AN=120048625 OP - COBIT Focus. 12/5/2016, p1-18. 18p. 2 Diagrams, 8 Charts, 1 Graph.
Pereira, J., Gonçalves, R., & Santos, V. (2012). Maximizing return on investments and agility in information systems investment decisions: the CRUDi framework. Retrieved from http://search.ebscohost.com/login.aspx?direct=true&site=eds-live&db=edsrca&AN=rcaap.doctoralthesis.10348.4773
Pereira, J., Martins, J., Goncalves, R., & Santos, V. (2014). 2014 9th Iberian Conference on Information Systems & Technologies (CISTI). https://doi.org/10.1109/CISTI.2014.6876934
Pereira, J., Martins, J., Goncalves, R., & Santos, V. (2014). 2014 9th Iberian Conference on Information Systems and Technologies (CISTI), Information Systems and Technologies (CISTI), 2014 9th Iberian Conference on. https://doi.org/10.1109/CISTI.2014.6876934
Pereira, J., Martins, J., Santos, V., & Gonçalves, R. (2012). Crudi Framework - Maximizing Roi and Agility in Information Systems Investment Decisions. In MCIS 2012 Proceedings.
Pereira, J., Martins, J., Santos, V., & Gonçalves, R. (2014). CRUDi framework proposal: financial industry application., 33(10 OP-Behaviour & Information Technology. Oct2014, Vol. 33 Issue 10, p1093-1110. 18p. 1 Illustration.), 1093. https://doi.org/10.1080/0144929X.2014.914976
Plains, W. (1984). Business systems planning : information systems planning guide. (N. Y. : I. C. White Plains, Ed.).
Porter, M. E. (1985). Porter’s Value Chain. https://doi.org/http://en.wikipedia.org/wiki/File:Porter_Value_Chain.png
Scheepers, H., & Scheepers, R. (2008). A process-focused decision framework for analyzing the business value potential of IT investments., 10(3 OP-Information Systems Frontiers; Jul2008, Vol. 10 Issue 3, p321-330, 10p, 4 Diagrams), 321. https://doi.org/10.1007/s10796-008-9076-5
Simon, H. A. (1969). The Sciences of the Artificial. Cambridge, MA (Vol. 1). https://doi.org/10.1016/S0898-1221(97)82941-0
Singh, S. N., & Woo, C. (2009). Investigating business-IT alignment through multi-disciplinary goal concepts. REQUIREMENTS ENGINEERING, 14(3), 177–207. Retrieved from http://gateway.isiknowledge.com/gateway/Gateway.cgi?&GWVersion=2&SrcAuth=EBSCO&SrcApp=EDS&DestLinkType=CitingArticles&KeyUT=000267664700003&DestApp=WOS
TM Forum. (2018). Frameworx. Retrieved from https://www.tmforum.org
Veryard, R. (1994). Information Coordination: The Management of Information Models, Systems, and Organizations. Prentice-Hall BCS Practitioner.
Zviran, M. (1990). ISSPSS: A decision support system for information systems strategic planning. Information and Management, 19(5), 345–359. https://doi.org/10.1016/0378-7206(90)90048-M
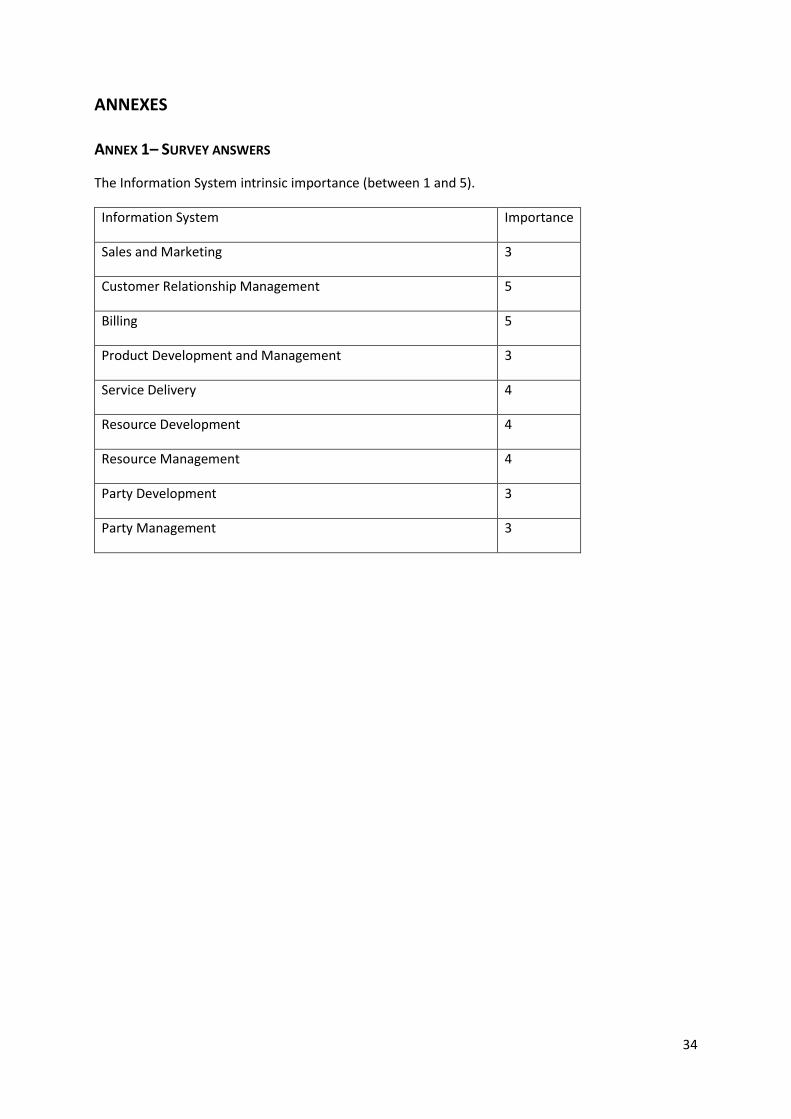
34
ANNEXES
ANNEX 1– SURVEY ANSWERS
The Information System intrinsic importance (between 1 and 5).
Information System Importance
Sales and Marketing 3
Customer Relationship Management 5
Billing 5
Product Development and Management 3
Service Delivery 4
Resource Development 4
Resource Management 4
Party Development 3
Party Management 3

35
ANNEX 2 – NORMALIZED IMPACT VALUES
The interface influence values referenced in section 4.2 and the normalization are presented here:
Interface From IS To IS Value
(impact)
Normalized
IF.4 Sales and Marketing Customer Relationship
Management
5 0.5
IF.5 Sales and Marketing Product Development and
Management
3 0.3
IF.3 Sales and Marketing Service Delivery 4 0.4
IF.1 Sales and Marketing Party Development 3 0.3
IF.2 Sales and Marketing Party Management 3 0.3
IF.6 Customer Relationship
Management
Sales and Marketing 2 0.2
IF.10 Customer Relationship
Management
Billing 5 0.5
IF.7 Customer Relationship
Management
Product Development and
Management
3 0.3
IF.11 Customer Relationship
Management
Service Delivery 5 0.5
IF.9 Customer Relationship
Management
Party Management 4 0.4
IF.8 Customer Relationship
Management
Party Development 2 0,2
IF.13 Billing Customer Relationship
Management
2 0.2
IF.16 Billing Resource Development 4 0.4
IF.14 Billing Resource Management 3 0.3
IF.17 Billing Party Development 4 0.4
IF.15 Billing Party Management 3 0.3
IF.12 Billing Product Development
Management
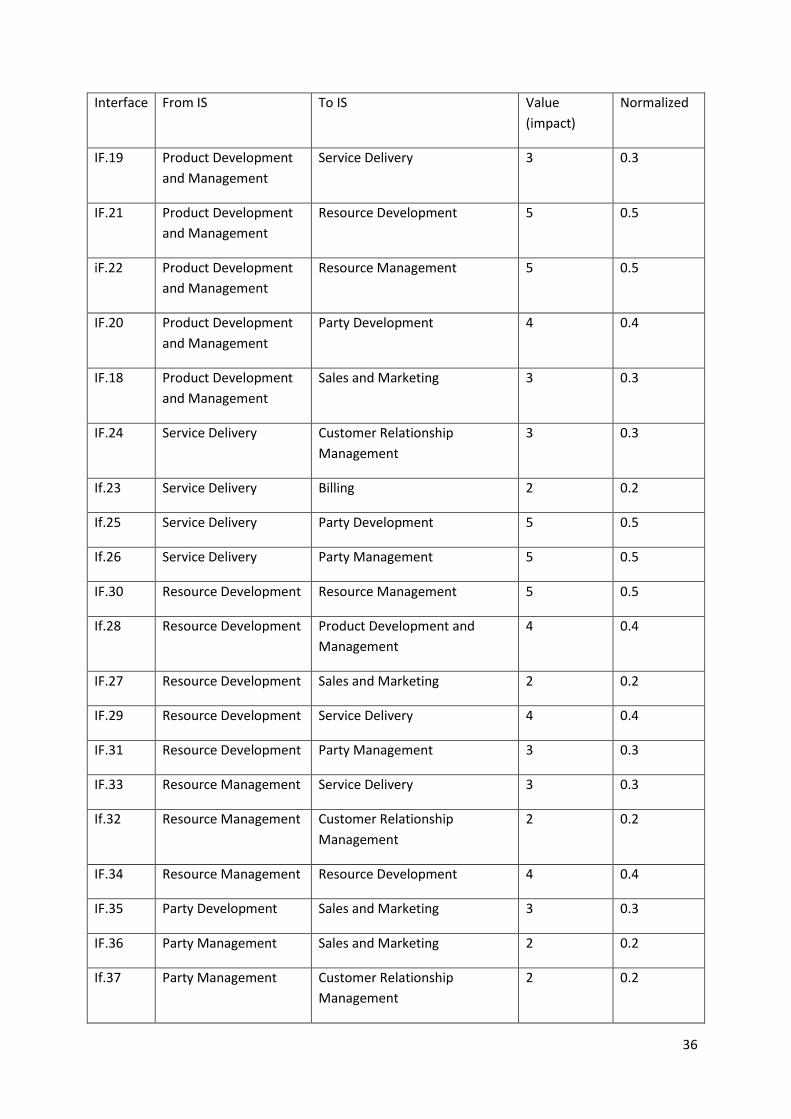
36
Interface From IS To IS Value
(impact)
Normalized
IF.19 Product Development
and Management
Service Delivery 3 0.3
IF.21 Product Development
and Management
Resource Development 5 0.5
iF.22 Product Development
and Management
Resource Management 5 0.5
IF.20 Product Development
and Management
Party Development 4 0.4
IF.18 Product Development
and Management
Sales and Marketing 3 0.3
IF.24 Service Delivery Customer Relationship
Management
3 0.3
If.23 Service Delivery Billing 2 0.2
If.25 Service Delivery Party Development 5 0.5
If.26 Service Delivery Party Management 5 0.5
IF.30 Resource Development Resource Management 5 0.5
If.28 Resource Development Product Development and
Management
4 0.4
IF.27 Resource Development Sales and Marketing 2 0.2
IF.29 Resource Development Service Delivery 4 0.4
IF.31 Resource Development Party Management 3 0.3
IF.33 Resource Management Service Delivery 3 0.3
If.32 Resource Management Customer Relationship
Management
2 0.2
IF.34 Resource Management Resource Development 4 0.4
IF.35 Party Development Sales and Marketing 3 0.3
IF.36 Party Management Sales and Marketing 2 0.2
If.37 Party Management Customer Relationship
Management
2 0.2

37
Interface From IS To IS Value
(impact)
Normalized
IF.40 Party Management Party Development and
Management
4 0.4
IF.38 Party Management Service Delivery 2 0.2
IF.39 Party Management Party Management 3 0.3

38
ANNEX 3 – CALIBRATION VALUES
The calibrated values of relative importance for each IS were referenced in section 4.2, and the
detailed calculations are presented here:
Service Delivery = IS.5+(IS.1xIF.3+IS.2xIF.11+IS.4xIF.19+IS.6xIF.29+IS.7xIF.33+IS.9xIF.38)-
0,8xIS.5x(IS.2xIF.24+IS.3xIF.23+IS.8xIF.25+IS.9xIF.26)/(4x6)
Service Delivery = 4+(3*0,4+5*0,5+3*0,3+4*0,4+3*0,3+3*0,2)-
0,8*4*(5*0,2+5*0,3+3*0,5+3*0,5)/(4*5)
Service Delivery = 10,82 (10,82 round to decimals)
Party Development = IS.8+(IS.1xIF.1+IS.2xIF.8+IS.3xIF.17+IS.4xIF.20+IS.5xIF.25+IS.9xIF.39)-
0,8xIS.8x(IS.1xIF.35)/(1*6)
Party Development = 3+(3*0,3+5*0,2+5*0,4+3*0,4+4*0,5+3*0,3)-0,8*3*(3*0,3)/(1*5)
Party Development = 10,568 (10,57 round to decimals)
Party Management = IS.9+(IS.1xIF.2+IS.2xIF.9+IS.3xIF.15+IS.5xIF.26+IS.6xIF.31)-
0,8xIS.8x(IS.1xIF.36+IS.2xIF.37+IS.4xIF.40+IS.5xIF.38+IS.8xIF.39)/(5*5)
Party Management = 3+(3*0,3+5*0,4+5*0,3+4*0,5+4*0,3)-
0,8*3*(3*0,3+5*0,3+3*0,4+4*0,2+3*0,3)/(5*5)
Party Management = 10,0912 (10,09 round to decimals)
Product Development and Management = IS.4+(IS.1xIF.5+IS.2xIF.7+IS.3xIF.12+IS.6xIF.28+IS.9xIF.40)-
0,8xIS.4x(IS.1xIF.18+IS.5xIF.19+IS.6xIF.21+IS.7xIF.22+IS.8xIF.20)/(5x5)
Product Development and Management = 3+(3*0,3+5*0,3+5*0,3+4*0,4+3*0,4)-
0,8*3*(3*0,3+4*0,3+4*0,5+3*0,5+3*0,4)/(5*5)
Product Development and Management = 9,0472 (9,05 round to decimals)
Customer Relationship Management =
IS.2+(IS.1xIF.4+IS.3xIF.13+IS.5xIF.24+IS.7xIF.32+IS.7xIF.32+IS.9xIF.37)-
0,8xIS.2x(IS.1xIF.6+IS.3xIF.10+IS.4xIF.7+IS.5xIF.7+IS.8xIF.8+IS.9xIF.9)/(6x6)
Customer Relationship Management = 5+(3*0,5+5*0,2+4*0,2+3*0,+3*0,3+3*0,2)-
0,8*5*(3*0,2+5*0,5+3*0,3+4*0,3+3*0,2+3*0,4)/(6*5)
Customer Relationship Management = 8,866666667 (8,87 round to decimals)
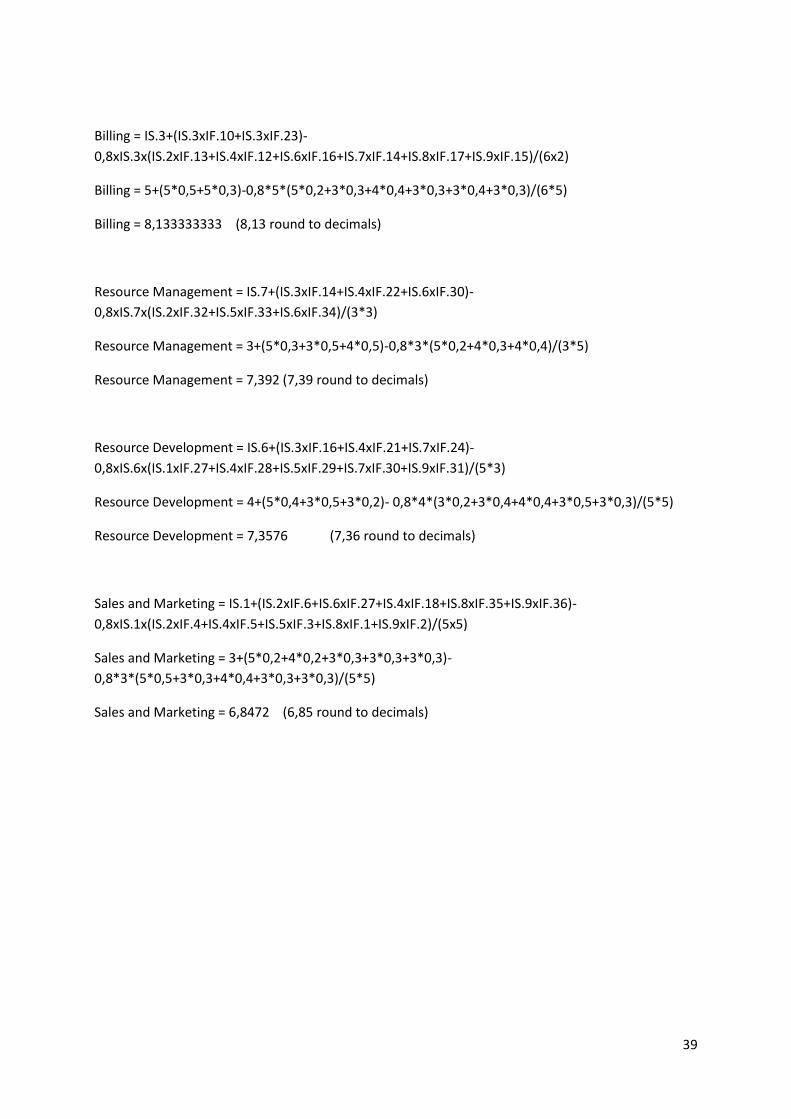
39
Billing = IS.3+(IS.3xIF.10+IS.3xIF.23)-
0,8xIS.3x(IS.2xIF.13+IS.4xIF.12+IS.6xIF.16+IS.7xIF.14+IS.8xIF.17+IS.9xIF.15)/(6x2)
Billing = 5+(5*0,5+5*0,3)-0,8*5*(5*0,2+3*0,3+4*0,4+3*0,3+3*0,4+3*0,3)/(6*5)
Billing = 8,133333333 (8,13 round to decimals)
Resource Management = IS.7+(IS.3xIF.14+IS.4xIF.22+IS.6xIF.30)-
0,8xIS.7x(IS.2xIF.32+IS.5xIF.33+IS.6xIF.34)/(3*3)
Resource Management = 3+(5*0,3+3*0,5+4*0,5)-0,8*3*(5*0,2+4*0,3+4*0,4)/(3*5)
Resource Management = 7,392 (7,39 round to decimals)
Resource Development = IS.6+(IS.3xIF.16+IS.4xIF.21+IS.7xIF.24)-
0,8xIS.6x(IS.1xIF.27+IS.4xIF.28+IS.5xIF.29+IS.7xIF.30+IS.9xIF.31)/(5*3)
Resource Development = 4+(5*0,4+3*0,5+3*0,2)- 0,8*4*(3*0,2+3*0,4+4*0,4+3*0,5+3*0,3)/(5*5)
Resource Development = 7,3576 (7,36 round to decimals)
Sales and Marketing = IS.1+(IS.2xIF.6+IS.6xIF.27+IS.4xIF.18+IS.8xIF.35+IS.9xIF.36)-
0,8xIS.1x(IS.2xIF.4+IS.4xIF.5+IS.5xIF.3+IS.8xIF.1+IS.9xIF.2)/(5x5)
Sales and Marketing = 3+(5*0,2+4*0,2+3*0,3+3*0,3+3*0,3)-
0,8*3*(5*0,5+3*0,3+4*0,4+3*0,3+3*0,3)/(5*5)
Sales and Marketing = 6,8472 (6,85 round to decimals)