information system for the centralized display of …
TRANSCRIPT
FACTA UNIVERSITATIS Series: Electronics and Energetics Vol. 30, No 4, December 2017, pp. 557 - 570 DOI: 10.2298/FUEE1704557J
INFORMATION SYSTEM FOR THE CENTRALIZED DISPLAY
OF THE TRANSPORT COMFORT INFORMATION*
Željko Jovanović1, Ranko Bačević
1, Radoljub Marković
1,
Siniša Ranđić1, Dragan Janković
2
1University of Kragujevac, Faculty of Technical Sciences, Ĉaĉak, Serbia
2University of Niš, Faculty of Electronic Engineering, Niš, Serbia
Abstract. This paper introduces the information system for presenting road comfort
map. The map is generated based on the conducted transportations. As a basis for the
information system and the source of the comfort information, developed Android
application is used. It calculates comfort parameters using three-axis accelerometer
values. The calculated data are recorded into the files in the proper format. Recorded
files are uploaded on the information system to be viewed and analyzed. As a final
result of all recorded transportations, it is possible to generate a map of roads comfort.
The paper presents the current functionality of the system and the current roads
comfort map of covered roads in Serbia. Based on the collected data about 50% of
transportation intervals were comfortable, 44% was moderately uncomfortable, and
6% was uncomfortable.
Key words: Android, Transport comfort, GIS, Comfort map
1. INTRODUCTION
The term transport comfort cannot be strictly defined, but it is of great importance in
the assessment of transport quality. The problem is the subjective comfort feeling which
is different for every person. Comfort depends on many factors like acceleration (vibration),
noise, temperature, compartment space, etc. If only mechanical effects are of interest, then
generally the acceleration and vibration that passengers feel during the ride have the
greatest impact on passenger comfort. Vibrations are caused by three factors: vehicle
condition, driver skills (driving style), and road condition. As for vehicle condition factors,
suspension system and tires are most important vehicles parts that affects on vibration.
Nowadays, some vehicles suspension systems have active suspension control for better
Received November 14, 2016; received in revised form March 2, 2017
Corresponding author: Željko Jovanović
University of Kragujevac, Faculty of Technical Sciences, Ĉaĉak, Serbia (E-mail: [email protected]) * An earlier version of this paper received Best Paper Award in Computer Science section at 60th Conference on
Electronics, Telecommunications, Computers, Automation and Nuclear Engineering (ETRAN 2016), June 13-16, Zlatibor, Serbia [1]

558 Ž. JOVANOVIĆ, R. BAĈEVIĆ, R. MARKOVIĆ, S. RANĐIĆ, D. JANKOVIĆ
comfort and vehicle stability. Driver skills and driving style are also important. At the same
road and with the same vehicle, two different drivers could provide different comfort for
their passengers. Sharp turning, sudden braking, and accelerating are usually marked as
uncomfortable actions. Road conditions are probably the most important for the passenger’s
comfort and safety. They can be categorized as static and dynamic factors. Static factors are
commonly associated with a location, like road bumps and potholes. Dynamics factors
appear suddenly, like rain, snow, or landslides. Also, the impact of other traffic participants is
significant dynamic factor.
On the basis of the above facts it is evident that many factors affect the comfort. It is very
important to achieve as comfortable transportation as possible. Uncomfortable transportation
affects the mental and physical conditions of even healthy passengers. The impact on
passengers with the health problems is even greater since uncomfortable driving could impair
their medical condition.
Due to the discomfort location, as one of the most important information for assessing
the comfort of transport, the usage of Geographic Information Systems (GIS) is of great
importance. Nowadays, there are several commonly used GIS systems, e.g. OpenLayers,
ArcGIS, OpenStreetMaps, Geomedia, and GoogleMaps. Usability and the possibility of
integration into other application increase their popularity. The aforementioned GIS systems
are under constant development and new functionalities are implemented almost every day. Its
interactivity with the users in real time provides an increasing amount of information. The
dynamics of development and user interaction information can be seen in the example of
latest GoogleMaps GIS novelty. The route from point A to the point B is colored according to
the traffic jams detected on presented location. Information for appropriate road color marking
is gathered from numerous users of Google Maps navigation. As a basis for generating road maps of comfort, which are presented in this paper,
features of GoogleMaps GIS are used. The aim of the information system presented in this paper is to generate road comfort maps according to the information gathered from the users of the client Android application. Client Android application calculate comfort parameters based on the accelerometer and GPS data.
The paper is organized as follows. Related work is presented. Android application functionalities and implemented calculations for transport comfort are demonstrated. After that, functionalities and usage of the developed Web-based information system are demonstrated. At the end, overall information gathered by developed information system is presented.
2. RELATED WORK
In 1972, the International Organization for Standardization (ISO) issued a standard: "A Guide to the Evaluation of Human Exposure to Whole-Body Vibration" [2] which is still in general use. It is used for the evaluation of working conditions and exposure to the vibrations. The effect of vibration on health, at work, sitting, and other life situations is described in the paper [3]. Higher vibration exposure has negative health effects. For vehicles, transport comfort is most affected by tires, suspension, shock absorbers, seats, etc. The suspension system impact on the passenger's comfort on various types of roads is presented in papers [4-6]. It is presented that suspension system has great positive effects on comfort but can't eliminate it. Besides vibrations, the noise produced by tires may also affect passenger’s acoustic comfort as presented in [7].

Information System for Generating Road Comfort Maps 559
Gathering information from nodes to centralized unit is the trend nowadays. Wireless
sensor networks allow data collection and centralized processing, like in paper [8].
Sometimes it is called swarm intelligence [9].
The role of smartphones is increasing in this area of research. The reason lies in the
fact that smartphones equipped with sensors such as accelerometer, gyroscope, and GPS
are increasing their processing capabilities for better performances. Some phones have
processing power almost as classic computers. The paper [10] presented a system based on
mobile phones to detect potholes on the roads. The phones were placed in taxi vehicles and
recorded the locations of detected discomfort. For detection, only vertical (Z-axis) was used.
In the paper [11] smartphones are used to monitor conditions during transport. Potholes,
bumps, and siren sounds are detected.
Comfort calculations are usually based on the accelerometer signals processing.
Accelerometer detects dynamic movements and is also affected by the static gravity influence.
For appropriate dynamic calculations, it is necessary to eliminate the static gravity influence
from accelerometer signal values. This is usually done by some signal filter implementation.
The authors of [12, 14] developed the automotive real-time observers and attitude estimation
system, based on an extended Kalman filter (EKF). The authors of [15] used high-pass filter
for the road potholes detection.
Vibration duration exposure and interaxial influence need to be addressed. In [16]
authors didn’t observe any statistically significant differences in discomfort between the 10,
15 or 20-second vibration exposure. In [17] authors showed that single axis vertical
vibrations were typically associated with the less discomfort than multi-axis vibrations. Also,
different sensitivity for different axes is detected, for similar ranges of vibration. According to
these, the data from all axes need to be collected for appropriate comfort level classification.
Although the vertical axis is the most influential, the others cannot be ignored.
Artificial intelligence usage is increasing in this field of research. In [18] neural network
was used in order to analyze the quality of public transport. In [19] Bayesian network was
used for recognizing the mode of transport. For artificial intelligence implementation it is
necessary to collect a lot of data for its training.
Work presented in this paper is based on the Android applications, which development
and use are presented in the paper [20]. Measurement of comfort is realized by using values
obtained from the triaxial accelerometer that helps determining the level of passenger
comfort. In addition to the accelerometer, GPS is used for discomfort location detection.
Accelerometer signals are passed through High pass filter for the static gravity influence
elimination. It is set up to cut off 10% of low frequency signals. Decision time intervals is
set to 10s, and all three axes are used for comfort level classification. Developed information
system will be used to collect large number of information that could be used for artificial
intelligence implementation in the future fork.
3. INFORMATION SYSTEM ARCHITECTURE
Developed information system is realized in form of a client-server system. Client part is
realized as an Android application which measures comfort parameters during transportation.
Server part is realized in form of Java web application with Google Maps support for data
presentation. Block diagram of the developed client-server information system usage is
presented in Fig. 1.

560 Ž. JOVANOVIĆ, R. BAĈEVIĆ, R. MARKOVIĆ, S. RANĐIĆ, D. JANKOVIĆ
Fig. 1 Blog diagram of the developed information system usage
As presented, information gathered from all client users are stored into one database (in
server part of client-server system), which allows transportation and road comfort analysis.
With longer information system usage collected information will be of more significance
and more detailed analyses could be performed. Since smartphones are widely used
nowadays, there is a large number of potential users for the developed information system.
4. ANDROID APPLICATION – CLIENT APPLICATION
Android application is based on three-axis accelerometer data calculations in the standard
ten seconds time interval. The development of the main application functionalities was
presented in [20] using RxJava [21] for accelerometer calculations, GPS monitoring, and main
application thread. To classify transport comfort, it was necessary to determine the comfort
levels.
4.1. Comfort levels
ISO standard [2] is in general use for the comfort level determination. It assumes that
acceleration magnitude, frequency spectrum, and duration represent the principal exposure
variables, which account for the potentially harmful effects. At the national level (Serbia),
there is standard ICS 13.160 (SRPS ISO 2631-1:2014 Mechanical vibration and shock:
Evaluation of human exposure to whole-body vibration, Part 1: General requirements) which
is translated version of ISO standard [2]. In [2-3], authors have shown that the sensitivity
of the human body at different frequencies depends on the intensity of acceleration. The
Information System for Generating Road Comfort Maps 561
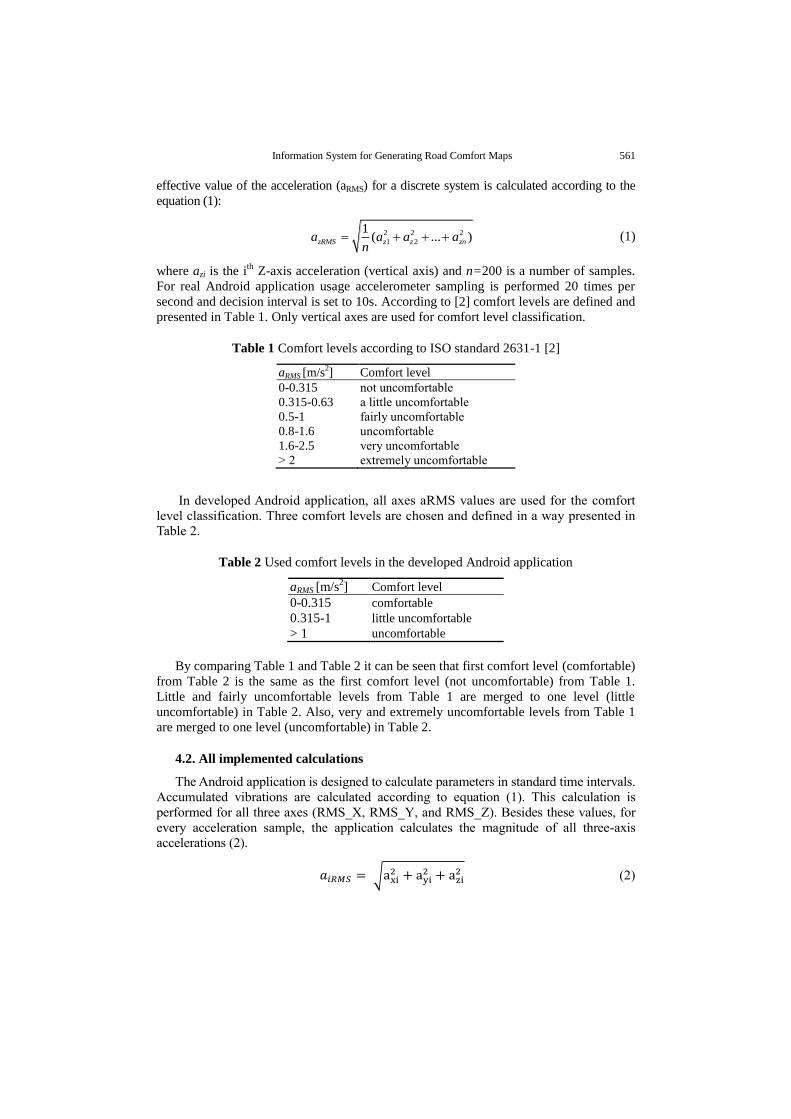
effective value of the acceleration (aRMS) for a discrete system is calculated according to the
equation (1):
2 2 2
1 2
1( ... )zRMS z z zna a a a
n (1)
where azi is the ith
Z-axis acceleration (vertical axis) and n=200 is a number of samples.
For real Android application usage accelerometer sampling is performed 20 times per
second and decision interval is set to 10s. According to [2] comfort levels are defined and
presented in Table 1. Only vertical axes are used for comfort level classification.
Table 1 Comfort levels according to ISO standard 2631-1 [2]
aRMS [m/s2] Comfort level
0-0.315 not uncomfortable
0.315-0.63 a little uncomfortable
0.5-1 fairly uncomfortable
0.8-1.6 uncomfortable
1.6-2.5 very uncomfortable
> 2 extremely uncomfortable
In developed Android application, all axes aRMS values are used for the comfort
level classification. Three comfort levels are chosen and defined in a way presented in
Table 2.
Table 2 Used comfort levels in the developed Android application
aRMS [m/s2] Comfort level
0-0.315 comfortable
0.315-1 little uncomfortable
> 1 uncomfortable
By comparing Table 1 and Table 2 it can be seen that first comfort level (comfortable)
from Table 2 is the same as the first comfort level (not uncomfortable) from Table 1.
Little and fairly uncomfortable levels from Table 1 are merged to one level (little
uncomfortable) in Table 2. Also, very and extremely uncomfortable levels from Table 1
are merged to one level (uncomfortable) in Table 2.
4.2. All implemented calculations
The Android application is designed to calculate parameters in standard time intervals.
Accumulated vibrations are calculated according to equation (1). This calculation is
performed for all three axes (RMS_X, RMS_Y, and RMS_Z). Besides these values, for
every acceleration sample, the application calculates the magnitude of all three-axis
accelerations (2).
𝑎 = √a + a
+ a (2)
562 Ž. JOVANOVIĆ, R. BAĈEVIĆ, R. MARKOVIĆ, S. RANĐIĆ, D. JANKOVIĆ
where axi, ayi, azi are X-, Y-, and Z-axis acceleration in the i-th sample, and aiRMS is the
magnitude of all three-axis accelerations. According to these, aRMS for the decision time
interval is calculated according to equation (3).
𝑎 = √
∗ (a
+ a + ⋯ + a
) (3)
where aiRMS is the ith magnitude of all three-axis accelerations, and n is the number of samples.
For the most uncomfortable sample, maximum magnitude values (APEAK) and their
three-axis values (APEAK_X, APEAK_Y, and APEAK_Z) are calculated. For detected
APEAK the GPS data (latitude, longitude, speed, and time) are stored. Beside these, all
three-axis maximum accelerations (MAX_X, MAX_Y, and MAX_Z) are calculated. As a
result of the decision time interval calculations, the following values are saved:
IDT: location marker ID
RMS_X: X-axis calculation according to equation (1)
RMS_Y: Y-axis calculation according to equation (1)
RMS_Z: Z-axis calculation according to equation (1)
ARMS: acceleration magnitude according to equation (3)
APEAK: acceleration magnitude maximum value in the values calculated by
equation (2)
APEAK_X: X-axis acceleration value in APEAK
APEAK_Y: Y-axis acceleration value in APEAK
APEAK_Z: Z-axis acceleration value in APEAK
LATITUDE: GPS data for APEAK
LONGITUDE: GPS data for APEAK
TIME: GPS data for APEAK
SPEED: GPS data for APEAK
MAX_X: X-axis real value where absolute maximum X-axis value is detected
MAX_Y: Y-axis real value where absolute maximum Y-axis value is detected
MAX_Z: Z-axis real value where absolute maximum Z-axis value is detected
COMFORT: (0=comfortable; 1=a little uncomfortable; 2=uncomfortable)
4.3. File formats
Developed Android application on a used mobile device saves the final result in files.
Measurement data are located in the file name separated by the symbols "--" (two
hyphens). These are: the time when the measurement is taken, title and description of the
measurement, a unique user ID, and measurement ID. Below is the example of the file
name format.
// format
date--title--description--userID—measurementID.txt
// example
2016-04-02-09-02-52--transport—mladenovac to belgrade--13--183.txt
The data that need to be stored in the database are also separated with "--" symbols.
Each file row data presents calculated data for one decision interval. File row data order
needs to be the same as the column order in a database for a successful insert. As a row

Information System for Generating Road Comfort Maps 563
delimiter, symbol ";" is used. Below is the example of file row data format and a sample
data row.
// format
measurementID -- userID --rmsX--rmsY---rmsZ--aRms--aPeakX--aPeakY--
aPeakZ--aPeak--latitude--longitude--time--speed--maxX--maxY--maxZ--
description;
// example
183--13--0.0627--0.033--0.0917--0.1159--0.4161---0.0571--0.0059--0.42--
44.4534864--20.6799459--2016-04-02-09-03-01--0--0.4161---0.2515--0.295--
merenje;
5. WEB APPLICATION FOR CENTRALIZED DATA PROCESSING – SERVER APPLICATION
The server part of the developed client-server information system (VibroMap) is
realized as Java Web application. It is developed as multilayer application in the Model
View Controller (MVC) architecture. For data presentation, the View part of the MVC,
Java Server Pages (JSP) is used. The Controller part is developed using Servlets, while
the Model is based on Java beans and the Data Access Object (DAO) classes for
communication with the MySQL database.
Developed information system allows to its users to preview and analyze saved
transportations (created by the developed client Android application) in a GIS form.
The server part of a client-server information system has two types of users,
registered users and administrators. VibroMap registered user functionalities are
presented by the use-case diagram shown in Fig. 2.
Fig. 2 The VibroMap use-case diagram
After the registration and successful login, the registered user can upload the created
measurements, preview them in GIS or chart form, and also delete them. List of measurement
564 Ž. JOVANOVIĆ, R. BAĈEVIĆ, R. MARKOVIĆ, S. RANĐIĆ, D. JANKOVIĆ
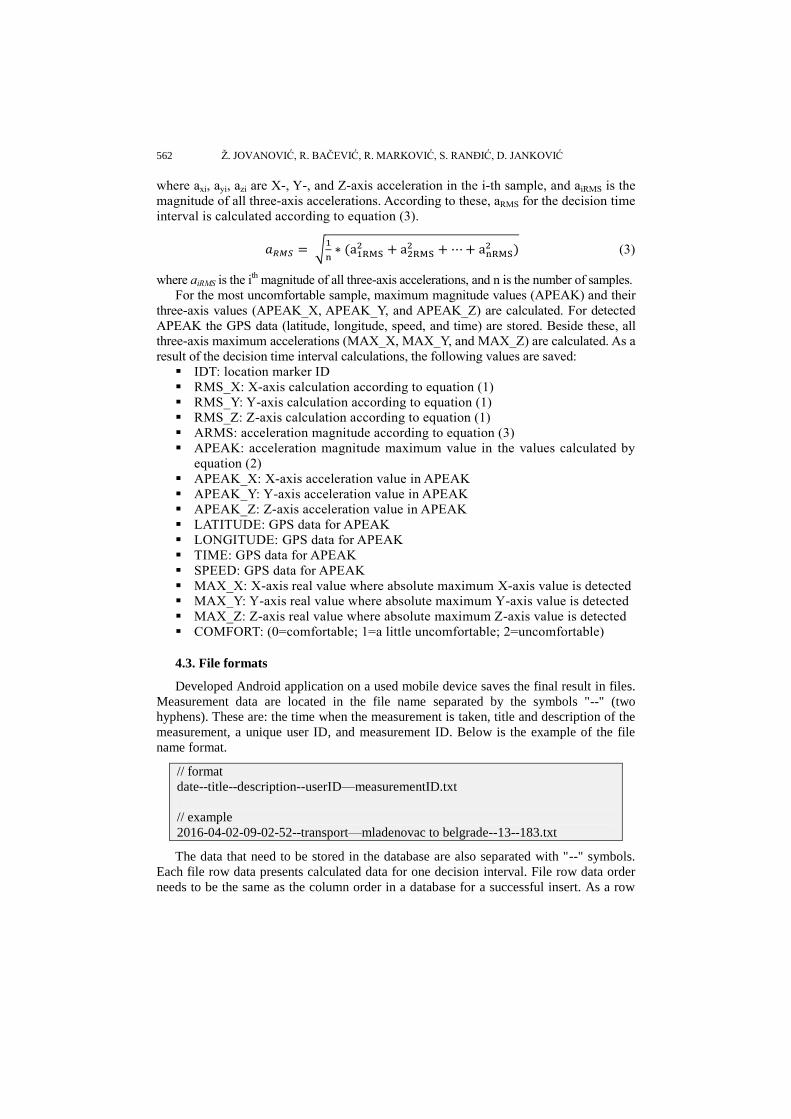
can be presented by date (today or dates in between). Main functionality is the measurement
upload. The Measurement upload algorithm is presented in Fig. 3.
Fig. 3 The measurement upload algorithm
Successfully created files with developed Android application can be uploaded to the VibroMap by the registered users by choosing the measurement upload functionality. The

Information System for Generating Road Comfort Maps 565
Choose file window will appear and the created file needs to be selected. Selected file is sent to the controller part of VibroMap to the Servlet called ServletUploadFile. It creates a temporary file with uploaded file and checks its name format and content format. After a successful check, an existence of the saved file’s measurementID in the database is performed. If the ID doesn't exist, the file data are stored in the database. If the ID exists, then the rows numbers in the file and the database (rows with uploaded measurementIDs) are compared. If the file rows number is higher than the database rows number, then the database rows are deleted. This functionality is implemented for the future work in real time Android application data upload because the internet connectivity loss could lead to incomplete data recording to the database. After successful upload the data are presented in GIS format using Google Maps. Every file row is presented with an appropriate marker on the map. In a case of error in any of the presented validations, an appropriate error message is displayed and data upload is canceled. Copying the data from the file into the database is performed by the SQL query in the following format.
LOAD DATA LOCAL INFILE file_location INTO TABLE table_name FIELDS
TERMINATED BY '--' LINES TERMINATED BY ';' (column names,…);
File data are first stored in the temporary table. Then, dependending on the marker
type, data are copied to appropriate table (marker or analysis). After a successful copy,
the uploaded file and the temporary data are deleted. Beside registered users’ type, VibroMap has administrator user type. It can preview
data of all registered users and generate overall road comfort map which is the most important functionality presented in this paper. This functionality is realized using GoogleMaps GIS. The Google provided GoogleMaps API in June 2005 which allowed its integration into third party applications. The integration is performed by client-side scripting using JavaScript and AJAX. As default map center, latitude and longitude of the city of Ĉaĉak, Serbia, are chosen, with zoom value of 8. This location is chosen since most of the measurements are conducted in its surrounding. To take advantage of GIS, data with location parameters like latitude and longitude need to be passed to the map. These data are usually stored in a server side application database. GoogleMaps API is realized using client side language (JavaScript). The server side Java programming language functionalities are included to perform database queries. By combining server-side Java programming language and client-side JavaScript programming language, the appropriate data arrays for GIS presentation are created. Every array member is presented by one marker on the map. As additional functionality, the actions could be added to the markers by defining the appropriate marker listener using google.maps.event.addListener function. This enables info window preview for the marker click action. All calculated data for the clicked location are presented.
5. PRESENTATION OF THE USAGE SCENARIO OF THE DEVELOPED INFORMATION SYSTEM
With every uploaded measurement to the Web application, new data about transportation
comfort are stored in the database. Road comfort map becomes more complete and more
comprehensive. The presented system is in usage since December 2015. First upload was on
December 7, with measurement created on relation Ĉaĉak-Užice. Until competition of this
paper, 38 successful file uploads were performed. Fig. 4 presents all collected data (zoomed-
out).

566 Ž. JOVANOVIĆ, R. BAĈEVIĆ, R. MARKOVIĆ, S. RANĐIĆ, D. JANKOVIĆ
Fig. 4 The complete road comfort map (zoomed-out)
The presented information system is mostly developed on Faculty of technical
sciences in Ĉaĉak. Therefore, most of the measurements were conducted from the city of
Ĉaĉak, Serbia, to the other cities. At this stage, comfort map could be analyzed on several
destinations: Ĉaĉak-Užice, Ĉaĉak-Beograd, Ĉaĉak-Kraljevo, Ĉaĉak-Kragujevac, and the
part of Mladenovac-Beograd destination. On the zoomed-out map it is not easy to detect
the comfort value (marker color) for certain location. Since the map is interactive, it
could be zoomed into the desired location for a detailed preview. The road comfort map
of Ĉaĉak main roads is presented in Fig. 5.
Fig. 5 The road comfort map, city of Ĉaĉak, Serbia
Since the developed Android application is most widely used for intercity relations,
only the main roads are marked. The marker color presents first level of information for
measured comfort level:

Information System for Generating Road Comfort Maps 567
green - comfortable interval,
yellow - semi-uncomfortable interval,
red – uncomfortable interval.
Every presented marker contains information for ten seconds driving interval around its
location. Marker location is a location with highest detected discomfort value (max
Apeak) in ten seconds comfort decision interval. Detailed information (second level of
information) are presented by click on the desired marker in the info window form. This
is shown in Fig. 6.
Fig. 6 The preview of all calculated data for the desired location, presented
by clicking on the desired marker in the info window form
As presented in Fig. 6, besides GPS data (latitude, longitude, time, and speed) all
calculated parameters over accelerometer signals are displayed. Thanks to these, it is
possible to provide additional analyses about comfort, or the discomfort cause.
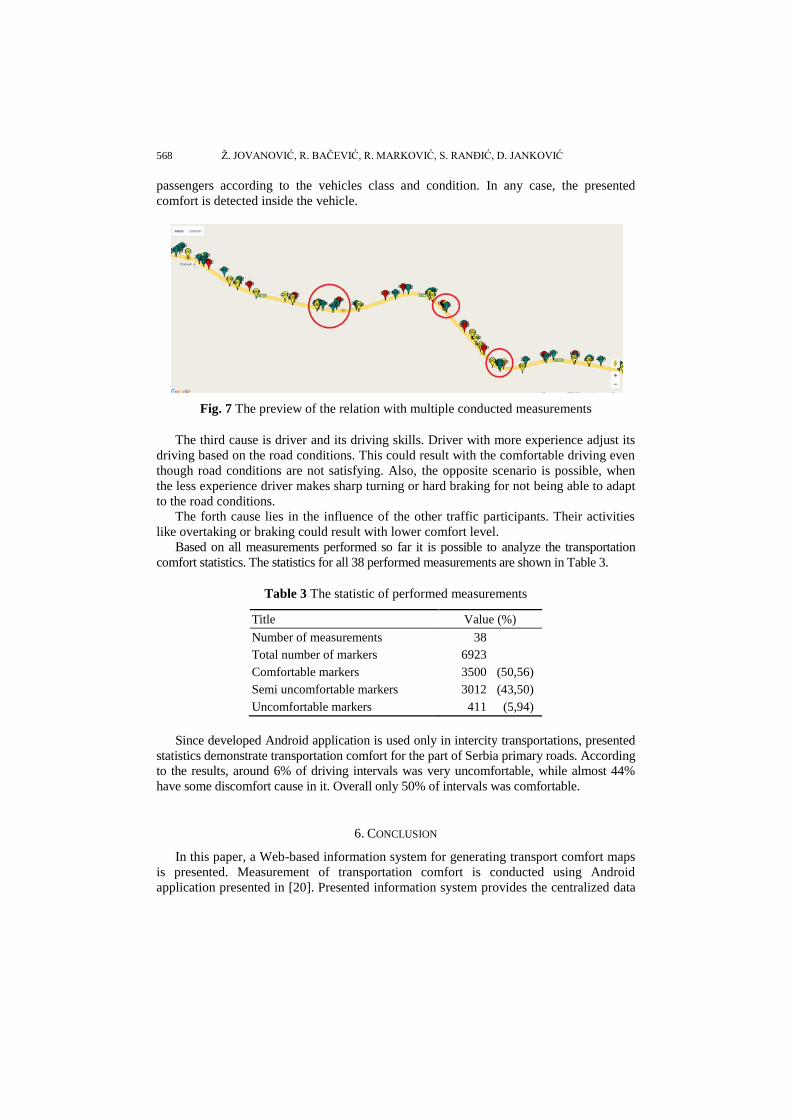
By increasing the number of the uploaded measurements, the map becomes more
complete and provides more information. It is important to mention that some relations
are measured only once while some have several conducted measurements. The Fig. 7
presents the part of the relation Ĉaĉak-Beograd which is measured three times.
By analyzing the Fig. 7, it can be seen that some locations from different measurements
are marked with the different color markers, and some with the same color markers. In the
case of the same color markers, every measurement detected the same comfort level. In the
case of different color markers, detected comfort level from different measurements differed.
There are several causes for this situation.
The first cause is the elapsed time between measurements. It is possible that a location
that was comfortable in the meantime had a problem (the appearance of potholes, bumps,
landslides ...) and that in the next measurement became uncomfortable. Also, it is
possible that the uncomfortable location is repaired in the meantime by the road
maintenance department and therefore become comfortable.
The second cause lies in the variety of vehicles that are used for the measurement. To
be precise, on the same road different vehicles have different comfort levels for their
568 Ž. JOVANOVIĆ, R. BAĈEVIĆ, R. MARKOVIĆ, S. RANĐIĆ, D. JANKOVIĆ
passengers according to the vehicles class and condition. In any case, the presented
comfort is detected inside the vehicle.
Fig. 7 The preview of the relation with multiple conducted measurements
The third cause is driver and its driving skills. Driver with more experience adjust its
driving based on the road conditions. This could result with the comfortable driving even
though road conditions are not satisfying. Also, the opposite scenario is possible, when
the less experience driver makes sharp turning or hard braking for not being able to adapt
to the road conditions.
The forth cause lies in the influence of the other traffic participants. Their activities
like overtaking or braking could result with lower comfort level.
Based on all measurements performed so far it is possible to analyze the transportation
comfort statistics. The statistics for all 38 performed measurements are shown in Table 3.
Table 3 The statistic of performed measurements
Title Value (%)
Number of measurements 38
Total number of markers 6923
Comfortable markers 3500 (50,56)
Semi uncomfortable markers 3012 (43,50)
Uncomfortable markers 411 (5,94)
Since developed Android application is used only in intercity transportations, presented
statistics demonstrate transportation comfort for the part of Serbia primary roads. According
to the results, around 6% of driving intervals was very uncomfortable, while almost 44%
have some discomfort cause in it. Overall only 50% of intervals was comfortable.
6. CONCLUSION
In this paper, a Web-based information system for generating transport comfort maps
is presented. Measurement of transportation comfort is conducted using Android
application presented in [20]. Presented information system provides the centralized data

Information System for Generating Road Comfort Maps 569
functionalities and GIS preview in the form of interactive GoogleMaps. The advantages
of presented information system are the Web-based approach, whereby the data are
available to all users of the system worldwide. Information that the system can provide
can be of great importance when choosing the route for the next transportations. If some
of the already recorded paths are going to be used, reviewing the routes previous
transportations before setting off on the trip can provide information about expected road
conditions. The implementation of GoogleMaps API enables an efficient and interactive
display of the measured data. The benefits of the developed information system are
increasing with every newly conducted measurement.
As a future work some improvements are planned. The first one is a grouping of close
markers into a cluster of markers and providing one overall piece of information based on
all gathered markers data. This would provide road comfort information based on all
conducted transportations in the presented location. The second one is the communication
between client Android application and the server part of the information system.
Detected comfort values using Android application could be transferred to the developed
information system in real time. This would allow an insight into the current status of
each vehicle with an active Android app in real time. The third one is implementation of
artificial intelligence in comfort level recognition where the collected data would be used
for its training.
Acknowledgment: The work presented in this paper was funded by grant no. TR32043 for the
period 2011-2016 from the Ministry of Education and Science of the Republic of Serbia.
REFERENCES
[1] Z. Jovanovic, R. Bacevic, R. Markovic, S. Randjic and D. Jankovic, "Information system for generating
road comfort maps", In Proceedings of the 60th International Conference ETRAN, Zlatibor, Serbia, 2016, RT 5.6.
[2] ISO 2631-1:1997 - Mechanical vibration and shock -- Evaluation of human exposure to whole-body
vibration -- Part 1: General requirements [3] M. J. Griffin, Handbook of Human Vibration, Elsevier, 1996.
[4] F. Yi and S. Zhang, "Ride Comfort Simulation under Random Road Based on Multi-Body Dynamics", In
3rd International Workshop on Intelligent Systems and Applications, IEEE, 2011, pp. 1–3. [5] J. Sun and Q. Yang, "Advanced suspension systems for improving vehicle comfort", In Proceedings of
the International Conference on Automation and Logistics, IEEE, 2009, pp. 1264–1267.
[6] S.A. Abu Bakar, P.M. Samin and A.A. Azhar, "Modelling and Validation of Vehicle Ride Comfort Model", Applied Mechanics and Materials, vol. 554, pp. 515–519, 2014.
[7] J. Ahmad Kadri, W.M. Wan Zuki Azman, M.N. Zulkifli, M.J.M. Nor, A. Kamal Ariffin and M. Hosseini
Fouladi, "A study on the effects of tyre to vehicle acoustical comfort in passenger car cabin", In Proceedings of the 3rd International Conference on Computer Research and Development, IEEE, 2011, pp. 342–345.
[8] Nikolic, N. Neskovic, R. Antic and A. Anastasijevic, "Industrial wireless sensor networks as a tool for
remote on-line management of power transformers’ heating and cooling process", Facta Universitatis, Series: Electronics and Energetics, vol. 30, no. 1, pp: 107–119, 2017.
[9] F. Elfouly, R. Ramadan, M. Mahmoud and M. Dessouky, "Swarm intelligence based reliable and energy
balance routing algorithm for wireless sensor network", Facta Universitatis, Series: Electronics and Energetics, vol. 29, no. 3, pp. 339-355, 2016.
[10] Mednis, G. Strazdins, R. Zviedris, G. Kanonirs and L. Selavo, "Real time pothole detection using Android
smartphones with accelerometers", In Proceedings of the International Conference on Distributed Computing in Sensor Systems and Workshop, DCOSS’11, 2011.
570 Ž. JOVANOVIĆ, R. BAĈEVIĆ, R. MARKOVIĆ, S. RANĐIĆ, D. JANKOVIĆ
[11] P. Mohan, V.N. Padmanabhan and R. Ramjee, "TrafficSense : Rich Monitoring of Road and Traffic
Conditions using Mobile Smartphones", In Proceedings of the 6th ACM conference on Embedded network sensor systems, ACM 2008, pp. 323-336.
[12] J. Cuadrado, D. Dopico, J. Perez, et al., "Automotive observers based on multibody models and the
extended Kalman filter", Multibody System Dynamics, vol. 27, no. 1, pp. 3-19, 2012. [13] J. Lee, E. Park, S. Robinovitch, "Estimation of Attitude and External Acceleration Using Inertial Sensor
Measurement During Various Dynamic Conditions", IEEE Transactions on Instrumentation and
Measurement, vol. 61, no. 8, pp. 2262-2273, 2012. [14] J. Blanco-Claraco, J. Torres-Moreno, A. Giménez-Fernández, "Multibody dynamic systems as Bayesian
networks: Applications to robust state estimation of mechanisms", Multibody System Dynamics, vol. 34,
no. 2, pp. 103-128, 2015. [15] J. Eriksson, L. Girod, B. Hull, R. Newton, S. Madden and F. Balakrishnan, "The Pothole Patrol: Using a
Mobile Sensor Network for Road Surface Monitoring", In Proceedings of the 6th International
Conference on Mobile System, Applications and Services, 2008, pp. 29-39. [16] J. Dickey, M. Oliver, P. Boileau, T. Eger, L. Trick and A. Edwards, "Multi-axis sinusoidal whole-body
vibrations: Part I - How long should the vibration and rest exposures be for reliable discomfort measures?",
Journal of Low frequency noise, vibration and active control, vol. 25, no. 3, pp. 175-184, 2006. [17] J. Dickey, T. Eger, M. Oliver, P. Boileau, L. Trick and A. Edwards, "Multi-axis sinusoidal whole-body
vibrations: Part ll - Relationship between Vibration Total Value and discomfort varies between vibration
axes", Journal of Low frequency noise, vibration and active control, vol. 26, no. 3, pp. 195-204, 2009. [18] C. Garrido, R. De Oña, J. De Oña, "Neural networks for analyzing service quality in public transportation",
Expert Systems with Applications, vol. 41, no. 15, pp. 6830-6838, 2014.
[19] G. Xiao, Z. Juan, C. Zhang, "Travel mode detection based on GPS track data and Bayesian networks", Computers, Environment and Urban Systems, vol. 54, pp. 14-22, 2015.
[20] Z. Jovanovic, R. Bacevic, R. Markovic, S. Randjic, "Android application for observing data streams from
built-in sensors using RxJava", In Proceedings of the 23rd Telecommunition Forum Telfor, IEEE, 2015, pp. 918–921.
[21] ReactiveX, (n.d.). http://reactivex.io/ (accessed October 5, 2015).