information referred to in item 402(a)(8) of regulation …
TRANSCRIPT

1 SECURITIES AND EXCHANGE COMMISSION WASHINGTON, D.C. 20549 FORM 10-K ANNUAL REPORT PURSUANT TO SECTION 13 OR 15(d) OF THE SECURITIES EXCHANGE ACT OF 1934 (Mark One) [X] Annual report pursuant to section 13 or 15(d) of the Securities Exchange Act of 1934 For the fiscal year ended December 31, 1995 OR [ ] Transition report pursuant to Section 13 or 15(d) of the Securities Exchange Act of 1934 or the transaction period from to ---------------------- ---------------------- PNC BANK CORP. (Exact name of registrant as specified in its charter) PENNSYLVANIA 25-1435979 (State or other jurisdiction of (I.R.S. Employer incorporation or organization) Identification No.) ONE PNC PLAZA 249 FIFTH AVENUE PITTSBURGH, PENNSYLVANIA 15222-2707 (Address of principal executive offices) (Zip Code) REGISTRANT'S TELEPHONE NUMBER, INCLUDING AREA CODE - (412) 762-1553 SECURITIES REGISTERED PURSUANT TO SECTION 12(b) OF THE ACT Name of Each Exchange Title of Each Class on Which Registered ------------------- ------------------- Common Stock, par value $5.00 New York Stock Exchange $1.60 Cumulative Convertible Preferred Stock - Series C, par value $1.00 New York Stock Exchange $1.80 Cumulative Convertible Preferred Stock - Series D, par value $1.00 New York Stock Exchange SECURITIES REGISTERED PURSUANT TO SECTION 12(g) OF THE ACT $1.80 Cumulative Convertible Preferred Stock - Series A, par value $1.00 $1.80 Cumulative Convertible Preferred Stock - Series B, par value $1.00 8.25% Convertible Subordinated Debentures Due 2008 8.1/4% Convertible Subordinated Debentures Due 2010 9.875% Subordinated Capital Notes Due 1999 INDICATE BY CHECK MARK WHETHER THE REGISTRANT (1) HAS FILED ALL REPORTS REQUIRED TO BE FILED BY SECTION 13 OR 15(d) OF THE SECURITIES EXCHANGE ACT OF 1934 DURING THE PRECEDING 12 MONTHS (OR FOR SUCH SHORTER PERIOD THAT THE REGISTRANT WAS REQUIRED TO FILE SUCH REPORTS), AND (2) HAS BEEN SUBJECT TO SUCH FILING REQUIREMENTS FOR THE PAST 90 DAYS. YES X NO --- --- INDICATE BY CHECK MARK IF THE DISCLOSURE OF DELINQUENT FILERS PURSUANT TO ITEM 405 OF REGULATION S-K IS NOT CONTAINED HEREIN, AND WILL NOT BE CONTAINED, TO THE BEST OF REGISTRANT'S KNOWLEDGE, IN DEFINITIVE PROXY OR INFORMATION STATEMENTS INCORPORATED BY REFERENCE IN PART III OF THIS FORM 10-K. [ ] THE AGGREGATE MARKET VALUE OF THE VOTING STOCK HELD BY NON-AFFILIATES OF THE REGISTRANT AMOUNTED TO APPROXIMATELY $9.85 BILLION AT FEBRUARY 29, 1996. NUMBER OF SHARES OF REGISTRANT'S COMMON STOCK OUTSTANDING AT FEBRUARY 29, 1996: 341,535,524 DOCUMENTS INCORPORATED BY REFERENCE PORTIONS OF PNC BANK CORP.'S ANNUAL REPORT TO SHAREHOLDERS FOR THE YEAR ENDED DECEMBER 31, 1995 ("ANNUAL REPORT TO SHAREHOLDERS") ARE INCORPORATED BY REFERENCE INTO PARTS I AND II AND PORTIONS OF THE DEFINITIVE PROXY STATEMENT OF PNC BANK CORP. FOR THE ANNUAL MEETING OF SHAREHOLDERS TO BE HELD ON APRIL 23, 1996 ("PROXY STATEMENT") ARE INCORPORATED BY REFERENCE INTO PART III OF THIS FORM 10-K. THE INCORPORATION BY REFERENCE HEREIN OF PORTIONS OF THE PROXY STATEMENT SHALL NOT BE DEEMED TO SPECIFICALLY INCORPORATE BY REFERENCE THE INFORMATION REFERRED TO IN ITEM 402(a)(8) OF REGULATION S-K.

2 INDEX PART I PAGE Item 1 Business 1 Item 2 Properties 11 Item 3 Legal Proceedings 11 Item 4 Submission of Matters to a Vote of Security Holders 12 PART II Item 5 Market for Registrant's Common Equity and Related Stockholder Matters 13 Item 6 Selected Financial Data 13 Item 7 Management's Discussion and Analysis of Financial Condition and Results of Operations 13 Item 8 Financial Statements and Supplementary Data 13 Item 9 Changes in and Disagreements with Accountants on Accounting and Financial Disclosure * PART III Item 10 Directors and Executive Officers of the Registrant 13 Item 11 Executive Compensation 14 Item 12 Security Ownership of Certain Beneficial Owners and Management 14 Item 13 Certain Relationships and Related Transactions 14 PART IV Item 14 Exhibits, Financial Statement Schedules and Reports on Form 8-K 14 SIGNATURES 15 EXHIBIT INDEX 18 * Not Applicable. i

3 PART I ITEM 1 - BUSINESS BUSINESS OVERVIEW Introduction PNC Bank Corp. ("PNC Bank" or "Corporation") is a bank holding company registered under the Bank Holding Company Act of 1956, as amended ("BHC Act"). PNC Bank was incorporated under the laws of the Commonwealth of Pennsylvania in 1983 with the consolidation of Pittsburgh National Corporation and Provident National Corporation. Since 1983, PNC Bank has diversified its geographical presence and product capabilities through strategic bank and nonbank acquisitions and the formation of various nonbanking subsidiaries. At December 31, 1995, the Corporation operated banking subsidiaries in Pennsylvania, Delaware, Florida, Indiana, Kentucky, Massachusetts, New Jersey and Ohio, and conducted nonbanking operations throughout the United States. The Corporation's major businesses include consumer banking, corporate banking, real estate banking, mortgage banking and asset management. At December 31, 1995, the Corporation's consolidated total assets, deposits and shareholders' equity were $73.4 billion, $46.9 billion and $5.8 billion, respectively. Based on total assets, PNC Bank was the 12th largest bank holding company in the United States at December 31, 1995. During 1995, the Corporation and subsidiaries employed approximately 25,400 persons on a full-time equivalent basis. Effective December 31, 1995, Midlantic Corporation ("Midlantic"), a regional bank holding company headquartered in Edison, New Jersey, merged with and into PNC Bancorp, Inc., a wholly-owned subsidiary of the Corporation. Approximately 112 million shares of the Corporation's common stock were issued in connection with the merger. At closing, Midlantic had consolidated total assets, deposits and shareholders' equity of $13.6 billion, $11.0 billion and $1.4 billion, respectively, and 308 branch offices in New Jersey and Pennsylvania. The transaction was accounted for as a pooling of interests, and accordingly, all financial information has been restated as if the entities were combined for all periods presented. Midlantic Bank, N.A., Midlantic's principal subsidiary, will continue to operate under its present name until integration and consolidation plans are fully implemented in the third quarter of 1996. At that time, it is expected that Midlantic Bank, N.A. will be merged or otherwise combined with PNC Bank, National Association, a wholly-owned subsidiary of the Corporation. The in-market nature of the Midlantic transaction is expected to generate substantial economies by reducing costs associated with overlapping and duplicative operations and provide opportunities to enhance revenues through marketing of the Corporation's products and services to a new customer base. The extent and timing of cost savings and revenue enhancements are dependent on various factors, some of which are beyond the control of the Corporation. Such factors include conversion strategies, customer attrition and competitive responses. Therefore, no assurances can be given with respect to the ultimate level of cost savings and revenue enhancements to be realized, or that such amounts will be realized in the time frame initially anticipated. Certain other merger and acquisition activities of the Corporation are summarized under the section entitled "Mergers and Acquisitions" in the "Corporate Financial Review" and in "Note 2 - Mergers and Acquisitions" of the "Notes to Consolidated Financial Statements" included on pages 23 and 53, respectively, of the Annual Report to Shareholders, which discussion is incorporated herein by reference. LINES OF BUSINESS PNC Bank delivers a broad range of financial services and products to its customers through five lines of business: Consumer Banking, Corporate Banking, Real Estate Banking, Mortgage Banking and Asset Management. Additional information relating to the lines of business is set forth under the caption entitled "Line of Business Results" in the "Corporate Financial Review" included on pages 35 through 39 of the Annual Report to Shareholders, which is incorporated herein by reference. 1

4 CONSUMER BANKING Consumer Banking provides lending, deposit, personal trust, brokerage, investment, payment system access and other financial services to individuals and small businesses. Consumer Banking serves more than 3.2 million households and 135,000 small businesses, with an average loan portfolio exceeding $15.4 billion and more than $34.2 billion in average deposits. The principal focus of Consumer Banking is on providing products and services sought by its customers in a cost-effective manner. In 1995, Consumer Banking reorganized its delivery channels around customer segments. The "Private Bank" serves affluent customers. The "Community Bank" serves traditional retail customers through its "Branch Bank", entrepreneurs, community businesses, institutions and nonprofit organizations through its "Business Bank" and customers who prefer alternative delivery systems through the "Direct Bank". Consumer Banking's services are provided through approximately 950 community banking offices located in the Corporation's primary markets. In addition, services are provided through alternative delivery systems, such as the Corporation's telebanking center and automated teller machines ("ATMs"), and regional banking centers which offer a wide array of products at each center. Alternative delivery systems, such as the telebanking center, are expected to allow the Corporation to provide products and services more efficiently than traditional banking delivery systems. The Corporation continues to invest in operating platforms and alternative retail delivery systems, such as The National Financial Services Center, its Pittsburgh-based telebanking center, and to consolidate its retail branches. The Corporation also continues to evaluate strategic alliances to leverage its delivery capabilities. During 1995, the Corporation entered into agreements with third parties to provide certain administrative, marketing, data processing, customer support and related services for the Corporation's credit card and merchant services businesses. In addition, an agreement with the American Automobile Association announced in February 1996 is designed to offer the Corporation's products and services nationally to the organization's more than 34 million members through the Corporation's alternative delivery capabilities. CORPORATE BANKING Corporate Banking provides traditional and asset-based financing, liquidity and treasury management, corporate and employee benefit trust, capital markets, direct investment, leasing and other financial services to businesses and governmental entities. Corporate Banking serves businesses with annual revenues of $5 million or more, including specialized industries such as communications, health care, natural resources, metals, public finance, financial services and automobile dealer finance. In addition to serving customers within its primary markets, Corporate Banking has offices in several major United States cities to reach the national market. Corporate Banking's focus is on developing and delivering specific products and services to build and enhance client relationships. This line of business has one of the largest market share positions of middle-market companies located in the Corporation's primary markets. In addition, Corporate Banking maintains banking relationships with many of the largest companies in the United States and is a major provider of treasury management products and services to large corporate customers. REAL ESTATE BANKING Real Estate Banking provides lending, deposit, treasury management, syndication, commercial mortgage-backed securitizations and other non-credit services to customers that manage and develop commercial and residential real estate properties and facilities. In 1995, Real Estate Banking focused on expanding its customer base and product line. Its customers include developers, builders, investors, mortgage bankers, property managers and institutions. In 1995, Real Estate Banking formed a joint venture with a leading commercial mortgage banker to provide its customers with better access to institutional debt and equity markets and introduced a commercial mortgage-backed securitization product as a real estate financing alternative. It also formed a team to serve the real estate needs of the Corporation's treasury management customers. In 1996, Real Estate Banking will further emphasize its securitization capabilities and expand private debt/equity placement opportunities. MORTGAGE BANKING Mortgage Banking activities include acquisition, origination, securitization and servicing of residential mortgages, as well as retention of selected loans in the portfolio. Mortgage loans are originated through PNC Bank's branch network and PNC Mortgage's network of 85 origination offices in 29 states and nationally by telephone through its National Mortgage Center. At December 31, 1995, PNC Mortgage was the nation's 13th largest retail mortgage originator and 17th largest mortgage servicer. At such date, PNC Mortgage's servicing portfolio totaled $37.3 billion, including $25.1 billion serviced for others. PNC Mortgage intends to continue to develop new ways, using technology and multiple distribution channels, to deliver mortgage loans and financial services to meet the needs of its customers in the intensely competitive environment in which it operates. 2

5 ASSET MANAGEMENT Asset Management provides trust and mutual fund products and services including investment management, strategy, research and asset servicing. In 1995, the Corporation acquired BlackRock Financial Management, L.P. ("BlackRock") to expand its asset management service capabilities. At December 31, 1995, PNC Bank ranked as one of the top 20 investment managers in the United States. PNC Asset Management had discretionary authority over $96 billion in assets and over $282 billion in assets under administration. It is the second largest bank manager of mutual funds and one of the largest mutual fund service providers. It manages or acts as sub-advisor to 94 mutual funds with assets of $42 billion and provides custody services for mutual funds with $130 billion in assets. PNC Bank also provides accounting and administrative services for funds with over $100 billion in assets, transfer and shareholder services for approximately 3.5 million mutual fund shareholder accounts and investment research services to more than 250 financial institutions. In 1996, the Corporation consolidated the PNC Funds, Midlantic's Compass Funds and BlackRock's open-end mutual funds into one $10 billion fund family with a portfolio of 28 mutual funds to facilitate broader distribution capabilities and attract more customers. Most recently, the Corporation established CastleInternational Asset Management Inc., an international investment company in Edinburgh, Scotland, to expand international equity money management capabilities. SUBSIDIARY BANKS While the Corporation manages its businesses on a line-of-business basis, its corporate legal structure currently consists of 10 bank subsidiaries and over 150 active nonbank subsidiaries. Selected information as of December 31, 1995, for the Corporation's banks is set forth below. - --------------------------------------------------------------------------- Dollars in billions PERCENTAGE TOTAL OF TOTAL SUBSIDIARY BANK/HEADQUARTERS ASSETS ASSETS - --------------------------------------------------------------------------- PNC Bank, National Association, Pittsburgh, PA $41.9 57% Midlantic Bank, National Association, Edison, NJ 13.6 18 PNC Bank, Kentucky, Inc., Louisville, KY 5.0 7 PNC Bank, Ohio, National Association, Cincinnati, OH 4.0 5 PNC Mortgage Bank, National Association, Pittsburgh, PA 3.2 4 PNC Bank, Delaware, Wilmington, DE 2.5 3 PNC Bank, New England, Boston, MA 1.3 2 PNC National Bank, Wilmington, DE .9 1 PNC Bank, Indiana, Inc., New Albany, IN .5 1 PNC Bank, FSB, Vero Beach, FL .1 - - --------------------------------------------------------------------------- 3

6 STATISTICAL DISCLOSURES BY BANK HOLDING COMPANIES The "Statistical Information" contained on pages 73 through 81 of the Annual Report to Shareholders is incorporated herein by reference. RISK MANAGEMENT In the normal course of business, the Corporation is subject to various risks, the most significant of which are credit, liquidity and interest rate. Although it cannot eliminate these risks, the Corporation has risk management processes designed to provide for risk identification, measurement, monitoring and control. CREDIT RISK Credit risk represents the possibility that a customer or counterparty may not perform in accordance with contractual terms. Credit risk results from extending credit to customers, purchasing securities and entering into certain off-balance-sheet financial derivative transactions. Risk associated with the extension of credit includes general risk, which is inherent in the lending business, and risk specific to individual borrowers. The Corporation seeks to manage credit risk through portfolio diversification, underwriting policies and procedures, and loan monitoring practices. Information relating to the distribution of the loan portfolio by type of loan, loan maturities and interest sensitivity is set forth under the section entitled "Loans" in the "Corporate Financial Review" and "Loans" in the "Statistical Information" included on pages 27 and 28 and page 77, respectively, of the Annual Report to Shareholders, which is incorporated herein by reference. Credit Administration, which includes credit policy, loan review and loan workout, is responsible for the overall management of credit risk and the development, application and enforcement of uniform policies and procedures across PNC Bank. One objective is diversification by industry concentration, geographic distribution and the type of borrower. Policies contain limits on amounts that may be committed for specified categories of loans and individual borrowers. These limits are specified for both consolidated and individual bank exposure levels. Specific underwriting policies have been adopted for many categories of exposure including commercial real estate, cable, cellular, broadcasting, health care and automobile dealers, as well as general policies covering standards of documentation, collateral coverage, guarantee provisions, environmental risk protection and approval processes. PNC Bank receives collateral to support credit extensions and commitments when deemed necessary, the amount of which is based on management's credit evaluation of the borrower. The most significant categories of collateral include real estate, commercial business assets, cash on deposit and marketable securities. In addition, for some loans made on the basis of the general creditworthiness of the borrower, additional security in the form of real and personal property may be obtained that may not be directly related to the purpose of the loan. In order to assess and monitor the degree of risk in the loan portfolio, a lender-initiated credit risk grading system is used. A risk grade is assigned to each loan at origination based on an assessment of the borrower's financial capacity to service the debt and the presence and value of collateral. Industry and economic risks are also considered when assigning such grades. Risk grades are maintained by the loan officer whose responsibilities include monitoring the risk inherent in such individual credits. An independent corporate loan review function assesses the credit granting process and reviews risk grades for compliance with policies. Asset and liability ("A&L") management seeks to minimize the credit risk associated with its activities, including financial derivatives, primarily by entering into transactions with only a select number of high-quality institutions, establishing credit limits, requiring bilateral-netting agreements, and in certain instances, requiring segregated collateral. Additional information with respect to risk associated with the Corporation's financial derivatives is set forth under the section entitled "Financial Derivatives" in the "Corporate Financial Review" included on pages 31 through 34 of the Annual Report to Shareholders, which is incorporated herein by reference. LIQUIDITY RISK Liquidity represents an institution's ability to generate cash or otherwise obtain funds at reasonable rates to satisfy commitments to borrowers and demands of depositors and debtholders, and invest in strategic initiatives. Liquidity risk represents the likelihood the Corporation would be unable to generate cash or otherwise obtain funds at reasonable rates for such purposes. Liquidity is managed through the coordination of the relative maturities of assets, liabilities and off-balance-sheet positions and is enhanced by the ability to raise funds in capital markets through direct borrowing or securitization of assets, such as automobile and credit card loans. 4

7 As described under "Liquidity" in the "Corporate Financial Review" on page 41 of the Annual Report to Shareholders, which is incorporated herein by reference, management believes that the Corporation has sufficient liquidity to meet its current commitments and obligations to customers, debtholders and others. INTEREST RATE RISK Interest rate risk arises primarily through the Corporation's normal business activities of extending loans and taking deposits. Interest rate risk is the sensitivity of net interest income and the market value of financial instruments to the timing, magnitude and frequency of changes in interest rates. Interest rate risk results from various repricing frequencies and the maturity structure of assets, liabilities, and off-balance-sheet positions. Interest rate risk also results from, among other factors, changes in the relationship or spread between interest rates. Many factors, including economic and financial conditions, general movements in market interest rates and consumer preferences, affect the spread between interest earned on assets and interest paid on liabilities. Financial derivatives, primarily interest rate swaps, caps and floors, are used to alter the interest rate characteristics of assets and liabilities. For example, receive-fixed interest rate swaps effectively convert variable-rate assets to fixed-rate assets. In managing interest rate risk, the Corporation seeks to minimize reliance on a particular interest rate scenario as a source of earnings. Accordingly, wholesale activities including securities, funding, financial derivatives and capital market activities are used in managing core business exposures within specified guidelines. Interest rate risk is centrally managed by A&L management. As part of the overall interest rate risk management process, A&L management will initiate various actions to manage risks within the Corporation's guidelines. Such actions are dependent on costs, existing and expected economic conditions, the Corporation's business strategies and various other factors. A committee composed of members of senior management and a committee of the Corporation's Board of Directors oversees A&L management and periodically reviews interest rate risk exposures. The Corporation uses a number of measures to monitor and manage interest rate risk, including income simulation and interest sensitivity ("gap") analyses. In addition, the Corporation is in the process of developing measures of longer-term interest rate sensitivity, including duration of equity and equity at risk. Such models are designed to estimate the impact on the value of equity resulting from changes in interest rates and supplement the simulation model and gap analyses. An income simulation model is the primary tool used by management to assess the direction and magnitude of changes in net interest income resulting from changes in interest rates. Key assumptions employed in the model include interest rate movements, balance sheet growth, prepayment speeds on mortgage-related assets, cash flows and maturities of financial instruments, changes in market conditions, loan volumes and pricing, deposit sensitivity, customer preferences, and management's financial and capital plans. The assumptions are developed based on current business and A&L management strategies, historical experience, the current economic environment, forecasted economic conditions and other analyses. These assumptions are inherently uncertain and subject to change as time passes. Accordingly, under these scenarios the model is not an estimate of expected net interest income nor does it precisely predict the impact of higher or lower interest rates on net interest income. The Corporation's guidelines provide that net interest income should not decrease by more than 3 percent if interest rates gradually increase or decrease from current rates by 100 basis points over a twelve month period. At December 31, 1995, based on results of the simulation model, the Corporation was within these guidelines. The impact of changes in interest rates on these measures will differ from simulated results due to various factors including timing, magnitude and frequency of interest rate changes, the relationship or spread between various interest rates, changes in market conditions, loan pricing and deposit sensitivity, customer preferences and competition. In addition, the actual results will be affected by the impact of mergers or acquisitions and business and A&L management strategies that differ from those assumed in the model. Additional interest rate scenarios are modeled to address a wider range of rate movement, yield curve, term structure and basis risk exposures. Depending on market conditions and other inherent risks, these scenarios may be modeled more or less frequently. Such analyses are used as supplemental measurements only and limits have not been established. The Corporation also employs interest sensitivity (gap) analyses. A gap analysis represents a point-in-time net position of assets, liabilities and off-balance-sheet instruments subject to repricing in specified time periods. A cumulative asset-sensitive gap position indicates the Corporation's assets are expected to reprice more quickly than its liabilities. Alternatively, a cumulative liability-sensitive gap position indicates the Corporation's liabilities are expected to reprice more quickly than its assets. The gap analysis does not accurately measure the magnitude of changes in net interest income since changes in interest rates over time do not impact all categories of assets, liabilities and off-balance-sheet instruments equally or simultaneously. The Corporation's limit for the cumulative one-year gap position is 10 percent. 5

8 During January 1996, to reduce exposure to declining interest rates, the Corporation added receive-fixed interest rate swaps with a term of two years which converted designated assets from variable rates to fixed rates. As a result, the asset sensitivity of the Corporation's cumulative one-year gap position was reduced from 7.0 percent at December 31, 1995, to 3.8 percent. The "Interest Rate Sensitivity (Gap) Analysis" table set forth in the "Corporate Financial Review" on page 42 of the Annual Report to Shareholders is incorporated herein by reference. EFFECT OF GOVERNMENTAL MONETARY POLICIES The earnings and operations of bank holding companies and their subsidiaries are affected by the monetary and fiscal policies of the United States government and its agencies, including the Federal Reserve Board. An important function of the Federal Reserve Board is to regulate the national supply of bank credit. The Federal Reserve Board employs open market operations in U.S. Government securities, changes in the discount rate on bank borrowings and changes in reserve requirements on bank deposits to implement its monetary policy objectives. These instruments of monetary policy are used in varying combinations to influence the overall level of bank loans, investments and deposits, the interest rates charged on loans and paid for deposits, the price of the dollar in foreign exchange markets and the level of inflation. The monetary policies of the Federal Reserve Board have had a significant effect on the operating results of banking institutions in the past and are expected to continue to do so in the future. It is not possible to predict the nature or timing of future changes in monetary and fiscal policies or the effect that they may have on the Corporation's business and earnings. SUPERVISION AND REGULATION INTRODUCTION Bank holding companies, banks and many of their nonbank affiliates are extensively regulated under both federal and state law. The following information describes certain aspects of that regulation applicable to the Corporation and its subsidiaries, and does not purport to be complete. The discussion is qualified in its entirety by reference to all particular statutory or regulatory provisions. The Corporation is a legal entity separate and distinct from its subsidiary banks and its nonbank subsidiaries. Accordingly, the right of the Corporation, and consequently the right of creditors and shareholders of the Corporation, to participate in any distribution of the assets or earnings of any subsidiary is necessarily subject to the prior claims of creditors of the subsidiary, except to the extent that claims of the Corporation in its capacity as creditor may be recognized. The principal source of the Corporation's revenue and cash flow is dividends from its subsidiary banks and nonbank subsidiaries. There are legal limitations on the extent to which its subsidiary banks can finance or otherwise supply funds to the Corporation and its nonbank subsidiaries. BANK HOLDING COMPANIES GENERAL As a registered holding company, the Corporation is regulated under the BHC Act and is subject to supervision and regular inspection by the Board of Governors of the Federal Reserve System ("Federal Reserve Board"). The BHC Act requires, among other things, the prior approval of the Federal Reserve Board in any case where the Corporation proposes to (i) acquire all or substantially all of the assets of any bank, (ii) acquire direct or indirect ownership or control of more than 5 percent of the voting shares of any bank, or (iii) merge or consolidate with any other bank holding company. ACQUISITIONS/PERMISSIBLE BUSINESS ACTIVITIES The BHC Act currently permits bank holding companies from any state to acquire banks and bank holding companies located in any other state, subject to certain conditions, including certain nationwide- and state-imposed concentration limits. Effective June 1, 1997, the Corporation's subsidiary banks will have the ability, subject to certain restrictions, including state opt-out provisions, to consolidate with one another or to acquire by acquisition or merger branches outside their home states. States may affirmatively opt-in to permit these transactions earlier, which Delaware and Pennsylvania, among other states, have done. The establishment of new interstate branches also will be possible in those states with laws that expressly permit it. Interstate branches will be subject to certain laws of the states in which they are located. Competition may increase further as banks branch across state lines and enter new markets. 6

9 Under the BHC Act, the Corporation is prohibited, with certain exceptions, from acquiring direct or indirect ownership or control of more than 5 percent of any class of voting shares of any nonbanking corporation. Further, the Corporation may not engage in any business other than managing and controlling banks or furnishing certain specified services to subsidiaries, and may not acquire voting control of nonbanking corporations except those corporations engaged in businesses or furnishing services that the Federal Reserve Board deems to be closely related to banking. COMMUNITY REINVESTMENT Bank holding companies and their subsidiary banks are subject to the provisions of the Community Reinvestment Act of 1977, as amended ("CRA"). Under the terms of the CRA, each subsidiary bank's record in meeting the credit needs of the community served by that bank, including low- and moderate-income neighborhoods, is generally annually assessed by that bank's primary regulatory authority. When a bank holding company applies for approval to acquire a bank or other bank holding company, the Federal Reserve Board will review the assessment of each subsidiary bank of the applicant bank holding company, and such records may be the basis for denying the application. At December 31, 1995, the Corporation's subsidiary banks were rated "Outstanding" or "Satisfactory" with respect to CRA. SOURCE OF STRENGTH POLICY Under Federal Reserve Board policy, a bank holding company is expected to act as a source of financial strength to each of its subsidiary banks and to commit resources to support each such bank. Consistent with its "source of strength" policy for subsidiary banks, the Federal Reserve Board has stated that, as a matter of prudent banking, a bank holding company generally should not maintain a rate of cash dividends unless its net income available to common shareholders has been sufficient to fund fully the dividends, and the prospective rate of earnings retention appears to be consistent with the corporation's capital needs, asset quality and overall financial condition. SUBSIDIARY BANKS GENERAL The Corporation's subsidiary banks are subject to supervision and examination by applicable federal and state banking agencies, including, with respect to national banks, the Office of the Comptroller of the Currency ("OCC"). In addition, all of the subsidiary banks are insured by and subject to some or all of the regulations of the Federal Deposit Insurance Corporation ("FDIC"). The Corporation's subsidiary banks are also subject to various requirements and restrictions under federal and state law, including requirements to maintain reserves against deposits, restrictions on the types, amounts and terms and conditions of loans that may be granted and limitations on the types of investments that may be made and the types of services that may be offered. Various consumer laws and regulations also affect the operations of the subsidiary banks. DIVIDEND RESTRICTIONS Dividends from the Corporation's subsidiary banks constitute the principal source of income to the parent company. The Corporation's subsidiary banks are subject to various statutory and regulatory restrictions on their ability to pay dividends to the Corporation. Under such restrictions, the amount available for payment of dividends to the Corporation by all subsidiary banks totaled $650 million at December 31, 1995. In addition, bank regulators may have authority to prohibit a bank subsidiary from paying dividends, depending upon the subsidiary's financial condition, if such payment is deemed to constitute an unsafe or unsound practice. The OCC and the Federal Reserve Board have indicated their view that it generally would be an unsafe and unsound practice to pay dividends except out of current operating earnings. The ability of the subsidiary banks to pay dividends in the future is presently, and could be further, influenced by bank regulatory and supervisory policies. AFFILIATE TRANSACTION RESTRICTIONS The Corporation's subsidiary banks are subject to federal laws that limit the transactions by subsidiary banks to or on behalf of their parent company and to or on behalf of any nonbank subsidiaries. Such transactions by a subsidiary bank to its parent company or to any nonbank subsidiary are limited to 10 percent of a bank subsidiary's capital and surplus and, with respect to such parent company and all such nonbank subsidiaries, to an aggregate of 20 percent of such bank subsidiary's capital and surplus. Further, loans and extensions of credit generally are required to be secured by eligible collateral in specified amounts. Federal law also prohibits subsidiary banks from purchasing "low-quality" assets from affiliates. FDIC CROSS-GUARANTEE PROVISIONS The Corporation's subsidiary banks are subject to the "cross-guarantee" provisions under federal law that provide that if one depository institution subsidiary of a multi-bank holding company fails or requires FDIC assistance, the FDIC may assess a "commonly controlled" depository institution for the estimated losses suffered by the FDIC. Such liability could have a material adverse effect on the financial condition of any assessed bank and the Corporation. While the FDIC's claim is junior to the claims of depositors, holders of secured liabilities, general creditors and subordinated creditors, it is superior to the claims of shareholders and affiliates. 7

10 FDIC INSURANCE ASSESSMENTS Deposits of the Corporation's bank subsidiaries are insured by the FDIC and are subject to FDIC insurance assessments. The amount of FDIC assessments paid by individual insured depository institutions is based on their relative risk as measured by regulatory capital ratios and certain other factors. During 1995, the FDIC's Board of Directors significantly reduced premium rates assessed on deposits insured by the Bank Insurance Fund ("BIF"). Under the current regulations, the Corporation is not assessed a premium on BIF-insured deposits. The rates assessed for deposits insured by the Savings Association Insurance Fund ("SAIF") continue to range from 23 cents per $100 of eligible deposits to 31 cents per $100 of eligible deposits. Approximately $5.3 billion of the Corporation's deposits are insured by the SAIF and assessed 23 cents per $100 of eligible deposits. Congress and various governmental agencies are considering a number of proposals to recapitalize the SAIF, including a significant one-time assessment on all SAIF-insured deposits. Management currently cannot predict the outcome of these proposals or the effect, if any, on the Corporation or any of its subsidiary banks. ENFORCEMENT POWERS OF FEDERAL BANKING AGENCIES Federal banking agencies possess broad powers to take corrective action as deemed appropriate for an insured depository institution and its holding company. The extent of these powers depends on whether the institution in question is considered "well capitalized", "adequately capitalized", "undercapitalized", "significantly undercapitalized" or "critically undercapitalized". At December 31, 1995, all of the Corporation's subsidiary banks exceeded the required ratios for classification as "well capitalized." The classification of depository institutions is primarily for the purpose of applying the federal banking agencies' prompt corrective action powers and is not intended to be, and should not be interpreted as, a representation of the overall financial condition or prospects of any financial institution. The agencies' prompt corrective action powers can include, among other things, requiring an insured financial institution to adopt a capital restoration plan which cannot be approved unless guaranteed by the institution's parent company; placing limits on asset growth and restrictions on activities; including restrictions on transactions with affiliates; restricting the interest rate the institution may pay on deposits; prohibiting the payment of principal or interest on subordinated debt; prohibiting the holding company from making capital distributions without prior regulatory approval; and, ultimately, appointing a receiver for the institution. Among other things, only a "well capitalized" depository institution may accept brokered deposits without prior regulatory approval and only an "adequately capitalized" depository institution may accept brokered deposits with prior regulatory approval. CAPITAL GUIDELINES Under the risk-based capital guidelines applicable to the Corporation and each of its subsidiary banks, the minimum guideline for the ratio of total capital to risk- weighted assets (including certain off-balance-sheet activities, such as standby letters of credit) is 8.00 percent. At least half of the total capital must be "Tier 1" capital, which primarily includes common shareholders' equity and qualifying preferred stock, less goodwill and other disallowed intangibles. "Tier 2" capital includes, among other items, certain cumulative and limited-life preferred stock, qualifying subordinated debt and the allowance for credit losses, subject to certain limitations, less required deductions as prescribed by regulation. In addition, the federal bank regulators established leverage ratio (Tier 1 capital to total adjusted average assets) guidelines providing for a minimum leverage ratio of 3 percent for bank holding companies and banks meeting certain specified criteria, including that such institutions have the highest regulatory examination rating and are not contemplating significant growth or expansion. Institutions not meeting these criteria are expected to maintain a ratio which exceeds the 3 percent minimum by at least 100 to 200 basis points. The federal bank regulatory agencies may, however, set higher capital requirements when particular circumstances warrant. Under the federal banking laws, failure to meet the minimum regulatory capital requirements could subject a bank to a variety of enforcement remedies available to federal bank regulatory agencies. At December 31, 1995, all of the subsidiary banks' total and Tier 1 risk-based capital ratios and leverage ratios exceeded the minimum regulatory capital requirements. Additional discussion of the Corporation's current capital levels is set forth under the caption entitled "Capital" in the "Corporate Financial Review" on pages 30 and 31 of the Annual Report to Shareholders, which is incorporated herein by reference. Effective in January 1995, the federal banking agencies revised the risk-based capital standards described above to include concentration of credit risk and the risks of nontraditional activities. The Federal Reserve Board, the FDIC and the OCC also subsequently amended their capital standards to include a bank's exposure to declines in economic value 8

11 of its capital due to changes in interest rates. The Corporation understands that such agencies intend to continue reviewing the issue of interest rate risk as it may affect capital adequacy. NONBANK SUBSIDIARIES The nonbank subsidiaries of the Corporation are subject to regulatory restrictions imposed by the Federal Reserve Board and other federal or state regulatory agencies. The Corporation's subsidiaries engaged in securities-related activities are regulated by the Securities and Exchange Commission ("SEC"). The activities of the Corporation's two subsidiaries which are registered broker dealers are also monitored by the OCC in one instance and the Federal Reserve Board in the other instance. Each such company is also subject to rules and regulations promulgated by the National Association of Securities Dealers, Inc., the Securities Investors Protection Corporation and various state securities commissions, and with respect to public finance activities the Municipal Securities Rulemaking Board. Several nonbank subsidiaries of the Corporation are registered investment advisers and are subject to the regulations of the SEC and may be subject to regulations of one or more state securities commissions. Additionally, these investment advisers, as subsidiaries of a national bank, are subject to supervision by the OCC. Investment companies (as defined in the Investment Company Act of 1940, as amended) advised by a subsidiary of the Corporation are registered with the SEC. Other nonbank subsidiaries of the Corporation are regulated under federal and/or state mortgage lending, insurance and consumer laws, among others. LEGISLATIVE PROPOSALS AND REFORMS Significant legislative proposals and reforms affecting the financial services industry have been discussed and evaluated by Congress. In 1995, such proposals included legislation to revise the Glass-Steagall Act and the BHC Act to expand permissible activities for banks, principally to facilitate the convergence of commercial and investment banking. Certain proposals also sought to expand insurance activities of banks. It is unclear whether any of these proposals, or any form of them, will become law. Consequently, it is not possible to determine what effect, if any, they may have on the Corporation and its subsidiaries. COMPETITION Bank holding companies and their subsidiaries are subject to vigorous and intense competition from various financial institutions and other "nonbank" or non-regulated companies or firms that engage in similar activities. The Corporation's subsidiary banks compete for deposits with other commercial banks, savings banks, savings and loan associations, insurance companies and credit unions, as well as issuers of commercial paper and other securities, including shares in mutual funds. In making loans, the Corporation's subsidiary banks compete with other commercial banks, savings banks, savings and loan associations, consumer finance companies, credit unions, leasing companies and other nonbank lenders. In addition, various nonbank subsidiaries engaged in investment banking and venture capital activities compete with commercial banks, investment banking firms, insurance companies and venture capital firms. In providing asset management services, the Corporation's subsidiaries compete with many large commercial banks, trust companies, brokerage houses, mutual fund managers, registered investment advisors and insurance companies. The Corporation and its subsidiaries compete not only with financial institutions based in the states in which the subsidiary banks are located, but also with a number of large out-of-state and foreign banks, bank holding companies and other financial and nonbank institutions. Some of the financial and other institutions operating in the same markets are engaged in national and international operations and have more assets and personnel than the Corporation. Some of the Corporation's competitors are not subject to the extensive bank regulatory structure and restrictive policies which apply to the Corporation and its subsidiaries. 9

12 EXECUTIVE OFFICERS OF THE REGISTRANT Information concerning each executive officer of the Corporation as of March 1, 1996 is set forth below. Each executive officer held the position indicated or another senior executive position with the same entity or one of its affiliates or a predecessor corporation for the past five years, except as otherwise noted in the footnotes below. YEAR NAME AGE POSITION WITH CORPORATION EMPLOYED(1) - --------------------------------------------------------------------------------------------------------- Thomas H. O'Brien 59 Chairman and Chief Executive Officer 1962 James E. Rohr 47 President and Director 1972 Garry J. Scheuring (2) 56 Vice Chairman and Director 1990 Howard I. Atkins 45 Executive Vice President, Asset and Liability Management 1990 Susan B. Bohn 51 Executive Vice President, Corporate Development and 1986 Communications Richard C. Caldwell 51 Executive Vice President, Asset Management 1990 Walter E. Gregg, Jr. 54 Executive Vice President, Finance and Administration 1974 Frederick J. Gronbacher 53 Executive Vice President, Division Head - Consumer Banking 1976 Robert L. Haunschild 46 Senior Vice President and Chief Financial Officer 1990 William J. Johns 49 Senior Vice President and Chief Accounting Officer 1974 Edward P. Junker III 59 Vice Chairman 1964 Ralph S. Michael III 41 Executive Vice President, Corporate Banking 1979 Thomas E. Paisley III 48 Senior Vice President and Chairman, Corporate Credit Policy 1972 Committee Helen P. Pudlin 46 Senior Vice President and General Counsel 1989 Bruce E. Robbins 51 Executive Vice President, Real Estate Banking 1973 - --------------------------------------------------------------------------------------------------------- (1) Where applicable, refers to year first employed by predecessor company or acquired company. (2) Mr. Scheuring became Vice Chairman of the Corporation in connection with the Midlantic merger effective December 31, 1995. Since 1992, Mr. Scheuring has been Chairman of the Board, President and Chief Executive Officer of Midlantic Bank, N.A. From April 1991 until the merger, he was Chairman of the Board, President and Chief Executive Officer of Midlantic. Prior thereto, he was Vice Chairman of Continental Bank Corporation. In connection with the Midlantic merger, the Corporation and Mr. Scheuring entered into an Employment Agreement which is attached hereto as Exhibit 10.7. 10

13 ITEM 2 - PROPERTIES The executive and administrative offices of the Corporation and PNC Bank, National Association ("PNC Bank, N.A."), are located at One PNC Plaza, 249 Fifth Avenue, Pittsburgh, Pennsylvania. The thirty-story structure is owned by PNC Bank, N.A. The Corporation and PNC Bank, N.A. occupy substantially all of the building. In addition, PNC Bank, N.A. owns a thirty-four story structure adjacent to One PNC Plaza, known as Two PNC Plaza, 620 Liberty Avenue, Pittsburgh, Pennsylvania, that houses additional office space. PNC Bank, N.A. also owns a data processing and telecommunications center located in a suburb of Pittsburgh, Pennsylvania. The Corporation's subsidiaries also own or lease numerous other premises for use in conducting banking and nonbanking activities. The facilities owned or occupied under lease by the Corporation's subsidiaries are considered by management to be adequate. Neither the location of any particular office nor the unexpired term of any lease is deemed material to the business of the Corporation. Additional information pertaining to the Corporation's properties is set forth in "Note 8 - Premises, Equipment and Leasehold Improvements" of the Notes to Consolidated Financial Statements included on page 56 of the Annual Report to Shareholders, which is incorporated herein by reference. ITEM 3 - LEGAL PROCEEDINGS A consolidated purported class action complaint was filed in March 1995 in the United States District Court for the Western District of Pennsylvania against the Corporation, its Chairman and Chief Executive Officer and its Senior Vice President and Chief Financial Officer, on behalf of a purported class of persons who purchased the Corporation's securities between April 18, 1994 and November 15, 1994. The lawsuit was consolidated from four lawsuits filed in November and December 1994. The consolidated complaint alleges violations of federal securities laws and common law relating to disclosures regarding the Corporation's net interest income, interest rate risk, future prospects, and related matters, and seeks, among other things, unquantified damages. The magistrate judge has recommended that the district court deny the pending motion to dismiss as to all claims except a common law claim, and the recommendation has been appealed to the district court judge. Management believes there are meritorious defenses to this consolidated lawsuit and intends to defend it vigorously. Management believes that the final disposition will not be material to the Corporation's financial position. In January 1992, a purported class action lawsuit was filed against PNC National Bank ("PNCNB"), a national bank subsidiary of the Corporation located in Wilmington, Delaware, alleging that PNCNB violated Pennsylvania law in connection with credit card annual fees, late fees, over-credit limit fees, and returned check fees charged to Pennsylvania cardholders. The lawsuit is brought on behalf of a purported class of resident individuals of Pennsylvania who have contracted for, been charged, had reserved, or had paid these fees, and seeks, among other things, unquantified compensatory and triple damages and injunctive relief. The lawsuit was filed in the Court of Common Pleas of Allegheny County and was removed to the United States District Court for the Western District of Pennsylvania. The district court dismissed the lawsuit, holding that Pennsylvania law is preempted by federal banking laws. The Third Circuit Court of Appeals, after initially holding that there was no federal court jurisdiction and remanding the case to state court, has vacated its opinion and granted a rehearing. The case against PNCNB is one of several similar cases pending against other credit card issuers. In cases not involving PNCNB, the Supreme Courts of California and Colorado, and one federal appeals court, have upheld dismissal on the ground that state law restrictions on credit card late fees are preempted by federal law, but the Supreme Court of New Jersey has reached a contrary conclusion. The United States Supreme Court has agreed to review the California late fee case, the outcome of which will resolve the conflict and affect the case against PNCNB. In an appeal of Pennsylvania Superior Court decisions against other credit card issuers holding that federal law does not preempt Pennsylvania law purportedly restricting annual fees, late fees, over-credit limit fees, and returned check fees, the Pennsylvania Supreme Court has indicated it will defer further proceedings until after the United States Supreme Court renders its decision. The impact of the final disposition of the lawsuit brought against PNCNB cannot be assessed at this time. In March 1996, the Superior Court of New Jersey, Middlesex County, dismissed, pursuant to agreement of the parties, the previously reported purported class action lawsuit commenced in July 1995 against Midlantic, Midlantic's chief executive officer and its directors and the Corporation, relating to the merger with Midlantic. No compensation was paid by any defendant to plaintiff or plaintiff's attorneys. 11

14 The Corporation, in the normal course of business, is subject to various other pending and threatened lawsuits in which claims for monetary damages are asserted. Management, after consultation with legal counsel, does not anticipate that the ultimate aggregate liability, if any, arising out of such other lawsuits will have a material effect on the Corporation's financial position. At the present time, management is not in a position to determine whether any pending or threatened litigation will have a material adverse effect on the Corporation's results of operations in any future reporting period. ITEM 4 - SUBMISSION OF MATTERS TO VOTE OF SECURITY HOLDERS A special meeting of shareholders of the Corporation was held on November 17, 1995, for the purpose of approving the reorganization agreement and related merger agreement with Midlantic. The Midlantic merger was approved and the votes cast for, against or abstained and the number of broker non-votes were as follows: Aggregate Votes For: 134,723,297 Aggregate Votes Against: 31,698,946 Number of Abstentions: 1,426,164 Number of Broker Non-Votes: 800,649 Holders of the Corporation's common stock and preferred stock voted together as a single class. The following table sets forth as of September 29, 1995 record date, the number of shares of each class of stock that was issued and outstanding and entitled to vote, the voting power per share and the aggregate voting power of each class: NUMBER OF SHARES AGGREGATE TITLE OF CLASS VOTING RIGHTS ENTITLED TO VOTE VOTING POWER - -------------------------------------------------------------------------------------- Common Stock 1 vote per share 228,598,590 228,598,590 $1.80 Cumulative Convertible Preferred Stock - Series A 8 votes per share 17,951 143,608 $1.80 Cumulative Convertible Preferred Stock - Series B 8 votes per share 6,336 50,688 $1.60 Cumulative Convertible Preferred Stock - Series C 4 votes per 2.4 shares 361,363 602,271 $1.80 Cumulative Convertible Preferred Stock - Series D 4 votes per 2.4 shares 479,383 798,971 TOTAL POSSIBLE VOTES 230,194,128* - -------------------------------------------------------------------------------------- * Represents greatest number of votes possible. Actual aggregate voting power was less since each holder of preferred stock is entitled to a number of votes equal to the number of full shares of common stock into which such holder's preferred stock is convertible. 12

15 PART II ITEM 5 - MARKET FOR REGISTRANT'S COMMON EQUITY AND RELATED STOCKHOLDER MATTERS The Corporation's common stock is listed on the New York Stock Exchange and is traded under the symbol "PNC". At the close of business on February 29, 1996, there were 65,572 common shareholders of record. Holders of common stock are entitled to receive dividends when declared by the Board of Directors out of funds legally available therefor. The Board of Directors may not pay or set apart dividends on the common stock until dividends for all past dividend periods on any series of outstanding preferred stock have been paid or declared and set apart for payment. The Board presently intends to continue the policy of paying quarterly cash dividends. However, the amount of any future dividends will depend on earnings, the financial condition of the Corporation and other factors including applicable government regulations and policies (such as those relating to the ability of the subsidiary banks and nonbank subsidiaries to upstream dividends to the parent company). The Federal Reserve Board has the power to prohibit the Corporation from paying dividends without prior regulatory approval. Further discussion concerning dividend restrictions is set forth under the caption "Supervision and Regulation" in Part I, Item 1 of this Form 10-K and in "Regulatory Matters" on page 65 of the Annual Report to Shareholders, which is incorporated herein by reference. Additional information relating to the common stock is set forth under the caption "Common Stock Prices/Dividends Declared" on page 85 of the Annual Report to Shareholders, which is incorporated herein by reference. ITEM 6 - SELECTED FINANCIAL DATA "Selected Consolidated Financial Data" on page 71 of the Annual Report to Shareholders is incorporated herein by reference. ITEM 7 - MANAGEMENT'S DISCUSSION AND ANALYSIS OF FINANCIAL CONDITION AND RESULTS OF OPERATIONS The discussion and analysis of the Corporation's financial position and its results of operations set forth under the section entitled "Corporate Financial Review" on pages 23 through 44 of the Annual Report to Shareholders are incorporated herein by reference. See also the additional discussion included under the captions "Business Overview" and "Risk Management" in Part I, Item 1-Business of this Form 10-K. ITEM 8 - FINANCIAL STATEMENTS AND SUPPLEMENTARY DATA The "Report of Ernst & Young LLP, Independent Auditors," "Consolidated Financial Statements" and "Selected Quarterly Financial Data" on pages 45, 46 through 70, and 72, respectively, of the Annual Report to Shareholders are incorporated herein by reference. PART III ITEM 10 - DIRECTORS AND EXECUTIVE OFFICERS OF THE REGISTRANT Information relating to the principal occupations of directors of the Corporation, their ages, directorships in other companies, and respective terms of office under the heading "Election of Directors - Information Concerning Nominees" in the Proxy Statement is incorporated herein by reference. Information regarding compliance with Section 16(a) of the Securities Exchange Act of 1934 set forth under the heading "Certain Reports" in the Proxy Statement is incorporated herein by reference. Information regarding executive officers of the Corporation is included in Part I of this Form 10-K under the caption "Executive Officers of the Registrant". Information regarding the involvement of the Corporation's Chairman and Chief Executive Officer and Senior Vice President and Chief Financial Officer in a certain legal proceeding set forth under the heading "Legal Proceedings" in the Proxy Statement is incorporated herein by reference. 13

16 ITEM 11 - EXECUTIVE COMPENSATION Information regarding compensation of directors and executive officers under the captions entitled "Election of Directors - Compensation of Directors", "Election of Directors - Common Stock Purchase Guideline" and "Compensation of Executive Officers", excluding the "Personnel and Compensation Committee Report on Executive Compensation", in the Proxy Statement is incorporated herein by reference. ITEM 12 - SECURITY OWNERSHIP OF CERTAIN BENEFICIAL OWNERS AND MANAGEMENT Information regarding the beneficial ownership of the equity securities of the Corporation by all directors, each of the five highest compensated executive officers, all directors and executive officers of the Corporation as a group and certain other beneficial owners under the heading "Security Ownership of Directors and Executive Officers and Certain Beneficial Owners-Security Ownership of Directors and Executive Officers" in the Proxy Statement is incorporated herein by reference. ITEM 13 - CERTAIN RELATIONSHIPS AND RELATED TRANSACTIONS Information regarding transactions and relationships with certain directors and executive officers of the Corporation and their associates under the heading "Compensation of Executive Officers-Compensation Committee Interlocks and Insider Participation" in the Proxy Statement is incorporated herein by reference. PART IV ITEM 14 - EXHIBITS, FINANCIAL STATEMENT SCHEDULES AND REPORTS ON FORM 8-K The following report of independent auditors of the Corporation and consolidated financial statements, included in the Annual Report to Shareholders, are incorporated herein by reference. PAGE OF FINANCIAL STATEMENTS ANNUAL REPORT ------------------------------------------------------------------------------------------- Report of Ernst & Young LLP, Independent Auditors 45 Consolidated Balance Sheet as of December 31, 1995 and 1994 46 Consolidated Statement of Income for the three years ended December 31, 1995 47 Consolidated Statement of Changes in Shareholders' Equity for the three years ended December 31, 1995 48 Consolidated Statement of Cash Flows for the three years ended December 31, 1995 49 Notes to Consolidated Financial Statements 50-70 Quarterly Selected Financial Data 72 FINANCIAL STATEMENT SCHEDULES ------------------------------------------------------------------------------------------- Not applicable. REPORTS ON FORM 8-K ------------------------------------------------------------------------------------------- The following reports on Form 8-K were filed during the quarter ended December 31, 1995, or thereafter: A Current Report on Form 8-K dated as of September 26, 1995, was filed pursuant to Item 5 to report the Corporation's consolidated financial results for the three months and nine months ended September 30, 1995, the receipt of regulatory approvals in connection with the Midlantic merger and other Midlantic merger-related matters, and the appointment of an additional director to the Corporation's Board of Directors. 14

17 A Current Report on Form 8-K dated as of December 31, 1995, was filed pursuant to Item 2 to report the effectiveness of the merger with Midlantic and the appointment of 4 additional directors to the Corporation's Board of Directors. The Form 8-K also reported pursuant to Item 5 the completion of actions that accelerated the repositioning of the Corporation's balance sheet and provided an estimate of combined earnings for 1995 giving effect to the Midlantic transaction. The following financial statements were reported as having been previously filed: (a) audited consolidated financial statements of Midlantic as of December 31, 1994 and 1993, and for each of the three years in the period ended December 31, 1994, including the independent auditor's report thereon; (b) unaudited consolidated interim financial statements of Midlantic as of September 30, 1995 and 1994, and for the three months and nine months ended September 30, 1995 and 1994; (c) pro forma consolidated financial information (unaudited) as of September 30, 1995 and for the nine months ended September 30, 1995 and 1994, giving effect to the Midlantic merger; and (d) pro forma consolidated financial information (unaudited) for each of the three years in the period ended December 31, 1994, giving effect to the Midlantic merger. A Current Report on Form 8-K dated January 24, 1996, was filed pursuant to Item 5 to report the Corporation's consolidated financial results for the three months and year ended December 31, 1995. EXHIBITS The exhibits listed on the Exhibit Index on pages 18 and 19 of this Form 10-K are filed herewith or are incorporated herein by reference. SIGNATURES Pursuant to the requirements of Section 13 or 15(d) of the Securities Exchange Act of 1934, PNC Bank Corp. has duly caused this report to be signed on its behalf by the undersigned, thereunto duly authorized. PNC BANK CORP. (Registrant) By: /s/ ROBERT L. HAUNSCHILD ------------------------- Robert L. Haunschild Senior Vice President and Chief Financial Officer Date: March 27, 1996 15

18 Pursuant to the requirements of the Securities Exchange Act of 1934, this report has been signed below by the following persons on behalf of PNC Bank Corp. and in the capacity and on the dates indicated. SIGNATURE TITLE DATE ----------------------- ------------------------- ----------------------- /s/ THOMAS H. O'BRIEN -------------------------- Chairman, Chief Executive March 27, 1996 Thomas H. O'Brien Officer and Director (Principal Executive Officer) /s/ ROBERT L.HAUNSCHILD -------------------------- Senior Vice President and March 27, 1996 Robert L. Haunschild Chief Financial Officer (Principal Financial Officer) /s/ WILLIAM J. JOHNS -------------------------- Senior Vice President and March 27, 1996 William J. Johns Chief Accounting Officer (Principal Accounting Officer) * -------------------------- Director March 27, 1996 Paul W. Chellgren * -------------------------- Director March 27, 1996 Robert N. Clay * -------------------------- Director March 27, 1996 William G. Copeland * -------------------------- Director March 27, 1996 George A. Davidson * -------------------------- Director March 27, 1996 David F. Girard-diCarlo * -------------------------- Director March 27, 1996 Dianna L. Green * -------------------------- Director March 27, 1996 C. G. Grefenstette * -------------------------- Director March 27, 1996 Arthur J. Kania 16

19 * -------------------------- Director March 27, 1996 Bruce C. Lindsay * -------------------------- Director March 27, 1996 Thomas Marshall * -------------------------- Director March 27, 1996 W. Craig McClelland * -------------------------- Director March 27, 1996 Donald I. Moritz * -------------------------- Director March 27, 1996 Jackson H. Randolph * -------------------------- President and Director March 27, 1996 James E. Rohr * -------------------------- Director March 27, 1996 Roderic H. Ross * -------------------------- Director March 27, 1996 Vincent A. Sarni * -------------------------- Vice Chairman and Director March 27, 1996 Garry J. Scheuring * -------------------------- Director March 27, 1996 Thomas J. Usher * -------------------------- Director March 27, 1996 Milton A. Washington * -------------------------- Director March 27, 1996 Helge H. Wehmeier * March 27, 1996 By /s/ MELANIE S. CIBIK -------------------------- Melanie S. Cibik Attorney-in-fact, pursuant to Powers of Attorney filed herewith 17

20 EXHIBIT INDEX 3.1 Articles of Incorporation of the Corporation, as amended, incorporated herein by reference to Exhibit 3.1 of the Annual Report on Form 10-K for the year ended December 31, 1993. 3.2 By-Laws of the Corporation, as amended, incorporated herein by reference to Exhibit 4.2 to the Corporation's Registration Statement on Form S-8 at File No. 33-62311. 4.1 Instruments defining the rights of holders of long-term debt of the Corporation and its subsidiaries are not filed as Exhibits because the amount of debt under each instrument is less than 10 percent of the consolidated assets of the Corporation. The Corporation undertakes to file these instruments with the Commission on request. 4.2 Designation of Series: $1.80 Cumulative Convertible Preferred Stock -- Series A, incorporated herein as part of Exhibit 3.1. 4.3 Designation of Series: $1.80 Cumulative Convertible Preferred Stock -- Series B, incorporated herein as part of Exhibit 3.1. 4.4 Designation of Series: $1.60 Cumulative Convertible Preferred Stock -- Series C, incorporated herein as part of Exhibit 3.1. 4.5 Designation of Series: $1.80 Cumulative Convertible Preferred Stock -- Series D, incorporated herein as part of Exhibit 3.1. 10.1 Supplemental Executive Retirement Income and Disability Plan of the Corporation, incorporated herein by reference to Exhibit 10.2 of the Annual Report on Form 10-K for the year ended December 31, 1990 ("1990 Form 10-K"). * 10.2 Supplemental Executive Life Insurance and Spouse's Benefit Plan of the Corporation, incorporated herein by reference to Exhibit 10.3 of the 1990 Form 10-K. * 10.3 1992 Long-Term Incentive Award Plan of the Corporation, incorporated herein by reference to Exhibit 4.3 of the Registration Statement on Form S-8 at File No. 33-54960. * 10.4 1992 Director Share Incentive Plan, incorporated herein by reference to Exhibit 10.6 of the Annual Report on Form 10-K for the year ended December 31, 1992.* 10.5 PNC Bank Corp. 1994 Annual Incentive Award Plan, incorporated by reference to Exhibit 10.6 of the Annual Report on Form 10-K for the year ended December 31, 1994 ("1994 Form 10-K").* 10.6 PNC Bank Corp. Directors Retirement Plan, incorporated by reference to Exhibit 10.7 of the 1994 Form 10-K.* 10.7 Employment Agreement dated as of December 29, 1995, between the Corporation and Garry J. Scheuring, filed herewith.* 10.8 PNC Bank Corp. 1996 Executive Incentive Award Plan, filed herewith. * 11 Calculation of Primary and Fully Diluted Earnings Per Share, filed herewith. 12.1 Computation of Ratio of Earnings to Fixed Charges, filed herewith. 12.2 Computation of Ratio of Earnings to Combined Fixed Charges and Preferred Dividends, filed herewith. 13 Excerpts of the Annual Report to Shareholders for the year ended December 31, 1995, filed herewith. Such Annual Report, except for those portions thereof that are expressly incorporated by reference herein, is furnished for information of the Securities and Exchange Commission only and is not deemed to be "filed" as part of this Form 10-K. 21 Schedule of Certain Subsidiaries of the Corporation, filed herewith. 18

21 23 Consent of Ernst & Young LLP, independent auditors for the Corporation, filed herewith. 24.1 Power of Attorney of certain directors and officers of the Corporation, filed herewith. 24.2 Power of Attorney of Robert N. Clay, filed herewith. 24.3 Power of Attorney of David F. Girard-diCarlo, filed herewith. 24.4 Power of Attorney of Thomas Marshall, filed herewith. 24.5 Power of Attorney of Donald I. Moritz, filed herewith. 24.6 Power of Attorney of Vincent A. Sarni, filed herewith. 24.7 Power of Attorney of Helge H. Wehmeier, filed herewith. 27.1 Financial Data Schedule, filed herewith. 27.2 Restated Financial Data Schedule, filed herewith. * Denotes management contract or compensatory plan. 19

1 EXHIBIT 10.7 EMPLOYMENT AGREEMENT by and between PNC BANK CORP. and GARRY J. SCHEURING Dated as of December 29, 1995

2 CONFORMED COPY TABLE OF CONTENTS SECTION Page 1. Employment ............................................. 1 2. Term ................................................... 1 3. Position and Duties .................................... 1 4. Place of Performance ................................... 1 5. Compensation and Related Matters ....................... 1 (a) Base Salary ................................. 1 (b) Bonuses ..................................... 2 (c) Expenses .................................... 2 (d) Other Benefits .............................. 2 (e) Vacation .................................... 2 (f) Services Furnished .......................... 2 6. Offices ................................................ 2 7. Termination ............................................ 2 (a) Death ....................................... 2 (b) Disability .................................. 2 (c) Cause ....................................... 2 (d) Good Reason ................................. 3 8. Termination Procedure .................................. 3 (a) Notice of Termination ....................... 3 (b) Date of Termination ......................... 3 (c) Compensation During Dispute ................. 3 9. Compensation upon Termination or During Disability ..... 4 (a) Disability; Death ........................... 4 (b) By Executive for Good Reason or by the Company without Cause ..................... 4 (c) By Company for Cause or by the Executive Other than for Good Reason ...... 5 (d) Compensation Plans .......................... 5 (e) Time of Payments ............................ 5 10. Mitigation ............................................. 6 11. Confidential Information; Noncompetition Requirement ... 6 (a) Confidential Information .................... 6 (b) Noncompetition Requirement .................. 6 -i-

3 12. Successors; Binding Agreement .......................... 6 (a) Company's Successors ........................ 6 (b) The Executive's Successors .................. 6 13. Notice ................................................. 7 14. Miscellaneous .......................................... 8 15. Validity ............................................... 8 16. Counterparts ........................................... 8 17. Entire Agreement ....................................... 8 -ii-

4 INDEX OF DEFINED TERMS Term Where Defined - ---- ------------- Annual Bonus ........................................ Section 5(b) Base Salary.......................................... Section 5(a) Board................................................ Introduction Cause................................................ Section 7(c) Code................................................. Section 9(b) Company.............................................. Introduction Date of Termination.................................. Section 8(b) Disability........................................... Section 7(b) Disability Period.................................... Section 9(a) Effective Date....................................... Section 2 Employment Period.................................... Section 2 Executive............................................ Introduction Good Reason.......................................... Section 7(d) Incentive Plan....................................... Section 5(b) Merger............................................... Introduction Midlantic............................................ Introduction Notice of Termination................................ Section 8(a) Restricted Region.................................... Section 11(b) Retirement Plan...................................... Section 9(b) Severance Payment.................................... Section 9(b) Tax Counsel.......................................... Section 9(b) -iii-

5 EMPLOYMENT AGREEMENT AGREEMENT, dated December 29, 1995 and effective as of the Effective Date (as defined in Section 2 hereof) by and between Garry J. Scheuring (the "Executive"), and PNC Bank Corp., a Delaware corporation (the "Company"). WHEREAS, the Executive is the Chief Executive Officer of Midlantic Corporation, a New Jersey corporation ("Midlantic"); and WHEREAS, the Company, PNC Bancorp., Inc. and Midlantic have entered into an Agreement and Plan of Merger, dated July 10, 1995 (the "Merger Agreement"), pursuant to which the Company will be the surviving corporation of the merger contemplated thereby (the "Merger"); and WHEREAS, upon consummation of the Merger the Board of Directors of the Company (the "Board") desires to employ the Executive and the Executive desires to furnish services to the Company on the terms and conditions hereinafter set forth; and WHEREAS, the parties desire to enter into this agreement setting forth the terms and conditions of the employment relationship of the Executive with the Company; NOW, THEREFORE, in consideration of the premises and the mutual agreements set forth below, the parties hereto, intending to be bound hereby, do hereby agree as follows: 1. EMPLOYMENT. The Company hereby agrees to employ the Executive, and the Executive hereby accepts such employment, on the terms and conditions hereinafter set forth. 2. TERM. The period of employment of the Executive by the Company hereunder (the "Employment Period") shall commence on the effective date of the Merger (the "Effective Date") and shall end on the third anniversary of the Effective Date unless sooner terminated in the event that the Executive's employment is terminated without breach of this Agreement as provided in Section 7 hereof. 3. POSITION AND DUTIES. During the Employment Period, the Executive shall serve as Vice Chairman of the Company and shall be a member of the office of the Chairman. The Executive shall have operating responsibility for (i) the Eastern Territory (consisting of New Jersey and Philadelphia) and Eastern Territory Presidents, (ii) all retail banking operations of the Company, and (iii) such further responsibilities and authority as may from time to time be assigned to the Executive by the Chairman of the Board, provided that such responsibilities and authority are consistent with the Executive's position as Vice Chairman of the Company. The Executive shall report directly to the Chairman of the Board of the Company. The Executive agrees to devote substantially all of his working time and efforts to the performance of his duties for the Company. 4. PLACE OF PERFORMANCE. In connection with the Executive's employment by the Company, the Executive shall be based at the offices of the Eastern Territory of the Company located in New Jersey, except for reasonably required travel on the Company's business. 5. COMPENSATION AND RELATED MATTERS. (a) BASE SALARY. As compensation for the performance by the Executive of his obligations hereunder, during the Employment Period, the Company shall pay the Executive a base salary at the rate of $650,000 or more per annum ("Base Salary"). Base Salary shall be paid in approximately equal installments in accordance with the Company's customary payroll practices, but no less frequent than monthly. Base Salary may be increased from time to time in accordance with the normal business practices of the Company and, if so increased, shall not thereafter during the Employment Period be decreased. 1

6 (b) BONUSES. During the Employment Period, the Executive shall be eligible to receive such annual bonus (the "Annual Bonus") as may be provided in accordance with subsection (d) of this Section 5; provided, however, that the Executive's Annual Bonus for the fiscal year ending in 1996 shall be not less than 100% of the Executive's Base Salary for such year. The Annual Bonus shall be paid at such time and in such form as is set forth in the Company's applicable incentive plan (the "Incentive Plan"). (c) EXPENSES. The Company shall promptly reimburse the Executive for all reasonable business expenses incurred during the Employment Period by the Executive in performing services hereunder, including all expenses of travel and living expenses while traveling on business or at the request of and in the service of the Company, provided that such expenses are incurred and accounted for in accordance with the policies and procedures established by the Company. (d) OTHER BENEFITS. The Executive shall be entitled to participate in all of the employee benefit plans and arrangements currently maintained by the Company and shall be entitled to participate in or receive benefits under any employee benefit plan or arrangement made available by the Company in the future to its executives and key management employees (in the case of both current and future plans, including without limitation each incentive plan, pension and retirement plan and arrangement, supplemental pension and retirement plan and arrangement, stock option plan, life insurance and health-and-accident plan and arrangement, medical insurance plan, disability plan, survivor income plan, relocation plan and vacation plan), in accordance with the terms, conditions and overall administration of such plans and arrangements; provided, however, that in the case of both current and future plans, benefits shall be provided to the Executive on a basis no less favorable than the basis on which such benefits are provided to any other member of the Office of the Chairman (other than the Chairman of the Board). Nothing paid to the Executive under any plan or arrangement presently in effect or made available in the future shall be deemed to be in lieu of the salary payable to the Executive pursuant to subsection (a) of this Section 5. (e) VACATION. The Executive shall be entitled to the number of paid vacation days and holidays in each calendar year determined by the Company from time to time for its senior executive officers. (f) SERVICES FURNISHED. During the Employment Period, the Company shall furnish the Executive with office space, stenographic assistance and such other facilities and services as shall be suitable to the Executive's position and adequate for the performance of his duties as set forth in Section 3 hereof. 6. OFFICES. Subject to Sections 3 and 4 hereof, the Executive agrees to serve without additional compensation, if elected or appointed thereto, as a director of the Company or any of its subsidiaries, and as a member of any committees of the board of directors of any such corporations, and in one or more executive positions of any of the Company's subsidiaries, provided that the Executive is indemnified for serving in any and all such capacities on a basis no less favorable than is currently provided to any other director of the Company or any of its subsidiaries, or any such executive position, as the case may be. 7. TERMINATION. The Executive's employment hereunder may be terminated without any breach of this Agreement only under the circumstances set forth in the following subsections (a), (b), (c) and (d): (a) DEATH. The Executive's employment hereunder shall terminate upon his death. (b) DISABILITY. If, as a result of the Executive's incapacity due to physical or mental illness, the Executive shall have been absent from the full-time performance of his duties hereunder for the entire period of six consecutive months, and within thirty (30) days after written Notice of Termination (as defined in Section 8 hereof) is given shall not have returned to the performance of his duties hereunder on a full-time basis, the Company may terminate the Executive's employment hereunder for "Disability." (c) CAUSE. The Company may terminate the Executive's employment hereunder for Cause. For purposes of this Agreement, the Company shall have "Cause" to terminate the Executive's employment hereunder only upon the occurrence of any of the following events: 2

7 (i) the willful and continuing failure by the Executive to substantially perform his duties hereunder (other than any such failures resulting from the Executive's incapacity due to physical or mental illness or subsequent to the issuance of a Notice of Termination by the Executive for Good Reason) after demand for substantial performance is delivered by the Company in writing that specifically identifies the manner in which the Company believes the Executive has not substantially performed his duties; or (ii) the willful misconduct by the Executive (including, but not limited to, breach by the Executive of the provisions of Section 11(a) hereof) that is demonstrably and materially injurious to the Company or its subsidiaries, whether monetarily or otherwise; or (iii) the order of a federal bank regulatory agency or a court of competent jurisdiction requiring the Executive's termination. Cause shall not exist unless and until the Company has delivered to the Executive a copy of a resolution duly adopted by the affirmative vote of not less than three-quarters (3/4) of the entire membership of the Board of Directors of the Company at a meeting of such board called and held for such purpose (after reasonable notice to the Executive and an opportunity for the Executive, together with his counsel, to be heard before such board), finding that in the good faith opinion of such board, the Executive was guilty of the conduct set forth in this Section 7(c) and specifying the particulars thereof in detail. For purposes of this Section 7(c), no act or failure to act on the Executive's part shall be considered "willful" unless done or failed to be done by the Executive in bad faith and without reasonable belief that the Executive's action or omission was in the best interest of the Company. (d) GOOD REASON. The termination of his employment by the Executive during the Employment Period hereunder for any reason other than death or Disability shall constitute a termination for "Good Reason." 8. TERMINATION PROCEDURE. (a) NOTICE OF TERMINATION. Any termination of the Executive's employment by the Company or by the Executive (other than termination pursuant to Section 7(a) hereof) shall be communicated by written Notice of Termination to the other party hereto in accordance with Section 14 hereof. For purposes of this Agreement, a "Notice of Termination" shall mean a notice which shall indicate the specific termination provision in this Agreement relied upon and shall set forth in reasonable detail the facts and circumstances claimed to provide a basis for termination of the Executive's employment under the provision so indicated. (b) DATE OF TERMINATION. "Date of Termination" shall mean (i) if the Executive's employment is terminated by his death, the date of his death; (ii) if the Executive's employment is terminated for Disability (pursuant to Section 7(b) hereof), thirty (30) days after Notice of Termination (provided that the Executive shall not have returned to the performance of his duties on a full-time basis during such thirty (30) day period); (iii) if the Executive's employment is terminated for Cause (pursuant to Section 7(c) hereof), the date specified in the Notice of Termination; and (iv) if the Executive's employment is terminated for any other reason, the date on which a Notice of Termination is given or any later date (within 30 days) set forth in such Notice of Termination; provided, however, that, if within thirty (30) days after any Notice of Termination is given the party receiving such Notice of Termination notifies the other party that a dispute exists concerning the termination, the Date of Termination shall be the date on which the dispute is finally determined, either by mutual written agreement of the parties, by a binding and final arbitration award or by a final judgment, order or decree of a court of competent jurisdiction (the time for appeal therefrom having expired and no appeal having been perfected); and further provided, however, that the Date of Termination shall be extended by a notice of dispute given by the Executive only if such notice is given in good faith and the Executive pursues the resolution of such dispute with reasonable diligence. (c) COMPENSATION DURING DISPUTE. If a purported termination occurs during the Employment Period, and such termination is disputed in accordance with subsection (b) of this Section 8, the Company shall continue to pay the Executive the full compensation in effect when the notice giving rise to the dispute was given (including, but not limited to, Base Salary) and continue the Executive as a participant in all compensation, benefit and insurance plans in which the Executive was participating when the notice giving rise to the dispute was given, until the Date of Termination, determined in accordance with subsection (b) of this Section B. Amounts paid under this Section 8(c) are in addition to all other amounts due under this Agreement and shall not be offset against or reduce any other amounts due under this Agreement. 3

8 9. COMPENSATION UPON TERMINATION OR DURING DISABILITY. (a) DISABILITY; DEATH. During any period that the Executive fails to perform his duties hereunder as a result of incapacity due to physical or mental illness ("Disability Period"), the Executive shall continue to receive his full Base Salary at the rate in effect at the beginning of such period, until his employment is terminated pursuant to Section 7(b) hereof. Subsequent to the termination of the Executive's employment pursuant to Section 7(b) hereof, or in the event the Executive's employment is terminated by reason of his death, the Company shall have no further obligations to the Executive under this Agreement and the Executive's benefits shall be determined under the Company's retirement, insurance and other compensation programs then in effect in accordance with the terms of such programs. (b) BY EXECUTIVE FOR GOOD REASON OR BY THE COMPANY WITHOUT CAUSE. If during the Employment Period the Executive's employment is terminated by the Executive for Good Reason or by the Company other than for Cause, then -- (i) the Company shall pay the Executive his full Base Salary through the Date of Termination at the highest annual rate in effect during the 12 months immediately preceding the time Notice of Termination is given; (ii) in addition to any payments due the Executive pursuant to Section 5 hereof through the Date of Termination and in lieu of any further such payments to the Executive for any periods subsequent to the Date of Termination, the Company shall pay to the Executive a lump sum amount, in cash, equal to 2.99 times his "base amount," as defined in section 28OG of the Internal Revenue Code of 1986, as amended (the "Code"), as determined in accordance with temporary, proposed or final regulations, if any, promulgated under section 28OG of the Code, provided that increases in the Executive's "base amount" attributable to the exercise or settlement of stock options shall, if applicable, be disregarded for purposes of determining the amount described in this Section 9(b)(ii) (the "Severance Payment"); (iii) for the remaining stated period of this Agreement after the Date of Termination, the Company shall arrange to provide the Executive with life, disability, accident and health insurance benefits substantially similar to those which the Executive is receiving immediately prior to the Notice of Termination. Benefits otherwise receivable by the Executive pursuant to this Section 9(b)(iii) shall be reduced to the extent comparable benefits are actually received by the Executive during the period from the Date of Termination until the expiration of the stated term of the Agreement, and any such benefits actually received by the Executive shall be reported to the Company. If the benefits provided to the Executive under this Section 9(b)(iii) shall result in a decrease, pursuant to subsection (iv) of this Section 9(b), in the Severance Payment and such benefits are thereafter reduced pursuant to the immediately preceding sentence, the Company shall, at the time of such reduction, pay to the Executive the lesser of (a) the amount of such decrease in the Severance Payment (with interest at the rate provided in section 1274(b)(2)(B) of the Code from the Date of Termination) or (b) the maximum amount which can be paid to the Executive without being, or causing any other payment to be, nondeductible by reason of section 28OG of the Code; (iv) the Severance Payment shall be reduced by the amount of any other payment or the value of any benefit received or to be received by the Executive that, in the opinion of tax counsel ("Tax Counsel") selected by the Executive and acceptable to the Company's independent auditors, is likely to constitute a "parachute payment" under section 28OG(b)(2) of the Code (whether pursuant to the terms of this Agreement or any other plan, agreement or arrangement with the Company or any subsidiary, any person whose actions result in a change of control, or any person affiliated with the Company or such person) unless (A) the Executive shall have effectively waived his receipt or enjoyment of such payment or benefit prior to the date of payment of the Severance Payment, (B) or in the opinion of Tax Counsel, the Severance Payment (in its full amount or as partially reduced under this Section 9(b)(iv), as the case may be) plus all other payments or benefits that constitute "parachute payments" within the meaning of section 280(b)(2) of the Code are likely to be reasonable compensation for services actually rendered, within the meaning of section 28OG(b)(4) of the Code or are otherwise not likely to be subject to disallowance as a deduction by reason of section 28OG of the Code. The value of any noncash benefit or any deferred payment or benefit shall be determined by the Company's independent auditors in accordance with the principles of section 28OG(d)(3) and (4) of the Code; 4

9 (v) except to the extent that such payments and benefits would result (or, if paid after the Severance Payment, would have resulted), under subsection (iv) of this Section 9(b), in a reduction in the Severance Payment, (A) notwithstanding any provision of any Incentive Plan, the Company shall pay to the Executive a lump sum amount equal to the sum of (1) any incentive compensation which has been allocated or awarded to the Executive for a year or other measuring period preceding the Date of Termination but which has not yet been paid, and (2) a pro rata portion of the aggregate value of all contingent cash incentive compensation awards to the Executive for all uncompleted periods under an Incentive Plan calculated as to each such award by multiplying the maximum amount established for the Executive for such award under such Incentive Plan by a fraction the numerator of which is the number of months of the measuring period for such award elapsed prior to the Date of Termination and the denominator of which is the number of months in the measuring period; (B) with respect to shares of common stock of the Company that represent an unvested award of common stock of the Company for the benefit of the Executive under an Incentive Plan at the Date of Termination, the Executive shall receive from the Company with respect to each such unvested award the number of shares of common stock of the Company subject to such unvested award multiplied by a fraction the numerator of which is the number of months from the date of grant of such award until the Date of Termination and the denominator of which is the number of months from the date of grant of such award to the date of vesting of such award; and (C) in addition to the retirement benefits to which the Executive is entitled under all defined benefit plans in which the Executive is a participant on the Date of Termination (the "Retirement Plans"), the Company shall pay the Executive in one lump sum in cash an amount equal to the actuarial equivalent of the excess of (a) over (b), where (a) equals the aggregate retirement pension (determined as a straight life annuity) to which the Executive would have been entitled under the terms of the Retirement Plans, beginning at normal retirement age under the Plan (without regard to any amendment to the Retirement Plans made subsequent to the date of this Agreement, which amendment adversely affects in any manner the computation of the retirement benefits under the Retirement Plans, other than those amendments required by law to continue any qualification of the Retirement Plans), determined as if the Executive were fully vested thereunder and had accumulated (after any termination pursuant to Section 7 hereof) an additional period of service thereunder equal to the remaining term of this Agreement at the Executive's highest rate of earnings used in computing his retirement benefits under the Retirement Plans during the 12 months immediately preceding the Date of Termination; and where (b) equals the aggregate retirement pension (determined as a straight life annuity) to which the Executive is entitled pursuant to the provisions of the Retirement Plans, beginning at normal retirement age under the Plan; and for purposes of this provision, "actuarial equivalent" shall be determined using the same and assumptions utilized under the Midlantic Retirement Plan as of the date of this Agreement; and (vi) the Company shall also pay to the Executive all legal fees and expenses incurred by the Executive as a result of such termination (including all such fees and expenses, if any, reasonably incurred in contesting or disputing any such termination or in seeking to obtain or enforce any right or benefit provided by this Agreement). (c) BY COMPANY FOR CAUSE OR BY THE EXECUTIVE OTHER THAN FOR GOOD REASON. If the Executive's employment shall be terminated by the Company for Cause or by the Executive other than for Good Reason, then the Company shall pay the Executive his Base Salary (at the rate in effect at the time Notice of Termination is given) through the Date of Termination, and the Company shall have no additional obligations to the Executive under this Agreement except as set forth in subsection (d) of this Section 9. (d) COMPENSATION PLANS. Following any termination of the Executive's employment, the Company shall pay the Executive all unpaid amounts, if any, to which the Executive is entitled as of the Date of Termination under any compensation plan or program of the Company, at the time such payments are due. (e) TIME OF PAYMENTS. The lump sum payments provided for in Sections 9(b)(ii) and (v) hereof shall be made not later than the fifth day following the Date of Termination; provided, however, that if the amount of such payments cannot be finally determined on or before such day, the Company shall pay the Executive on such day an estimate, as determined in good faith by the Company, of the minimum amount of such payments and shall pay the remainder of such payments (together with interest at the rate provided in section 1274(b)(2)(B) of the Code) as soon as the amount thereof can be determined but in no event later than the thirtieth day after the Date of Termination. In the event that the amount of the estimated payments exceeds the amount subsequently determined to have been due, such excess shall constitute a loan by the Company to the Executive, payable on the fifth day after demand by the Company (together with interest at the rate provided in section 1274(b)(2)(B) of the Code). 5

10 10. MITIGATION. The Executive shall not be required to mitigate the amount of any payment or benefit provided for the Executive hereunder by seeking other employment or otherwise, nor shall the amount of any payment or benefit provided for the Executive hereunder be reduced by any compensation earned by the Executive as the result of employment by another employer, by retirement benefits, by offset against any amount claimed to be owed by the Executive to the Company or the Company, or otherwise, except as is specifically provided in Section 9(b)(iii) hereof. 11. CONFIDENTIAL INFORMATION; NONCOMPETITION REQUIREMENT. (a) CONFIDENTIAL INFORMATION. During the period of his employment hereunder, the Executive shall not, without the written consent of the Board or a person authorized thereby, disclose to any person, other than an employee of the Company or one of its subsidiaries or a person to whom disclosure is reasonably necessary or appropriate in connection with the performance by the Executive of his duties as an executive of the Company, any material confidential information obtained by him while in the employ of the Company or any of its subsidiaries with respect to any of the Company's or any of its subsidiary's products, customers, methods or future plans the disclosure of which he knows will be materially damaging to the Company; provided, however, that confidential information shall not include any information known generally to the public (other than as a result of unauthorized disclosure by the Executive) or any information of a type not otherwise considered confidential by persons engaged in the same business or a business similar to that conducted by the Company. For the period ending two years following the termination of employment hereunder, the Executive shall not disclose any confidential information of the type described above. The foregoing provisions of this Section 11(a) shall be binding upon the Executive's heirs, successors and legal representatives. (b) NONCOMPETITION REQUIREMENT. For a period of two (2) years following a termination of the Executive's employment (other than a termination of the Executive's employment by the Executive following a breach of this Agreement by the Company), the Executive agrees that, without the prior written consent of the Company, he shall not be connected as an officer, employee, partner, director or otherwise with any commercial bank or affiliate thereof that accepts deposits in the State of New Jersey or in Philadelphia, Montgomery, Delaware, Chester or Bucks counties, Pennsylvania (the "Restricted Region") if the Executive's responsibilities will relate directly and primarily to the conduct of business within the Restricted Region: provided, however, Section 11(b) shall not preclude the Executive from being an executive officer or a director of a commercial bank or affiliate thereof to whom other persons with such direct and primary responsibility shall report as long as the principal operations of such commercial bank or affiliate are not located in the Restricted Region. 12. SUCCESSORS; BINDING AGREEMENT. (a) COMPANY'S SUCCESSORS. The Company will require any successor (whether direct or indirect, by purchase, merger, consolidation or otherwise) to all or substantially all of the business and/or assets of the Company to expressly assume and agree to perform this Agreement in the same manner and to the same extent that the Company would be required to perform it if no such succession had taken place. Failure of the Company to obtain such assumption and agreement prior to the effectiveness of any such succession shall be a breach of this Agreement and shall entitle the Executive to compensation from the Company in the same amount and on the same terms as he would be entitled to hereunder if he terminated his employment for Good Reason (whether or not he does terminate his employment), except that for purposes of implementing the foregoing, the date on which any such succession becomes effective shall be deemed the Date of Termination. As used in this Agreement, "Company" shall mean the Company as hereinbefore defined and any successor to its business and/or assets as aforesaid which executes and delivers the agreement provided for in this Section 13 or which otherwise becomes bound by all the terms and provisions of this Agreement by operation of law. (b) THE EXECUTIVE'S SUCCESSORS. This Agreement and all rights of the Executive hereunder shall inure to the benefit of and be enforceable by the Executive's personal or legal representatives, executors, administrators, successors, heirs, distributees, devisees and legatees. If the Executive should die while any amounts would still be payable to him hereunder if he had continued to live, all such amounts unless otherwise provided herein shall be paid in accordance with the terms of this Agreement to the Executive's devisee, legatee, or other designee or, if there be no such designee, to the Executive's estate. 6

11 13. NOTICE. For the purposes of this Agreement, notices, demands and all other communications provided for in this Agreement shall be in writing and shall be deemed to have been duly given when delivered or (unless otherwise specified) mailed by United States certified or registered mail, return receipt requested, postage prepaid, addressed as follows: If to the Executive: Garry J. Scheuring 2 Woodmere Drive Summit, New Jersey 07901 7

12 If to the Company: PNC Bank Corp. One PNC Plaza Pittsburgh, Pennsylvania 15265 Attention: Executive Vice President--Finance and Administration or to such other address as any party may have furnished to the others in writing in accordance herewith, except that notices of change of address shall be effective only upon receipt. 14. MISCELLANEOUS. No provisions of this Agreement may be modified, waived or discharged unless such waiver, modification or discharge is agreed to in writing signed by the Executive and such officer of the Company, as may be specifically designated by its Board of Directors or its compensation committee. No waiver by either party hereto at any time of any breach by the other party hereto of, or compliance with, any condition or provision of this Agreement to be performed by such other party shall be deemed a waiver of similar or dissimilar provisions or conditions at the same or at any prior or subsequent time. No agreements or representations, oral or otherwise, express or implied, with respect to the subject matter hereof have been made by either party which are not set forth expressly in this Agreement. This Agreement shall be binding on all successors to the Company. The validity, interpretation, construction and performance of this Agreement shall be governed by the laws of the State of New Jersey without regard to its conflicts of law principles. All references to sections of the Securities Exchange Act of 1934, as amended, or the Code shall be deemed also to refer to any successor provisions to such sections. Any payments provided for hereunder shall be paid net of any applicable withholding required under federal, state or local law. The obligations of the Company under Section 9 hereof shall survive the expiration of the term of this Agreement. The compensation and benefits payable to the Executive under this Agreement shall be in lieu of any other severance benefits to which the Executive may otherwise be entitled upon his termination of employment under any severance plan, program, policy or arrangement of the Company. 15. VALIDITY. The invalidity or unenforceability of any provision or provisions of this Agreement shall not affect the validity or enforceability of any other provision of this Agreement, which shall remain in full force and effect. 16. COUNTERPARTS. This Agreement may be executed in one or more counterparts, each of which shall be deemed to be an original but all of which together will constitute one and the same instrument. 17. ENTIRE AGREEMENT. This Agreement sets forth the entire agreement of the parties hereto in respect of the subject matter contained herein and supersedes all prior agreements, promises, covenants, arrangements, communications, representations or warranties, whether oral or written, by any officer, employee or representative of any party hereto; and any prior agreement of the parties hereto in respect of the subject matter contained herein is hereby terminated and canceled. Without limiting the generality of the foregoing, this Agreement supersedes and replaces the Employment Agreement dated as of April 23, 1991 between Midlantic Corporation and the Executive. IN WITNESS WHEREOF, the parties have executed this Agreement on the date first above written. PNC BANK CORP. By: /s/ WALTER E. GREGG --------------------------- Name: Walter E. Gregg Title: Executive Vice President /s/ GARRY J. SCHEURING --------------------------- Garry J. Scheuring 8

1 EXHIBIT 10.8 PNC BANK CORP. 1996 EXECUTIVE INCENTIVE AWARD PLAN 1. GENERAL PURPOSES OF PLAN The PNC Bank Corp. 1996 Executive Incentive Award Plan is designed to (i) assist PNC Bank Corp. and its Subsidiaries in attracting, motivating, and retaining the senior executive officers most critical to the long-term success of the Corporation and its Subsidiaries, (ii) promote the identification of their interests with those of the Corporation's shareholders, and (iii) enable the Corporation to pay annual bonuses which are based upon the achievement of specified levels of performance and deductible for purposes of federal income taxation. 2. DEFINITIONS Terms not otherwise defined herein shall have the following meanings: 2.1 "Award Period" means the Corporation's fiscal year, except to the extent the Committee determines otherwise, provided that the last day of an Award Period must be the last day of the Corporation's fiscal year. 2.2 "Board" means the Board of Directors of the Corporation. 2.3 "Code" means the Internal Revenue Code of 1986, as amended. 2.4 "Committee" means the committee appointed by the Board to establish and administer the Plan as provided herein; provided, that the Committee shall have two or more members and each member of the Committee shall be an "outside director" as defined for purposes of Section 162(m) of the Code. Unless otherwise determined by the Board, the Personnel and Compensation Committee of the Board shall be the Committee. 2.5 "Compensation Pool" means, with respect to each Award Period, an amount equal to the sum of: (i) one-half of one percent of Net Income for the Award Period, plus (ii) any amounts not paid out of a Compensation Pool for the immediately preceding Award Period and added to the existing Compensation Pool, as determined in the Committee's sole discretion; provided, that component (ii) of a Compensation Pool shall not exceed an aggregate amount of $3 million during any given Award Period and shall be available for the payment of Incentive Awards only upon the achievement of one or more Performance Conditions. 2.6 "Corporation" means PNC Bank Corp. and its successors and assigns and any corporation which shall acquire substantially all of its assets. 2.7 "Incentive Award" means the share of the Compensation Pool paid to a Participant for an Award Period, as determined by the Committee in the manner described in Sections 3 and 5 hereof. 2.8 "Incentive Award Amount" means, with respect to each Participant, the amount, expressed as a percentage, of a Compensation Pool which he or she may be paid as an Incentive Award, as established by the Committee pursuant to Section 5.1. 2.9 "Net Income" means the consolidated pre-tax net income of the Corporation as determined in accordance with generally accepted accounting principles, after adjustment to exclude or include unusual, infrequently occurring or extraordinary items or cumulative effects of changes in accounting principles. 1

2 2.10 "Participant" means a "covered employee" within the meaning of Section 162(m) of the Code who is eligible to receive an Incentive Award, subject to the terms of the Plan. 2.11 "Performance Conditions" means any objective performance factors the Committee may deem relevant in determining the availability of amounts carried forward from the immediately preceding Award Period as described in Sections 5.2 and 5.4 hereof, including, but not limited to, the Corporation's return on average assets, return on average equity, earnings per share, or other financial measure or ratio, whether on an absolute basis or in comparison to a predetermined peer group. 2.12 "Plan" means the PNC Bank Corp. 1996 Executive Incentive Award Plan. 2.13 "Subsidiary" means a corporation of which at least 50% of the total combined voting power of all classes of stock is owned by the Corporation either directly or through one or more other subsidiaries. 3. ADMINISTRATION 3.1 Subject to the express provisions of the Plan, the Committee shall have plenary authority to interpret the Plan, to prescribe, amend and rescind rules and regulations relating to it and to make all other determinations deemed necessary or advisable for the administration of the Plan, including, but not limited to, determinations regarding whether to make Incentive Awards, the terms of all Incentive Awards, the Participants who receive Incentive Awards, the time or times at which Incentive Award Amounts are established, the Award Period to which each Incentive Award shall relate, and the actual dollar amount of any Incentive Award. The determinations of the Committee pursuant to this authority shall be conclusive and binding. The Committee may, in its discretion, authorize the Chief Executive Officer of the Corporation to act on its behalf, except with respect to matters relating to such Chief Executive Officer or which are required to be certified by the Committee under the Plan, or by Code Section 162(m) or the regulations promulgated thereunder. 4. ELIGIBILITY Incentive Awards may be made only to a Participant who is not paid an incentive award pursuant to the Corporation's 1994 Annual Incentive Award Plan or any successor plan, with respect to that Award Period. 5. INCENTIVE AWARDS; TERMS OF AWARDS; PAYMENT 5.1 No later than 90 days after the commencement of an Award Period, the Committee shall, in its sole discretion, establish in writing an Incentive Award Amount for each Participant for that Award Period. For this purpose, each Participant may be identified in terms of position or title held, or base salary paid, during that Award Period, or by such other means as the Committee may deem appropriate. No Participant shall be assigned an Incentive Award Amount greater than 35% of the Compensation Pool and the sum of all Incentive Award Amounts for an Award Period shall not exceed 100% of the Compensation Pool under any circumstances. 5.2 As soon as practicable following the end of an Award Period, but in all events prior to making any Incentive Awards, the Committee shall compute and certify in writing the size of the Compensation Pool for that Award Period, and shall determine whether any Performance Conditions established for that Award Period were satisfied. In performing such computation, the Committee may rely upon financial statements supplied by the Corporation's officers, provided that the Committee believes such statements to have been prepared in accordance with generally accepted accounting principles. 5.3 As soon as practicable following the Committee's completion of the actions specified in Section 5.2, the Committee shall certify in writing the Incentive Award, if any, to be made to each Participant for that Award Period and shall authorize the Corporation to make such Incentive Award to each Participant in accordance with the terms and conditions of the Plan. 2

3 5.4 In the event that the Committee does not exhaust the full amount of the Compensation Pool through the payment of Incentive Awards, the Committee may, in its sole discretion and no later than 90 days after the commencement of an Award Period, certify in writing that all or a portion of the remaining Compensation Pool shall be added to the Compensation Pool for the Award Period then commenced; provided, that the Committee shall not be authorized to direct any such carryover if the amount in question would exceed $3 million; and, provided further, that the Committee establishes one or more Performance Conditions that must be achieved during the Award Period in order for such carryover amount to be available for the payment of Incentive Awards for that Award Period. 5.5 The Committee may, in its sole discretion, determine not to make an Incentive Award or reduce an Incentive Award below the applicable Incentive Award Amount, without the consent of a Participant. Unless otherwise determined by the Committee, no Incentive Award shall be made to a Participant unless the Participant is employed by the Corporation or a Subsidiary as of the date of payment. 5.6 Incentive Awards shall be subject to applicable federal, state and local withholding taxes and other applicable withholding in accordance with the Corporation's payroll practices as in effect from time to time. 5.7 The Committee, subject to such terms and conditions as it may determine, and a Participant pursuant to any deferred compensation plan of the Corporation, shall have the right to defer the payment of an Incentive Award, provided, in either case, that any additional amounts credited to such deferred payment will be based either on a reasonable rate of interest or the actual rate of return of one or more predetermined investments. 6. TRANSFERABILITY Until paid to a Participant, Incentive Awards shall not be subject to the claims of creditors and may not be assigned, alienated, transferred or encumbered in any way other than by will or pursuant to the laws of descent and distribution. 7. TERMINATION OR AMENDMENT The Board may amend, modify or terminate the Plan in any respect at any time without the consent of the Participants. 8. EFFECTIVENESS OF PLAN AND AWARDS The Plan shall be void ab initio unless the Plan is approved by a vote of the Corporation's shareholders at the first meeting of the Corporation's shareholders following adoption of the Plan by the Board. 9. EFFECTIVE DATE; TERM OF THE PLAN Subject to shareholder approval pursuant to Section 8, the Plan shall be effective as of January 1, 1996 and the first Award Period shall be fiscal year 1996. The Plan shall remain in effect until terminated by the Board pursuant to Section 7. No Incentive Awards may be made under the Plan after its termination, provided that termination of the Plan shall not affect any Incentive Awards payable on or after the date of termination and such awards shall continue to be subject to the terms of the Plan notwithstanding its termination. 10. INDEMNIFICATION OF COMMITTEE In addition to such other rights of indemnification as they may have as Directors or as members of the Committee, each of the members of the Committee shall be indemnified by the Corporation against the 3

4 reasonable expenses, including attorneys' fees, actually and reasonably incurred in connection with the defense of any action, suit or proceeding, or in connection with any appeal therein, to which they or any of them may be a party by reason of any action taken or failure to act under or in connection with the Plan or any Incentive Award made hereunder, and against all amounts reasonably paid by them in settlement thereof or paid by them in satisfaction of a judgment in any such action, suit or proceeding to the maximum extent permitted by law. 11. GENERAL PROVISIONS 11.1 The establishment of the Plan shall not confer upon any Participant any legal or equitable right against the Corporation or any Subsidiary, except as expressly provided in the Plan. 11.2 The Plan does not constitute an inducement or consideration for the employment of any Participant, nor is it a contract between the Corporation, or any Subsidiary, and any Participant. Participation in the Plan shall not give a Participant any right to be retained in the employ of the Corporation or any Subsidiary. 11.3 Nothing contained in this Plan shall prevent the Board or Committee from adopting other or additional compensation arrangements, subject to shareholder approval if such approval is required, and such arrangements may be either generally applicable or applicable only in specific cases. 11.4 The Plan shall be governed, construed and administered in accordance with the laws of the Commonwealth of Pennsylvania. 4

1 EXHIBIT 11 CALCULATION OF PRIMARY AND FULLY DILUTED EARNINGS PER SHARE PNC BANK CORP. AND SUBSIDIARIES Year ended December 31 In thousands, except per share data 1995 1994 1993 1992 1991 - --------------------------------------------------------------------------------------------------------------------------- CALCULATION OF PRIMARY EARNINGS PER COMMON SHARE Income before cumulative effect of changes in accounting principles $408,060 $891,456 $878,948 $536,468 $(153,517) Cumulative effect of changes in accounting principles, net of tax benefits of $4,598, $5,343 and $77,458 (7,528) 19,569 (148,287) -------------------------------------------------------------- Net income 408,060 883,928 898,517 388,181 (153,517) Add: ESOP dividends tax benefit 2,680 1,985 Less: Preferred dividends declared 3,327 6,163 5,458 6,728 7,107 -------------------------------------------------------------- Net income applicable to primary earnings per common $404,733 $877,765 $893,059 $384,133 $(158,639) share Weighted average shares of common stock outstanding 336,455 342,308 336,485 305,819 273,467 Weighted average common shares to be issued using average market price and assuming: Exercise of stock options 2,679 2,906 4,286 3,304 Exercise of warrants 48 117 -------------------------------------------------------------- Primary weighted average common shares outstanding 339,134 345,214 340,819 309,240 273,467 ============================================================== PRIMARY EARNINGS PER COMMON SHARE Primary before cumulative effect of changes in accounting principles $1.19 $2.56 $2.56 $1.72 $(.58) Cumulative effect of changes in accounting principles (.02) .06 (.48) -------------------------------------------------------------- Primary earnings per common share $1.19 $2.54 $2.62 $1.24 $(.58) ============================================================== CALCULATION OF FULLY DILUTED EARNINGS PER COMMON SHARE Income before cumulative effect of changes in accounting principles $408,060 $891,456 $878,948 $536,468 $(153,517) Cumulative effect of changes in accounting principles, net of tax benefit of $4,598, $5,343 and $77,458 (7,528) 19,569 (148,287) -------------------------------------------------------------- Net income 408,060 883,928 898,517 388,181 (153,517) Add: Interest expense on convertible debentures 3,842 4,012 4,141 4,226 (net of tax) ESOP dividends tax benefit 2,680 1,985 Less: Dividends declared on non-convertible preferred stock 1,813 4,531 3,660 4,551 4,691 Dividends declared on convertible preferred stock 2,416 -------------------------------------------------------------- Net income applicable to fully diluted earnings per common share $410,089 $883,409 $898,998 $390,536 $(158,639) -------------------------------------------------------------- Weighted average shares of common stock outstanding 336,455 342,308 336,485 305,819 273,467 Weighted average commons shares to be issued using average market price or period-end market price, whichever is higher and assuming: Conversion of preferred stock Series A & B 198 225 256 296 Conversion of preferred stock Series C 616 681 748 870 Conversion of preferred stock Series D 815 859 946 1,186 Conversion of debentures 3,105 3,228 3,289 3,410 Exercise of stock options 3,733 2,917 4,415 4,632 Exercise of warrants 48 122 -------------------------------------------------------------- Fully diluted weighted average common shares outstanding 344,922 350,218 346,187 316,335 273,467 ============================================================== FULLY DILUTED EARNINGS PER COMMON SHARE Fully diluted before cumulative effect of changes in accounting principles $1.19 $2.54 $2.54 $1.70 $(.58) Cumulative effect of changes in accounting principles (.02) .06 (.47) -------------------------------------------------------------- Fully diluted earnings per common share $1.19 $2.52 $2.60 $1.23 $(.58) ===========================================================================================================================

1 EXHIBIT 12.1 PNC BANK CORP. AND SUBSIDIARIES COMPUTATION OF RATIO OF EARNINGS TO COMBINED FIXED CHARGES Year ended December 31 Dollars in thousands 1995 1994 1993 1992 1991 - ------------------------------------------------------------------------------------------------------------------------------- EARNINGS Income before taxes and cumulative effect of changes in accounting principles $627,012 $1,209,916 $1,140,487 $787,994 $(38,578) Fixed charges excluding interest on deposits 1,487,279 1,104,573 704,228 582,854 613,590 -------------------------------------------------------------------- Subtotal 2,114,291 2,314,489 1,844,715 1,370,848 575,012 Interest on deposits 1,551,816 1,159,242 1,005,658 1,546,576 2,739,565 -------------------------------------------------------------------- Total $3,666,107 $3,473,731 $2,850,373 $2,917,424 $3,314,577 ==================================================================== FIXED CHARGES Interest on notes and debentures $620,415 $556,432 $316,031 $201,977 $137,323 Interest on borrowed funds 834,654 514,133 360,288 353,633 449,107 Amortization of notes and debentures 927 1,761 1,418 1,505 1,119 Interest component of rentals 31,283 32,247 26,491 25,739 26,041 -------------------------------------------------------------------- Subtotal 1,487,279 1,104,573 704,228 582,854 613,590 Interest on deposits 1,551,816 1,159,242 1,005,658 1,546,576 2,739,565 -------------------------------------------------------------------- Total $3,039,095 $2,263,815 $1,709,886 $2,129,430 $3,353,155 ==================================================================== RATIO OF EARNINGS TO FIXED CHARGES Excluding interest on deposits 1.42x 2.10x 2.62x 2.35x .94x Including interest on deposits 1.21 1.53 1.67 1.37 .99 ===============================================================================================================================

1 PNC BANK CORP. AND SUBSIDIARIES EXHIBIT 12.2 COMPUTATION OF RATIO OF EARNINGS TO COMBINED FIXED CHARGES AND PREFERRED DIVIDENDS Year ended December 31 Dollars in thousands 1995 1994 1993 1992 1991 - ------------------------------------------------------------------------------------------------------------------------------- EARNINGS Income before taxes and cumulative effect of changes in accounting principles $627,012 $1,209,916 $1,140,487 $787,994 $(38,578) Fixed charges and preferred stock dividends excluding interest on deposits 1,492,391 1,112,564 712,339 592,902 624,000 -------------------------------------------------------------------- Subtotal 2,119,403 2,322,480 1,852,826 1,380,896 585,422 Interest on deposits 1,551,816 1,159,242 1,005,658 1,546,576 2,739,565 -------------------------------------------------------------------- Total $3,671,219 $3,481,722 $2,858,484 $2,927,472 $3,324,987 ==================================================================== FIXED CHARGES Interest on notes and debentures $620,415 $556,432 $316,031 $201,977 $137,323 Interest on borrowed funds 834,654 514,133 360,288 353,633 449,107 Amortization of notes and debentures 927 1,761 1,418 1,505 1,119 Interest component of rentals 31,283 32,247 26,491 25,739 26,041 Preferred stock dividend requirements 5,112 7,991 8,111 10,048 10,410 -------------------------------------------------------------------- Subtotal 1,492,391 1,112,564 712,339 592,902 624,000 Interest on deposits 1,551,816 1,159,242 1,005,658 1,546,576 2,739,565 -------------------------------------------------------------------- Total $3,044,207 $2,271,806 $1,717,997 $2,139,478 $3,363,565 ==================================================================== RATIO OF EARNINGS TO COMBINED FIXED CHARGES AND PREFERRED STOCK DIVIDENDS Excluding interest on deposits 1.42x 2.09x 2.60x 2.33x .94x Including interest on deposits 1.21 1.53 1.66 1.37 .99 ===============================================================================================================================

1 EXHIBIT 13 Index to Financial Information CORPORATE FINANCIAL REVIEW 1995 VERSUS 1994 23 Overview 23 Mergers and Acquisitions 24 Income Statement Review 27 Balance Sheet Review 31 Financial Derivatives 35 Line of Business Results 39 Risk Management 1994 VERSUS 1993 43 Overview 43 Mergers and Acquisitions 43 Income Statement Review 44 Balance Sheet Review REPORTS ON CONSOLIDATED FINANCIAL STATEMENTS 45 Management's Report on the Financial Reporting Internal Control Structure 45 Report of Ernst & Young LLP, Independent Auditors CONSOLIDATED FINANCIAL STATEMENTS 46 Consolidated Balance Sheet 47 Consolidated Statement of Income 48 Consolidated Statement of Changes in Shareholders' Equity 49 Consolidated Statement of Cash Flows NOTES TO CONSOLIDATED FINANCIAL STATEMENTS 50 Accounting Policies 53 Mergers and Acquisitions 53 Cash Flows 54 Securities 55 Loans and Commitments to Extend Credit 56 Nonperforming Assets 56 Allowance for Credit Losses 56 Premises, Equipment and Leasehold Improvements 57 Intangible Assets and Mortgage Servicing Rights 57 Notes and Debentures 58 Shareholders' Equity 58 Financial Derivatives 62 Special Charges 62 Employee Benefit Plans 64 Incentive Plans 65 Income Taxes 65 Regulatory Matters 66 Litigation 66 Other Financial Information 68 Unused Line of Credit 69 Fair Values of Financial Instruments STATISTICAL INFORMATION 71 Selected Consolidated Financial Data 72 Selected Quarterly Financial Data 73 Analysis of Year-to-Year Changes in Net Interest Income 74 Average Consolidated Balance Sheet and Net Interest Analysis 76 Securities 77 Loans 78 Nonperforming Assets 78 Past Due Loans 79 Allowance for Credit Losses 80 Maturity of Time Deposits of $100,000 or More 81 Borrowed Funds 81 Taxable-Equivalent Adjustment

2 CORPORATE FINANCIAL REVIEW 1995 VERSUS 1994 The merger between PNC Bank Corp. and Midlantic Corporation ("Midlantic") was completed on December 31, 1995 and accounted for as a pooling of interests. Accordingly, all financial information has been restated as if the companies were combined for all periods presented. The Corporate Financial Review should be read in conjunction with the PNC Bank Corp. and subsidiaries ("Corporation") Consolidated Financial Statements and Statistical Information included herein. OVERVIEW Net income for 1995 totaled $408.1 million, or $1.19 per fully diluted share, compared with $883.9 million, or $2.52 per fully diluted share, for 1994. Returns on average assets and average common shareholders' equity for 1995 were .54 percent and 7.05 percent, respectively. The 1995 results include $380.2 million of after-tax charges recorded in connection with the Midlantic merger and actions taken to reposition the Corporation's balance sheet. Excluding these charges, 1995 earnings were $788.3 million, or $2.29 per fully diluted share. On this basis, returns on average assets and average common shareholders' equity were 1.05 percent and 13.67 percent, respectively. The financial results for 1995 include the impact of several major initiatives. The Midlantic and Chemical Bank New Jersey ("Chemical") transactions moved the Corporation into the second and third largest retail deposit market share positions in Philadelphia and New Jersey, respectively. The in-market nature of these transactions is expected to generate substantial economies by reducing costs associated with overlapping and duplicative operations and provide opportunities to enhance revenues through marketing of the Corporation's products and services to a new customer base. The acquisitions also provided a more stable consumer deposit funding base, reducing the need for wholesale funding, and added attractive middle-market and consumer assets. The Corporation accelerated and substantially completed the balance sheet repositioning begun in the latter half of 1994. The securities portfolio and related reliance on wholesale funding were significantly reduced. At year-end 1995, securities represented 23.7 percent of earning assets compared with 33.9 percent at the end of 1994. Wholesale funding, which includes brokered and foreign deposits, borrowed funds and certain notes and debentures, was reduced to 28.2 percent of total sources of funds compared with 35.9 percent a year ago. In addition, the Corporation terminated $15.1 billion notional value of financial derivative contracts. Asset management capabilities were strengthened with the acquisition of BlackRock Financial Management, L.P. ("BlackRock"), which brought extensive fixed-income investment management capabilities to the Corporation. The Corporation continued to invest in operating platforms and alternative retail delivery systems. The National Financial Services Center, a state-of-the-art telebanking center, strengthened the Corporation's ability to deliver cost-effective services and products. In addition, strategic alliances designed to leverage delivery capabilities were implemented in the credit card and merchant processing businesses. In January 1996, an agreement was entered into with the American Automobile Association to offer financial services and products to the organization's 34 million members. These services and products will be offered nationally and leverage the Corporation's alternative delivery capabilities. MERGERS AND ACQUISITIONS On December 31, 1995, Midlantic, a bank holding company with $13.6 billion in assets, merged with the Corporation. Each outstanding share of Midlantic common stock was converted into 2.05 shares of the Corporation's common stock. Approximately 112 million shares of the Corporation's common stock were issued in connection with the merger. The transaction was accounted for as a pooling of interests. On October 6, 1995, the Corporation acquired Chemical's franchise in southern and central New Jersey with total assets of $3.2 billion and retail core deposits of $2.7 billion. No nonperforming assets were acquired. The Corporation paid $492 million in cash and the transaction was accounted for under the purchase method. In February 1995, the Corporation acquired BlackRock, a New York-based, fixed-income investment management firm with approximately $25 billion in assets under management at closing. The Corporation paid $71 million in cash and issued $169 million of unsecured notes and accounted for the transaction under the purchase method. 23

3 CORPORATE FINANCIAL REVIEW 1995 VERSUS 1994 INCOME STATEMENT REVIEW INCOME STATEMENT HIGHLIGHTS Year ended December 31 Change ------------------- Dollars in millions 1995 1994 Amount Percent - ----------------------------------------------------------------------------- Net interest income (taxable-equivalent basis) $2,189 $2,530 $(341) (13.5)% Provision for credit losses 6 84 (78) (92.9) Noninterest income before net securities losses 1,241 1,181 60 5.1 Net securities losses (280) (142) (138) (97.2) Noninterest expense before special charges 2,209 2,190 19 .9 Special charges 260 48 212 NM Net income 408 884 (476) (53.8) - ----------------------------------------------------------------------------- NM - not meaningful NET INTEREST INCOME Net interest income is the difference between interest income and interest expense. The level and volatility of interest rates affect interest received or paid on assets, liabilities and off-balance-sheet financial instruments and, as a result, impact net interest income. NET INTEREST INCOME Year ended December 31 Taxable-equivalent basis Change ------------------ Dollars in millions 1995 1994 Amount Percent - --------------------------------------------------------------------------------- Interest income/expense before financial derivatives Interest income $5,224 $4,600 $ 624 13.6% Loan fees 82 83 (1) (1.2) Taxable-equivalent adjustment 47 38 9 23.7 ------------------------------- Total interest income 5,353 4,721 632 13.4 Interest expense 2,979 2,320 659 28.4 ------------------------------- Net interest income before financial derivatives 2,374 2,401 (27) (1.1) Effect of financial derivatives on Interest income (157) 41 (198) (482.9) Interest expense 28 (88) 116 131.8 ------------------------------- Total effect of financial derivatives (185) 129 (314) (243.4) ------------------------------- Net interest income $2,189 $2,530 $(341) (13.5) - --------------------------------------------------------------------------------- Taxable-equivalent net interest income totaled $2.2 billion in 1995 compared with $2.5 billion a year earlier. The net interest margin, the ratio of taxable-equivalent net interest income to average earning assets, was 3.15 percent compared with 3.64 percent in 1994. In the year-to-year comparison, interest income increased due to higher loan volume and yields, partially offset by a reduction in the securities portfolio. The growth in interest income was offset by higher expense on deposits and borrowings, which was primarily due to higher interest rates. During 1995, net interest income and margin were adversely impacted by interest rate swaps and caps. During the fourth quarter of 1995, the Corporation terminated $5.1 billion notional value of pay-fixed interest rate swaps and $5.5 billion notional value of interest rate caps. Such actions substantially reduced the adverse impact of these instruments on net interest income and margin. Management expects these actions to favorably impact net interest income and margin in 1996 compared with 1995. NET INTEREST MARGIN Year ended December 31 Basis Point Taxable-equivalent basis 1995 1994 Change - ----------------------------------------------------------------------------- Book-basis yield on earning assets 7.51% 6.63% 88 bp Effect of loan fees .12 .12 Taxable-equivalent adjustment .07 .05 2 --------------------------- Taxable-equivalent yield on earning assets 7.70 6.80 90

Rate on interest-bearing liabilities 5.06 3.96 110 --------------------------- Interest rate spread 2.64 2.84 (20) Noninterest-bearing sources .78 .59 19 --------------------------- Net interest margin before financial derivatives 3.42 3.43 (1) Effect of financial derivatives on Interest income (.23) .06 (29) Interest expense .04 (.15) 19 --------------------------- Total effect of financial derivatives (.27) .21 (48) --------------------------- Net interest margin 3.15% 3.64% (49)bp - ----------------------------------------------------------------------------- PROVISION FOR CREDIT LOSSES The provision for credit losses totaled $6.0 million in 1995 compared with $83.5 million in 1994 reflecting improved asset quality during the year. Based on the current risk profile of the loan portfolio, management does not expect to record a provision for credit losses during 1996. Should the risk profile of the loan portfolio or the economy deteriorate, asset quality may be adversely impacted and a provision for credit losses may be required. 24

4 NONINTEREST INCOME Noninterest income before net securities losses totaled $1.2 billion in 1995, a 5.1 percent increase compared with the prior year. Excluding net securities losses, noninterest income was 36.2 percent of total revenue in 1995 compared with 31.8 percent a year earlier. NONINTEREST INCOME Year ended December 31 Change --------------- Dollars in millions 1995 1994 Amount Percent - ----------------------------------------------------------------------------- Investment management and trust Trust $ 266 $223 $43 19.3% Mutual funds 154 112 42 37.5 --------------------------- Total investment management and trust 420 335 85 25.4 Service fees Deposit 240 242 (2) (.8) Credit card and merchant 47 60 (13) (21.7) Corporate finance 53 50 3 6.0 Brokerage 42 34 8 23.5 Consumer 52 44 8 18.2 Insurance 25 22 3 13.6 Other 36 38 (2) (5.3) --------------------------- Total service fees 495 490 5 1.0 Mortgage banking Servicing 120 122 (2) (1.6) Sale of servicing 34 61 (27) (44.3) Marketing 33 16 17 106.3 --------------------------- Total mortgage banking 187 199 (12) (6.0) Other 139 157 (18) (11.4) --------------------------- Total noninterest income before securities losses 1,241 1,181 60 5.1 Net securities losses (280) (142) (138) (97.2) --------------------------- Total $ 961 $1,039 $ (78) (7.5) - ----------------------------------------------------------------------------- During 1995, investment management and trust revenue increased $84.8 million, or 25.4 percent, to $420.2 million. BlackRock contributed $57.1 million of the increase, and the remainder was attributable to new business and an increase in the value of administered assets. The following table sets forth investment management and trust revenue generated by line of business. INVESTMENT MANAGEMENT AND TRUST REVENUE BY LINE OF BUSINESS Year ended December 31 In millions 1995 1994 - ------------------------------------------------------------------- Trust Consumer Banking $172 $159 Corporate Banking 51 52 Asset Management 43 12 ------------------ Total trust 266 223 Mutual funds Asset Management 154 112 ------------------ Total $420 $335 - ------------------------------------------------------------------- At December 31, 1995, assets under administration totaled $282 billion, of which $96 billion were discretionary. The comparable amounts at year-end 1994 were $221 billion and $57 billion, respectively. The BlackRock acquisition added approximately $25 billion of discretionary assets at closing. Service fees increased $4.9 million in 1995 compared with a year ago. Deposit services revenue declined as corporate customers used compensating balances in lieu of paying service charges. The decline in credit card and merchant services fees reflects the impact of agreements with third parties to provide certain administrative, marketing, data processing and customer support services for the Corporation's credit card business. Excluding the effect of these agreements, credit card and merchant services fees increased $5.8 million or 9.7 percent in the year-to-year comparison. During 1995, corporate finance fees increased 6.0 percent reflecting higher syndication volume. Brokerage fee income increased 23.5 percent due to higher transaction volumes. Consumer fee income, which includes revenue from

automated teller machines ("ATM"), safe deposit services, and other sources, increased $8.1 million, or 18.2 percent. The increase was primarily due to higher ATM usage. Insurance revenue increased 13.6 percent due to higher annuity sales. During 1995, mortgage banking revenue decreased $11.9 million to $186.6 million primarily due to lower gains from servicing sales. Marketing gains increased due to a change in the method of accounting for the value of originated mortgage servicing rights ("MSR"). In 1995, the Corporation adopted new accounting guidance which provides for the immediate recognition of the value of originated MSR. In 1995, the Corporation recorded gains from originated MSR totaling $37.1 million. 25

5 CORPORATE FINANCIAL REVIEW 1995 VERSUS 1994 During 1995, other income totaled $138.7 million, a decrease of $18.2 million compared with the prior year. A gain of $11.2 million, included in other noninterest income, from instruments used to hedge the economic value of MSR was offset by a $10.9 million MSR impairment charge included in noninterest expense. Excluding the mortgage-related hedge gain, other income decreased $29.4 million, primarily due to nonrecurring gains in 1994 from Midlantic's sales of assets held for accelerated disposition. Net securities losses totaled $279.7 million in 1995 and were primarily associated with actions taken in the fourth quarter of 1995 to accelerate the Corporation's balance sheet repositioning begun in the latter half of 1994. Approximately $6.0 billion of securities were sold at a loss of $61.3 million. In connection with the sales, losses totaling $228.2 million were recognized on terminated pay-fixed interest rate swaps designated to such securities. During 1994, net securities losses totaled $141.6 million. NONINTEREST EXPENSE Noninterest expense before special charges increased .9 percent, or $19.0 million, in 1995. The increase reflects lower deposit insurance premiums, successful acquisition integration and continued emphasis on developing alternative lower-cost delivery systems and rationalizing the traditional branch delivery system. Excluding the impact of acquisitions, special charges and the benefit of lower deposit insurance premiums, noninterest expense decreased 1.8 percent in the comparison. NONINTEREST EXPENSE Change Year ended December 31 ------------------ Dollars in millions 1995 1994 Amount Percent - ----------------------------------------------------------------------------- Compensation $ 863 $ 838 $ 25 3.0% Employee benefits 202 203 (1) (.5) ------------------------------- Total staff expense 1,065 1,041 24 2.3 Net occupancy 180 180 Equipment 166 154 12 7.8 Intangible asset and MSR amortization 115 86 29 33.7 Federal deposit insurance 58 102 (44) (43.1) Taxes other than income 53 48 5 10.4 Other 572 579 (7) (1.2) ------------------------------- Total noninterest expense before special charges 2,209 2,190 19 .9 Special charges 260 48 212 NM ------------------------------- Total $2,469 $2,238 $231 10.3% - ----------------------------------------------------------------------------- NM - Not meaningful Staff expense increased 2.3 percent in the year-to-year comparison due to acquisitions. Excluding acquisitions, staff expense decreased 2.1 percent. Amortization of intangible assets and MSR increased $28.4 million due to the BlackRock and Chemical acquisitions and MSR impairment. The decline in Federal deposit insurance reflects a reduction in the Bank Insurance Fund premium. Approximately $5.3 billion of the Corporation's deposits insured by the Savings Association Insurance Fund ("SAIF") continue to be assessed a higher rate. There are several proposals for legislative action to address recapitalization of the SAIF including a significant one-time assessment. Management currently cannot predict the outcome of these proposals or the effect, if any, on the Corporation. In connection with the Midlantic merger, the Corporation recorded special charges of $260 million consisting of $89 million to eliminate duplicate operations and facilities, $42 million for employee severance and related costs, $49 million for professional services and various other costs incidental to the merger and $80 million for termination of an interest rate cap position. In 1994, the Corporation recorded special charges totaling $48 million in connection with the consolidation of seven telebanking centers and rationalization of retail delivery systems. INCOME TAX EXPENSE Income tax expense totaled $219.0 million in 1995 compared with $318.5 million in 1994. The effective tax rates were 34.9 percent and 26.3 percent in 1995 and 1994, respectively. The lower effective tax rate in 1994 was primarily due to a $106.8 million benefit from the

realization of Midlantic's previously unrecognized deferred tax assets. Income tax expense for 1995 included a $15.0 million writedown of state deferred tax assets related to the Midlantic merger. 26

6 BALANCE SHEET REVIEW BALANCE SHEET HIGHLIGHTS Change December 31 ------------------- In millions 1995 1994 Amount Percent - ----------------------------------------------------------------------------- Assets $73,404 $77,461 $(4,057) (5.2)% Earning assets 66,772 69,751 (2,979) (4.3) Loans, net of unearned income 48,653 44,043 4,610 10.5 Securities 15,839 23,670 (7,831) (33.1) Deposits 46,899 45,818 1,081 2.4 Borrowed funds 8,665 12,193 (3,528) (28.9) Notes and debentures 10,398 12,127 (1,729) (14.3) Shareholders' equity 5,768 5,727 41 .7 - ----------------------------------------------------------------------------- In 1995, the Corporation substantially reduced the securities portfolio and level of related wholesale funding and, with the Midlantic and Chemical acquisitions, significantly increased retail core deposit liabilities. Selected balance sheet composition ratios are set forth in the following table. BALANCE SHEET COMPOSITION December 31 1995 1994 - ----------------------------------------------------------------------------- Loans to earning assets 72.9% 63.1% Securities to earning assets 23.7 33.9 Loans to deposits 103.7 96.1 Deposits to total sources of funds 63.9 59.1 Deposits to interest-bearing liabilities 84.9 76.0 Wholesale funds to total sources of funds 28.2 35.9 - ----------------------------------------------------------------------------- Total assets and earning assets were $73.4 billion and $66.8 billion, respectively, at December 31, 1995 compared with $77.5 billion and $69.8 billion at year-end 1994. The declines reflect the securities portfolio downsizing partially offset by loan growth. The securities portfolio declined $7.8 billion to $15.8 billion at December 31, 1995, and loans totaled $48.7 billion at year-end 1995, compared with $44.0 billion a year ago. LOANS During 1995, loans increased $4.6 billion, or 10.5 percent. The ratio of loans to earning assets increased to 72.9 percent at year-end 1995 compared with 63.1 percent a year ago. Excluding purchase acquisitions, average loans increased 4.8 percent, primarily due to consumer and residential mortgage loan growth. The Corporation's focus with respect to the loan portfolio was to increase the proportion of such loans to total loans and to change the composition to improve overall returns on invested capital. LOANS December 31 In millions 1995 1994 - ----------------------------------------------------------------------------- Consumer Home equity $ 4,541 $ 3,896 Automobile 4,236 3,508 Student 1,512 1,311 Credit card 1,004 838 Other 2,246 2,298 ------------------------ Total consumer 13,539 11,851 Residential mortgage 11,689 9,746 Commercial Manufacturing 3,363 3,148 Retail/Wholesale 3,148 2,828 Service providers 2,402 2,174 Communications 1,083 1,239 Financial services 1,082 911 Real estate related 1,291 1,154 Health care 1,028 729 Public utilities 335 310 Other 3,080 3,052 ------------------------ Total commercial 16,812 15,545 Commercial real estate Commercial mortgage 2,775 2,837 Medium-term financings 1,250 1,432 Construction and development 889 794 ------------------------ Total commercial real estate 4,914 5,063 Other 2,102 2,223 Unearned income (403) (385) ------------------------ Total loans, net of unearned income $48,653 $44,043

- ----------------------------------------------------------------------------- Consumer loan outstandings increased 14.2 percent to $13.5 billion at December 31, 1995. The growth in consumer loans was primarily due to initiatives to increase the Corporation's credit card business and the impact of acquisitions. These increases were partially offset by reductions in the indirect automobile portfolio. Residential mortgages increased 19.9 percent. As part of the mortgage banking business, the Corporation retained for portfolio certain originated mortgages, generally adjustable rate mortgages with fixed initial terms of three, five, seven or ten years. The remainder of originations were securitized and sold, generally with servicing rights retained. Excluding the impact of initiatives to reduce certain low- spread loans, total commercial loan outstandings increased approximately $2.0 billion from year-end 1994. 27

7 CORPORATE FINANCIAL REVIEW 1995 VERSUS 1994 Commercial real estate exposure decreased slightly since year- end 1994. Medium-term financings and construction and development loans primarily consist of retail and office, multi- family, hotel/motel and residential projects. Approximately 82 percent of total commercial real estate outstandings are located in the Corporation's primary markets with the remaining projects geographically dispersed throughout the United States. LOAN PORTFOLIO COMPOSITION December 31 Percent of gross loans 1995 1994 - -------------------------------------------------------------- Consumer 27.6% 26.7% Residential mortgage 23.8 21.9 Commercial 34.3 35.0 Commercial real estate 10.0 11.4 Other 4.3 5.0 --------------- Total 100.0% 100.0% - -------------------------------------------------------------- Unfunded commitments represent agreements to lend funds under specified terms provided no violations of specified contractual conditions exist. Most commercial commitments expire unfunded and, therefore, cash requirements are substantially less than the total commitment. Unfunded commitments are net of participations and syndications. Growth in commercial unfunded commitments during 1995 was broad based and totaled $3.5 billion, or 16.8 percent. In addition, the Corporation had letters of credit outstanding totaling $4.5 billion and $4.6 billion at December 31, 1995 and December 31, 1994, respectively, primarily consisting of standby letters of credit. NET UNFUNDED COMMITMENTS TO EXTEND CREDIT December 31 In millions 1995 1994 - -------------------------------------------------------------- Consumer $ 7,335 $ 6,050 Residential mortgage 554 769 Commercial 24,282 20,794 Commercial real estate 751 669 Other 892 917 ----------------- Total $33,814 $29,199 - -------------------------------------------------------------- SECURITIES During 1995, the Corporation reduced the size of the securities portfolio relative to earning assets. The securities portfolio was reduced by $7.8 billion to $15.8 billion at December 31, 1995, and represented 23.7 percent of earning assets, compared with 33.9 percent a year ago. At year-end 1995, all securities were classified as available for sale. Securities classified as available for sale may be sold as part of the overall asset/liability management process. Realized gains and losses resulting from such sales would be reflected in the results of operations and would include the fair value of associated financial derivatives. In connection with implementing new accounting guidance issued in November 1995, the Corporation reassessed the classifications of investment securities. All securities previously classified as held to maturity were reclassified to the available-for-sale portfolio. The reclassifications were accounted for at fair value and included the fair value of associated financial derivatives. Subsequent to reclassifying the securities portfolio, to accelerate the balance sheet repositioning begun in the latter half of 1994, the Corporation sold $1.9 billion of U.S. Treasury securities and $4.1 billion of collateralized mortgage obligations at a loss of $61.3 million. In connection with the sales, losses totaling $228.2 million were recognized on terminated pay-fixed interest rate swaps with a notional value of $5.1 billion that were designated to such securities. At December 31, 1995, the securities portfolio included $6.2 billion of collateralized mortgage obligations and $2.4 billion of mortgage-backed securities. The characteristics of these investments include principal guarantees, primarily by U.S. Government agencies, and marketability. Expected lives of such securities can vary as interest rates change. In a declining interest rate environment, prepayments on the underlying mortgages may accelerate and, therefore, shorten the expected lives. Conversely, expected lives would lengthen in a rising interest rate environment. The Corporation monitors the

impact of this risk through the use of an income simulation model as part of the asset/liability management process. Other U.S. Government agencies securities and asset-backed private placements represent AAA-rated, variable-rate instruments. The interest rates on these instruments float with various indices and are limited by periodic and maximum caps. These securities have an initial specified term. At the end of the initial term the maturity may be extended or the security may be called at the option of the issuer. Other mortgage-related debt securities consist primarily of private label collateralized mortgage obligations. 28

8 SECURITIES 1995 1994 --------------------------------------- ------------------------------------- Unrealized Unrealized December 31 Amortized ---------------- Fair Amortized ------------- Fair In millions Cost Gains Losses Value Cost Gains Losses Value - ------------------------------------------------------------------------------------------------------------------------------- Securities available for sale Debt securities U.S. Treasury $ 3,211 $ 69 $ 3,280 $ 671 $ 8 $ 663 U.S. Government agencies and corporations Mortgage related 7,510 24 $75 7,459 2,161 69 2,092 Other 1,030 5 1 1,034 25 4 21 State and municipal 343 25 1 367 8 1 7 Asset-backed private placement 1,597 7 1,604 Other debt Mortgage related 1,121 2 10 1,113 749 17 732 Other 525 3 3 525 149 $2 5 146 Corporate stocks and other 455 4 2 457 133 2 6 129 ------------------------------------------------------------------------------------ Total securities available for sale 15,792 139 92 15,839 3,896 4 110 3,790 Investment securities Debt securities U.S. Treasury 3,317 121 3,196 U.S. Government agencies and corporations Mortgage related 11,795 1 1,088 10,708 Other 1,000 28 972 State and municipal 360 12 2 370 Asset-backed private placement 1,597 33 1,564 Other debt Mortgage related 726 43 683 Other 775 20 755 Other 310 1 311 ----------------------------------- Total investment securities 19,880 14 1,335 18,559 ------------------------------------------------------------------------------------ Total securities $15,792 $139 $92 $15,839 $23,776 $18 $1,445 $22,349 - ------------------------------------------------------------------------------------------------------------------------------- At December 31, 1995, $6.1 billion notional value of interest rate swaps and caps were associated with securities available for sale. The fair value of securities available for sale at year- end 1995 set forth above includes unrealized gains of $6 million on related derivatives. No financial derivatives were designated to securities available for sale at year-end 1994. Interest rate swaps and caps with a notional value of $11.1 billion, fair value of $204 million and carrying value of $130 million were designated to investment securities at December 31, 1994. The fair value of these derivatives is not included in the values set forth above. SECURITIES EXPECTED MATURITY DISTRIBUTION Year ended December 31 Amortized In millions Cost - -------------------------------------------------------------- 1996 $6,590 1997 2,619 1998 and beyond 6,583 ------- Total $15,792 - -------------------------------------------------------------- The expected weighted average life of the securities portfolio was 2 years and 8 months at December 31, 1995 compared with 3 years and 11 months at year-end 1994. 29

9 CORPORATE FINANCIAL REVIEW 1995 VERSUS 1994 FUNDING SOURCES During 1995, the use of wholesale funding, which includes brokered and foreign deposits, borrowed funds and certain notes and debentures, was reduced. At December 31, 1995, the ratio of wholesale funding to total sources of funds was 28.2 percent compared with 35.9 percent a year ago. The ratio of deposits to total sources of funds increased to 63.9 percent compared with 59.1 percent a year ago. The composition of the Corporation's funding sources will vary depending on management's evaluation of the most cost- effective funding alternatives. FUNDING SOURCES December 31 In millions 1995 1994 - -------------------------------------------------------------- Deposits Demand, savings and money market $27,145 $27,079 Time 18,661 16,125 Foreign 1,093 2,614 ----------------- Total deposits 46,899 45,818 Borrowed funds Federal funds purchased 3,817 2,219 Repurchase agreements 2,851 4,302 Commercial paper 753 1,226 Treasury, tax and loan 567 1,989 Other 677 2,457 ----------------- Total borrowed funds 8,665 12,193 Notes and debentures Bank notes 6,256 8,825 Federal Home Loan Bank 2,393 1,384 Other 1,749 1,918 ----------------- Total notes and debentures 10,398 12,127 ----------------- Total funding sources $65,962 $70,138 - -------------------------------------------------------------- DEPOSITS During 1995, total deposits increased $1.1 billion, or 2.4 percent. A $2.5 billion increase in time deposits was partially offset by a $1.5 billion decrease in foreign deposits. The Chemical acquisition added $2.7 billion of deposits in the fourth quarter of 1995. Brokered deposits totaled $2.3 billion at December 31, 1995 compared with $2.8 billion at December 31, 1994. Retail brokered deposits, which are issued or participated-out by brokers in denominations of $100,000 or less, represented 77.8 percent of total brokered deposits at December 31, 1995 compared with 76.8 percent at year-end 1994. BORROWED FUNDS AND NOTES AND DEBENTURES Total borrowed funds and notes and debentures decreased $5.3 billion from year-end 1994 primarily due to the balance sheet repositioning. Management believes the Corporation has sufficient liquidity to meet its obligations to customers, debtholders and others. The impact of maturing liabilities is reflected in the income simulation model used in the Corporation's overall asset/liability management process. CAPITAL Acquisition capability, funding alternatives, new business activities, deposit insurance costs, and the level and nature of expanded regulatory oversight depend, in large part, on a financial institution's capital strength. The Corporation manages its capital position primarily through the issuance of debt and equity instruments, treasury stock activities, dividend policies and retained earnings. RISK-BASED CAPITAL AND CAPITAL RATIOS December 31 Dollars in millions 1995 1994 - -------------------------------------------------------------- CAPITAL COMPONENTS Shareholders' equity $ 5,768 $ 5,727 Goodwill and other intangibles (980) (458) Net unrealized securities (gains) losses (26) 122 ----------------- Tier I risk-based capita 4,762 5,391 Subordinated debt 1,370 1,025 Eligible allowance for credit losses 750 727 ----------------- Total risk-based capital $ 6,882 $ 7,143 -----------------

ASSETS Risk-weighted assets and off- balance-sheet instruments $59,539 $57,578 Average tangible assets 74,756 75,883 ----------------- CAPITAL RATIOS Tier I risk-based capital 8.00% 9.36% Total risk-based capital 11.56 12.41 Leverage 6.37 7.10 - -------------------------------------------------------------- The minimum regulatory capital ratios are 4.00 percent for Tier I, 8.00 percent for total risk-based and 3.00 percent for leverage. However, regulators may require higher capital levels when a bank's particular circumstances warrant. To be classified as well capitalized, regulators require capital ratios of 6.00 percent for Tier I, 10.00 percent for total risk-based and 5.00 percent for leverage. At December 31, 1995, the Corporation and each of its bank affiliates were classified as well capitalized. Tier I risk-based capital declined during 1995 primarily due to an increase in acquisition-related intangibles. 30

10 During 1995, the Corporation repurchased 6.5 million common shares pursuant to a stock repurchase plan authorized by the board of directors in January 1995. The Corporation has not repurchased any shares since the initiation of the Midlantic merger due to constraints associated with the pooling of interests method of accounting. Future share repurchases, if any, are dependent on a number of additional factors including capital adequacy, level of future earnings, balance sheet growth and alternative capital reinvestment opportunities. FINANCIAL DERIVATIVES FINANCIAL DERIVATIVES The Corporation uses a variety of off- balance-sheet financial derivatives as part of its overall interest rate risk management process and to manage risk associated with mortgage banking activities. During 1995, the notional value of financial derivatives was reduced by $9.8 billion. In connection with asset and liability management objectives, the Corporation terminated $4.6 billion notional value of receive-fixed index amortizing interest rate swaps and $5.1 billion notional value pay-fixed interest rate swaps. In connection with the Midlantic merger, the Corporation terminated a $5.5 billion notional value interest rate cap position that reduced exposure to higher interest rates within a specified range. The terminated caps were replaced with contracts that reduce exposure to rates above a specified rate without limitation. FINANCIAL DERIVATIVES ACTIVITY January 1 Maturities/ December 31 In millions 1995 Additions Amortization Terminations 1995 - ---------------------------------------------------------------------------------------------------------------------------------- Interest rate risk management Interest rate swaps Receive-fixed index amortizing $11,400 $ (3,624) $ (4,565) $ 3,211 Received-fixed 2,644 $ 1,639 (1,498) 2,785 Pay-fixed 6,317 3,700 (2,320) (5,068) 2,629 Basis swaps 300 465 765 Interest rate caps 5,500 5,515 (5) (5,500) 5,510 Eurodollar futures 2,500 (2,500) ------------------------------------------------------------- Total interest rate risk management 26,161 13,819 (9,947) (15,133) 14,900 Mortgage banking activities Commitments to purchase forward contracts - originations 16 2,637 (2,222) 431 Commitments to sell forward contracts - originations 350 4,702 (4,301) 751 Interest rate floors- MSR 500 500 Receive-fixed interest rate swaps - MSR 125 125 ------------------------------------------------------------- Total mortgage banking activities 366 7,964 (6,523) 1,807 ------------------------------------------------------------- Total financial derivatives $26,527 $21,783 $(16,470) $(15,133) $16,707 - ---------------------------------------------------------------------------------------------------------------------------------- 31

11 CORPORATE FINANCIAL REVIEW 1995 VERSUS 1994 Financial derivatives involve, to varying degrees, interest rate and credit risk in excess of the amount recognized in the balance sheet, but less than the notional amount of the contract. For interest rate swaps, caps and floors, only periodic cash payments and, with respect to caps and floors, premiums, are exchanged; therefore, cash requirements and exposure to credit risk are significantly less than the notional value. The Corporation manages these risks as part of its asset/liability management process and through the Corporation's credit policies and procedures. The Corporation seeks to minimize credit risk by entering into transactions with only a select number of high-quality institutions, establishing credit limits, requiring bilateral-netting agreements, and in certain instances, segregated collateral. At December 31, 1995, credit exposure related to interest rate swaps and caps totaled $32.7 million. Interest rate swaps are agreements to exchange fixed and floating interest rate payments calculated on a notional principal amount. The floating rate is based on a money market index, primarily short-term LIBOR indices. The notional values of receive-fixed index amortizing swaps amortize on predetermined dates and in predetermined amounts based on market movements of the designated index. Basis swaps are agreements under which both the receive and pay portion of the contract are based on a variable index. The Corporation's swaps do not contain leverage or any similar features. For interest rate risk management purposes, the Corporation uses interest rate swaps to convert fixed-rate assets or liabilities to floating-rate instruments, convert floating-rate assets or liabilities to fixed-rate instruments, or convert floating-rate instruments from one index to another. Interest rate caps and floors are agreements where, for a fee, the counterparty agrees to pay the Corporation the amount, if any, by which a specified market interest rate exceeds or is less than a defined rate applied to a notional amount. These contracts can also include a contractually specified limit of such rate differentials under which payment is required. In connection with interest rate risk management activities, interest rate caps and floors are used to convert fixed-rate assets or liabilities to variable-rate instruments or convert variable-rate assets or liabilities to fixed-rate instruments above or below contractually specified rates. In connection with mortgage banking activities, the Corporation uses interest rate swaps and floors and other financial instruments primarily to hedge the economic value of MSR. Forward contracts provide for the delivery of financial instruments at a specified future date and at a specified price or yield. The Corporation uses forward contracts to manage risk positions associated with certain mortgage banking activities. Forward contracts are traded in over-the-counter markets and do not have standardized terms. Counterparties to the Corporation's forward contracts are primarily U.S. Government agencies and brokers and dealers in mortgage- backed securities. In the event the counterparty is unable to meet its contractual obligations, the Corporation may be exposed to selling or purchasing mortgage loans at prevailing market prices. Substantially all forward contracts mature within 90 days of origination. 32

12 The following table sets forth the maturity distribution and weighted average interest rates of financial derivatives used for interest rate risk management. The expected maturity distribution of receive-fixed index amortizing swaps is based on implied forward rates. Weighted average interest rates paid or received represent contractual interest rates in effect on December 31, 1995 and expected rates based on implied forward rates. The expected weighted average maturity of receive-fixed index amortizing swaps shortened to 7 months at December 31, 1995, compared with 2 years and 10 months at year-end 1994, reflecting the impact of terminations, amortization and lower interest rates. Should interest rates increase, the maturity of such swaps would extend. Subsequent to year-end 1995, the Corporation terminated $2.1 billion of receive-fixed index amortizing swaps resulting in a loss of $5.3 million. The loss was deferred and will be amortized over the remaining life of the contracts. MATURITY DISTRIBUTION OF FINANCIAL DERIVATIVES Weighted Average Rates ------------------------------------------------ Expected Based on At December 31, 1995 Implied Forward Rates ------------------------------------------------ December 31, 1995 Notional Dollars in millions Value Paid Received Paid Received - ---------------------------------------------------------------------------------------------------- Interest rate swaps Receive fixed index amortizing 1996 $3,169 5.90% 5.25% 5.34% 5.25% 1997 42 5.96 5.54 5.15 5.54 ------ Total $3,211 5.90 5.25 5.34 5.25 ------------------------------------------------------------ Receive fixed 1996 $1,855 5.89% 5.88% 5.31% 5.88% 1997 280 5.92 6.18 5.21 6.18 1998 575 5.84 7.01 5.27 7.01 1999 and beyond 75 5.85 7.00 5.54 7.00 ------ Total $2,785 5.88 6.17 5.30 6.17 ------------------------------------------------------------ Pay-fixed 1996 $1,515 5.77% 5.68% 5.77% 5.32% 1997 989 5.04 5.81 5.04 5.19 1998 50 8.28 5.88 8.28 5.31 1999 and beyond 75 9.43 5.94 9.43 5.60 ------ Total $2,629 5.65 5.74 5.65 5.28 ------------------------------------------------------------ Basis swaps 1996 $ 765 5.84% 5.63% 5.59% 5.21% ------------------------------------------------------------ Interest rate caps 1996 $ 10 NM NM NM NM 1997 5,500 NM NM NM NM ------ Total $5,510 - ---------------------------------------------------------------------------------------------------- NM - Not meaningful Interest rate caps with a notional value of $5.5 billion require the counterparty to pay the Corporation the excess, if any, of 3-month LIBOR over the specified cap rate. At December 31, 1995, 3-month LIBOR was 5.63 percent and the specified cap rate was 6.50 percent. 33

13 CORPORATE FINANCIAL REVIEW 1995 VERSUS 1994 FINANCIAL DERIVATIVES December 31, 1995 Weighted Average Rates Notional ---------------------- Estimated Dollars in millions Value Paid Received Fair Value - ---------------------------------------------------------------------------------------------------------------------------- Interest rate risk management Asset rate conversion Interest rate swaps Pay fixed designated to Securities $ 599 4.68% 5.87% $ 6 Commercial loans 290 8.01 5.87 (24) Receive-fixed index amortizing designated to commercial loans 2,471 5.90 5.23 (14) Receive fixed designated to Commercial loans 975 5.89 6.31 19 Short-term investments 200 5.84 7.23 9 Basis swaps designated to commercial real estate loans 300 5.96 5.85 Interest rate caps designated to Securities 5,500 NM NM 6 Mortgage loans 10 NM NM ------- ---- Total asset rate conversion 10,345 2 Liability rate conversion Interest rate swaps Pay fixed designated to Other borrowings 1,125 5.68 5.60 (5) Bank notes 600 5.41 5.79 Deposits 15 4.98 5.94 Receive-fixed index amortizing designated to deposits 740 5.93 5.32 (4) Receive fixed designated to Certificates of deposit 625 5.94 5.76 7 Bank notes 650 5.85 5.90 14 Other borrowings 330 5.82 6.37 13 Deposit notes 5 5.93 8.48 Basis swaps designated to bank notes 465 5.76 5.49 8 ------- ---- Total liability rate conversion 4,555 33 ------- ---- Total interest rate risk management 14,900 35 Mortgage banking activities Commitments to purchase forward contracts - originations 431 NM NM Commitments to sell forward contracts - originations 751 NM NM (4) Interest rate floors - MSR 500 NM NM 9 Receive-fixed interest rate swaps - MSR 125 NM NM 7 ------- ---- Total mortgage banking 1,807 12 ------- ---- Total financial derivatives $16,707 $ 47 - ---------------------------------------------------------------------------------------------------------------------------- NM - not meaningful The floating rate portion of interest rate contracts is based on money-market indices. As a percent of notional value, 71 percent were based on 3-month LIBOR, 19 percent on 1-month LIBOR and the remainder on other short-term indices. Interest rate caps with a notional value of $5.5 billion require the counterparty to pay the Corporation the excess, if any, of 3-month LIBOR over the specified cap rate. At December 31, 1995, 3-month LIBOR was 5.63 percent and the specified cap rate was 6.50 percent 34

14 LINE OF BUSINESS RESULTS The management accounting process uses various methods of balance sheet and income statement allocations, transfers and assignments to evaluate the performance of various business units. Unlike financial accounting, there is no comprehensive, authoritative body of guidance for management accounting equivalent to generally accepted accounting principles. The following information is based on management accounting practices which conform to and support the management structure of the Corporation and is not necessarily comparable with similar information for any other financial services institution. Designations, assignments and allocations may change from time to time as the management accounting system is enhanced and business or product lines change. In 1995, the Corporation realigned its line of business management structure along customer segments. The principal change was segregating the trust business, previously managed separately, into the corporate and consumer banking organizations. In addition, consistent with the Corporation's strategic focus and balance sheet realignment, asset/liability management has been redefined as a support function for the core lines of business. Results for 1994 are presented on a basis consistent with this new management reporting structure. For management reporting purposes, the Corporation has designated five lines of business: Consumer Banking, Corporate Banking, Real Estate Banking, Mortgage Banking and Asset Management. The financial results presented in this section reflect each line of business as if it operated on a stand-alone basis. Securities or borrowings, and related interest rate spread, have been assigned to each line of business based on its net asset or liability position. In 1995, Consumer Banking was a generator of funds and, accordingly, was assigned securities, while the other lines of business received an assignment of borrowings as net asset generators. An assignment of securities is accompanied by an assignment of equity in accordance with the methodology described below. The interest rate spread on the remaining securities, the impact of financial derivatives used for interest rate risk management and securities transactions are excluded from line of business results and are reported separately in asset/liability management activities. Capital is assigned to each business unit based on management's assessment of inherent risks and equity levels at independent companies that provide similar products and services. Capital assignments are not equivalent to regulatory capital guidelines and the total amount assigned may vary from consolidated shareholders' equity. After-tax profit margin represents earnings expressed as a percentage of revenue. The overhead ratio is the percentage of noninterest expense to revenue. For purposes of these ratio computations, revenue includes net interest income on a fully taxable-equivalent basis and noninterest income. Total earnings contributed by the lines of business were $820 million in 1995 compared with $894 million in 1994. The decline primarily resulted from an increase in Corporate Banking's allocated provision for credit losses which was a credit in the prior year. Line of business earnings differed from reported consolidated net income in both years due to asset/liability management activities, differences between specific reserve allocations to the lines of business and the consolidated provision for credit losses, special charges and certain unallocated revenues and expenses. The decline in earnings from asset/liability management activities was primarily due to actions taken to reposition the balance sheet. LINE OF BUSINESS HIGHLIGHTS Average Return on Year ended December 31 Balance Sheet Revenue Earnings Assigned Capital ---------------------------------------------------------------------------------- Dollars in millions 1995 1994 1995 1994 1995 1994 1995 1994 - ---------------------------------------------------------------------------------------------------------------------------- Consumer Banking $37,240 $36,052 $2,043 $1,926 $420 $384 21% 20% Corporate Banking 16,193 15,728 788 827 236 301 12 16 Real Estate Banking 3,896 4,032 185 237 79 109 13 17 Mortgage Banking 12,379 10,751 374 408 49 69 8 13 Asset Management 344 246 193 142 36 31 38 49 --------------------------------------------------------------- Total lines of business 70,052 66,809 3,583 3,540 820 894 16 18 Asset/liability management activities 4,261 6,566 (458) (7) (335) (18) Unallocated provision 71 (28) Special charges (192) (31) Other unallocated items 818 987 24 36 44 67 ---------------------------------------------------------------- Total $75,131 $74,362 $3,149 $3,569 $408 $884 7 16 - ----------------------------------------------------------------------------------------------------------------------------

35

15 CORPORATE FINANCIAL REVIEW 1995 VERSUS 1994 CONSUMER BANKING Consumer Banking provides lending, deposit, personal trust, brokerage, investment, payment system access and other financial services to individuals and small businesses. Services are provided through a network of community banking offices, alternative delivery systems such as the National Financial Services Center and ATMs and regional banking centers offering a wide array of products at one location. Consumer Banking includes: Private Banking-- affluent consumers and charitable organizations with specialized banking requirements; and Community Banking-- small business customers having annual sales of up to $5 million and all other consumers who use traditional branch and direct banking services. The earnings contribution from Consumer Banking increased to 51 percent in 1995 from 43 percent a year ago. Earnings from Private Banking increased in 1995 as the benefit from loan growth, new trust business and higher brokerage fees more than offset expense growth from marketing activities in this sector. Community Banking earnings increased in 1995 as the result of higher net interest income associated with loan growth and a $28 million pretax gain on the sale of certain branches partially offset by expenses associated with establishing the National Financial Services Center. CONSUMER BANKING Private Banking Community Banking Total Year ended December 31 ---------------------------------------------------------------- Dollars in millions 1995 1994 1995 1994 1995 1994 - ------------------------------------------------------------------------------------------- INCOME STATEMENT Net interest income $ 82 $ 75 $ 1,420 $ 1,375 $ 1,502 $ 1,450 Noninterest income 217 195 324 281 541 476 ---------------------------------------------------------------- Total revenue 299 270 1,744 1,656 2,043 1,926 Provision 1 65 39 66 39 Noninterest expense 213 194 1,102 1,094 1,315 1,288 ---------------------------------------------------------------- Pretax earnings 85 76 577 523 662 599 Income taxes 31 27 211 188 242 215 ---------------------------------------------------------------- Earnings $ 54 $ 49 $ 366 $ 335 $ 420 $384 ---------------------------------------------------------------- AVERAGE BALANCE SHEET Loans $1,927 $1,507 $13,455 $12,345 $15,382 $13,852 Assigned assets 20,752 21,392 20,752 21,392 Other assets 426 435 680 373 1,106 808 ---------------------------------------------------------------- Total assets $2,353 $1,942 $34,887 $34,110 $37,240 $36,052 ---------------------------------------------------------------- Net deposits $1,456 $1,251 $32,785 $32,122 $34,241 $33,373 Assigned funds 167 153 167 153 Other funds 494 333 326 284 820 617 Assigned equity 236 205 1,776 1,704 2,012 1,909 ---------------------------------------------------------------- Total funds $2,353 $1,942 $34,887 $34,110 $37,240 $36,052 ---------------------------------------------------------------- PERFORMANCE RATIOS After-tax profit margin 18% 18% 21% 20% 21% 20% Overhead 71 72 63 66 64 67 Return on assigned equity 23 23 21 20 21 20 - ------------------------------------------------------------------------------------------- 36

16 CORPORATE BANKING Large Corporate Middle Market Equity Management Total Year ended December 31 --------------------------------------------------------------------------------------- Dollars in millions 1995 1994 1995 1994 1995 1994 1995 1994 - ------------------------------------------------------------------------------------------------------------------ INCOME STATEMENT Net interest income $ 110 $ 130 $ 439 $ 437 $ (4) $ (3) $ 545 $ 564 Noninterest income 61 72 149 148 33 43 243 263 --------------------------------------------------------------------------------------- Total revenue 171 202 588 585 29 40 788 827 Provision 43 (4) 43 (4) Noninterest expense 85 84 294 282 3 3 382 369 --------------------------------------------------------------------------------------- Pretax earnings 86 118 251 307 26 37 363 462 Income taxes 27 39 91 109 9 13 127 161 --------------------------------------------------------------------------------------- Earnings $ 59 $ 79 $ 160 $ 198 $ 17 $ 24 $ 236 $ 301 --------------------------------------------------------------------------------------- AVERAGE BALANCE SHEET Loans $4,212 $4,437 $11,330 $10,604 $ 31 $ 37 $15,573 $15,078 Other assets 106 163 357 341 157 146 620 650 --------------------------------------------------------------------------------------- Total assets $4,318 $4,600 $11,687 $10,945 $188 $183 $16,193 $15,728 --------------------------------------------------------------------------------------- Net deposits $ 505 $ 522 $ 1,655 $ 1,646 $ 2,160 $ 2,168 Assigned funds 3,313 3,487 8,203 7,425 $115 $110 11,631 11,022 Other funds 23 51 444 582 17 19 484 652 Assigned equity 477 540 1,385 1,292 56 54 1,918 1,886 --------------------------------------------------------------------------------------- Total funds $4,318 $4,600 $11,687 $10,945 $188 $183 $16,193 $15,728 --------------------------------------------------------------------------------------- PERFORMANCE RATIOS After-tax profit margin 35% 39% 27% 34% 58% 60% 30% 36% Overhead 50 42 50 48 11 7 49 45 Return on assigned equity 12 15 12 15 30 45 12 16 - ------------------------------------------------------------------------------------------------------------------ CORPORATE BANKING Corporate Banking provides traditional and asset-based financing, liquidity and treasury management, corporate and employee benefit trust, capital markets, direct investment, leasing and other financial services to businesses and governmental entities. It serves customers within the Corporation's primary markets, as well as from a network of offices located in major U.S. cities. Corporate Banking includes: Large Corporate -- customers having annual sales of more than $250 million; Middle Market -- customers with annual sales of $5 million to $250 million and those in certain specialized industries such as communications, health care, natural resources, metals, public finance, financial services and automobile dealer finance; and Equity Management -- private equity investments. Corporate Banking provided 29 percent of line of business earnings in 1995 compared with 34 percent in 1994. Large Corporate earnings declined in the comparison due to a decrease in average loans and the impact of a $15 million pretax benefit recorded in 1994 from resolution of a problem asset. Average loans declined primarily due to initiatives to reduce certain low-spread loans. Middle Market earnings declined as the benefit of an increase in average loans was more than offset by an increase in the allocated provision for credit losses and narrower spreads on loans. A provision was allocated in 1995 primarily due to loan growth compared with a credit provision in 1994 that resulted from a significant reduction of problem assets. The contribution from Equity Management declined in 1995 as a result of lower venture capital income. 37

17 CORPORATE FINANCIAL REVIEW 1995 VERSUS 1994 REAL ESTATE BANKING Year ended December 31 Dollars in millions 1995 1994 - -------------------------------------------------------------- INCOME STATEMENT Net interest income $ 168 $ 178 Noninterest income 17 59 ---------------- Total revenue 185 237 Provision (1) Noninterest expense 66 73 ---------------- Pretax earnings 119 165 Income taxes 40 56 ---------------- Earnings $ 79 $ 109 ---------------- AVERAGE BALANCE SHEET Loans $3,957 $4,140 Other assets (61) (108) ---------------- Total assets $3,896 $4,032 ---------------- Net deposits $ 159 $ 130 Assigned funds 3,131 3,120 Other funds (7) 142 Assigned equity 613 640 ---------------- Total funds $3,896 $4,032 ---------------- PERFORMANCE RATIOS After-tax profit margin 43% 46% Overhead 36 31 Return on assigned equity 13 17 - -------------------------------------------------------------- REAL ESTATE BANKING Real Estate Banking provides lending, deposit, treasury management, syndication, commercial mortgage-backed securitizations and other noncredit services to small, middle market and large customers. Real Estate Banking services are provided to customers seeking short- and intermediate-term credit for construction, acquisition and holding of commercial or residential real estate projects. Real Estate Banking provided 10 percent of line of business earnings in 1995 compared with 12 percent in 1994. Earnings declined in the comparison due to lower loan volume and nonrecurring gains in 1994 on Midlantic's sales of assets held for accelerated disposition. MORTGAGE BANKING Year ended December 31 Dollars in millions 1995 1994 - --------------------------------------------------------------- INCOME STATEMENT Net interest income $ 164 $ 201 Noninterest income 210 207 ----------------- Total revenue 374 408 Provision 6 6 Noninterest expense 291 298 ----------------- Pretax earnings 77 104 Income taxes 28 35 ----------------- Earnings $ 49 $ 69 ----------------- AVERAGE BALANCE SHEET Loans $10,651 $ 8,748 Other assets 1,728 2,003 ----------------- Total assets $12,379 $10,751 ----------------- Net deposits $ 2,637 $ 2,973 Assigned funds 8,121 6,178 Other funds 1,035 1,086 Assigned equity 586 514 ----------------- Total funds $12,379 $10,751 ----------------- PERFORMANCE RATIOS After-tax profit margin 13% 17% Overhead 78 73 Return on assigned equity 8 13 - ---------------------------------------------------------------

MORTGAGE BANKING Mortgage Banking activities include acquisition, origination, securitization and servicing of residential mortgages, as well as retention of selected loans in the portfolio. Mortgage Banking contributed 6 percent of line of business earnings in 1995 compared with 8 percent a year ago. Mortgage Banking continued to operate in a competitive environment characterized by significantly reduced loan origination volumes. Earnings declined in 1995 as the benefit of an increase in portfolio loans was more than offset by narrower loan spreads and lower gains from sales of servicing. MORTGAGE SERVICING PORTFOLIO In millions 1995 1994 - -------------------------------------------------------------- January 1 $40,389 $34,768 Originations 5,423 6,437 Acquisitions 364 10,599 Repayments (4,751) (5,945) Sales (4,126) (5,470) ----------------- December 31 $37,299 $40,389 - -------------------------------------------------------------- 38

18 During 1995, the Corporation funded $5.4 billion of residential mortgages of which 81 percent represented new financing. The comparable amounts were $6.4 billion and 78 percent, respectively, in 1994. At December 31, 1995, the Corporation's mortgage servicing portfolio totaled $37.3 billion, had a weighted-average coupon rate of 7.98 percent and an estimated fair value of $419 million. The servicing portfolio included $25.1 billion serviced for others with a MSR carrying value of $268 million. If interest rates decline and the rate of prepayment increases, the underlying servicing fee income stream and related MSR fair value would be reduced. The Corporation seeks to manage this risk by using certain off-balance-sheet financial derivatives and on-balance- sheet instruments whose values move in the opposite direction of MSR value changes. A gain of $11.2 million, included in noninterest income, from instruments used to hedge the economic value of MSR was offset by a $10.9 million MSR impairment charge included in noninterest expense. ASSET MANAGEMENT Asset Management provides trust and mutual fund investment management, strategy, research and asset servicing for institutional and family wealth customers. It serves customers through one unified money management organization. ASSET MANAGEMENT Year ended December 31 Dollars in millions 1995 1994 - -------------------------------------------------------------- INCOME STATEMENT Net interest income $ (4) $ 8 Noninterest income 197 134 -------------- Total revenue 193 142 Provision Noninterest expense 135 93 -------------- Pretax earnings 58 49 Income taxes 22 18 -------------- Earnings $ 36 $ 31 -------------- AVERAGE BALANCE SHEET Loans $ 68 $105 Assigned assets 113 Other assets 276 28 -------------- Total assets $344 $246 -------------- Net deposits $127 $142 Assigned funds 88 Other funds 33 41 Assigned equity 96 63 -------------- Total funds $344 $246 -------------- PERFORMANCE RATIOS After-tax profit margin 19% 22% Overhead 70 65 Return on assigned equity 38 49 - -------------------------------------------------------------- Asset Management contributed 4 percent of line of business earnings in 1995 compared with 3 percent a year ago. Asset Management earnings increased due to the impact of BlackRock, new business and an increase in the value of managed assets. During 1995, assets under administration increased by $60.9 billion to $282.4 billion at December 31, 1995. The BlackRock acquisition added approximately $25 billion in discretionary assets, including $15 billion of institutional funds and $10 billion of mutual funds. At year-end 1995, the composition of discretionary assets under administration was 47 percent fixed income, 27 percent money market, 24 percent equity and 2 percent other. ASSETS UNDER ADMINISTRATION December 31 Non- In billions Discretionary Discretionary Total - ------------------------------------------------------------------------- 1995 Personal and charitable $30 $ 15 $ 45 Institutional 24 41 65 Mutual funds 42 130 172 -------------------------------- Total $96 $186 $282

- ------------------------------------------------------------------------- 1994 Personal and charitable $25 $ 11 $ 36 Institutional 4 75 79 Mutual funds 28 78 106 -------------------------------- Total $57 $164 $221 - ------------------------------------------------------------------------- RISK MANAGEMENT The Corporation's ordinary course of business involves varying degrees of risk taking, the most significant of which are credit, liquidity and interest rate risk. To manage these risks, the Corporation has risk management processes designed to provide for risk identification, measurement, monitoring and control. CREDIT RISK MANAGEMENT Credit risk represents the possibility that a customer or counterparty may not perform in accordance with contractual terms. Credit risk is inherent in the financial services business and results from extending credit to customers, purchasing securities, and entering into certain off-balance-sheet financial derivative transactions. The Corporation seeks to manage credit risk through diversification, utilizing exposure limits to any single industry or customer, requiring collateral and selling participations to third parties. Credit Administration, which includes credit policy, loan review and loan workout, manages and monitors credit risk by promulgating and enforcing uniform credit policies and exercising centralized oversight, review and approval procedures. Credit Policy, at the 39

19 CORPORATE FINANCIAL REVIEW 1995 VERSUS 1994 direction of the board of directors, establishes uniform underwriting standards that set forth the criteria used in extending credit. To support consistent application of underwriting standards, credit officers work with lending officers in evaluating the creditworthiness of borrowers and structuring transactions. Credit decisions are made at the specific affiliate or market level. However, credit requests above certain limits or that involve exceptions to credit policies require additional corporate approvals. NONPERFORMING ASSETS During 1995, nonperforming assets declined $221 million reflecting continued improvement in asset quality. The following tables outline nonperforming assets by category and set forth the changes in nonperforming assets during 1995 and 1994. NONPERFORMING ASSETS December 31 Dollars in millions 1995 1994 - -------------------------------------------------------------- Nonaccrual loans Commercial $118 $219 Commercial real estate Commercial mortgage 108 103 Real estate project 45 98 Consumer 10 20 Residential mortgage 54 56 -------------- Total nonaccrual loans 335 496 Restructured loans 23 69 -------------- Total nonperforming loans 358 565 Foreclosed assets Commercial real estate 105 117 Residential mortgage 24 21 Other 49 54 -------------- Total foreclosed assets 178 192 -------------- Total nonperforming assets $536 $757 -------------- Nonperforming loans to loans .74% 1.28% Nonperforming assets to loans and foreclosed assets 1.10 1.71 Nonperforming assets to assets .73 .98 - -------------------------------------------------------------- CHANGE IN NONPERFORMING ASSETS In millions 1995 1994 - -------------------------------------------------------------- January 1 $ 757 $1,124 Transferred from accrual 399 536 Acquisitions 14 69 Returned to performing (97) (131) Principal reductions (315) (450) Sales (111) (205) Charge-offs and valuation adjustments (111) (186) --------------- December 31 $ 536 $ 757 - -------------------------------------------------------------- At December 31, 1995, $88.7 million of nonperforming loans were current as to principal and interest compared with $89.8 million at December 31, 1994. Office, retail and land projects accounted for 76.0 percent of total nonperforming real estate project assets at December 31, 1995. The Corporation's primary markets accounted for 62.0 percent of total nonperforming real estate project assets. The southeast region of the United States and metropolitan Washington D.C. area accounted for 16.6 percent and 7.0 percent, respectively. ACCRUING LOANS CONTRACTUALLY PAST DUE 90 DAYS OR MORE Amount Percent of Loans December 31 --------------------------------- Dollars in millions 1995 1994 1995 1994 - ------------------------------------------------------------------------------ Consumer Student $ 44 $ 37 2.90% 2.84% Other 51 31 .44 .31 --------------

Total consumer 95 68 .72 .60 Residential mortgage 63 52 .54 .53 Commercial 22 21 .13 .14 Commercial real estate 45 34 .92 .68 -------------- Total $225 $175 .46 .40 - ------------------------------------------------------------------------------ Loans not included in past due, nonaccrual or restructured categories, but where known information about possible credit problems causes management to be uncertain as to the ability of the borrowers to comply with the present loan repayment terms over the next six months, totaled $176 million at December 31, 1995. ALLOWANCE FOR CREDIT LOSSES In determining the adequacy of the allowance for credit losses, the Corporation allocates reserves to specific problem loans based on discounted cash flow analyses or collateral valuations for impaired loans and to pools of watchlist and non-watchlist loans. The allocations to pools of loans are developed by risk rating and industry classifications and are based on management's judgment concerning historical loss trends and other relevant factors. These factors may include, among others, local, regional and national economic conditions, portfolio concentrations, industry competition and consolidation, and the impact of government regulation. Consumer loan allocations are based on historical loss experience adjusted for portfolio activity and current economic conditions. The allowance for credit losses totaled $1.3 billion at December 31, 1995 compared with $1.4 billion at December 31, 1994. The allowance as a percentage of period-end loans and nonperforming loans was 2.59 percent and 351.7 percent, respectively, at December 31, 1995. The comparable year-end 1994 amounts were 3.07 percent and 40

20 239.3 percent, respectively. Net charge-offs were .29 percent of total loans in 1995 compared with .40 percent in 1994. Management expects net charge-offs to increase modestly in 1996. CHARGE-OFFS AND RECOVERIES Percent Net of Year ended December 31 Charge- Charge- Average Dollars in millions offs Recoveries offs Loans - -------------------------------------------------------------------------- 1995 Consumer $109 $ 41 $ 68 .57% Residential mortgage 10 2 8 .07 Commercial 84 49 35 .22 Commercial real estate 37 15 22 .44 ---------------------------- Total $240 $107 $133 .29 - -------------------------------------------------------------------------- 1994 Consumer $ 93 $ 41 $ 52 .46% Residential mortgage 16 1 15 .17 Commercial 116 59 57 .38 Commercial real estate 64 19 45 .87 ---------------------------- Total $289 $120 $169 .40 - -------------------------------------------------------------------------- LIQUIDITY Liquidity represents an institution's ability to generate cash or otherwise obtain funds at reasonable rates to satisfy commitments to borrowers and demands of depositors and debtholders, and invest in strategic initiatives. Liquidity risk represents the likelihood the Corporation would be unable to generate cash or otherwise obtain funds at reasonable rates to satisfy commitments to borrowers, as well as the obligations to depositors and debtholders. Liquidity is managed through the coordination of the relative maturities of assets, liabilities and off-balance-sheet positions and is enhanced by the ability to raise funds in capital markets through direct borrowing or securitization of assets such as automobile and credit card loans. During 1995, cash and due from banks increased $267 million to $3.7 billion compared with an increase of $882 million during the prior year. Net cash provided by operating activities decreased $718 million in the comparison, primarily due to an increase in loans held for sale associated with the Corporation's mortgage banking activities. Cash provided by investing activities increased to $7.0 billion compared with $1.3 billion used a year ago reflecting the Corporation's reduction of the securities portfolio. Net cash used by financing activities totaled $7.9 billion in 1995 compared with $311 million provided a year earlier as the Corporation reduced wholesale liabilities. Liquid assets consist of cash and due from banks, short-term investments, loans held for sale and securities available for sale. At December 31, 1995, such assets totaled $21.8 billion of which $7.6 billion was pledged as collateral. Liquidity is also provided by residential mortgages which may be used as collateral for funds obtained through the Federal Home Loan Bank system. At December 31, 1995, approximately $5.3 billion of residential mortgages were available as collateral for borrowings from the Federal Home Loan Bank system. The reduction in the securities portfolio and related wholesale funding sources is not expected to materially affect overall liquidity. Liquidity for the parent company and its affiliates is also generated through the issuance of securities in public or private markets, lines of credit and dividends from subsidiaries. Under effective shelf registration statements at December 31, 1995, the Corporation had available $140 million of debt, $300 million of preferred stock and $350 million of securities that may be issued as either debt or preferred stock. In addition, the Corporation had a $300 million unused committed line of credit. Funds obtained from any of these sources can be used for both bank and nonbank activities. Management believes the Corporation has sufficient liquidity to meet its current obligations to customers, debtholders and others. The impact of replacing liabilities is reflected in the income simulation model used in the Corporation's overall asset/liability management process. INTEREST RATE RISK Interest rate risk arises primarily through the Corporation's normal business activities of extending loans and taking deposits. Many factors, including economic and financial conditions, general movements in market interest rates, and consumer preferences, affect the spread between interest earned on assets and interest paid on liabilities. Financial derivatives, primarily interest rate swaps, caps and floors, are used to alter the interest rate characteristics of assets and liabilities. For

example, receive-fixed interest rate swaps effectively convert variable-rate assets to fixed-rate assets. In managing interest rate risk, the Corporation seeks to minimize the reliance on a particular interest rate scenario as a source of earnings. Accordingly, wholesale activities, including securities, funding, financial derivatives and capital markets activities, are used in managing core business exposures within specified guidelines. Interest rate risk is centrally managed by asset and liability (A&L) management. Senior management and Board of Directors' committees oversee A&L management and periodically review interest rate risk exposures. 41

21 CORPORATE FINANCIAL REVIEW 1995 VERSUS 1994 A number of measures are used to monitor and manage interest rate risk, including income simulation and interest sensitivity (gap) analyses. In addition, the Corporation is in the process of developing longer-term measures of interest rate sensitivity including duration of equity and equity at risk. Such models are designed to estimate the impact on the value of equity resulting from changes in interest rates and supplement the simulation model and gap analyses. An income simulation model is the primary tool used to assess the direction and magnitude of changes in net interest income resulting from changes in interest rates. Key assumptions employed in the model include prepayment speeds on mortgage-related assets, cash flows and maturities of financial instruments, changes in market conditions, loan volumes and pricing, deposit sensitivity, customer preferences, and management's financial and capital plans. These assumptions are inherently uncertain and, as a result, the model can not precisely estimate net interest income or precisely predict the impact of higher or lower interest rates on net interest income. The Corporation's guidelines provide that net interest income should not decrease by more than 3 percent if interest rates gradually increase or decrease from current rates by 100 basis points over a twelve month period. At December 31, 1995, based on the results of the simulation model, the Corporation was within these guidelines. Actual results will differ from simulated results due to timing, magnitude and frequency of interest rate changes and changes in market conditions and management strategies, among other factors. Additional interest rate scenarios are modeled to address a wider range of rate movement, yield curve, term structure and basis risk exposures. Depending on market conditions and other inherent risks, these scenarios may be modeled more or less frequently. Such analyses are used as supplemental measurements only and limits have not been established. The Corporation also employs interest sensitivity (gap) analysis to assess interest rate risk. A gap analysis represents a point-in-time net position of assets, liabilities and off-balance- sheet instruments subject to repricing in specified time periods. The Corporation's limit for the cumulative one-year gap position is 10 percent. A cumulative asset-sensitive gap position indicates assets are expected to reprice more quickly than liabilities. Alternatively, a cumulative liability-sensitive gap position indicates liabilities are expected to reprice more quickly than assets. The cumulative one-year gap position was 7.0 percent asset sensitive at December 31, 1995. During January 1996, to reduce exposure to declining rates, the Corporation added receive-fixed interest rate swaps with a term of two years which converted assets from variable rates to fixed rates. As a result, the asset sensitivity of the cumulative one-year gap position was reduced to 3.8 percent. Gap analysis alone does not accurately measure the magnitude of changes in net interest income since changes in interest rates over time do not impact all categories of assets, liabilities and off-balance-sheet instruments equally or simultaneously. INTEREST RATE SENSITIVITY (GAP) ANALYSIS December 31, 1995 1 to 91 to 181 to 1 to 2 2 to 5 Beyond In millions 90 Days 180 Days 365 Days Years Years 5 Years Total - ----------------------------------------------------------------------------------------------------------------------------------- Assets Loans $23,970 $3,089 $4,039 $4,665 $ 7,550 $ 5,340 $48,653 Securities 4,958 789 2,346 2,100 3,987 1,659 15,839 Other earning assets 2,279 2,279 Other assets 443 22 44 84 292 5,748 6,633 ---------------------------------------------------------------------------------------------- Total assets $31,650 $3,900 $6,429 $6,849 $11,829 $12,747 $73,404 ---------------------------------------------------------------------------------------------- Liabilities and shareholders' equity Noninterest-bearing deposits $ 1,416 $ 9,291 $10,707 Interest-bearing deposits 11,892 $3,126 $3,548 $2,694 $ 2,477 12,455 36,192 Borrowings 14,766 929 886 208 453 1,821 19,063 Other liabilities 122 1,552 1,674 Shareholders' equity 5,768 5,768 ---------------------------------------------------------------------------------------------- Total liabilities and shareholders' equity $28,196 $4,055 $4,434 $2,902 $2,930 $30,887 $73,404 ---------------------------------------------------------------------------------------------- Off-balance-sheet items $(2,120) $1,085 $429 $96 $529 $(19) ----------------------------------------------------------------------------------- Interest rate sensitivity $1,334 $930 $2,424 $4,043 $9,428 $(18,159) ----------------------------------------------------------------------------------- Cumulative gap $1,334 $2,264 $4,688 $8,731 $18,159 - ----------------------------------------------------------------------------------------------------------------------------------- 42

22 CORPORATE FINANCIAL REVIEW 1994 VERSUS 1993 OVERVIEW Net income for 1994 was $883.9 million, or $2.52 per fully diluted share, compared with $898.5 million, or $2.60 per share, for 1993. Return on average assets and return on average common shareholders' equity were 1.19 percent and 16.09 percent, respectively, in 1994 compared with 1.40 percent and 18.55 percent, respectively, in 1993. Effective January 1, 1994, the Corporation adopted Statement of Financial Accounting Standards ("SFAS") No. 112, "Employers' Accounting for Postemployment Benefits." SFAS No. 112 requires accrual of a liability for benefits to be paid to former or inactive employees after employment, but before retirement. The cumulative effect of the change in accounting decreased net income by $7.5 million or, $.02 per fully diluted share. Effective January 1, 1993, the Corporation adopted SFAS No. 109, "Accounting for Income Taxes," and changed its accounting method for certain intangible assets. The combined effect of these changes increased net income by $19.6 million, or $.06 per fully diluted share. Income before the cumulative effect of the changes in accounting principles was $891.5 million or $2.54 per fully diluted share, in 1994 compared with $878.9, or $2.54 per fully diluted share, in 1993. MERGERS AND ACQUISITIONS During 1994, the Corporation acquired First Eastern Corp., Wilkes-Barre, Pennsylvania, and United Federal Bancorp, Inc., State College, Pennsylvania. The acquisitions added assets and deposits of $2.8 billion and $2.4 billion, respectively. In November 1993, the Corporation acquired PNC Mortgage. This acquisition added mortgage-related assets of $7.6 billion and a mortgage servicing portfolio totaling $27 billion, including $21 billion serviced for others. In June 1994, the Corporation purchased a $10 billion residential mortgage servicing portfolio from the Associates Corporation of North America. INCOME STATEMENT REVIEW During 1994, taxable-equivalent net interest income represented 68.2 percent of total revenue before net securities transactions compared with 71.8 percent in 1993. Noninterest income before net securities transactions represented 31.8 percent of total revenue in 1994 and 28.2 percent in 1993. INCOME STATEMENT HIGHLIGHTS Change Year ended December 31 ------------------- Dollars in millions 1994 1993 Amount Percent - ----------------------------------------------------------------------------- Net interest income (taxable-equivalent basis) $2,530 $2,391 $ 139 5.8% Provision for credit losses 84 350 (266) (76.0) Noninterest income before securities transactions 1,181 941 240 25.5 Net securities gains (losses) (142) 195 (337) (172.8) Noninterest expense before special charges 2,190 1,985 205 10.3 Special charges 48 48 NM Net income 884 898 (14) (1.6) - ----------------------------------------------------------------------------- NM - not meaningful NET INTEREST INCOME On a fully taxable-equivalent basis, net interest income for 1994 increased $139.5 million, or 5.8 percent, primarily due to a $9.4 billion increase in average earning assets partially offset by a narrower interest rate spread. NET INTEREST INCOME Year ended December 31 Change Taxable-equivalent basis ------------------- Dollars in millions 1994 1993 Amount Percent - -----------------------------------------------------------------------------

Interest income/expense before financial derivatives Interest income $4,600 $3,852 $ 748 19.4% Loan fees 83 80 3 3.8 Taxable-equivalent adjustment 38 51 (13) (25.5) -------------------------------- Total interest income 4,721 3,983 738 18.5 Interest expense 2,320 1,857 463 24.9 -------------------------------- Net interest income before financial derivatives 2,401 2,126 275 12.9 Effect of financial derivatives on Interest income 41 91 (50) (54.9) Interest expense (88) (174) 86 49.4 -------------------------------- Total effect of financial derivatives 129 265 (136) (51.3) -------------------------------- Net interest income $2,530 $2,391 $ 139 5.8 - ----------------------------------------------------------------------------- 43

23 CORPORATE FINANCIAL REVIEW 1994 VERSUS 1993 The 1994 net interest margin narrowed to 3.64 percent compared with 3.99 percent in 1993 as deposit and borrowings costs increased more rapidly than loan yields. In addition, the narrower margin reflects the impact of actions begun in the latter half of 1994 to reposition the balance sheet and to reduce interest rate sensitivity. PROVISION FOR CREDIT LOSSES The provision for credit losses was $83.5 million and $350.2 million in 1994 and 1993, respectively. Continued improvement in economic conditions, combined with management's ongoing efforts to improve asset quality, resulted in lower nonperforming asset and charge-off levels, and a higher reserve coverage of nonperforming loans. NONINTEREST INCOME Noninterest income before securities transactions increased $239.7 million, or 25.5 percent, to $1.2 billion in 1994. Investment management and trust revenue increased $20.0 million, or 6.4 percent, due to an increase in new business partially offset by a decline in the value of managed assets. Mortgage banking income increased $148.0 million to $198.5 million as a result of the PNC Mortgage acquisition and the purchase of the Associates mortgage servicing portfolio. Other noninterest income increased $57.9 million to $156.9 million due to gains from Midlantic's sales of assets held for accelerated disposition totaling $32.3 million, sales of other assets, and higher venture capital income. Net securities losses totaled $141.6 million in 1994 compared with net securities gains of $194.7 million in 1993. During 1994, securities were sold in connection with initiatives to downsize the securities portfolio and to reduce interest rate sensitivity. NONINTEREST EXPENSE Noninterest expense totaled $2.2 billion in 1994 compared with $2.0 billion in 1993. The increase was primarily due to acquisitions and a $48.3 million special charge related to the consolidation of telebanking centers and rationalization of the retail branch network. Staff expense totaled $1.0 billion in 1994 compared with $901.2 million in 1993. The increase was primarily due to acquisitions in the mortgage banking and consumer banking businesses. Average full-time equivalent employees increased 13.5 percent. Net occupancy and equipment expense increased $32.8 million and intangible amortization increased $48.4 million primarily attributable to acquisitions. Other noninterest expense decreased 3.0 percent to $626.2 million primarily due to lower foreclosed asset expense. BALANCE SHEET REVIEW Total assets increased $1.4 billion to $77.5 billion at December 31, 1994 primarily due to acquisitions. Total consumer and residential mortgage loans increased $2.0 billion primarily due to acquisitions and portfolio management strategies. Commercial loans outstanding were $15.5 billion at December 31, 1994 and 1993. Total commercial real estate loans were $5.1 and $5.2 billion at December 31, 1994 and December 31, 1993, respectively. Securities totaled $23.7 billion at December 31, 1994 compared with $25.5 billion at December 31, 1993. Securities represented 33.9 percent of earning assets at December 31, 1994 compared with 35.8 percent at the prior year end. The reduction reflects management's actions to reduce the size of the securities portfolio and to reduce interest rate sensitivity. Deposits increased $1.1 billion to $45.8 billion in the year-to- year comparison as increases from acquired deposits were partially offset by lower brokered and time deposits. Borrowed funds totaled $12.2 billion at December 31, 1994 compared with $12.3 billion at December 31, 1993. During 1994, certain repurchase agreements and treasury, tax and loan borrowings were replaced with commercial paper and term Federal funds purchased. ASSET QUALITY During 1994, asset quality continued to improve. Nonperforming assets totaled $757 million at December 31, 1994 compared with $1.1 billion at year-end 1993. Accruing loans contractually past due 90 days or more as to the payment of principal or interest totaled $175 million at December 31, 1994 compared with $171 million at December 31, 1993. Residential mortgage and student loans of $52 million and $37 million were included in the total at December 31, 1994 compared with $61 million and $42 million, respectively, at year-end 1993. ALLOWANCE FOR CREDIT LOSSES The allowance for credit losses

was $1.4 billion at December 31, 1994 and 1993, representing 3.07 percent of total loans at December 31, 1994 compared with 3.26 percent at year-end 1993. As a percentage of period- end nonperforming loans, the allowance for credit losses was 239.3 percent at December 31, 1994 compared with 160.3 percent at year-end 1993. CAPITAL Shareholders' equity totaled $5.7 billion and $5.4 billion at December 31, 1994 and 1993, respectively, and the leverage ratio was 7.10 percent and 7.69 percent in the comparison. Tier I and total risk-based capital ratios were 9.36 percent and 12.41 percent, respectively, at December 31, 1994. The comparable December 31, 1993 ratios were 9.75 percent and 12.55 percent. 44

24 REPORTS ON CONSOLIDATED FINANCIAL STATEMENTS MANAGEMENT'S REPORT ON THE FINANCIAL REPORTING INTERNAL CONTROL STRUCTURE PNC Bank Corp. is responsible for the preparation, integrity and fair presentation of its published financial statements. The consolidated financial statements included in this annual report have been prepared in accordance with generally accepted accounting principles and, as such, include judgments and estimates of management. PNC Bank Corp. also prepared the other information included in the annual report and is responsible for its accuracy and consistency with the consolidated financial statements. Management is responsible for establishing and maintaining an effective internal control structure over financial reporting. The internal control system is augmented by written policies and procedures and by audits performed by an internal audit staff which reports to the Audit Committee of the Board of Directors. Internal auditors monitor the operation of the internal control system and report findings to management and the Audit Committee, and corrective actions are taken to address identified control deficiencies and other opportunities for improving the system. The Audit Committee, composed solely of outside directors, provides oversight to the financial reporting process. There are inherent limitations in the effectiveness of any system of internal control, including the possibility of human error and circumvention or overriding of controls. Accordingly, even an effective internal control system can provide only reasonable assurance with respect to financial statement preparation. Further, because of changes in conditions, the effectiveness of an internal control system may vary over time. Management assessed PNC Bank Corp.'s internal control structure over financial reporting as of December 31, 1995. This assessment was based on criteria for effective internal control over financial reporting described in "Internal Control- Integrated Framework" issued by the Committee of Sponsoring Organizations of the Treadway Commission. Based on this assessment, management believes that PNC Bank Corp. maintained an effective internal control system over financial reporting as of December 31, 1995. /s/ THOMAS H. O'BRIEN /s/ ROBERT L. HAUNSCHILD - --------------------- ------------------------- Thomas H. O'Brien Robert L. Haunschild Chairman and Senior Vice President and Chief Executive Officer Chief Financial Officer REPORT OF ERNST & YOUNG LLP, INDEPENDENT AUDITORS Shareholders and Board of Directors PNC Bank Corp. We have audited the accompanying consolidated balance sheet of PNC Bank Corp. and subsidiaries as of December 31, 1995 and 1994, and the related consolidated statements of income, changes in shareholders' equity, and cash flows for each of the three years in the period ended December 31, 1995. These financial statements are the responsibility of PNC Bank Corp.'s management. Our responsibility is to express an opinion on these financial statements based on our audits. We conducted our audits in accordance with generally accepted auditing standards. Those standards require that we plan and perform the audit to obtain reasonable assurance about whether the financial statements are free of material misstatement. An audit includes examining, on a test basis, evidence supporting the amounts and disclosures in the financial statements. An audit also includes assessing the accounting principles used and significant estimates made by management, as well as evaluating the overall financial statement presentation. We believe that our audits provide a reasonable basis for our opinion. In our opinion, the financial statements referred to above present fairly, in all material respects, the consolidated financial position of PNC Bank Corp. and subsidiaries at December 31, 1995 and 1994, and the consolidated results of their operations and their cash flows for each of the three years in the period ended December 31, 1995, in conformity with generally accepted accounting principles. As discussed in Notes to Consolidated Financial Statements, PNC Bank Corp. changed its method of accounting for mortgage servicing rights in 1995, postemployment benefits in 1994, and income taxes and intangible assets in 1993. /s/ ERNST & YOUNG LLP

Pittsburgh, Pennsylvania February 8, 1996 45

25 CONSOLIDATED BALANCE SHEET December 31 Dollars in millions, except par values 1995 1994 - ------------------------------------------------------------------------------- ASSETS Cash and due from banks $ 3,679 $ 3,412 Short-term investments 1,611 1,550 Loans held for sale 659 487 Securities available for sale 15,839 3,790 Investment securities, fair value of $18,559 19,880 Loans, net of unearned income of $403 and $385 48,653 44,043 Allowance for credit losses (1,259) (1,352) -------------------- Net loans 47,394 42,691 Other 4,222 5,651 -------------------- Total assets $73,404 $77,461 -------------------- LIABILITIES Deposits Noninterest-bearing $10,707 $9,840 Interest-bearing 36,192 35,978 -------------------- Total deposits 46,899 45,818 Borrowed funds Federal funds purchased 3,817 2,219 Repurchase agreements 2,851 4,302 Commercial paper 753 1,226 Other 1,244 4,446 -------------------- Total borrowed funds 8,665 12,193 Notes and debentures 10,398 12,127 Other 1,674 1,596 -------------------- Total liabilities 67,636 71,734 SHAREHOLDERS' EQUITY Preferred stock 1 51 Common stock - $5 par value Authorized: 450,000,000 shares Issued: 340,863,348 and 343,820,327 shares 1,704 1,719 Capital surplus 545 692 Retained earnings 3,571 3,535 Deferred benefit expense (79) (83) Net unrealized securities gains (losses) 26 (122) Common stock held in treasury at cost: 2,814,910 shares (65) -------------------- Total shareholders' equity 5,768 5,727 -------------------- Total liabilities and shareholders' equity $73,404 $77,461 - -------------------------------------------------------------------------------- See accompanying Notes to Consolidated Financial Statements. 46

26 CONSOLIDATED STATEMENT OF INCOME Year ended December 31 In thousands, except per share data 1995 1994 1993 - ---------------------------------------------------------------------------------------------------------------------------------- INTEREST INCOME Loans and fees on loans $3,742,877 $3,188,611 $2,641,910 Securities 1,282,929 1,407,104 1,295,067 Other 123,625 127,432 85,794 -------------------------------------------------- Total interest income 5,149,431 4,723,147 4,022,771 INTEREST EXPENSE Deposits 1,551,816 1,159,242 1,005,658 Borrowed funds 834,654 514,133 360,288 Notes and debentures 621,092 557,778 316,998 -------------------------------------------------- Total interest expense 3,007,562 2,231,153 1,682,944 -------------------------------------------------- Net interest income 2,141,869 2,491,994 2,339,827 Provision for credit losses 6,000 83,458 350,249 -------------------------------------------------- Net interest income less provision for credit losses 2,135,869 2,408,536 1,989,578 NONINTEREST INCOME Investment management and trust 420,160 335,315 315,308 Service fees 494,649 489,785 475,919 Mortgage banking 186,617 198,548 50,590 Net securities gains (losses) (279,694) (141,582) 194,699 Other 138,687 156,934 99,082 -------------------------------------------------- Total noninterest income 960,419 1,039,000 1,135,598 NONINTEREST EXPENSE Staff expense 1,065,057 1,040,926 901,198 Net occupancy and equipment 346,064 333,633 300,811 Intangible asset and MSR amortization 114,671 86,297 37,923 Federal deposit insurance 57,669 102,309 99,329 Other 625,889 626,155 645,428 Special charges 259,926 48,300 -------------------------------------------------- Total noninterest expense 2,469,276 2,237,620 1,984,689 -------------------------------------------------- Income before income taxes and cumulative effect of changes in accounting principles 627,012 1,209,916 1,140,487 Applicable income taxes 218,952 318,460 261,539 -------------------------------------------------- Income before cumulative effect of changes in accounting principles 408,060 891,456 878,948 Cumulative effect of changes in accounting principles, net of tax benefits of $4,598 and $5,343 (7,528) 19,569 -------------------------------------------------- Net income $ 408,060 $ 883,928 $ 898,517 -------------------------------------------------- EARNINGS PER COMMON SHARE Primary before cumulative effect of changes in accounting principles $1.19 $2.56 $2.56 Cumulative effect of changes in accounting principles (.02) .06 -------------------------------------------------- Primary $1.19 $2.54 $2.62 -------------------------------------------------- Fully diluted before cumulative effect of changes in accounting principles $1.19 $2.54 $2.54 Cumulative effect of changes in accounting principles (.02) .06 -------------------------------------------------- Fully diluted $1.19 $2.52 $2.60 -------------------------------------------------- CASH DIVIDENDS DECLARED PER COMMON SHARE $1.40 $1.31 $1.175 -------------------------------------------------- AVERAGE COMMON SHARES OUTSTANDING Primary 339,134 345,214 340,819 Fully diluted 344,922 350,218 346,187 - ---------------------------------------------------------------------------------------------------------------------------------- See accompanying Notes to Consolidated Financial Statements. 47

27 CONSOLIDATED STATEMENT OF CHANGES IN SHAREHOLDERS' EQUITY Preferred Common Capital Retained Dollars in million, except per share data Stock Stock Surplus Earnings Other Total - ---------------------------------------------------------------------------------------------------------------------------------- Balance at January 1, 1993 $ 51 $1,636 $ 599 $2,363 $(106) $4,543 Net income 898 898 Cash dividends declared (PNC-$1.175 per share) (277) (277) Common stock issued (14,437,783 shares) 72 84 156 Common stock issued for preferred stock dividend (335,290 shares) 2 2 (4) Preferred stock redeemed (9) (9) Tax benefit of ESOP plans 3 3 Deferred benefit expense 11 11 Treasury stock activity (9) (9) Net unrealized securities gains 88 88 ----------------------------------------------------------------- Balance at December 31, 1993 51 1,710 676 2,983 (16) 5,404 Net income 884 884 Cash dividends declared (PNC-$1.31, Midlantic-$.62 per share) (333) (333) Common stock issued (1,796,092 shares) 9 12 21 Common stock issued for preferred stock dividend (73,341 shares) 1 (1) Tax benefit of ESOP and stock option plans 3 2 5 Deferred benefit expense 12 12 Treasury stock activity (56) (56) Net unrealized securities losses (210) (210) ----------------------------------------------------------------- Balance at December 31, 1994 51 1,719 692 3,535 (270) 5,727 Net income 408 408 Cash dividends declared (PNC-$1.40, Midlantic-$.96 per share) (386) (386) Common stock issued (4,532,108 shares) 23 (8) 15 Preferred stock redeemed (50) (50) Treasury stock activity 5 (119) (114) Midlantic merger - treasury stock issued (38) (146) 184 Tax benefit of ESOP and stock option plans 2 14 16 Deferred benefit expense 4 4 Net unrealized securities gains 148 148 ----------------------------------------------------------------- Balance at December 31, 1995 $ 1 $1,704 $ 545 $3,571 $(53) $5,768 - ---------------------------------------------------------------------------------------------------------------------------------- See accompanying Notes to Consolidated Financial Statements. 48

28 CONSOLIDATED STATEMENT OF CASH FLOWS Year ended December 31 In millions 1995 1994 1993 - -------------------------------------------------------------------------------------------------------------------------------- OPERATING ACTIVITIES Net income $ 408 $ 884 $ 898 Adjustments to reconcile net income to net cash provided by operating activities Cumulative effect of changes in accounting principles 8 (20) Provision for credit losses 6 84 350 Provision for OREO losses 6 66 Depreciation, amortization and accretion 296 252 139 Deferred income taxes 128 6 (133) Net securities (gains) losses 280 142 (195) Net gain on sales of assets (77) (104) (20) Valuation adjustments (15) (13) (22) Changes in Loans held for sale (172) 957 (42) Other 266 (384) 211 -------------------------------------- Net cash provided by operating activities 1,120 1,838 1,232 INVESTING ACTIVITIES Net change in loans (2,021) (1,279) (2,736) Repayment Securities available for sale 1,791 2,746 1,196 Investment securities 1,944 3,478 9,278 Sales Securities available for sale 7,983 12,318 17,239 Loans 160 575 86 Foreclosed assets 125 178 284 Purchases Securities available for sale (3,409) (11,116) (13,620) Investment securities (161) (8,754) (14,208) Loans (702) (29) (433) Bulk sales of loans and OREO 6 235 221 Net cash received (paid) for acquisitions/divestitures 49 (475) (175) Other 1,270 856 87 -------------------------------------- Net cash provided (used) by investing activities 7,035 (1,267) (2,781) FINANCING ACTIVITIES Net change in Noninterest-bearing deposits 272 (385) 1,165 Interest-bearing deposits (2,134) (851) (2,533) Federal funds purchased 1,595 114 (2,098) Sale/issuance Repurchase agreements 74,102 125,322 163,998 Commercial paper 4,376 5,621 5,221 Other borrowed funds 99,245 110,292 48,310 Notes and debentures 11,990 9,627 9,016 Common stock 88 53 162 Redemption/maturity Repurchase agreements (75,553) (126,624) (165,133) Commercial paper (4,849) (4,909) (5,687) Other borrowed funds (102,446) (109,957) (46,569) Notes and debentures (13,901) (7,569) (4,394) Preferred stock (50) Net acquisition of treasury stock (236) (90) (19) Cash dividends paid to shareholders (387) (333) (276) -------------------------------------- Net cash provided (used) by financing activities (7,888) 311 1,163 -------------------------------------- INCREASE (DECREASE) IN CASH AND DUE FROM BANKS 267 882 (386) Cash and due from banks at beginning of year 3,412 2,530 2,916 -------------------------------------- Cash and due from banks at end of year $ 3,679 $ 3,412 $ 2,530 ================================================================================================================================ CASH PAID FOR Interest $ 3,102 $ 2,201 $ 1,592 Income taxes 122 403 311 NONCASH ITEMS Increase (decrease) in securities available for sale 18,078 (2,745) Increase (decrease) in investment securities (18,078) 2,745 Transfers from loans to other assets 99 151 369 - -------------------------------------------------------------------------------------------------------------------------------- See accompanying Notes to Consolidated Financial Statements. 49

29 NOTES TO CONSOLIDATED FINANCIAL STATEMENTS NOTE 1 ACCOUNTING POLICIES BUSINESS PNC Bank Corp. provides a broad range of banking and related financial services through its subsidiaries to consumers, small businesses and corporate customers and is subject to intense competition from other financial services companies with respect to these services and customers. PNC Bank Corp. is also subject to the regulations of certain federal and state agencies and undergoes periodic examinations by certain regulatory authorities. BASIS OF FINANCIAL STATEMENT PRESENTATION The consolidated financial statements include the accounts of PNC Bank Corp. and its subsidiaries ("Corporation"), substantially all of which are wholly owned. Such statements have been prepared in accordance with generally accepted accounting principles. All significant intercompany accounts and transactions have been eliminated in the consolidated financial statements. The merger between PNC Bank Corp. and Midlantic Corporation ("Midlantic" or "MC") was completed on December 31, 1995 and accounted for as a pooling of interests. Accordingly, all financial information has been restated as if the companies were combined for all periods presented. In preparing the consolidated financial statements, management is required to make estimates and assumptions that affect the amounts reported in the financial statements. Actual results will differ from such estimates and such differences may be material to the financial statements. LOANS HELD FOR SALE Loans held for sale primarily consist of residential mortgages and are carried at the lower of cost or aggregate market value. Gains and losses on these loans are included in mortgage banking income. SECURITIES Securities are classified as investments and carried at amortized cost if management has the positive intent and ability to hold the securities to maturity. Securities purchased with the intention of recognizing short-term profits are placed in the trading account and are carried at market value. Gains and losses on trading securities are included in other income. Securities not classified as investments or trading are designated as securities available for sale and carried at fair value with unrealized gains and losses reflected in shareholders' equity. Gains and losses on sales of securities available for sale are generally computed on a specific security basis and recognized in results of operations. LOANS Interest income with respect to loans is accrued on the principal amount outstanding, except for lease financing income and interest on certain consumer loans which are recognized over their respective terms using methods which approximate the level yield method. Significant loan fees are deferred and accreted to interest income over the respective lives of the loans. NONPERFORMING ASSETS Nonperforming assets are comprised of nonaccrual and restructured loans and foreclosed assets. Generally, a loan is classified as nonaccrual and the accrual of interest is discontinued when it is determined the collection of interest or principal is doubtful or when a default of interest or principal has existed for 90 days or more, unless the loan is well secured and in the process of collection. When interest accrual is discontinued, unpaid interest credited to income in the current year is reversed and unpaid interest accrued in the prior year, if any, is charged against the allowance for credit losses. A loan is categorized as restructured if the original interest rate, repayment terms, or both, are restructured due to a deterioration in the financial condition of the borrower and it was not previously classified as nonaccrual. Nonperforming loans are generally not returned to performing status until the obligation is brought current, has performed in accordance with the contractual terms for a reasonable period of time and the ultimate collectibility of the total contractual principal and interest is no longer in doubt. Foreclosed assets are comprised of property acquired through a foreclosure proceeding or acceptance of a deed-in-lieu of foreclosure. These assets are recorded at the lower of the related loan balance or market value of the collateral less estimated disposition costs at the date acquired. Subsequently, foreclosed assets are valued at the lower of the amount recorded at acquisition date or the then current market value less estimated disposition costs. Any gains or losses realized upon disposition of the property are reflected in income. Market values are estimated primarily based upon appraisals. Interest collected on impaired loans is recognized on the cash basis or cost recovery method. ALLOWANCE FOR CREDIT LOSSES Effective January 1, 1995, the Corporation adopted Statement of Financial Accounting Standards ("SFAS") No. 114, "Accounting by Creditors for Impairment of a Loan," as amended. Under this Standard, the Corporation estimates credit losses on impaired loans based on the present value of expected cash flows or the fair value of

the underlying collateral if the loan repay- 50

30 ment is expected to come from the sale or operation of such collateral. For purposes of this Standard, nonaccrual and restructured commercial and commercial real estate loans are considered to be impaired. Prior to 1995, credit losses related to these loans were estimated based on undiscounted cash flows or the fair value of the underlying collateral. The allowance for credit losses is established through provisions for credit losses charged against income. Loans deemed to be uncollectible are charged against the allowance account. The allowance is maintained at a level believed by management to be sufficient to absorb estimated potential credit losses. Management's determination of the adequacy of the allowance is based on periodic evaluations of the credit portfolio and other relevant factors. This evaluation is inherently subjective as it requires material estimates, including the amounts and timing of expected future cash flows on impaired loans, which may be susceptible to significant change. The allowance for credit losses on impaired loans pursuant to SFAS No. 114 is one component of the methodology for determining the allowance for credit losses. The remaining components of the allowance for credit losses provide for estimated losses on consumer loans and residential mortgages, and general amounts for historical loss experience, uncertainties in estimating losses and inherent risks in the various credit portfolios. INTANGIBLE ASSETS AND MORTGAGE SERVICING RIGHTS Effective January 1, 1993, the Corporation changed its method of accounting for certain identifiable intangible assets, consisting primarily of purchased mortgage servicing rights. Such assets are accounted for at the lower of amortized cost or the estimated value of the discounted future net revenues on a disaggregated basis. Previously, future net revenues were not discounted for this purpose. The cumulative effect of the change decreased net income by $10.4 million, or $.03 per fully diluted share. In 1995, the Corporation adopted SFAS No. 122, "Accounting for Mortgage Servicing Rights," on a prospective basis as required by the Standard. SFAS No. 122 provides for the recognition of originated mortgage servicing rights ("OMSR") retained for loans sold by allocating total costs incurred between the loan and the servicing rights based on their relative fair values. Previously, the value of OMSR was not recognized as an asset when the related loan was sold. Mortgage servicing rights ("MSR") are amortized in proportion to, and over the period of, estimated net servicing income. To determine the fair value of MSR, the Corporation estimates the present value of future cash flows incorporating numerous assumptions including servicing income, cost of servicing, discount rates, prepayment speeds and default rates. SFAS No. 122 also requires establishment of a valuation allowance for the excess of the carrying amount of capitalized MSR over estimated fair value. For purposes of measuring impairment, MSR are disaggregated and stratified on predominant risk characteristics, primarily loan type, interest rate and investor type. The after-tax amount of OMSR recognized in 1995 was $24.1 million, or $.07 per fully diluted share. Intangible assets, which are included in other assets, are amortized using accelerated and straight-line methods over their respective estimated useful lives. Goodwill is amortized on a straight-line basis over periods ranging from 15 to 25 years. DEPRECIATION AND AMORTIZATION For financial reporting purposes, premises and equipment are depreciated principally using the straight-line method over the estimated useful lives of the assets. Accelerated methods are used for federal income tax purposes. Leasehold improvements are amortized over their estimated useful lives or their respective lease terms, whichever is shorter. FINANCIAL DERIVATIVES The Corporation uses off-balance-sheet financial derivatives as part of the overall asset/liability management process and in mortgage banking activities. Substantially all such instruments are used to manage risk related to changes in interest rates. Financial derivatives primarily consist of interest rate swaps, caps and floors, and futures and forward contracts. Interest rate swaps, including swaps with index-amortizing characteristics, are agreements with a counterparty to exchange periodic interest payments calculated on a notional principal amount. Interest rate swaps used to alter the repricing structure of interest-bearing assets or liabilities are accounted for under the accrual method. To qualify for such accounting, the swaps must be designated to interest-bearing assets or liabilities and alter their interest rate characteristics (such as from fixed to variable, variable to fixed, or one variable index to another) over the expected term of the swap agreements or the designated instruments, whichever is shorter. Under this method, the net amount payable or

receivable from interest rate swaps is accrued as an adjustment to interest income or expense of the designated instruments. 51

31 NOTES TO CONSOLIDATED FINANCIAL STATEMENTS Changes in fair value of interest rate swaps accounted for under the accrual method are not reflected in the accompanying financial statements unless designated to an instrument accounted for at fair value. Realized gains and losses on terminated interest rate swaps are deferred as an adjustment to the carrying amount of the designated instruments and amortized over the shorter of the remaining original life of the agreements or the designated instruments. If the designated instruments are disposed of, the fair value of the interest rate swap or unamortized deferred gains or losses are included in the determination of the gain or loss on the disposition of such instruments. Interest rate swaps not qualifying for accrual accounting are marked to market in the results of operations. Interest rate caps and floors are agreements where, for a fee, the counterparty agrees to pay the Corporation the amount, if any, by which a specified market interest rate is higher or lower than a defined rate applied to a notional amount. To qualify for accrual accounting, interest rate caps and floors must be designated to interest-bearing assets or liabilities and modify their interest rate characteristics (such as modifying a fixed-rate asset to a floating-rate asset when rates exceed the defined cap rate) over the term of the agreement or the designated instruments, whichever is shorter. Premiums on interest rate caps and floors are deferred and amortized over the life of the agreement as an adjustment to interest income or interest expense of the designated instruments. Unamortized premiums are included in other assets. Payments received on interest rate caps and floors are recognized under the accrual method as an adjustment to interest income or expense of the designated instruments. Changes in fair value of interest rate caps accounted for under the accrual method are not reflected in the accompanying financial statements unless designated to an instrument accounted for at fair value. Upon termination of an interest rate cap or floor, any losses, measured by the difference between the unamortized premium and fair value, would be recognized immediately in the results of operations. Any gains resulting from such terminations would be deferred and amortized as an adjustment to interest income or expense of the designated instruments over the shorter of the remaining life of the interest rate contract or the designated instrument. If the designated instruments are disposed of, any unrealized gains associated with the interest rate caps or floors or unamortized deferred gains, are included in the determination of the gain or loss on the disposition of such instruments. Interest rate caps or floors not qualifying for accrual accounting are marked to market in the results of operations. Forward contracts provide for the delivery of financial instruments at a specified future date and at a specified price or yield. The Corporation uses forward contracts primarily to manage risk associated with its mortgage banking activities. Realized gains and losses on mandatory and optional delivery forward commitments are recorded in mortgage banking income in the period settlement occurs. Unrealized gains or losses are considered in the lower of cost or market valuation of loans held for sale. Futures contracts are used to hedge interest rate risk. To qualify for hedge accounting, the futures contract must be designated as a hedge of an asset, liability, firm commitment or anticipated transaction that is probable of occurring and whose significant terms have been identified. Such instruments must expose the Corporation to interest rate risk and the futures contract must reduce such risk. Under hedge accounting, gains and losses on futures contracts are deferred and included in the carrying value of related assets and liabilities. The deferred gains and losses are amortized as a yield adjustment over the expected life of the hedged instrument. If the hedged instruments are disposed of, the unamortized deferred gains or losses are included in the determination of the gain/loss on the disposition of such instruments. In addition, the Corporation enters into foreign currency exchange contracts to accommodate customers. The fair value of such activity is recorded in other assets. Realized and unrealized gains and losses are included in other income. INCOME TAXES Effective January 1, 1993, the Corporation adopted SFAS No. 109, "Accounting for Income Taxes," which requires the liability method to account for deferred income taxes. Under this method, deferred tax assets and liabilities are determined based on differences between financial reporting and tax bases of assets and liabilities and are measured using the enacted tax rates and law that will be in effect when the differences are expected to reverse. Previously, deferred income taxes were accounted for using the deferred method. The cumulative effect of the change increased 1993 net income by $29.9 million, or $.09 per fully diluted share. POSTEMPLOYMENT BENEFITS Effective January 1, 1994, the

Corporation adopted SFAS No. 112, "Employers' Accounting for Postemployment Benefits." SFAS No. 112 requires accrual of a liability for benefits to be paid to former or inactive employees after employment, but before retirement. The cumulative effect of the change in accounting decreased net income by $7.5 million, or $.02 per 52

32 fully diluted share. Prior to 1994, the Corporation accounted for postemployment benefits on a cash basis. STOCK OPTIONS Employee stock options are accounted for under Accounting Principles Board Opinion ("APB") No. 25, "Accounting for Stock Issued to Employees". Stock options are granted at exercise prices not less than the fair market value of common stock on the date of grant. Under APB No. 25, no compensation expense is recognized pursuant to the Corporation's stock option plans. TREASURY STOCK The Corporation records common stock purchased for treasury at cost. At the date of subsequent reissue, the treasury stock account is reduced by the cost of such stock on the first-in, first-out basis. EARNINGS PER COMMON SHARE Primary earnings per common share is calculated by dividing net income adjusted for preferred stock dividends declared by the sum of the weighted average number of shares of common stock outstanding and the number of shares of common stock which would be issued assuming the exercise of stock options during each period. Fully diluted earnings per common share is based on net income adjusted for interest expense, net of tax, on outstanding convertible debentures and dividends declared on nonconvertible preferred stock. The weighted average number of shares of common stock outstanding is increased by the assumed conversion of outstanding convertible preferred stock and convertible debentures from the beginning of the year or date of issuance, if later, and the number of shares of common stock which would be issued assuming the exercise of stock options. Such adjustments to net income and the weighted average number of shares of common stock outstanding are made only when such adjustments dilute earnings per common share. NOTE 2 MERGERS AND ACQUISITIONS On December 31, 1995, Midlantic merged with the Corporation. Each share of Midlantic common stock outstanding was converted into 2.05 shares of the Corporation's common stock. The Corporation issued approximately 112 million shares of common stock and cash in lieu of fractional shares in connection with the merger. The transaction was accounted for as a pooling of interests and, accordingly, all financial information has been restated as if the entities were combined for all prior periods. The following table sets forth separate company financial information immediately prior to the merger and, accordingly, such information does not include special charges related to the merger. Year ended December 31, 1995 In millions PNC Midlantic - ------------------------------------------------------------ Net interest income $1,502 $640 Net income 367 233 - ------------------------------------------------------------ On October 6, 1995, the Corporation acquired Chemical New Jersey Holdings, Inc., and its wholly-owned subsidiary Chemical Bank New Jersey, N.A. ("Chemical") consisting of 81 branches in southern and central New Jersey with total assets of $3.2 billion and retail core deposits of $2.7 billion. The Corporation paid $492 million in cash and the transaction was accounted for under the purchase method. In February 1995, the Corporation acquired BlackRock Financial Management, L.P., a New York-based, fixed-income investment management firm with approximately $25 billion in assets under management at closing. The Corporation paid $71 million in cash and issued $169 million of unsecured notes. The transaction was accounted for under the purchase method. During 1994, the Corporation acquired United Federal Bancorp, Inc., State College, Pennsylvania, and First Eastern Corp., Wilkes-Barre, Pennsylvania. The acquisitions added assets and deposits of $2.8 billion and $2.4 billion, respectively. The Corporation paid $486 million and accounted for the acquisitions under the purchase method. NOTE 3 CASH FLOWS For the statement of cash flows, the Corporation defines cash and due from banks as cash and cash equivalents. The table below sets forth information pertaining to acquisitions and divestitures which affect cash flows.

Year ended December 31 In millions 1995 1994 1993 - ------------------------------------------------------------------- Assets acquired $3,932 $3,197 $8,896 Liabilities assumed 3,230 2,594 8,477 Cash paid 661 603 419 Cash and due from banks received 710 128 244 - ------------------------------------------------------------------- 53

33 NOTES TO CONSOLIDATED FINANCIAL STATEMENTS NOTE 4 SECURITIES 1995 1994 --------------------------------------------- --------------------------------------------- Unrealized Unrealized December 31 Amortized ----------------- Fair Amortized ----------------- Fair In millions Cost Gains Losses Value Cost Gains Losses Value - -------------------------------------------------------------------------------------------------------------------------------- Securities available for sale Debt securities U.S. Treasury $ 3,211 $ 69 $ 3,280 $ 671 $ 8 $ 663 U.S. Government agencies and corporations Mortgage-related 7,510 24 $75 7,459 2,161 69 2,092 Other 1,030 5 1 1,034 25 4 21 State and municipal 343 25 1 367 8 1 7 Asset-backed private placement 1,597 7 1,604 Other debt Mortgage-related 1,121 2 10 1,113 749 17 732 Other 525 3 3 525 149 $ 2 5 146 Corporate stocks and other 455 4 2 457 133 2 6 129 ------------------------------------------------------------------------------------------------ Total securities available for sale 15,792 139 92 15,839 3,896 4 110 3,790 Investment securities Debt securities U.S. Treasury 3,317 121 3,196 U.S. Government agencies and corporations Mortgage-related 11,795 1 1,088 10,708 Other 1,000 28 972 State and municipal 360 12 2 370 Asset-backed private placements 1,597 33 1,564 Other debt Mortgage-related 726 43 683 Other 775 20 755 Other 310 1 311 ------------------------------------------ Total investment securities 19,880 14 1,335 18,559 ------------------------------------------------------------------------------------------------ Total securities $15,792 $139 $92 $15,839 $23,776 $18 $1,445 $22,349 - -------------------------------------------------------------------------------------------------------------------------------- In connection with implementing accounting guidance issued in November 1995, the Corporation reassessed its investment securities' classifications. All securities previously classified as held to maturity were reclassified to the available-for-sale portfolio. The reclassifications were accounted for at fair value and included the fair value of associated financial derivatives. Subsequently, to accelerate the balance sheet repositioning begun in the latter half of 1994, the Corporation sold $1.9 billion of U.S. Treasury securities and $4.1 billion of collateralized mortgage obligations at a loss of $61.3 million. In connection with the sales, losses totaling $228.2 million, included in net securities losses, were recognized on terminated pay-fixed interest rate swaps with a notional value of $5.1 billion that were designated to such securities. At December 31, 1995, $6.1 billion notional value of interest rate swaps and caps were associated with securities available for sale. The fair value of securities available for sale at year- end 1995 set forth above includes unrealized gains of $6 million on related derivatives. No financial derivatives were designated to securities available for sale at year-end 1994. Interest rate swaps and caps with a notional value of $11.1 billion, fair value of $204 million and carrying value of $130 million were designated to investmentsecurities at December 31, 1994. The fair value of these derivatives is not included in the values set forth above. 54

34 The following table presents the amortized cost and fair value of debt securities at December 31, 1995 by remaining contractual maturity. Based on expected prepayment rates and historical experience, the expected weighted average maturity of U.S. Government agency debt and mortgage-related and asset-backed securities was approximately 2 years and 10 months at December 31, 1995. December 31, 1995 Amortized Fair In millions Cost Value - ------------------------------------------------------------------------------------------------------------------------------- One year or less $ 1,985 $ 1,989 After one year through five years 1,327 1,394 After five years through ten years 87 93 After ten years 254 267 U.S. Government agency debt 1,030 1,034 Mortgage-related securities 8,631 8,572 Asset-backed securities 2,023 2,033 ----------------------------------------- Total $15,337 $15,382 - ------------------------------------------------------------------------------------------------------------------------------- Information relating to sales of securities, including the effects of related financial derivatives, is set forth in the following table: Year ended December 31 Gross Gross In millions Proceeds Gains Losses - ------------------------------------------------------------------------------------------------------------------------------- 1995 $ 8,125 $ 11.9 $291.6 1994 14,147 65.1 206.7 1993 17,250 199.7 5.0 - ------------------------------------------------------------------------------------------------------------------------------- The carrying value of securities pledged to secure public and trust deposits, repurchase agreements and for other purposes at December 31, 1995 was $7.6 billion. NOTE 5 LOANS AND COMMITMENTS TO EXTEND CREDIT Loans and commitments to extend credit were as follows: 1995 1994 ----------------------- ------------------------- Net Net Unfunded Underfunded December 31 Out- Com- Out- Com- In millions standing mitments standing mitments - ----------------------------------------------------------------------------------------- Consumer $13,539 $ 7,335 $11,851 $ 6,050 Residential mortgage 11,689 554 9,746 769 Commercial 16,812 24,282 15,545 20,794 Commercial real estate Commercial mortgage 2,775 9 2,837 20 Real estate project 2,139 742 2,226 649 Other 2,102 892 2,223 917 Unearned income (403) (385) ---------------------------------------------------- Total, net of unearned income $48,653 $33,814 $44,043 $29,199 - ----------------------------------------------------------------------------------------- Commitments to extend credit represent arrangements to lend funds provided there is no violation of specified contractual conditions. Such amounts are net of participations and syndications, primarily to financial institutions, totaling $4.2 billion and $2.5 billion at December 31, 1995 and 1994, respectively. Commercial commitments generally have fixed expiration dates, may require payment of a fee, and contain termination clauses in the event of deterioration in the customer's credit quality. Most commercial commitments expire unfunded, and therefore cash requirements are substantially less than the total commitment. Consumer commitments are primarily for home equity and credit card lines. Loan outstandings and related unfunded commitments are concentrated within affiliate markets, which include Delaware, Indiana, Kentucky, New Jersey, Ohio and Pennsylvania. At December 31, 1995, no specific industry concentration exceeded 5 percent of total outstandings and unfunded commitments.

Letters of credit totaled $4.5 billion and $4.6 billion at December 31, 1995 and 1994, respectively, and consist primarily of standby letters of credit which commit the Corporation to make payments on behalf of customers when certain specified future events occur. Such instruments are typically issued to support industrial revenue bonds, commercial paper, and bid or performance related contracts. At year-end 1995, the largest industry concentration within standby letters of credit was healthcare, which accounted for approximately 18 percent of the total. Maturities for standby letters of credit ranged from 1996 to 2020. At December 31, 1995, $475 million of loans were pledged to secure borrowings and for other purposes. Certain directors and executive officers of the Corporation and its significant subsidiaries, as well as certain affiliated companies of these directors and officers, were customers of and had loans with subsidiary banks in the ordinary course of business. All such loans were on substantially the same terms, including interest rates and collateral, as those prevailing at the time for comparable transactions with other customers and did not involve more than a normal risk of collectibility. The aggregate dollar amounts of these loans were $379 million and $436 million at December 31, 1995 and 1994, respectively. During 1995, new loans of $657 million were funded, and repayments totaled $714 million. 55

35 NOTE TO CONSOLIDATED FINANCIAL STATEMENTS NOTE 6 NONPERFORMING ASSETS Nonperforming assets are comprised of nonaccrual and restructured loans, and foreclosed assets. These assets were as follows: December 31 In millions 1995 1994 - ------------------------------------------------------------- Nonaccrual loans $335 $496 Restructured loans 23 69 ---------------------- Total nonperforming loans 358 565 Foreclosed assets 178 192 ---------------------- Total nonperforming assets $536 $757 - ------------------------------------------------------------- Interest on nonperforming loans was as follows: Year ended December 31 In millions 1995 1994 1993 - ------------------------------------------------------------- Interest computed on original terms $36 $54 $74 Interest recognized 10 14 19 - ------------------------------------------------------------- At December 31, 1995 and 1994, unfunded commitments to lend additional funds with respect to nonperforming assets totaled $4 million and $14 million, respectively. At December 31, 1995 and 1994, foreclosed assets are reported net of valuation allowances of $37 million and $52 million, respectively. Gains on sales of foreclosed assets resulted in net foreclosed asset income of $11 million and $15 million in 1995 and 1994, respectively. Net foreclosed asset expense totaled $42 million in 1993. Net foreclosed asset income or expense is included in other noninterest expense. NOTE 7 ALLOWANCE FOR CREDIT LOSSES The following table presents changes in the allowance for credit losses: In millions 1995 1994 1993 - ------------------------------------------------------------- January 1 $1,352 $1,372 $1,568 Charge-offs (240) (289) (707) Recoveries 107 120 119 ------------------------------ Net charge-offs (133) (169) (588) Provision for credit losses 6 84 350 Acquisitions 34 65 42 ------------------------------ December 31 $1,259 $1,352 $1,372 - ------------------------------------------------------------- Information with respect to impaired loans and the related allowance determined in accordance with SFAS No. 114 is set forth below. In millions 1995 - ------------------------------------------------------------- December 31 Impaired loans With a related allowance for credit losses $154 Without a related allowance for credit losses 143 ----- Total impaired loans $297 ----- Allowance for credit losses $ 29 Year ended December 31 Average impaired loans $365 Interest income recognized 6 - -------------------------------------------------------------

NOTE 8 PREMISES, EQUIPMENT AND LEASEHOLD IMPROVEMENTS Premises, equipment and leasehold improvements, stated at cost less accumulated depreciation and amortization, were as follows: December 31 In millions 1995 1994 - ------------------------------------------------------------- Land $ 101 $ 87 Buildings 553 538 Equipment 1,069 949 Leasehold improvements 186 175 ------------------ 1,909 1,749 Accumulated depreciation and amortization (1,002) (899) ------------------ Net book value $ 907 $ 850 - ------------------------------------------------------------- Depreciation and amortization expense on premises, equipment and leasehold improvements totaled $134.7 million in 1995, $124.1 million in 1994 and $115.7 million in 1993. Certain facilities and equipment are leased under agreements expiring at various dates until the year 2066. Substantially all such leases are accounted for as operating leases. Rental expense on such leases amounted to $95.0 million in 1995, $96.7 million in 1994 and $79.5 million in 1993. At December 31, 1995 and 1994, required minimum annual rentals due on noncancelable leases having terms in excess of one year aggregated $478.3 million and $364.2 million, respectively. Minimum annual rentals for each of the years 1996 through 2000 are $77.5 million, $67.3 million, $53.1 million, $45.9 million and $37.6 million, respectively. 56

36 NOTE 9 INTANGIBLE ASSETS AND MORTGAGE SERVICING RIGHTS Intangible assets and MSR, net of amortization, and, with respect to mortgage servicing rights, allowances for impairment, consisted of the following: December 31 In millions 1995 1994 --------------------------------------------------------------------------- Goodwill and other $ 997 $476 Mortgage servicing rights 268 303 -------------------- Total $1,265 $779 - --------------------------------------------------------------------------- At December 31, 1995, the fair value of capitalized MSR and the allowance for impairment totaled $328.7 million and $10.9 million, respectively. Amortization of MSR totaled $71.5 million, $63.1 million and $17.1 million in 1995, 1994 and 1993, respectively. In March 1995, SFAS No. 121, "Accounting for the Impairment of Long-Lived Assets and Long-Lived Assets to be Disposed Of," was issued. This Standard requires that long- lived assets and certain identifiable intangible assets, such as goodwill, be reviewed for impairment whenever events or changes in circumstances indicate that the carrying amount of an asset may not be recoverable. Impairment is measured based on the present value of expected future cash flows from the asset and its eventual disposition. Management expects to adopt this Standard effective January 1, 1996 and such adoption is not expected to have a material impact on financial position or results of operations. NOTE 10 NOTES AND DEBENTURES Notes and debentures consist of the following: December 31 In millions 1995 1994 - ------------------------------------------------------------------------ Bank notes $ 6,256 $ 8,825 Federal Home Loan Bank 2,393 1,384 Subordinated notes 1,359 1,019 Senior notes 2 164 Student Loan Marketing Association 500 ESOP 101 110 Other 287 125 ----------------------- Total $10,398 $12,127 - ------------------------------------------------------------------------ Substantially all bank notes mature in 1996 and have various interest rates that range from 5.23 percent to 6.63 percent. Obligations to the Federal Home Loan Bank have various maturities ranging from 1996 to 2002 and interest rates that range from 1.25 percent to 8.76 percent. The Student Loan Marketing Association obligations matured in 1995 and had various interest rates that ranged from 4.97 percent to 6.08 percent. Senior and subordinated notes are not redeemable prior to maturity. Interest is payable semiannually, and the payment of principal and interest is unconditionally guaranteed by the parent company. The senior and subordinated notes have various maturities ranging from 1997 to 2008 and interest rates that range from 6.13 percent to 10.55 percent. Subordinated notes totaling $200 million are to be exchanged at maturity for common stock or perpetual preferred stock of the Corporation having a market value equal to the principal amount of the notes or, upon satisfaction of certain conditions, the Corporation may elect to repay the notes in cash. Subordinated notes totaling $67.7 million are convertible into common stock at a conversion price of $23.41 per share. The debentures are redeemable by the Corporation at a price equal to 100.8 percent of principal amount and at prices declining to par value on or after July 1, 1996. The Employee Stock Ownership Plan ("ESOP") borrowing is unconditionally guaranteed by the parent company and consists of a series of medium-term, fixed-rate notes with maturities that range from 1996 to 2000 and interest rates ranging from 4.25 percent to 5.43 percent. Interest expense on

the borrowing was $5.0 million in 1995, $5.4 million in 1994 and $4.9 million in 1993. Notes and debentures have scheduled repayments for the years 1996 through 2000 and thereafter of $7.8 billion, $394 million, $152 million, $290 million, $70 million, and $1.6 billion, respectively. 57

37 NOTES TO CONSOLIDATED FINANCIAL STATEMENTS NOTE 11 SHAREHOLDERS' EQUITY Information related to the Corporation's preferred stock is as follows: Shares Outstanding Redemption/Liquidation -------------------------- December 31 Value Per Share 1995 1994 - ------------------------------------------------------------------------------------------------------- Authorized $1 par value 17,529,342 17,601,524 No par value 40,000,000 Issued and outstanding $1.80 Series A $ 40 17,846 19,348 1.80 Series B 40 4,752 7,425 1.60 Series C 20 356,347 393,089 1.80 Series D 20 469,839 501,104 MC - Series A (no par value) 100 500,000 ----------------------------- Total 848,784 1,420,966 - ------------------------------------------------------------------------------------------------------- Series A through D are cumulative and except for Series B, are redeemable at the option of the Corporation. During 1995, the MC-Series A preferred stock was redeemed. Holders of preferred stock are entitled to a number of votes equal to the number of full shares of common stock into which such preferred stock is convertible. Holders of preferred stock are entitled to the following conversion privileges: (i) one share of Series A or Series B is convertible into eight shares of common stock; and (ii) 2.4 shares of Series C or Series D are convertible into four shares of common stock. The Corporation has a dividend reinvestment and stock purchase plan. Holders of preferred stock and common stock may participate in the plan which provides that additional shares of common stock may be purchased at market value with reinvested dividends and voluntary cash payments. The following numbers of shares of common stock were purchased by shareholders pursuant to such plan: 1,177,481 shares in 1995; 877,639 shares in 1994; and 591,785 shares in 1993. The Corporation had reserved approximately 20.3 million common shares to be issued in connection with certain employee benefit plans and the conversion of certain debt and equity securities. The following table sets forth purchases and issuances of the Corporation's common stock held in treasury. TREASURY STOCK ACTIVITY Shares in thousands, dollars in millions Shares Amount - ---------------------------------------------------------------------------- January 1, 1993 (3) Shares purchased (819) $ (19) Shares issued 533 10 ---------------------------- December 31, 1993 (289) (9) Shares purchased (3,684) (89) Shares issued 1,158 33 ---------------------------- December 31, 1994 (2,815) (65) Shares purchased (10,252) (236) Shares issued 5,578 117 Midlantic merger - shares issued 7,489 184 ---------------------------- December 31, 1995 - $ - - ---------------------------------------------------------------------------- NOTE 12 FINANCIAL DERIVATIVES The Corporation uses a variety of off-balance-sheet financial derivatives as part of its overall interest rate risk management process and to manage risk associated with mortgage banking activities. Financial derivatives involve, to varying degrees, interest rate and credit risk in excess of the amount recognized in the balance sheet but less than the notional amount of the contract. For interest rate swaps, caps and floors, only periodic cash payments and, with respect to caps and floors, premiums, are exchanged; therefore, cash requirements and exposure to credit risk are significantly less than the notional value. The Corporation manages these risks as part of its asset/liability

management process and through the Corporation's credit policies and procedures. The Corporation seeks to minimize the credit risk by entering into transactions with only a select number of high-quality institutions, establishing credit limits, requiring bilateral-netting agreements, and, in certain instances, segregated collateral. Receive-fixed interest rate swaps are primarily designated to securities available for sale, commercial loans, interest- bearing deposits, and borrowed funds. Interest-bearing deposits include time deposits and transaction accounts, such as demand and money market. Historical data indicate there is a fixed-rate component to the rates paid on transaction accounts. Receive-fixed interest rate swaps convert this fixed component to a variable rate. The notional value of index-amortizing interest rate swaps amortize on predetermined dates and in predetermined amounts based on market movements of the designated indices, which are pri- 58

38 marily 3-year U.S. Treasury constant maturities and 3-month LIBOR. Periodically, the Corporation receives payments based on fixed interest rates and makes payments based on floating money market indices, primarily 1-month and 3-month LIBOR, calculated on the notional amounts. The following tables set forth the notional value of financial derivatives at December 31, 1995 and 1994, related weighted average interest rates and estimated fair values. FINANCIAL DERIVATIVES Weighted Average Rates December 31, 1995 Notional ----------------------------- Estimated Dollars in millions Value Paid Received Fair Value - ---------------------------------------------------------------------------------------------------------------------------------- Interest rate risk management Asset rate conversion Interest rate swaps Pay fixed designated to Securities $ 599 4.68% 5.87% $ 6 Commercial loans 290 8.01 5.87 (24) Receive-fixed index amortizing designated to commercial loans 2,471 5.90 5.23 (14) Receive fixed designated to Commercial loans 975 5.89 6.31 19 Short-term investments 200 5.84 7.23 9 Basis swaps designated to commercial real estate loans 300 5.96 5.85 Interest rate caps designated to Securities 5,500 NM NM 6 Mortgage loans 10 NM NM ------- ---- Total asset rate conversion 10,345 2 Liability rate conversion Interest rate swaps Pay fixed designated to Other borrowings 1,125 5.68 5.60 (5) Bank notes 600 5.41 5.79 Deposits 15 4.98 5.94 Receive-fixed index amortizing designated to deposits 740 5.93 5.32 (4) Receive fixed designated to Certificates of deposit 625 5.94 5.76 7 Bank notes 650 5.85 5.90 14 Other borrowings 330 5.82 6.37 13 Deposit notes 5 5.93 8.48 Basis swaps designated to bank notes 465 5.76 5.49 8 ------- ---- Total liability rate conversion 4,555 33 ------- ---- Total interest rate risk management 14,900 35 Mortgage banking activities Commitments to purchase forward contracts - originations 431 NM NM Commitments to sell forward contracts - originations 751 NM NM (4) Interest rate floors - MSR 500 NM NM 9 Receive-fixed interest rate swaps - MSR 125 NM NM 7 ------- ---- Total mortgage banking 1,807 12 ------- ---- Total financial derivatives $16,707 $ 47 - ---------------------------------------------------------------------------------------------------------------------------------- NM - not meaningful The floating rate portion of interest rate contracts is based on money-market indices. As a percent of notional value, 71 percent were based on 3-month LIBOR, 19 percent on 1-month LIBOR and the remainder on other short-term indices. 59

39 NOTES TO CONSOLIDATED FINANCIAL STATEMENTS FINANCIAL DERIVATIVES Weighted Average Rates December 31, 1994 Notional ----------------------------- Estimated Dollars in millions Value Paid Received Fair Value - ---------------------------------------------------------------------------------------------------------------------------------- Interest rate risk management Asset rate conversion Interest rate swaps Pay fixed designated to Securities $ 5,649 7.53% 3.91% $ 72 Commercial loans and mortgages 303 8.87 6.05 (14) Receive-fixed index amortizing designated to commercial loans 6,950 6.36 5.54 (498) Receive fixed designated to commercial loans 1,625 5.85 5.56 (38) Basis swaps designated to long-term commercial real estate loans 300 5.96 6.04 (3) Interest rate caps designated to securities 5,500 NM NM 132 ------- ----- Total asset rate conversion 20,327 (349) Liability rate conversion Interest rate swaps Pay fixed designated to Overnight and other borrowings 350 5.94 6.16 (3) Deposits 15 4.98 6.13 Receive-fixed index amortizing designated to Deposits 3,950 6.14 5.69 (238) Certificates of deposit 500 5.76 5.29 (36) Receive-fixed index amortizing designated to Certificates of deposit 1,010 5.76 5.75 (19) Deposits 9 6.13 8.65 ------- ----- Total liability rate conversion 5,834 (296) Mortgage banking activities Commitments to purchase forward contracts - originations 16 NM NM Commitments to sell forward contracts - originations 350 NM NM ------- Total mortgage banking 366 ------- ----- Total financial derivatives $26,527 $(645) - ---------------------------------------------------------------------------------------------------------------------------------- NM - not meaningful The floating rate portion of interest rate contracts is based on money-market indices. As a percent of notional value, 83 percent were based on 3-month LIBOR, 13 percent on 1-month LIBOR and the remainder on other short-term indices. The Corporation's pay-fixed interest rate and basis swaps are primarily used to alter the repricing characteristics of overnight and other short term borrowings. With respect to pay-fixed swaps, the Corporation receives payments based on floating money market indices, primarily 3-month LIBOR, and pays fixed interest rates. Basis swaps convert variable rate borrowings from one variable index to another. The Corporation's swaps do not contain leverage or any similar features. The Corporation uses a combination of on-balance-sheet instruments and financial derivatives to manage risk associated with its mortgage banking activities. The inherent risk affecting the value of MSR is the potential for the related mortgages to prepay, thereby eliminating the underlying servicing fee income stream. Prepayment is primarily related to declining interest rates. In 1995, the Corporation entered into a combination of interest rate floors and receive-fixed interest rate swaps designed to reduce this risk. If interest rates decrease, the value of the interest rate swaps and floors should increase and the value of the related MSR should decline. Forward contracts are used to manage risk positions associated with mortgage origination activities. Substantially all forward contracts mature within 90 days of origination. Forward contracts are traded in over-the-counter markets and do not have standardized terms. Counterparties to the Corporation's forward contracts are primarily U.S. Government agencies and brokers and dealers in mortgage-backed securities. In the event the counterparty is unable to meet its contractual obligations, the Corporation may be exposed to selling or purchasing mortgage loans at prevailing market prices. 60

40 FAIR VALUES OF FINANCIAL DERIVATIVES Positive Negative Total December 31 Notional Fair Notional Fair Notional In millions Value Value Value Value Value - ----------------------------------------------------------------------------------- 1995 Interest rate swaps $ 4,249 $ 77 $ 5,141 $ (48) $ 9,390 Interest rate caps 5,510 6 5,510 Mortgage banking activities 769 16 1,038 (4) 1,807 ------------------------------------------------- Total $10,528 $ 99 $ 6,179 $ (52) $16,707 - ----------------------------------------------------------------------------------- 1994 Interest rate swaps $ 5,878 $ 80 $14,783 $(857) $20,661 Interest rate caps 5,500 132 5,500 Mortgage banking activities 366 366 ------------------------------------------------- Total mortgage banking $11,744 $212 $14,783 $(857) $26,527 - ----------------------------------------------------------------------------------- The following table sets forth the maturity distribution and weighted average interest rates of financial derivatives used for interest rate risk management. The maturity distribution of receive-fixed index amortizing swaps is based on implied forward rates. Weighted average interest rates paid or received represent contractual interest rates in effect on December 31, 1995 and expected rates based on implied forward rates. MATURITY DISTRIBUTION OF FINANCIAL DERIVATIVES Weighted Average Rates ----------------------------------------------------- Expected Based on At December 31, 1995 Implied Forward Rates December 31, 1995 Notional ----------------------------------------------------- Dollars in millions Value Paid Received Paid Received - ------------------------------------------------------------------------------------------------------------- Interest rate swaps Receive fixed index amortizing 1996 $3,169 5.90% 5.25% 5.34% 5.25% 1997 42 5.96 5.54 5.15 5.54 ------ Total $3,211 5.90 5.25 5.34 5.25 ------------------------------------------------------------------ Receive fixed 1996 $1,855 5.89% 5.88% 5.31% 5.88% 1997 280 5.92 6.18 5.21 6.18 1998 575 5.84 7.01 5.27 7.01 1999 and beyond 75 5.85 7.00 5.54 7.00 ------ Total $2,785 5.88 6.17 5.30 6.17 ------------------------------------------------------------------ Pay-fixed 1996 $1,515 5.77% 5.68% 5.77% 5.32% 1997 989 5.04 5.81 5.04 5.19 1998 50 8.28 5.88 8.28 5.31 1999 and beyond 75 9.43 5.94 9.43 5.60 ------ Total $2,629 5.65 5.74 5.65 5.28 ------------------------------------------------------------------ Basis swaps 1996 $ 765 5.84% 5.63% 5.59% 5.21% ------------------------------------------------------------------ Interest rate caps 1996 $ 10 NM NM NM NM 1997 5,500 NM NM NM NM ------ Total $5,510 - ------------------------------------------------------------------------------------------------------------- NM - Not meaningful Interest rate caps with a notional value of $5.5 billion require the counterparty to pay the Corporation the excess, if any, of 3-month LIBOR over the specified cap rate. At December 31, 1995, 3-month LIBOR was 5.63 percent and the specified cap rate was 6.50 percent. 61

41 NOTES TO CONSOLIDATED FINANCIAL STATEMENTS During 1995, $4.6 billion notional value of index amortizing receive-fixed interest rate swaps and $5.1 billion notional value of pay-fixed interest rate swaps were terminated. The loss on the index amortizing swaps was deferred and is being amortized as an adjustment to interest income or expense of the designated instruments. At December 31, 1995, the unamortized loss was $6.1 million and will be amortized over a weighted-average remaining period of 6 months. Losses totaling $228.2 million on terminated pay-fixed swaps associated with securities sold are included in net securities losses. In connection with the Midlantic merger, $5.5 billion notional value of interest rate caps that reduced exposure to higher interest rates within a specified range were terminated at a loss of $79.9 million. The interest rate cap was terminated as part of the realignment of the combined asset and liability position of the Corporation taking into account the interest rate risk profile of Midlantic. The amount is included as a component of special charges. Concurrently, the Corporation purchased $5.5 billion notional value interest rate caps that require the counterparty to pay the Corporation the excess, if any, of 3- month LIBOR over a specified cap rate without limitation, currently 6.50 percent, computed quarterly based on the notional value of the contracts. At December 31, 1995, 3- month LIBOR was 5.63 percent. The contracts expire during the third and fourth quarters of 1997. At December 31, 1995, credit exposure related to interest rate swaps and caps totaled $32.7 million. NOTE 13 SPECIAL CHARGES In connection with the Midlantic merger, the Corporation recorded special charges totaling $260 million in 1995. These charges represent estimated costs of integrating and consolidating branch networks, back office and administrative facilities, professional services and the cost to terminate an interest rate cap position. Branch network integration and consolidation will begin during the first half of 1996 with the closing or consolidation of overlapping and unprofitable facilities and operations. Consolidation of the back office and administrative facilities is expected to begin later in 1996. SPECIAL CHARGES Year ended December 31 In millions 1995 1994 - ------------------------------------------------------------- Staff related $ 42 $ 18 Net occupancy 72 12 Equipment 17 2 Professional services 31 Other 18 16 Interest rate cap termination 80 ----------------- Total special charges $260 $48 - ------------------------------------------------------------- Special charges in 1994 were for costs to consolidate the Corporation's telebanking centers and rationalization of the retail branch networks. NOTE 14 EMPLOYEE BENEFIT PLANS INCENTIVE SAVINGS PLANS The Corporation sponsors incentive savings plans covering substantially all employees. Under the plans, employee contributions up to 3 percent or 6 percent of base pay, subject to Internal Revenue Service limitations, are matched with cash or shares of the Corporation's common stock. Contributions for one of the plans are matched primarily by shares of common stock held by the Corporation's ESOP. The Corporation makes annual contributions to the ESOP equal to the debt service requirements on the ESOP borrowing less dividends received by the ESOP. All dividends received by the ESOP are used to pay debt service. During 1995, 1994 and 1993, dividends used for debt service totaled $9.9 million, $9.5 million and $8.5 million, respectively. To satisfy additional debt service requirements, the Corporation contributed $8.5 million in 1995, $7.6 million in 1994 and $8.8 million in 1993. As the ESOP borrowing is repaid, shares are allocated to employees who made contributions during the year based on the proportion of annual debt service to total debt service. The Corporation includes all ESOP shares as common shares outstanding in its earnings per share computation. The components of ESOP shares are as follows:

Year end December 31 In thousands 1995 1994 - ------------------------------------------------------------- Allocated shares 2,503 1,956 Shares released for allocation 792 673 Unallocated shares 3,825 4,617 Shares retired during year (238) (126) ------------------- Total ESOP shares 6,882 7,120 - ------------------------------------------------------------- 62

42 Compensation expense related to the portion of contributions matched with ESOP shares is determined based on the number of ESOP shares allocated. Compensation expense related to these plans was $18.1 million for 1995, $12.7 million for 1994 and $6.8 million for 1993. DEFINED BENEFIT PLANS The Corporation sponsors funded defined benefit pension plans covering substantially all employees. The plans provide pension benefits that are based on the average base salary for specified years of service prior to retirement. Pension contributions are made to the extent deductible under existing federal tax regulations. The Corporation also has unfunded non-qualified supplemental defined benefit retirement plans covering certain employees as defined in the plans. The following table sets forth the estimated funded status of defined benefit plans: December 31 In millions 1995 1994 - ------------------------------------------------------------- Accumulated benefit obligation Vested $550 $428 Nonvested 35 22 ---- ---- Accumulated benefit obligation 585 450 Effect of future compensation levels 149 103 ---- ---- Projected benefit obligation for services rendered to date 734 553 Plan assets at fair value, primarily listed common stocks, U.S. Government and agency securities, and collective funds 644 561 ---- ---- Plan assets (greater) less than projected benefit obligation 90 (8) Unrecognized net gain (loss) due to experience different from assumptions and the effect of changes in assumptions (62) 15 Unrecognized net asset 26 30 Unrecognized prior service cost (19) (22) --------------- Accrued pension cost $35 $15 - ------------------------------------------------------------- Net periodic defined benefit plan costs include the following components: Year ended December 31 In millions 1995 1994 1993 - ------------------------------------------------------------- Service cost - benefits earned during the period $ 24 $ 29 $ 23 Interest cost on projected benefit obligation 49 44 37 Actual return on plan assets (112) (9) (63) Net amortization and deferral 60 (42) 11 ------------------------ Net periodic pension costs $ 21 $ 22 $ 8 - ------------------------------------------------------------- Assumptions used to measure the projected benefit obligation and the expected return on assets included in net periodic pension costs are set forth in the following table. December 31 1995 1994 1993 - ------------------------------------------------------------- Discount 7.15% 8.75/8.50% 7.25/7.50% Increase in compensation levels 4.75 5.00/5.00 5.18/5.00 Expected long-term return on assets 9.50 10.00/8.50 10.00/8.50 - ------------------------------------------------------------- In addition to providing pension benefits, the Corporation provides certain health care and life insurance benefits for retired employees ("postretirement benefits") through various plans. A reconciliation of the accrued postretirement benefit obligation is as follows: December 31

In millions 1995 1994 - ------------------------------------------------------------- Accumulated postretirement benefit obligation Retirees $156 $143 Active employees 8 6 Other active plan participants 59 47 ---------------- Total accumulated postretirement obligation 223 196 Unrecognized prior service cost credit 56 62 Unrecognized net loss (27) (7) ---------------- Accrued postretirement benefit obligation $252 $251 - ------------------------------------------------------------- Net periodic postretirement benefit costs include the following components: Year ended December 31 In millions 1995 1994 1993 - ------------------------------------------------------------- Service cost - benefits earned during period $ 3 $ 3 $ 3 Interest cost on benefit obligation 15 15 11 Amortization of prior service cost (4) (3) (3) --- --- --- Net periodic postretirement benefit costs $14 $15 $11 - ------------------------------------------------------------- Assumptions used in accounting for the plans were: December 31 1995 1994 1993 - ------------------------------------------------------------- Discount rate 7.15% 8.75/8.00% 7.25/7.00% Expected health care cost trend rate Medical 7.50 9.10/5.00 10.70/5.00 Dental 7.00 7.40 7.80 - -------------------------------------------------------------- 63

43 NOTES TO CONSOLIDATED FINANCIAL STATEMENTS The health care cost trend rate declines until it stabilizes at 5.0 percent beginning 2001. A one percent increase in the health care trend rate would result in an increase of $255 thousand and $1.0 million in the service cost and interest cost components, respectively, and a $12.8 million increase in the accumulated postretirement benefit obligation. In connection with the Midlantic merger, the Corporation conformed Midlantic's accounting policy for postretirement benefits. As a result, a cumulative effect adjustment of $45.8 million net of tax was recorded, effective January 1, 1992. This change increased net income by $2.3 million for each of the three years in the period ended December 31, 1995. The Corporation has an employee stock purchase plan which covers a maximum of 5.2 million shares of common stock of which 1.0 million were available to be issued. Persons who have been continuously employed for at least one year are eligible to participate. Offering periods cover six months beginning June 1 and December 1 of each year. Common stock is purchased by participants at 85 percent of the lesser of fair market value on the first or last day of each offering period. No charge to earnings is required with respect to such noncompensatory plan. Shares issued pursuant to this plan were as follows: Year ended December 31 Shares Prices Per Share - --------------------------------------------------------------- 1995 463,907 $17.32 and $22.95 1994 403,692 $17.64 and $24.76 1993 276,517 $24.12 and $25.18 - --------------------------------------------------------------- NOTE 15 INCENTIVE PLANS The Corporation has a senior executive long-term incentive award plan ("Incentive Plan") that provides for the granting of incentive stock options, nonqualified options, stock appreciation rights ("SARs"), performance units and incentive shares. In any given year, the number of shares of common stock available for grants under the Incentive Plan may range from 1.5 percent to 3 percent of total issued shares of common stock, determined at the end of the preceding calendar year. Options are granted at exercise prices not less than the fair market value of common stock on the date of grant. Such options are exercisable twelve months from the date of grant. Payment of the option price may be in cash or shares of common stock at fair market value on the exercise date. The following table presents share data related to the Incentive Plan, a similar predecessor plan and other plans assumed in certain mergers. Option Price per Shares in thousands Common Share Shares - ----------------------------------------------------------------- January 1, 1993 $ 1.59 - $27.56 13,380 Granted 29.25 - 30.13 1,930 SARs exercised (10) Options exercised 1.59 - 27.56 (1,561) Terminated (235) ------ December 31, 1993 1.59 - 30.13 13,504 Granted 13.81 - 29.75 4,454 SARs exercised (73) Options exercised 1.59 - 27.56 (1,127) Terminated (172) ------ December 31, 1994 1.59 - 30.13 16,586 Granted 16.46 - 29.06 157 Options exercised 1.59 - 29.25 (2,996) Terminated (420) Options exchanged for PNC stock in connection with Midlantic merger (3,457) ------ December 31, 1995 $11.38 - $29.88 9,840 - ----------------------------------------------------------------- At December 31, 1995, options for 9,729,070 shares of common stock were exercisable. Shares of common stock available for the granting of options under the Incentive Plan and the predecessor plans were as follows: 10,225,990 at December 31, 1995, 13,094,887 at December 31, 1994 and 12,967,457 at December 31, 1993.

During 1995, incentive share awards for 323,000 shares of restricted common stock were granted under the Incentive Plan to certain executive officers. Such shares will be earned when market prices of the Corporation's common stock equal or exceed specified levels for defined periods. Any shares issued will be forfeited if the named executive officer leaves the Corporation's employ within two years after the applicable performance condition has been satisfied. During 1995, compensation expense recognized with respect to incentive share awards was $1.2 million. 64

44 NOTE 16 INCOME TAXES Income taxes related to operations, the tax effect of securities transactions, and the current and deferred portions of income taxes were as follows: Year ended December 31 In millions 1995 1994 1993 - -------------------------------------------------------------------- Operations $317 $365 $193 Securities transactions Equity and other 10 1 Debt (98) (57) 68 ------------------------------------ Total $219 $318 $262 - -------------------------------------------------------------------- Year ended December 31 In millions 1995 1994 1993 - -------------------------------------------------------------------- Current Federal $ 77 $293 $381 State 14 19 14 ------------------------------------ Total current 91 312 395 Deferred Federal 84 44 (112) State 44 (38) (21) ------------------------------------ Total deferred 128 6 (133) ------------------------------------ Total $219 $318 $262 - -------------------------------------------------------------------- Significant components of deferred tax assets and liabilities are as follows: December 31 In millions 1995 1994 - -------------------------------------------------------------------- Deferred tax assets Allowance for credit losses $413 $462 Compensation and benefits 113 116 Foreclosed assets 12 24 Net unrealized securities losses 44 Net operating loss and AMT carryforwards 23 85 Purchase accounting - deposits and other borrowings 32 60 Purchase accounting-other 27 22 Other 120 87 -------------------- Total deferred tax assets 740 900 Deferred tax liabilities Leasing 218 203 Depreciation 37 34 Net unrealized securities gains 19 Purchase accounting - loans and leases 45 48 Other 47 34 -------------------- Total deferred tax liabilities 366 319 -------------------- Net deferred tax asset $374 $581 - -------------------------------------------------------------------- At December 31, 1995, the Corporation had net operating loss carryforwards totaling $12.5 million which expire in 2008 and 2009, and $18.7 million of alternative minimum tax ("AMT") credit carryforwards. The AMT credit can be carried forward indefinitely. A reconciliation between the statutory and effective tax rates follows: Year ended December 31 1995 1994 1993 - -------------------------------------------------------------------- Statutory tax rate 35.0% 35.0% 35.0% State taxes 6.0 2.2 .8 Tax-exempt interest (4.5) (2.2) (3.0) Goodwill 1.7 1.8 1.2 Deferred tax valuation

allowance reduction (8.8) (9.6) Other, net (3.3) (1.7) (1.5) ------------------------------------ Effective tax rate 34.9% 26.3% 22.9% - -------------------------------------------------------------------- NOTE 17 REGULATORY MATTERS The Corporation is subject to the regulations of certain federal and state agencies and undergoes periodic examinations by such regulatory authorities. At any time, various bank and nonbank examinations are ongoing. Neither the Corporation nor any of its subsidiaries is subject to written regulatory agreements. Dividends that may be paid by subsidiary banks to the parent company are subject to certain legal limitations. Without regulatory approval, the amount available for payment of dividends by all subsidiary banks was $650 million at December 31, 1995. Dividends also may be impacted by capital needs, regulatory requirements and policies, and other factors deemed relevant. Under federal law, generally no bank subsidiary may extend credit to the parent company or its nonbank subsidiaries on terms and under circumstances which are not substantially the same as comparable extensions of credit to nonaffiliates. No extension of credit may be made to the parent company or a nonbank subsidiary which is in excess of 10 percent of the capital stock and surplus of such bank subsidiary as to aggregate extensions of credit to the parent company and its subsidiaries. In certain circumstances, federal regulatory authorities may impose more restrictive limitations. Such extensions of credit, with limited exceptions, must be fully collateralized. The maximum amount available under statutory limitations for transfer from subsidiary banks to the parent company in the form of loans and dividends approximated 23 percent of consolidated net assets at December 31, 1995. 65

45 NOTES TO CONSOLIDTED FINANCIAL STATEMENTS Federal Reserve Board regulations require depository institutions to maintain cash reserves with the Federal Reserve Bank. During 1995, subsidiary banks maintained reserves which averaged $1.1 billion. NOTE 18 LITIGATION A consolidated purported class action complaint is pending against the Corporation and certain officers, alleging violations of federal securities laws and common law relating to disclosures and seeking, among other things, unquantified damages on behalf of purchasers of the Corporation's securities during specified portions of 1994. Management believes there are meritorious defenses to this consolidated lawsuit and intends to defend it vigorously. Management believes that the final disposition will not be material to the Corporation's financial position. A purported class action lawsuit was filed in 1992 against PNC National Bank ("PNCNB"), alleging that certain credit card fees charged to Pennsylvania cardholders violated Pennsylvania law and seeking, among other things, unquantified compensatory and triple damages and injunctive relief. The federal district court dismissed the lawsuit, holding that Pennsylvania law is preempted by federal banking laws. The court of appeals, after initially holding that there was no federal court jurisdiction and remanded the case to state court, has vacated its opinion and granted a rehearing. The case against PNCNB is one of a number of similar cases pending against several credit card issuers. The United States Supreme Court is reviewing one such case, the outcome of which will affect the lawsuit against PNCNB. The impact of the final disposition of the lawsuit brought against PNCNB cannot be assessed at this time. The Corporation, in the normal course of business, is subject to various other pending and threatened lawsuits in which claims for monetary damages are asserted. Management, after consultation with legal counsel, does not anticipate that the ultimate aggregate liability, if any, arising out of such other lawsuits will have a material adverse effect on the Corporation's financial position. At the present time, management is not in a position to determine whether any pending or threatened litigation will have a material adverse effect on the Corporation's results of operations in any future reporting period. NOTE 19 OTHER FINANCIAL INFORMATION Summarized financial information of the parent company is as follows: PARENT COMPANY ONLY BALANCE SHEET December 31 In millions 1995 1994 - ----------------------------------------------------------------------- ASSETS Cash and due from banks $ 2 $ 7 Securities available for sale 48 108 Investments in Bank subsidiaries 6,735 6,551 Nonbank subsidiaries 240 291 Advances to subsidiary banks 8 12 Other assets 115 116 ---------------------- Total assets $7,148 $7,085 ---------------------- LIABILITIES Notes and debentures $ 368 $ 374 Nonbank affiliate borrowings 701 679 Accrued expenses and other liabilities 311 305 ---------------------- Total liabilities 1,380 1,358 SHAREHOLDERS' EQUITY 5,768 5,727 ---------------------- Total liabilities and shareholders' equity $7,148 $7,085 - ---------------------------------------------------------------------- Notes and debentures have scheduled repayments of $200 million in 1999 and $168 million in 2001 and thereafter. Commercial paper and all other debt issued by PNC Funding Corp. is guaranteed by the parent company. In addition, in connection with certain affiliates' mortgage servicing operations, the parent company has committed to maintain

such affiliates' net worth above minimum requirements. In connection with the Midlantic merger, notes and debentures of Midlantic in the aggregate principal amount of $368 million have been jointly and severally assumed by the parent company and its wholly-owned subsidiary, PNC Bancorp, Inc. 66

46 PARENT COMPANY ONLY STATEMENT OF INCOME Year ended December 31 In thousands 1995 1994 1993 - ------------------------------------------------------------------------------ OPERATING REVENUE Dividends from Bank subsidiaries $446,928 $379,362 $358,110 Nonbank subsidiaries 24,903 55,507 11,708 Interest income 3,396 8,542 10,436 Other income 273 979 781 ----------------------------------------- Total operating revenue 475,500 444,390 381,035 OPERATING EXPENSE Interest expense 73,381 65,478 41,309 Other expense 32,938 28,169 56,440 ----------------------------------------- Total operating expense 106,319 93,647 97,749 Income before income taxes and equity in undistributed net income of subsidiaries 369,181 350,743 283,286 Applicable income tax benefits (35,309) (48,547) (23,556) ----------------------------------------- Income before equity in undistributed net income of subsidiaries 404,490 399,290 306,842 Net equity in undistributed net income (excess dividends)* Bank subsidiaries (18,968) 478,441 566,710 Nonbank subsidiaries 22,538 6,197 39,988 ----------------------------------------- Income before cumulative effect of changes in accounting principles 408,060 883,928 913,540 Cumulative effect of changes in accounting principles (15,023) ----------------------------------------- Net income $408,060 $883,928 $898,517 - ------------------------------------------------------------------------------ *Amounts for 1994 and 1993 include the cumulative effect of changes in accounting principles at the respective subsidiaries. PARENT COMPANY ONLY STATEMENT OF CASH FLOWS Year ended December 31 In millions 1995 1994 1993 - ------------------------------------------------------------------------------ OPERATING ACTIVITIES Net income $ 408 $ 884 $ 898 Adjustments to reconcile net income to net cash provided by operating activities Cumulative effect of changes in accounting principles 15 Equity in undistributed net earnings of subsidiaries (3) (485) (606) Other 10 (4) 78 ------------------------------------- Net cash provided by operating activities 415 395 385 INVESTING ACTIVITIES Net change in interest-earning deposits with subsidiary bank 4 (8) (4) Net capital returned from subsidiaries 548 25 116 Securities available for sale Sales 646 2,158 2,674 Purchases (586) (2,005) (2,770) Cash paid in acquisitions (527) (503) (383) Other (2) (2) (87) ------------------------------------- Net cash provided (used) by investing activities 83 (335) (454) FINANCING ACTIVITIES Borrowings from nonbank subsidiary 275 330 250 Redemption of preferred stock (50) Acquisition of treasury stock (236) (90) (19) Cash dividends paid to shareholders (387) (333) (276) Issuance of stock 88 53 162 Repayment of long-term debt (193) (14) (50) ------------------------------------- Net cash provided (used) by financing activities (503) (54) 67 -------------------------------------

Increase (decrease) in cash and due from banks (5) 6 (2) Cash and due from banks at beginning of year 7 1 3 ------------------------------------- Cash and due from banks at end of year $ 2 $ 7 $ 1 - ------------------------------------------------------------------------------ 67
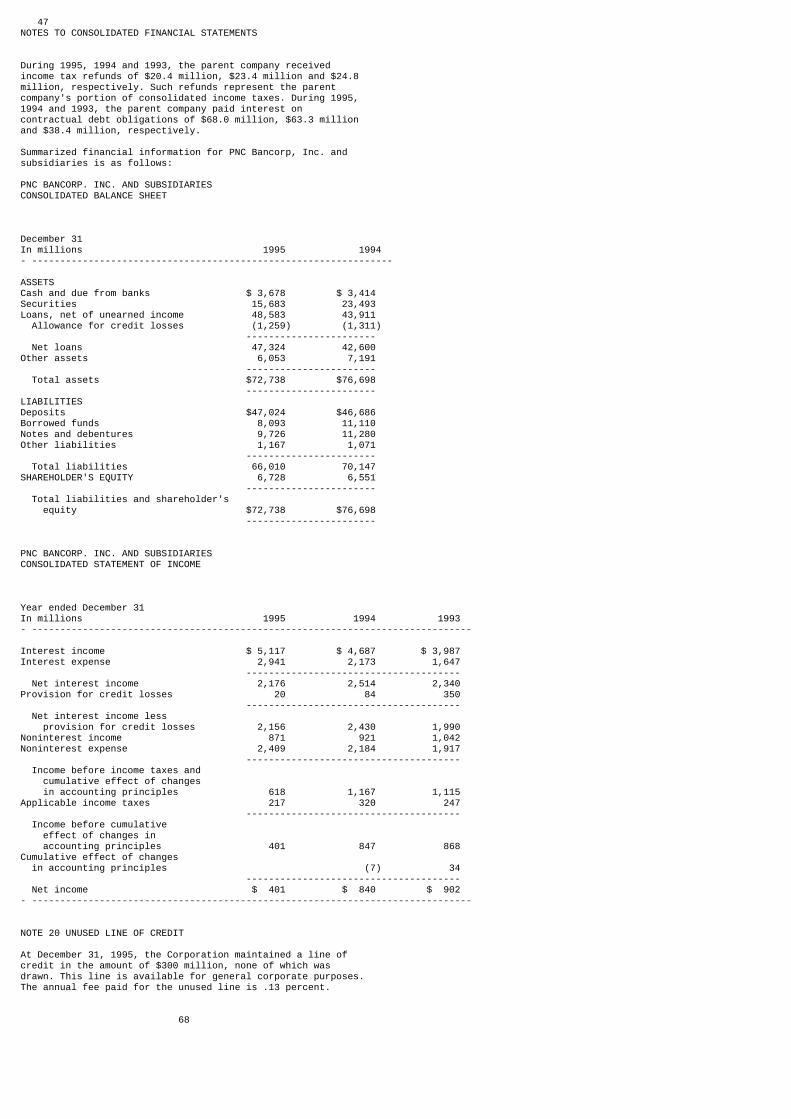
47 NOTES TO CONSOLIDATED FINANCIAL STATEMENTS During 1995, 1994 and 1993, the parent company received income tax refunds of $20.4 million, $23.4 million and $24.8 million, respectively. Such refunds represent the parent company's portion of consolidated income taxes. During 1995, 1994 and 1993, the parent company paid interest on contractual debt obligations of $68.0 million, $63.3 million and $38.4 million, respectively. Summarized financial information for PNC Bancorp, Inc. and subsidiaries is as follows: PNC BANCORP. INC. AND SUBSIDIARIES CONSOLIDATED BALANCE SHEET December 31 In millions 1995 1994 - ---------------------------------------------------------------- ASSETS Cash and due from banks $ 3,678 $ 3,414 Securities 15,683 23,493 Loans, net of unearned income 48,583 43,911 Allowance for credit losses (1,259) (1,311) ----------------------- Net loans 47,324 42,600 Other assets 6,053 7,191 ----------------------- Total assets $72,738 $76,698 ----------------------- LIABILITIES Deposits $47,024 $46,686 Borrowed funds 8,093 11,110 Notes and debentures 9,726 11,280 Other liabilities 1,167 1,071 ----------------------- Total liabilities 66,010 70,147 SHAREHOLDER'S EQUITY 6,728 6,551 ----------------------- Total liabilities and shareholder's equity $72,738 $76,698 ----------------------- PNC BANCORP. INC. AND SUBSIDIARIES CONSOLIDATED STATEMENT OF INCOME Year ended December 31 In millions 1995 1994 1993 - ------------------------------------------------------------------------------ Interest income $ 5,117 $ 4,687 $ 3,987 Interest expense 2,941 2,173 1,647 -------------------------------------- Net interest income 2,176 2,514 2,340 Provision for credit losses 20 84 350 -------------------------------------- Net interest income less provision for credit losses 2,156 2,430 1,990 Noninterest income 871 921 1,042 Noninterest expense 2,409 2,184 1,917 -------------------------------------- Income before income taxes and cumulative effect of changes in accounting principles 618 1,167 1,115 Applicable income taxes 217 320 247 -------------------------------------- Income before cumulative effect of changes in accounting principles 401 847 868 Cumulative effect of changes in accounting principles (7) 34 -------------------------------------- Net income $ 401 $ 840 $ 902 - ------------------------------------------------------------------------------ NOTE 20 UNUSED LINE OF CREDIT At December 31, 1995, the Corporation maintained a line of credit in the amount of $300 million, none of which was drawn. This line is available for general corporate purposes. The annual fee paid for the unused line is .13 percent. 68

48 NOTE 21 FAIR VALUES OF FINANCIAL INSTRUMENTS The following tables set forth the carrying value and estimated fair value of financial instruments: 1995 1994 ----------------------------------------------------------------------------------------- Related Financial Related Fiancial Derivatives Derivatives - ----------------------------------------------------------------------------------------------------------------------------------- December 31 Carrying Fair Carrying Fair Carrying Fair Carrying Fair In millions Amount Value Amount Value Amount Value Amount Value - ----------------------------------------------------------------------------------------------------------------------------------- ASSETS Cash and short-term investments $ 5,826 $ 5,826 $ 9 $ 5,923 $ 5,923 Securities 15,839 15,839 $ 6 12 23,670 22,349 $130 $ 204 Loans held for sale 659 659 487 487 Net loans (excludes leases) 46,372 46,384 (14) (19) 41,509 41,359 (27) (553) LIABILITIES Demand deposits 27,145 27,145 2 (4) 27,079 27,079 (238) Time deposits 19,754 20,025 7 18,739 18,533 (55) Borrowed funds 9,125 9,133 8 12,718 12,709 (3) Notes and debentures 10,398 10,574 22 12,127 12,061 OFF-BALANCE-SHEET Commitments to extend credit (32) (48) (23) (25) Letters of credit (12) (14) (12) (13) Interest rate swaps and floors 16 16 - ----------------------------------------------------------------------------------------------------------------------------------- Real and personal property, lease financings, loan customer relationships, deposit customer intangibles, retail branch networks, fee-based businesses, such as asset management, mortgage banking and brokerage, trademarks and brand names are excluded from the amounts set forth above. Accordingly, the aggregate fair value amounts presented do not represent the underlying value of the Corporation. Fair value is defined as the estimated amount at which the financial instrument could be exchanged in a current transaction between willing parties, other than in a forced or liquidation sale. However, it is not management's intention to immediately dispose of a significant portion of such financial instruments, and unrealized gains or losses should not be interpreted as a forecast of future earnings and cash flows. The fair value of securities is based primarily on quoted market prices. For substantially all other financial instruments, fair values were estimated using discounted cash flow analyses, pricing models and other valuation techniques. These derived fair values are subjective in nature, involve uncertainties and matters of significant judgment and, therefore, cannot be determined with precision. Changes in assumptions could significantly impact the derived fair value estimates. The following methods and assumptions were used in estimating fair value amounts for financial instruments: GENERAL For short-term financial instruments realizable in three months or less, the carrying amount reported in the balance sheet approximates fair value. Unless otherwise stated, the rates used in discounted cash flow analyses are based on market yield curves. 69

49 NOTES TO CONSOLIDATED FINANCIAL STATEMENTS CASH AND SHORT-TERM INVESTMENTS The carrying amounts reported in the consolidated balance sheet for cash and short- term investments approximate those assets' fair values primarily due to their short-term nature. For purposes of this disclosure only, short-term investments include due from banks, interest-earning deposits with banks, federal funds sold and resale agreements, trading securities, customer's acceptance liability, accrued interest receivable and loans held for accelerated disposition. SECURITIES The fair value of investment securities and securities available for sale are based on quoted market prices, where available. If quoted market prices are not available, fair value is estimated using the quoted market prices of comparable instruments. NET LOANS AND LOANS HELD FOR SALE For demand and variable- rate commercial and certain consumer loans that reprice at least quarterly, fair values are estimated by reducing carrying amounts by estimated credit loss factors. For other commercial loans, including nonaccrual loans, fair values are estimated using discounted cash flow analyses, with cash flows reduced by estimated credit loss factors and discount rates equal to rates currently charged by the Corporation for similar loans. In the case of nonaccrual loans, scheduled cash flows exclude interest payments. For automobile, home equity, student and credit card loans, fair values are determined by using internal pricing models incorporating assumptions about prepayment rates, credit losses and servicing fees and costs and discounting the future net revenues at an appropriate risk-weighted rate of return. For credit cards and revolving home equity loans, this fair value does not include any amount for new loans or the related fees that will be generated from the existing customer relationships. The fair value of residential mortgages was estimated based on quoted market prices of similar loans sold in conjunction with securitization transactions, adjusted for differences in loan characteristics. Loans held for sale are reported at the lower of cost or market value in the consolidated balance sheet. For purposes of this disclosure only, the carrying value approximates fair value. DEPOSITS The carrying amounts of noninterest-bearing demand and interest-bearing, money market and savings deposits approximate fair values. For time deposits, fair values are based on the discounted value of scheduled cash flows. The discount rates used vary by instrument and are based on dealer quotes or rates currently offered for deposits with similar maturities. BORROWED FUNDS The carrying amounts of federal funds purchased, commercial paper, acceptances outstanding and accrued interest payable are considered fair value because of their short-term nature. Repurchase agreements and term federal funds purchased are valued using discounted cash flow analyses. NOTES AND DEBENTURES The fair value of variable-rate notes and debentures is equivalent to carrying value. For fixed-rate notes and debentures, scheduled cash flows are discounted using rates for similar debt with the same maturities. UNFUNDED LOAN COMMITMENTS AND LETTER OF CREDIT Fair values for commitments to extend credit and letters of credit are estimated based upon the amount of deferred fees and the creditworthiness of the counterparties. FINANCIAL DERIVATIVES The fair value of index-amortizing interest rate swaps, caps and floors is based on dealer quotes. The fair value of other interest rate swaps is the discounted value of the expected net cash flows. These fair values represent the estimated amounts the Corporation would receive or pay to terminate the contracts, taking into account current interest rates. 70

50 STATISTICAL INFORMATION SELECTED CONSOLIDATED FINANCIAL DATA The merger between PNC Bank Corp. and Midlantic Corporation was completed on December 31, 1995 and accounted for as a pooling of interests. Accordingly, all financial information has been restated as if the companies were combined for all periods presented. Year ended December 31 1995 1994 1993 1992 1991 - ---------------------------------------------------------------------------------------------------------------------------------- SUMMARY OF OPERATIONS (In thousands) Interest income $5,149,431 $4,723,147 $4,022,771 $4,281,178 $5,399,913 Interest expense 3,007,562 2,231,153 1,682,944 2,103,691 3,327,114 -------------------------------------------------------------------------------------- Net interest income 2,141,869 2,491,994 2,339,827 2,177,487 2,072,799 Provision for credit losses 6,000 83,458 350,249 493,830 1,152,431 Noninterest income before net securities gains/losses 1,240,113 1,180,582 940,899 930,885 995,822 Net securities gains (losses) (279,694) (141,582) 194,699 246,256 60,564 Noninterest expense 2,469,276 2,237,620 1,984,689 2,072,804 2,015,332 -------------------------------------------------------------------------------------- Income (loss) before income taxes and cumulative effect of changes in accounting principles 627,012 1,209,916 1,140,487 787,994 (38,578) Applicable income taxes 218,952 318,460 261,539 251,526 114,939 -------------------------------------------------------------------------------------- Income (loss) before cumulative effect of changes in accounting principles 408,060 891,456 878,948 536,468 (153,517) Cumulative effect of changes in accounting principles, net of tax benefits of $4,598, $5,343 and $77,458 (7,528) 19,569 (148,287) -------------------------------------------------------------------------------------- Net income (loss) $ 408,060 $ 883,928 $ 898,517 $ 388,181 $ (153,517) -------------------------------------------------------------------------------------- PER COMMON SHARE DATA Book value As reported $16.87 $16.59 $15.61 $13.63 $13.51 Excluding net unrealized securities gains/losses 16.79 16.95 15.35 13.63 13.51 Cash dividends declared 1.40 1.31 1.175 1.08 .795 Earnings (loss) Primary before cumulative effect of changes in accounting principles $1.19 $2.56 $2.56 $1.72 $(.58) Cumulative effect of changes in accounting principles (.02) .06 (.48) -------------------------------------------------------------------------------------- Primary $1.19 $2.54 $2.62 $1.24 $(.58) -------------------------------------------------------------------------------------- Fully diluted before cumulative effect of changes in accounting principles $1.19 $2.54 $2.54 $1.70 $(.58) Cumulative effect of changes in accounting principles (.02) .06 (.47) -------------------------------------------------------------------------------------- Fully diluted $1.19 $2.52 $2.60 $1.23 $(.58) -------------------------------------------------------------------------------------- BALANCE SHEET HIGHLIGHTS (December 31, in millions) Total assets $73,404 $77,461 $76,012 $65,802 $63,024 Securities 15,839 23,670 25,496 22,849 16,805 Loans, net of unearned income 48,653 44,043 42,113 35,943 38,762 Deposits 46,899 45,818 44,703 42,030 46,109 Borrowed funds 8,665 12,193 12,336 12,182 10,074 Notes and debentures 10,398 12,127 9,972 4,734 1,751 Shareholders' equity 5,768 5,727 5,404 4,543 4,044 SELECTED RATIOS Return on average total assets .54% 1.19% 1.40% .64% (.24)% Return on average shareholders' equity 7.05 16.09 18.55 9.38 (4.30) Average common shareholders' equity to average total assets 7.64 7.34 7.52 6.67 5.79 Dividend payout 94.76 37.42 30.79 61.72 (95.29) Overhead 78.42 62.69 56.28 60.66 62.51 - ---------------------------------------------------------------------------------------------------------------------------------- 71

51 STATISTICAL INFORMATION SELECTED QUARTERLY FINANCIAL DATA The merger between PNC Bank Corp. and Midlantic Corporation was completed on December 31, 1995 and accounted for as a pooling of interests. Accordingly, the unaudited selected quarterly financial data has been restated as if the companies were combined for all periods presented. 1995 1994 ----------------------------------------------------------------------------------------------- Fourth Third Second First Fourth Third Second First Quarter Quarter Quarter Quarter Quarter Quarter Quarter Quarter ----------------------------------------------------------------------------------------------- SUMMARY OF OPERATIONS (In thousands) Interest income $1,300,002 $1,293,509 $1,294,643 $1,261,277 $1,249,571 $1,228,631 $1,146,856 $1,098,089 Interest expense 747,254 766,490 771,821 721,997 674,297 581,562 509,880 465,414 ----------------------------------------------------------------------------------------------- Net interest income 552,748 527,019 522,822 539,280 575,274 647,069 636,976 632,675 Provision for credit losses 1,500 1,500 1,500 1,500 (433) 14,863 35,857 33,171 Noninterest income before net securities gains (losses) 312,244 338,282 305,284 284,303 276,346 324,671 303,377 276,188 Net securities gains (losses) (288,958) 44 7,966 1,254 (124,313) (44,202) (4,722) 31,655 Noninterest expense 825,827 547,435 542,663 553,351 604,206 550,087 536,512 546,815 ----------------------------------------------------------------------------------------------- Income (loss) before income taxes and cumulative effect of change in accounting principle (251,293) 316,410 291,909 269,986 123,534 362,588 363,262 360,532 Applicable income taxes (benefits) (75,116) 105,673 97,956 90,439 17,206 97,771 102,565 100,918 ----------------------------------------------------------------------------------------------- Income (loss) before cumulative effect of change in accounting principle (176,177) 210,737 193,953 179,547 106,328 264,817 260,697 259,614 Cumulative effect of change in accounting principle, net of tax benefit of $4,598 (7,528) ----------------------------------------------------------------------------------------------- Net income (loss) $(176,177) $210,737 $193,953 $179,547 $106,328 $264,817 $260,697 $252,086 ----------------------------------------------------------------------------------------------- PER COMMON SHARE DATA Book value: As reported $16.87 $17.55 $17.24 $16.90 $16.59 $16.49 $15.96 $15.60 Excluding net unrealized securities gains/losses 16.79 17.67 17.35 17.10 16.95 16.90 16.41 15.87 Earnings (losses) Primary before cumulative effect of change in accounting principle $(.52) $.62 $.57 $.52 $.30 $.76 $.75 $.75 Cumulative effect of change in accounting principle (.02) ----------------------------------------------------------------------------------------------- Primary $(.52) $.62 $.57 $.52 $.30 $.76 $.75 $.73 ----------------------------------------------------------------------------------------------- Fully diluted before cumulative effect of change in accounting principle $(.52) $.62 $.56 $.52 $.30 $.76 $.74 $.74 Cumulative effect of change in accounting principle (.02) ----------------------------------------------------------------------------------------------- Fully diluted $(.52) $.62 $.56 $.52 $.30 $.76 $.74 $.72 ----------------------------------------------------------------------------------------------- AVERAGE BALANCE SHEET HIGHLIGHTS (In millions) Total assets $75,707 $75,266 $75,343 $74,841 $76,102 $75,287 $73,174 $72,863 Securities 19,450 22,045 23,137 23,984 25,351 24,460 23,981 23,605 Loans, net of unearned income 48,304 45,646 44,765 43,710 43,717 43,741 41,778 41,022 Deposits 46,216 45,077 44,365 43,667 44,193 44,936 43,399 43,193 Borrowed funds 11,511 14,016 14,140 13,902 12,102 11,862 11,612 12,260 Notes and debentures 10,637 8,829 9,586 10,109 12,966 11,731 11,404 10,519 Shareholders' equity 5,893 5,802 5,727 5,710 5,687 5,588 5,419 5,430 - --------------------------------------------------------------------------------------------------------------------------------- 72

52 ANALYSIS OF YEAR-TO-YEAR CHANGES IN NET INTEREST INCOME 1995/1994 1994/1993 --------------------------------------------------------------------------------- Increase/(Decrease) in Income/Expense Increase/(Decrease) in Income/Expense Due to Changes in: Due to changes in: Taxable-equivalent basis In thousands Volume Rate Total Volume Rate Total - ---------------------------------------------------------------------------------------------------------------------------------- INTEREST-EARNINGS ASSETS Short-term investments $(37,146) $29,512 $(7,634) $434 $14,457 $14,891 Loans held for sale (1,693) 4,790 3,097 23,469 3,299 26,768 Securities U.S. Treasury (11,828) 19,995 8,167 46,394 11,240 57,634 U.S. Government agencies and corporations (170,403) (55,167) (225,570) 2,079 (24,867) (22,788) State and municipal (813) (2,139) (2,952) (11,420) 1,221 (10,199) Other debt 67,100 29,296 96,396 52,173 21,030 73,203 Corporate stocks and other (797) 3,031 2,234 10,504 10,504 --------------------------------------------------------------------------------- Total securities (131,303) 9,578 (121,725) 119,462 (11,108) 108,354 Loans, net of unearned income Consumer 70,864 77,886 148,750 106,245 (35,861) 70,384 Residential mortgage 146,315 58,135 204,450 347,196 (53,075) 294,121 Commercial 50,719 109,077 159,796 67,451 57,570 125,021 Commercial real estate (13,394) 55,004 41,610 (51,389) 59,552 8,163 Other (18,661) 24,278 5,617 30,004 10,063 40,067 --------------------------------------------------------------------------------- Total loans, net of unearned income 237,040 323,183 560,223 534,184 3,572 537,756 Other interest-earning assets 569 252 821 180 (274) (94) --------------------------------------------------------------------------------- Total interest-earning assets $7,476 $427,306 $434,782 $645,395 $42,280 $687,675 --------------------------------------------------------------------------------- INTEREST-BEARING LIABILITIES Interest-bearing deposits Demand and money market $(27,425) $103,549 $76,124 $14,070 $53,383 $67,453 Savings (6,539) 24,656 18,117 5,038 10,298 15,336 Other time 69,376 158,703 228,079 36,207 (9,462) 26,745 Deposits in foreign offices 51,161 19,093 70,254 38,598 5,452 44,050 --------------------------------------------------------------------------------- Total interest-bearing deposits 24,344 368,230 392,574 89,747 63,837 153,584 Borrowed funds Federal funds purchased 13,670 50,302 63,972 44,850 27,994 72,844 Repurchase agreements 43,183 126,782 169,965 (64,566) 40,395 (24,171) Commercial paper (17,781) 12,101 (5,680) 15,482 11,147 26,629 Other 27,933 64,331 92,264 54,610 23,933 78,543 --------------------------------------------------------------------------------- Total borrowed funds 66,999 253,522 320,521 43,194 110,651 153,845 Notes and debentures (99,086) 162,400 63,314 228,641 12,139 240,780 --------------------------------------------------------------------------------- Total interest-bearing liabilities 10,572 765,837 776,409 313,990 234,219 548,209 --------------------------------------------------------------------------------- Change in net interest income $3,870 $(345,497) $(341,627) $359,168 ($219,702) $139,466 - ---------------------------------------------------------------------------------------------------------------------------------- Changes attributable to rate/volume are prorated into rate and volume components. Average balances are based on amortized historical cost (excluding SFAS 115 adjustments to fair value). 73

53 STATISTICAL INFORMATION AVERAGE CONSOLIDATED BALANCE SHEET AND NET INTEREST ANALYSIS 1995 1994 --------------------------------------------------------------------------------- Year ended December 31 Taxable-equivalent basis Average balances in millions, Average Average Average Average interest in thousands Balances Interest Yields/Rates Balances Interest Yields/Rates - ---------------------------------------------------------------------------------------------------------------------------------- ASSETS Interest-earning assets Short-term investments $ 1,034 $ 68,570 6.63% $ 1,721 $ 76,204 4.43% Loans held for sale 725 54,361 7.50 749 51,264 6.84 Securities U.S. Treasury 4,179 216,323 5.18 4,421 208,156 4.71 U.S. Government agencies and corporations 13,527 766,116 5.66 16,494 991,686 6.01 State and municipal 363 35,596 9.81 371 38,548 10.40 Other debt 3,757 259,291 6.90 2,742 162,895 5.94 Corporate stocks and others 314 21,646 6.89 327 19,412 5.93 ------------------------ ------------------------ Total securities 22,140 1,298,972 5.87 24,355 1,420,697 5.83 Loans, net of unearned income Consumer 12,013 1,078,420 8.98 11,192 929,670 8.31 Residential mortgage 10,812 807,848 7.47 8,806 603,398 6.85 Commercial 15,852 1,284,993 8.11 15,185 1,125,197 7.41 Commercial real estate 5,014 472,423 9.42 5,171 430,813 8.33 Other 1,933 129,602 6.70 2,245 123,985 5.52 --------------------------- --------------------------- Total loans, net of unearned income 45,624 3,773,286 8.27 42,599 3,213,063 7.54 Other interest-earning assets 12 884 7.40 3 63 3.18 --------------------------- --------------------------- Total interest-earning assets/interest income 69,535 5,196,073 7.47 69,427 4,761,291 6.86 Noninterest-earning assets Allowance for credit losses (1,319) (1,391) Cash and due from banks 3,044 2,951 Other assets 3,871 3,375 ------------ ------------ Total assets $75,131 $74,362 --------------------------------------------------------------------------------- LIABILITIES AND SHAREHOLDERS' EQUITY Interest-bearing liabilities Interest-bearing deposits Demand and money market $12,254 356,893 2.91 $13,481 280,769 2.08 Savings 3,732 89,448 2.40 4,081 71,331 1.75 Other time 17,758 984,440 5.54 16,353 756,361 4.63 Deposits in foreign offices 1,974 121,035 6.13 1,083 50,781 4.69 --------------------------- --------------------------- Total interest-bearing deposits 35,718 1,551,816 4.34 34,998 1,159,242 3.31 Borrowed funds Federal funds purchased 3,142 188,103 5.99 2,850 124,131 4.35 Repurchase agreements 6,514 398,003 6.11 5,576 228,038 4.09 Commercial paper 737 43,779 5.94 1,072 49,459 4.61 Other 2,993 204,769 6.84 2,462 112,505 4.57 --------------------------- --------------------------- Total borrowed funds 13,386 834,654 6.24 11,960 514,133 4.30 Notes and debentures 9,790 621,092 6.34 11,662 557,778 4.78 --------------------------- --------------------------- Total interest-bearing liabilities/interest expense 58,894 3,007,562 5.10 58,620 2,231,153 3.81 Noninterest-bearing liabilities and shareholders' equity Demand and other noninterest-bearing deposits 9,112 8,939 Accrued expenses and other liabilities 1,341 1,272 Shareholders' equity 5,784 5,531 ------------ ------------ Total liabilities and shareholders' equity $75,131 $ 74,362 --------------------------------------------------------------------------------- Interest rate spread 2.37 3.05 Impact of noninterest-bearing liabilities .78 .59 ------------------------------------------------------------------- Net interest income/margin on earning assets $2,188,511 3.15% $2,530,138 3.64% - ---------------------------------------------------------------------------------------------------------------------------------- Nonaccrual loans are included in loans, net of unearned income. The impact of financial derivatives used in interest rate risk management is included in the interest income/expense and average yields/rates of the related assets and liabilities. 74

54 1993 1992 1991 - ---------------------------------------------------------------------------------------------------------------------------------- Average Average Average Average Average Average Balances Interest Yields/Rates Balances Interest Yields/Rates Balances Interest Yields/Rates - ---------------------------------------------------------------------------------------------------------------------------------- $ 1,709 $ 61,313 3.59% $ 1,498 $ 58,940 3.93% $ 1,979 $ 126,221 6.38% 402 24,496 6.10 258 18,915 7.33 249 17,952 7.21 3,425 150,522 4.40 3,307 204,127 6.17 3,065 236,662 7.72 16,460 1,014,474 6.16 14,288 1,066,101 7.46 9,750 876,519 8.99 481 48,747 10.14 716 70,748 9.89 947 98,634 10.42 1,818 89,692 4.93 976 61,539 6.31 865 73,963 8.55 150 8,908 5.93 108 5,598 5.18 160 7,432 4.63 - --------------------------- --------------------------- --------------------------- 22,334 1,312,343 5.88 19,395 1,408,113 7.26 14,787 1,293,210 8.75 9,924 859,286 8.66 9,586 907,111 9.46 9,939 1,095,354 11.02 3,834 309,277 8.07 3,182 311,083 9.78 3,893 411,904 10.58 14,257 1,000,176 7.02 15,035 1,054,014 7.01 19,093 1,698,677 8.90 5,838 422,650 7.24 7,263 508,837 7.01 9,100 746,615 8.20 1,688 83,918 4.97 1,207 76,574 6.34 1,295 99,374 7.67 - --------------------------- --------------------------- --------------------------- 35,541 2,675,307 7.53 36,273 2,857,619 7.88 43,320 4,051,924 9.35 1 157 20.68 2 205 8.99 38 5,466 14.26 - --------------------------- --------------------------- --------------------------- 59,987 4,073,616 6.79 57,426 4,343,792 7.56 60,373 5,494,773 9.10 (1,510) (1,663) (1,665) 2,757 2,637 2,911 2,819 2,613 2,937 - ------------ ------------ ------------ $64,053 $61,013 $64,556 - ---------------------------------------------------------------------------------------------------------------------------------- $12,685 213,316 1.68 $12,545 371,299 2.96 $11,763 594,714 5.06 3,760 55,995 1.49 3,434 96,139 2.80 3,917 188,950 4.82 15,571 729,616 4.69 18,578 1,051,088 5.66 26,680 1,928,832 7.23 222 6,731 3.03 676 28,050 4.15 452 27,069 6.00 - --------------------------- --------------------------- --------------------------- 32,238 1,005,658 3.12 35,233 1,546,576 4.39 42,812 2,739,565 6.40 1,686 51,287 3.04 1,917 68,460 3.57 2,102 121,183 5.76 7,263 252,209 3.47 5,606 209,933 3.74 3,726 219,062 5.88 691 22,830 3.30 576 20,848 3.62 379 22,658 5.97 1,128 33,962 3.01 1,494 54,927 3.68 1,562 86,739 5.55 - --------------------------- --------------------------- --------------------------- 10,768 360,288 3.35 9,593 354,168 3.69 7,769 449,642 5.79 6,882 316,998 4.61 3,391 202,947 5.98 1,795 137,907 7.68 - --------------------------- --------------------------- --------------------------- 49,888 1,682,944 3.37 48,217 2,103,691 4.36 52,376 3,327,114 6.35 7,986 7,539 7,464 1,293 1,104 888 4,886 4,153 3,828 - ------------ ------------ ------------ $64,053 $61,013 $64,556 - ---------------------------------------------------------------------------------------------------------------------------------- 3.42 3.20 2.75 .57 .70 .84 -------------------------- -------------------------- -------------------------- $2,390,672 3.99% $2,240,101 3.90% $2,167,659 3.59% - ---------------------------------------------------------------------------------------------------------------------------------- 75

55 STATISTICAL INFORMATION SECURITIES CARRYING VALUE OF SECURITIES December 31 In millions 1995 1994 1993 - -------------------------------------------------------------------------------- Securities available for sale Debt securities U.S. Treasury $ 3,280 $ 663 $ 2,402 U.S. Government agencies and corporations Mortgage related 7,459 2,092 8,097 Other 1,034 21 24 State and municipal 367 7 2 Asset-backed private placements 1,604 Other Mortgage related 1,113 732 705 Other 525 146 97 Corporate stocks and other 457 129 61 ------------------------------- Total securities available for sale 15,839 3,790 11,388 Investment securities Debt securities U.S. Treasury $ 3,317 $ 1,280 U.S. Government agencies and corporations Mortgage related 11,795 11,311 Other 1,000 State and municipal 360 394 Asset-backed private placements 1,597 Other Mortgage related 726 513 Other 775 339 Other 310 271 ------------------- Total investment securities 19,880 14,108 ------------------------------- Total securities $15,839 $23,670 $25,496 - ------------------------------------------------------------------------------- 76

56 CONTRACTUAL MATURITY DISTRIBUTION OF SECURITIES After After One Year Five Years December 31, 1995 One Year Through Through After No Fixed Dollars in millions or Less Five Years Ten Years Ten Years Maturity Total - --------------------------------------------------------------------------------------------------------------------------------- Securities available for sale Debt securities U.S. Treasury $1,948 $1,314 $18 $ 3,280 U.S. Government agencies and corporations Mortgage-related $ 7,459 7,459 Other 5 1,029 1,034 State and municipal 37 75 68 $187 367 Asset-backed private placements 1,604 1,604 Other debt Mortgage-related 1,113 1,113 Other 4 5 7 80 429 525 Other 457 457 ------------------------------------------------------------------------- Total securities available for sale $1,994 $1,394 $93 $267 $12,091 $15,839 ------------------------------------------------------------------------- Percent of total securities available for sale 12.59% 8.80% .59% 1.69% 76.33% 100.00% Weighted average yield 5.01 7.46 9.67 9.89 6.43 6.42 - --------------------------------------------------------------------------------------------------------------------------------- The table above sets forth the contractual maturity distribution of the securities portfolio at December 31, 1995. U.S. Government agency debt and mortgage-backed and asset- backed securities are included in the No Fixed Maturity category. Based on expected prepayment rates and historical experience, the weighted average expected maturity of such securities was approximately 2 years and 10 months at December 31, 1995. Weighted average yields are based on historical cost with effective yields weighted for the contractual maturity of each security. Tax-exempt securities have been adjusted to a taxable-equivalent basis using a federal income tax rate of 35 percent. At December 31, 1995, $6.1 billion notional value of interest rate swaps and caps designated to the securities portfolio altered the contractual weighted average yield from 6.42 percent to 6.45 percent. LOANS December 31 In millions 1995 1994 1993 1992 1991 - ---------------------------------------------------------------------------------------------------------- Consumer $13,539 $11,851 $10,940 $ 9,585 $ 9,881 Residential mortgage 11,689 9,746 8,611 3,577 3,737 Commercial 16,812 15,545 15,521 14,766 16,445 Commercial real estate 4,914 5,063 5,169 6,503 7,685 Other 2,102 2,223 2,231 1,900 1,643 --------------------------------------------------------------- Total loans 49,056 44,428 42,472 36,331 39,391 Unearned income (403) (385) (359) (388) (629) --------------------------------------------------------------- Loans, net of unearned income $48,653 $44,043 $42,113 $35,943 $38,762 - ---------------------------------------------------------------------------------------------------------- 77

57 STATISTICAL INFORMATION LOAN MATURITIES AND INTEREST SENSITIVITY December 31, 1995 One Year One Through After Gross In millions or Less Five Years Five Years Loans - ------------------------------------------------------------------------------- Commercial $6,197 $7,448 $3,167 $16,812 Real estate project 601 1,152 386 2,139 ---------------------------------------------- Total $6,798 $8,600 $3,553 $18,951 ---------------------------------------------- Loans with predetermined rate $ 963 $1,858 $ 673 $ 3,494 Loans with floating rate 5,835 6,742 2,880 15,457 ---------------------------------------------- Total $6,798 $8,600 $3,553 $18,951 - ------------------------------------------------------------------------------- At December 31, 1995, $4.0 billion of interest rate swaps designated to commercial and commercial real estate loans altered the interest rate characteristics of such loans. The impact of the interest rate swaps is not reflected in the table above. NONPERFORMING ASSETS Generally, a loan is classified as nonaccrual when it is determined that the collection of interest or principal is doubtful, or when a default of interest or principal has existed for 90 days or more, unless such loan is well secured and in the process of collection. When interest accrual is discontinued, unpaid interest credited to income in the current year is reversed, and unpaid interest accrued in prior years is charged to the allowance for credit losses. A loan is categorized as restructured if the original interest rate on such loan, repayment terms, or both were restructured due to a deterioration in the financial condition of the borrower. December 31 Dollars in millions 1995 1994 1993 1992 1991 - ---------------------------------------------------------------------------------------------------------------------------------- Nonaccrual loans $335 $496 $ 656 $1,620 $2,431 Restructured loans 23 69 200 185 21 ------------------------------------------------ Total nonperforming loans 358 565 856 1,805 2,452 Foreclosed assets 178 192 268 436 443 ------------------------------------------------ Total nonperforming assets $536 $757 $1,124 $2,241 $2,895 ------------------------------------------------ Nonperforming loans to period-end loans .74% 1.28% 2.03% 5.02% 6.33% Nonperforming assets to period-end loans and foreclosed assets 1.10 1.71 2.65 6.16 7.38 Nonperforming assets to total assets .73 .98 1.48 3.41 4.59 Interest computed on original terms $ 36 $ 54 $ 74 $ 150 $ 260 Interest recognized 10 14 19 19 40 - ---------------------------------------------------------------------------------------------------------------------------------- PAST DUE LOANS The following table presents information concerning accruing loans which are contractually past due 90 days or more as to principal or interest payments and excludes loans reported as either nonaccrual or restructured. December 31 In millions 1995 1994 1993 1992 1991 - -------------------------------------------------------------------------------------------------------------- Past due loans $225 $175 $171 $237 $272 As a percentage of total loans, net of unearned income .46% .40% .41% .66% .70% - -------------------------------------------------------------------------------------------------------------- 78

58 ALLOWANCE FOR CREDIT LOSSES The allowance for credit losses is based on periodic evaluations of the loan portfolio by management. These evaluations consider, among other factors, historic losses within specific industries, current economic conditions, loan portfolio trends, specific credit reviews and estimates based on subjective factors. During 1995 and 1994, stronger economic conditions combined with management's ongoing efforts to improve asset quality resulted in lower nonperforming assets and net charge- offs, and a higher reserve coverage of nonperforming loans. SUMMARY OF LOAN LOSS EXPERIENCE Year ended December 31 Dollars in millions 1995 1994 1993 1992 1991 - -------------------------------------------------------------------------------- Balance at beginning of year $1,352 $1,372 $1,568 $1,645 $1,526 Charge-offs Consumer 107 92 102 111 139 Residential mortgage 10 16 8 4 7 Commercial 84 116 168 339 555 Commercial real estate Commercial mortgage 23 15 49 23 58 Real estate project 14 37 186 210 272 Other 2 1 1 8 12 ------------------------------------------ Total loans charged off 240 277 514 695 1,043 Recoveries Consumer 39 40 36 31 28 Residential mortgage 2 1 1 Commercial 49 59 56 66 43 Commercial real estate Commercial mortgage 9 5 4 1 4 Real estate project 6 10 8 7 7 Other 2 1 3 2 2 ------------------------------------------ Total recoveries 107 116 108 107 84 ------------------------------------------ Net charge-offs 133 161 406 588 959 Net charge-offs on bulk loan sales and assets held for accelerated disposition (8) (182) Provision for credit losses 6 84 350 495 1,152 Acquisitions/divestitures 34 65 42 16 (74) ------------------------------------------ Balance at end of year $1,259 $1,352 $1,372 $1,568 $1,645 ------------------------------------------ Allowance as a percent of period-end Loans 2.59% 3.07% 3.26% 4.36% 4.24% Nonperforming loans 351.68 239.29 160.28 86.87 67.09 As a percent of average loans Net charge-offs including bulk loan sales and assets held for accelerated disposition .29 .40 1.65 1.62 2.21 Net charge-offs excluding bulk loan sales and assets held for accelerated disposition .29 .38 1.14 1.62 2.21 Provision for credit losses .01 .20 .99 1.36 2.66 Allowance for credit losses 2.76 3.17 3.86 4.32 3.80 Allowance as a multiple of net charge-offs including bulk loan sales and assets held for accelerated disposition 9.47x 8.00x 2.33x 2.67x 1.72x Allowance as a multiple of net charge-offs excluding bulk loan sales and assets held for accelerated disposition 9.47 8.40 3.38 2.67 1.72 - ------------------------------------------------------------------------------- 79

59 STATISTICAL INFORMATION During 1993, management revised its methodology for allocating the allowance for credit losses. The revisions had the effect of reclassifying certain previously unallocated reserves to loan categories. For purposes of this presentation, remaining unallocated reserves have been assigned to loan categories based on the relative specific allocation amounts. Prior year unallocated reserve amounts have been similarly assigned to loan categories. ALLOCATION OF ALLOWANCE FOR CREDIT LOSSES December 31 In millions 1995 1994 1993 1992 1991 - ------------------------------------------------------------------------------- Commercial $ 585 $ 603 $ 572 $ 643 $ 912 Commercial real estate 332 419 498 746 569 Consumer 203 184 202 153 139 Residential mortgage 112 116 86 8 5 Other 27 30 14 18 20 ---------------------------------------------- Total $1,259 $1,352 $1,372 $1,568 $1,645 - ------------------------------------------------------------------------------- The following table presents the percentage distribution of the allocation of allowance for credit losses and the categories of loans as a percentage of gross loans. 1995 1994 1993 1992 1991 -------------------------------------------------------------------------------------------------------------- December 31 Allowance Loans Allowance Loans Allowance Loans Allowance Loans Allowance Loans - ----------------------------------------------------------------------------------------------------------------------------------- Commercial 46.5% 34.3% 44.6% 35.0% 41.7% 36.5% 41.0% 40.7% 55.4% 41.7% Commercial real estate 26.4 10.0 31.0 11.4 36.3 12.2 47.6 17.9 34.6 19.5 Consumer 16.1 27.6 13.6 26.7 14.7 25.7 9.8 26.4 8.5 25.1 Residential mortgage 8.9 23.8 8.6 21.9 6.3 20.3 .5 9.8 .3 9.5 Other 2.1 4.3 2.2 5.0 1.0 5.3 1.1 5.2 1.2 4.2 -------------------------------------------------------------------------------------------------------------- Total 100.0% 100.0% 100.0% 100.0% 100.0% 100.0% 100.0% 100.0% 100.0% 100.0% - ----------------------------------------------------------------------------------------------------------------------------------- MATURITY OF TIME DEPOSITS OF $100,000 OR MORE A majority of foreign deposits were in denominations of $100,000 or more. The table below provides maturities of domestic item deposits of $100,000 or more. December 31, 1995 Certificates Other Time In millions of Deposit Deposits Total - ------------------------------------------------------------------------------- Three months or less $ 744 $107 $ 851 Over three through six months 262 53 315 Over six through twelve months 187 123 310 Over twelve months 1,219 157 1,376 -------------------------------------- Total $2,412 $440 $2,852 - ------------------------------------------------------------------------------- 80

60 BORROWED FUNDS Federal funds purchased represent overnight borrowings. Repurchase agreements generally have maturities of 18 months or less. At December 31, 1995, 1994, and 1993, $361 million, $51 million and $2.7 billion, respectively, of repurchase agreements had original maturities which exceeded one year. Commercial paper is issued in maturities not to exceed nine months and is stated net of discount. Other borrowed funds consist primarily of term federal funds purchased and U.S. Treasury, tax and loan borrowings which are payable on demand. At December 31, 1995 and 1994, $1.5 billion and $350 million, respectively, notional value of interest rate swaps were designated to borrowed funds. The effect of these swaps is not included in the rates set forth in the table. 1995 1994 1993 ---------------------------------------------------------------- Dollars in millions Amount Rate Amount Rate Amount Rate - ------------------------------------------------------------------------------------------------------------------ Federal funds purchased Year-end balance $3,817 5.29% $2,219 5.88% $2,101 3.06% Average during year 3,142 5.99 2,850 4.35 1,686 3.04 Maximum month-end balance during year 6,446 4,706 3,711 Repurchase agreements Year-end balance 2,851 5.89 4,302 5.59 5,604 3.56 Average during year 6,514 6.11 5,576 4.09 7,263 3.47 Maximum month-end balance during year 7,981 6,971 9,256 Commercial paper Year-end balance 753 5.74 1,226 5.71 514 3.24 Average during year 737 5.94 1,072 4.61 691 3.30 Maximum month-end balance during year 1,207 1,861 1,117 Other Year-end balance 1,244 5.63 4,446 5.46 4,117 3.11 Average during year 2,993 6.84 2,462 4.57 1,128 3.01 Maximum month-end balance during year 4,134 5,601 6,027 - ------------------------------------------------------------------------------------------------------------------ TAXABLE-EQUIVALENT ADJUSTMENT Interest income earned on certain loans, and obligations of states, municipalities and other public entities is not subject to federal income tax. In addition, certain interest expense incurred to fund these assets is not deductible for federal income tax purposes. In order to make pre-tax income and resultant yields comparable to taxable loans and investments, a taxable- equivalent adjustment, less the effect of disallowed interest expense, is added equally to interest income and to income tax expense, with no effect on after-tax income. The taxable-equivalent adjustment shown in the table below is based on a federal income tax rate of 35 percent for 1995, 1994 and 1993, and 34 percent for all other years. Year ended December 31 In thousands 1995 1994 1993 1992 1991 - ---------------------------------------------------------------------------------------------------------------------------- Interest income, book basis $5,149,431 $4,723,147 $4,022,771 $4,281,178 $5,399,913 Taxable-equivalent adjustment 46,642 38,144 50,845 62,614 94,860 -------------------------------------------------------------------------- Interest income taxable-equivalent basis 5,196,073 4,761,291 4,073,616 4,343,792 5,494,773 Interest expense 3,007,562 2,231,153 1,682,944 2,103,691 3,327,114 -------------------------------------------------------------------------- Net interest income, taxable-equivalent basis $2,188,511 $2,530,138 $2,390,672 $2,240,101 $2,167,659 - ---------------------------------------------------------------------------------------------------------------------------- 81

61 COMMON STOCK PRICES/DIVIDENDS DECLARED The table below sets forth by quarter the range of high and low sale prices for PNC Bank Corp. common stock and the cash dividends declared per common share. Cash Dividends 1995 QUARTER High Low Declared - ----------------------------------------------------------------------------- First $25.750 $21.125 $.35 Second 28.125 24.250 .35 Third 28.625 23.625 .35 Fourth 32.375 26.125 .35 ---------------- Total $1.40 - ----------------------------------------------------------------------------- 1994 QUARTER - ----------------------------------------------------------------------------- First $29.875 $25.250 $.32 Second 31.625 26.125 .32 Third 30.000 25.625 .32 Fourth 26.375 20.000 .35 ---------------- Total $1.31 - ----------------------------------------------------------------------------- REGISTRAR AND TRANSFER AGENT Chemical Bank 85 Challenger Road Overpeck Center Ridgefield Park, NJ 07660 800-982-7652 TO EXCHANGE MIDLANTIC STOCK CERTIFICATES Midlantic Bank, N.A. Metro Park Plaza P.O. Box 600 Edison, NJ 08818 Attn: Corporate Securities Services 908-205-4517 DIVIDEND POLICY Holders of PNC Bank Corp. common stock are entitled to receive dividends when declared by the board of directors out of funds legally available. The board presently intends to continue the policy of paying quarterly cash dividends. However, future dividends will depend upon earnings, the financial condition of PNC Bank Corp. and other factors including applicable government regulations and policies. DIVIDEND REINVESTMENT AND STOCK PURCHASE PLAN The PNC Bank Corp. dividend reinvestment and stock purchase plan enables holders of common and preferred stock to purchase additional shares of common stock conveniently and without paying brokerage commissions or service charges. A prospectus and enrollment card may be obtained by writing to Shareholder Relations at corporate headquarters. 82

1 EXHIBIT 21 PNC BANK CORP. SCHEDULE OF CERTAIN SUBSIDIARIES + (AS OF FEBRUARY 29, 1996) STATE OR OTHER JURISDICTION OF NAME INCORPORATION OR ORGANIZATION - ------------------------------------------------------------------------------- PNC Bancorp, Inc. Delaware Midlantic Bank, N.A.* United States PNC Bank, Delaware* Delaware PNC Bank, FSB United States PNC Bank, Indiana, Inc.* Indiana PNC Bank, Kentucky, Inc.* Kentucky PNC Bank, National Association * United States PNC Bank, New England * Massachusetts PNC Bank, Ohio, National Association United States PNC Mortgage Bank, National Association* United States PNC National Bank* United States PNC Holding Corp. Delaware Alpine Indemnity Limited Grand Cayman, B.W.I. CastleInternational Asset Management United Kingdom Limited Lenders Life Insurance Company Arizona Midlantic Commercial Leasing Corp. New York Midlantic Funding Corp. New Jersey Parkway Management Inc.* New Jersey Pittsburgh National Life Insurance Arizona Company PNC Equity Management Corp* Pennsylvania PNC Capital Corp. Delaware PNC Commercial Corp Florida PNC Venture Corp Delaware PNC ESOP Funding Corporation Delaware PNC Financial Services, Inc. Kentucky PNC Funding Corp Pennsylvania PNC Investment Corp. * Delaware PNC Management Services Corp Delaware PNC Realty Holding Corp * Pennsylvania PNC Realty Company, Ohio Ohio PNC Securities Corp Pennsylvania PNC Trust Company of New York New York PNC Asset Management Corp. Pennsylvania The Central Bancorp Financial, Inc. Delaware + All active first tier subsidiaries of the Corporation's two primary subsidiary holding companies, PNC Bancorp, Inc. and PNC Holding Corp., have been listed. Not all of such subsidiaries are "significant subsidiaries" within the meaning of Rule 1-02(v) of Regulation S-X. * The names of the subsidiaries of the indicated entities are omitted because such subsidiaries, considered in the aggregate as a single subsidiary, would not constitute a significant subsidiary.

1 EXHIBIT 23 CONSENT OF INDEPENDENT AUDITORS We consent to the incorporation by reference, in the Registration Statements listed below, of our report dated February 8, 1996, with respect to the consolidated financial statements of PNC Bank Corp. and subsidiaries incorporated by reference in this Annual Report on Form 10-K of PNC Bank Corp. for the year ended December 31, 1995. Form S-3 relating to the shelf registration of $1 billion of debt securities of PNC Funding Corp, unconditionally guaranteed by PNC Bank Corp., and/or preferred stock of PNC Bank Corp. (Registration No. 33-55114) Form S-3 relating to the shelf registration of six million shares of PNC Bank Corp. preferred stock (Registration No. 33- 40602) Post-Effective Amendment No. 1 on Form S-3 relating to the shelf registration of $500 million of debt securities of PNC Funding Corp, unconditionally guaranteed by PNC Bank Corp. (Registration No. 33-42803) Form S-3 relating to the Dividend Reinvestment and Stock Purchase Plan of PNC Bank Corp. (Registration No. 33-52844) Form S-3 relating to the Dividend Reinvestment and Stock Purchase Plan of PNC Bank Corp. (Registration No. 33-61083) Form S-8 relating to the 1987 Senior Executive Long-Term Award Plan of PNC Bank Corp. (now known as the PNC Bank Corp. 1992 Long-Term Incentive Award Plan) (Registration No. 33-28828) Form S-8 relating to the PNC Bank Corp. 1992 Long-Term Incentive Award Plan (Registration No. 33-54960) Post-Effective Amendment No. 2 on Form S-8 relating to the PNC Bank Corp. Employee Stock Purchase Plan (Registration No. 2-83510) Form S-8 relating the PNC Bank Corp. Employee Stock Purchase Plan (Registration No. 33-62311) Post-Effective Amendment No. 1 on Form S-8 relating to the Stock Option Plan of PNC Bank Corp. (Registration No. 2-92181) Post-Effective Amendment No. 1 to Form S-8 relating to the PNC Bank Corp. Incentive Savings Plan (Registration No. 33-25140) Post-Effective Amendment No. 1 (on Form S-3) to Form S-4 relating to the conversion of outstanding debentures assumed in connection with the merger of PNC Bank Corp., Kentucky, Inc., with and into a wholly-owned subsidiary of PNC Bank Corp. (Registration No. 33-10016) Post-Effective Amendment No. 2 (on Form S-8) to Form S-4 relating to the exercise of stock options assumed by PNC Bank Corp. in connection with the merger of PNC Bank Corp., Kentucky, Inc., with and into a wholly-owned subsidiary of PNC Bank Corp. (Registration No. 33-10016) Post-Effective Amendment No. 1 (on Form S-8) to Form S-4 relating to the exercise of stock options assumed by PNC Bank Corp. in connection with the merger of a wholly-owned subsidiary of PNC Bank Corp. with and into Bank of Delaware Corporation (Registration No. 33-25642) Form S-8 relating to Midlantic Savings and Investment Plan (Registration No. 33-64557) ERNST & YOUNG LLP Pittsburgh, Pennsylvania March 26, 1996

1 EXHIBIT 24.1 POWER OF ATTORNEY PNC BANK CORP. ANNUAL REPORT ON FORM 10-K FOR YEAR ENDED DECEMBER 31, 1995 KNOW ALL MEN BY THESE PRESENTS, that each of the undersigned Directors and/or Officers of PNC Bank Corp. (the "Corporation"), a Pennsylvania corporation, hereby names, constitutes and appoints Walter E. Gregg, Jr., William F. Strome and Melanie S. Cibik, or any of them, with full power of substitution, such person's true and lawful attorney-in-fact and agent to execute in such person's name, place and stead, in any and all capacities, the Corporation's Annual Report on Form 10-K for the year ended December 31, 1995. And such persons hereby ratify and confirm all that said attorneys or attorney, or any substitute, shall lawfully do or cause to be done by virtue hereof. Witness the due execution hereof by the following persons in the capacities indicated as of this February 15, 1996. Name/Signature Capacity - --------------------------- ---------------------------------------------- /s/ THOMAS H. O'BRIEN Chairman, Chief Executive Officer and Director - --------------------------- Thomas H. O'Brien /s/ PAUL W. CHELLGREN Director - --------------------------- Paul W. Chellgren Director - --------------------------- Robert N. Clay /s/ WILLIAM G. COPELAND Director - --------------------------- William G. Copeland /s/ GEORGE A. DAVIDSON, JR. Director - --------------------------- George A. Davidson, Jr. Director - --------------------------- David F. Girard-diCarlo /s/ DIANNA L. GREEN Director - --------------------------- Dianna L. Green /s/ C. G. GREFENSTETTE Director - --------------------------- C. G. Grefenstette Power of Attorney - 1

2 /s/ ARTHUR J. KANIA Director - --------------------------- Arthur Kania /s/ BRUCE LINDSAY Director - --------------------------- Bruce Lindsay Director - --------------------------- Thomas Marshall /s/ CRAIG McCLELLAND Director - --------------------------- W. Craig McClelland Director - --------------------------- Donald I. Moritz /s/ JACKSON H. RANDOLPH Director - --------------------------- Jackson H. Randolph /s/ JAMES E. ROHR President and Director - --------------------------- James E. Rohr /s/ RODERIC H. ROSS Director - --------------------------- Roderic H. Ross Director - --------------------------- Vincent A. Sarni /s/ GARRY J. SCHEURING Vice Chairman and Director - --------------------------- Garry J. Scheuring /s/ RICHARD P. SIMMONS Director - --------------------------- Richard P. Simmons /s/ THOMAS J. USHER Director - --------------------------- Thomas J. Usher Power of Attorney - 2

3 /s/ MILTON A. WASHINGTON Director - --------------------------- Milton A. Washington Director - --------------------------- Helge H. Wehmeier Power of Attorney - 3

1 EXHIBIT 24.2 POWER OF ATTORNEY PNC BANK CORP. ANNUAL REPORT ON FORM 10-K FOR YEAR ENDED DECEMBER 31, 1995 KNOW ALL MEN BY THESE PRESENTS, that the undersigned Director of PNC Bank Corp. (the "Corporation"), a Pennsylvania corporation, hereby names, constitutes and appoints Walter E. Gregg, Jr., William F. Strome and Melanie S. Cibik, or any of them, with full power of substitution, such person's true and lawful attorney-in-fact and agent to execute in such person's name, place and stead, in the undersigned capacity as a Director, the Corporation's Annual Report on Form 10-K for the year ended December 31, 1995. And the undersigned Director hereby ratifies and confirms all that said attorneys or attorney, or any substitute, shall lawfully do or cause to be done by virtue hereof. Witness the due execution hereof by the undersigned Director as of this February 27, 1996. /s/ ROBERT N. CLAY - --------------------------- Robert N. Clay

1 EXHIBIT 24.3 POWER OF ATTORNEY PNC BANK CORP. ANNUAL REPORT ON FORM 10-K FOR YEAR ENDED DECEMBER 31, 1995 KNOW ALL MEN BY THESE PRESENTS, that the undersigned Director of PNC Bank Corp. (the "Corporation"), a Pennsylvania corporation, hereby names, constitutes and appoints Walter E. Gregg, Jr., William F. Strome and Melanie S. Cibik, or any of them, with full power of substitution, such person's true and lawful attorney-in-fact and agent to execute in such person's name, place and stead, in the undersigned capacity as a Director, the Corporation's Annual Report on Form 10-K for the year ended December 31, 1995. And the undersigned Director hereby ratifies and confirms all that said attorneys or attorney, or any substitute, shall lawfully do or cause to be done by virtue hereof. Witness the due execution hereof by the undersigned Director as of this February 29, 1996. /s/ DAVID F. GIRARD-diCARLO - --------------------------- David F. Girard-diCarlo

1 EXHIBIT 24.4 POWER OF ATTORNEY PNC BANK CORP. ANNUAL REPORT ON FORM 10-K FOR YEAR ENDED DECEMBER 31, 1995 KNOW ALL MEN BY THESE PRESENTS, that the undersigned Director of PNC Bank Corp. (the "Corporation"), a Pennsylvania corporation, hereby names, constitutes and appoints Walter E. Gregg, Jr., William F. Strome and Melanie S. Cibik, or any of them, with full power of substitution, such person's true and lawful attorney-in-fact and agent to execute in such person's name, place and stead, in the undersigned capacity as a Director, the Corporation's Annual Report on Form 10-K for the year ended December 31, 1995. And the undersigned Director hereby ratifies and confirms all that said attorneys or attorney, or any substitute, shall lawfully do or cause to be done by virtue hereof. Witness the due execution hereof by the undersigned Director as of this February 26, 1996. /s/ THOMAS MARSHALL - --------------------------- Thomas Marshall

1 EXHIBIT 24.5 POWER OF ATTORNEY PNC BANK CORP. ANNUAL REPORT ON FORM 10-K FOR YEAR ENDED DECEMBER 31, 1995 KNOW ALL MEN BY THESE PRESENTS, that the undersigned Director of PNC Bank Corp. (the "Corporation"), a Pennsylvania corporation, hereby names, constitutes and appoints Walter E. Gregg, Jr., William F. Strome and Melanie S. Cibik, or any of them, with full power of substitution, such person's true and lawful attorney-in-fact and agent to execute in such person's name, place and stead, in the undersigned capacity as a Director, the Corporation's Annual Report on Form 10-K for the year ended December 31, 1995. And the undersigned Director hereby ratifies and confirms all that said attorneys or attorney, or any substitute, shall lawfully do or cause to be done by virtue hereof. Witness the due execution hereof by the undersigned Director as of this February 26, 1996. /s/ DONALD I. MORITZ - --------------------------- Donald I. Moritz

1 EXHIBIT 24.6 POWER OF ATTORNEY PNC BANK CORP. ANNUAL REPORT ON FORM 10-K FOR YEAR ENDED DECEMBER 31, 1995 KNOW ALL MEN BY THESE PRESENTS, that the undersigned Director of PNC Bank Corp. (the "Corporation"), a Pennsylvania corporation, hereby names, constitutes and appoints Walter E. Gregg, Jr., William F. Strome and Melanie S. Cibik, or any of them, with full power of substitution, such person's true and lawful attorney-in-fact and agent to execute in such person's name, place and stead, in the undersigned capacity as a Director, the Corporation's Annual Report on Form 10-K for the year ended December 31, 1995. And the undersigned Director hereby ratifies and confirms all that said attorneys or attorney, or any substitute, shall lawfully do or cause to be done by virtue hereof. Witness the due execution hereof by the undersigned Director as of this February 28, 1996. /s/ VINCENT A. SARNI - --------------------------- Vincent A. Sarni

1 EXHIBIT 24.7 POWER OF ATTORNEY PNC BANK CORP. ANNUAL REPORT ON FORM 10-K FOR YEAR ENDED DECEMBER 31, 1995 KNOW ALL MEN BY THESE PRESENTS, that the undersigned Director of PNC Bank Corp. (the "Corporation"), a Pennsylvania corporation, hereby names, constitutes and appoints Walter E. Gregg, Jr., William F. Strome and Melanie S. Cibik, or any of them, with full power of substitution, such person's true and lawful attorney-in-fact and agent to execute in such person's name, place and stead, in the undersigned capacity as a Director, the Corporation's Annual Report on Form 10-K for the year ended December 31, 1995. And the undersigned Director hereby ratifies and confirms all that said attorneys or attorney, or any substitute, shall lawfully do or cause to be done by virtue hereof. Witness the due execution hereof by the undersigned Director as of this February 28, 1996. /s/ HELGE H. WEHMEIER - --------------------------- Helge H. Wehmeier

9 This schedule contains summary financial information extracted from the consolidated financial information incorporated by reference to the 1995 Annual Report, excerpts of which are filed herewith as Exhibit 13, and is qualified in its entirety by reference to such financial information.
0000713676 PNC BANK CORP. 1,000,000 12-MOS DEC-31-1995 DEC-31-1995 3,679 0 0 0 15,839 0 0 48,653 (1,259) 73,404 46,899 8,665 1,674 10,398 1,704 0 1 4,063 73,404 3,743 1,283 124 5,150 1,552 3,008 2,142 6 (280) 2,469 627 408 0 0 408 1.19 1.19 3.15 335 225 23 176 1,352 240 107 1,259 1,259 0 0

9 This schedule restates certain previously filed financial information to give effect to the merger between PNC Bank Corp. and Midlantic Corporation. The merger was completed on December 31, 1995 and was accounted for as a pooling of interests.
0000713676 PNC BANK CORP. 1,000,000 9-MOS 6-MOS 3-MOS 12-MOS 9-MOS DEC-31-1995 DEC-31-1995 DEC-31-1995 DEC-31-1994 DEC-31-1994 SEP-30-1995 JUN-30-1995 MAR-31-1995 DEC-31-1994 SEP-30-1994 2,956 3,446 3,490 3,412 2,862 0 0 0 0 0 0 0 0 0 0 0 0 0 0 0 3,035 3,261 3,915 3,790 5,478 18,479 19,136 19,572 19,880 19,767 18,253 18,935 18,846 18,559 18,840 45,900 45,492 44,192 44,043 44,546 (1,285) (1,300) (1,318) (1,352) (1,387) 75,100 76,519 75,750 77,461 77,315 43,870 46,177 43,598 45,818 44,465 13,689 13,269 14,789 12,193 12,929 1,643 1,912 1,633 1,596 1,997 9,985 9,368 9,972 12,127 12,212 1,512 1,497 1,544 1,654 1,679 0 0 0 0 0 1 1 51 51 51 4,400 4,295 4,163 4,022 3,982 75,100 76,519 75,750 77,461 77,315 2,760 1,815 887 3,189 2,349 999 683 345 1,407 1,028 91 58 29 127 97 3,850 2,556 1,261 4,723 3,474 1,151 748 358 1,159 827 2,260 1,494 722 2,231 1,557 1,590 1,062 539 2,492 1,917 5 3 1 84 84 9 9 1 (142) (17) 1,643 1,096 553 2,238 1,633 878 562 270 1,210 1,086 584 374 180 891 785 0 0 0 0 0 0 0 0 (8) (8) 584 374 180 884 778 1.71 1.09 .52 2.54 2.24 1.70 1.08 .52 2.52 2.22 3.11 3.12 3.16 3.64 3.75 396 432 451 496 578 174 181 189 175 168 45 45 46 69 50 0 0 0 134 0 1,352 1,352 1,352 1,372 1,372 163 115 62 277 209 84 53 26 116 83 1,285 1,300 1,318 1,352 1,387 1,285 1,300 1,318 1,352 1,387 0 0 0 0 0 0 0 0 0 0