information paper no. 27 february 2016 -...
TRANSCRIPT

INFORMATION PAPER NO. 27 FEBRUARY 2016
A roadmap to better data on education financing

UNESCO
The constitution of the United Nations Educational, Scientific and Cultural Organization (UNESCO) was adopted by 20 countries at the London Conference in November 1945 and entered into effect on 4 November 1946. The Organization currently has 195 Member States and 10 Associate Members.
The main objective of UNESCO is to contribute to peace and security in the world by promoting collaboration among nations through education, science, culture and communication in order to foster universal respect for justice, the rule of law, and the human rights and fundamental freedoms that are affirmed for the peoples of the world, without distinction of race, sex, language or religion, by the Charter of the United Nations.
To fulfil its mandate, UNESCO performs five principal functions: 1) prospective studies on education, science, culture and communication for tomorrow's world; 2) the advancement, transfer and sharing of knowledge through research, training and teaching activities; 3) standard-setting actions for the preparation and adoption of internal instruments and statutory recommendations; 4) expertise through technical co-operation to Member States for their development policies and projects; and 5) the exchange of specialized information.
UNESCO is headquartered in Paris, France.
UNESCO Institute for Statistics
The UNESCO Institute for Statistics (UIS) is the statistical office of UNESCO and is the UN depository for global statistics in the fields of education, science and technology, culture and communication.
The UIS was established in 1999. It was created to improve UNESCO's statistical programme and to develop and deliver the timely, accurate and policy-relevant statistics needed in today’s increasingly complex and rapidly changing social, political and economic environments.
The UIS is based in Montreal, Canada. Published in 2016 by:
UNESCO Institute for Statistics P.O. Box 6128, Succursale Centre-Ville Montreal, Quebec H3C 3J7 Canada
Tel: (1 514) 343-6880 Email: [email protected] http://www.uis.unesco.org
©UNESCO-UIS 2016
ISBN 978-92-9189-186-3 Ref: UIS/2016/ED/TD/3 DOI: http://dx.doi.org/10.15220/978-92-9189-186-3-en
This publication is available in Open Access under the Attribution-ShareAlike 3.0 IGO (CC-BY-SA 3.0 IGO) license (http://creativecommons.org/licenses/by-sa/3.0/igo/). By using the content of this publication, the users accept to be bound by the terms of use of the UNESCO Open Access Repository (http://www.unesco.org/open-access/terms-use-ccbysa-en).
The designations employed and the presentation of material throughout this publication do not imply the expression of any opinion whatsoever on the part of UNESCO concerning the legal status of any country, territory, city or area or of its authorities or concerning the delimitation of its frontiers or boundaries.
The ideas and opinions expressed in this publication are those of the authors; they are not necessarily those of UNESCO and do not commit the Organization.

- 3 -

- 4 -
How to leverage current initiatives: National Education Accounts, Public Expenditure
Reviews, BOOST, Education Country Status Reports and the UIS-UOE data collection
For effective education sector planning and monitoring, it is essential to know how much is spent in the area and how resources are used. Sustainable Development Goal (SDG) 4 is intended to “Ensure inclusive and equitable quality education and promote lifelong learning opportunities for all”.1 While there are no specific targets for financing education, it will be necessary to monitor whether sufficient resources are spent in order to reach the goal and targets, and whether they are allocated equitably and effectively within education systems. Even in the absence of global goals, national governments need accurate and regular data on financing for effective education monitoring and policy planning. For example, to assess the effectiveness of their education systems, governments must be able to link certain types of spending to education outcomes. To evaluate whether or not resources are distributed equitably, they must know how money flows to students from different backgrounds. For governments to evaluate whether they have the required fiscal space to fund their education programmes, they must know how much they and their donor partners are currently spending, and how much they will need to spend in the future. Donors supporting education in developing countries want to know whether the aid they provide is an incentive for governments to increase spending commitments or if they are crowding-out domestic resources. The availability of good data on education financing is a pre-requisite for all of these types of analyses.
Despite the benefits of a clear and comprehensive perspective on resource allocation, the global education community as well as national planners are faced with significant gaps in the data concerning education financing. Figure 1 presents an overview of the availability of education financing data in the database of the UNESCO Institute for Statistics (UIS) for 214 countries and territories during the 2005-2013 period. Less than one-half of countries were able to provide data for total government expenditure on education regularly over the period. The availability decreases further when data are broken down by education level or by detailed economic transaction (e.g. the amount spent on teacher salaries). For private sources of funding, such as households, there is no data available during the period for more than 60% of countries.
At the national level, the lack of data on financing is due to several factors, such as the complexity of education finance flows, data collected by multiple institutions, incompatible classifications and coverage, and ineffective compilation and presentation of information to education policymakers. As a result of these weaknesses in national data production systems, governments are often unable to report finance data to the UIS.
1 United Nations (2015). Open Working Group proposal for Sustainable Development Goals.
https://sustainabledevelopment.un.org/content/documents/1579SDGs%20Proposal.pdf

- 5 -
Figure 1. Availability of education financing data in the UIS database, 2005-2013, as a percentage of all (214) countries
Note: ‘Regular’ means data is available at least once every 3 years. ‘Irregular’ means data is available, but less frequently than every 3 years. ‘No data’ means the data point is not available at all for the country over the period. Source: UIS database, August 2015.
These gaps have prompted various initiatives where, whether as a main objective or as a side product, education financing data are collected, processed and in some cases published. This paper compares and evaluates the education financing data obtained through five of these tools:
Public Expenditure Reviews (PERs)
BOOST initiative
National Education Accounts (NEAs)
Education Country Status Reports (CSRs or RESEN)
UIS-UOE (UNESCO-OECD-Eurostat) annual data collection on education financing.
All of these initiatives receive support of international agencies and donors, in some cases the same ones. For example, the Global Partnership for Education (GPE) has funded CSRs, NEAs and other education finance capacity building projects implemented by the UIS. The UNESCO International Institute for Educational Planning (IIEP) has been involved in both NEAs and CSRs, and the World Bank has supported CSRs, PERs, BOOST and the UIS.
0%
10%
20%
30%
40%
50%
60%
70%
80%
90%
100%
Government exp.on all levels of
education
Government exp.on pre-primary
Government exp.on primary
Government exp.on lower sec.
Primary teachercompensation
Householdexpenditure for
educationalinstitutions--all
levels
Regular
Irregular
No data

- 6 -
While these tools all have different objectives, there are some overlaps in terms of the education finance data they collect. To clarify these linkages, this paper will:
1. Assess the similarities, differences and overlaps between education financing data collected and processed through these different tools;
2. Evaluate the degree of coverage, disaggregation and comparability of data these tools currently provide to the education sector at national and international levels;
3. Explore how methodologies could be harmonized and propose a roadmap to using these tools in a complementary way.
As background for this analysis, 10 PER, 10 publically-available BOOST databases and 11 past or on-going NEAs (complete and partial) were reviewed according to a set of criteria about the scope, level of disaggregation, comparability and usability of education financing data collected (see Annex 1). Overall, the analysis shows that while there are some important overlaps between the tools, they have different purposes and methodologies which lead to the production of data that can vary greatly in terms of coverage, disaggregation, comparability and frequency. Figure 2 presents an overview of the overlaps and differences between the different tools. It should be noted that this is a conceptual overview —in practice what is covered in a given country can vary significantly. Overall there are some important overlaps—particularly between the UIS data collection, NEAs and CSRs—however also important differences between the tools. Typically, only total government expenditure on education (all levels) can be generated systematically across all tools.
Figure 2. Scope of the UIS-UOE data collection, the NEA, PER, Boost and CSR
National Education Accounts
UIS-UOE Data Collection
Public Expenditure
Reviews
BOOST
Education Country Status
Reports
Total gov. educ.
exp. data
Disaggregation
by level
Comparable scope,
classifications and
definitions
Greater
disaggregation by
econ. transaction
Exp. data for all
sectors
Analysis of education
spending efficiencies
Public exp.
processes and
efficiency analysis
for all sectors
Whole education
sector analysis
Wide dissemination
of data and indicators
Exp. on educ. by private
and int. sources

- 7 -
Each tool has a different purpose and therefore responds to different needs. They all provide something that the others do not, whether it is more in-depth sectoral analysis, or more usable or comparable data. The differences in the degree of disaggregation of data, for example, reflect the fact that a BOOST or a PER is produced first and foremost with and for a country’s Ministry of Finance, and covers all sectors. The cost of separating spending between pre-primary and primary education, in terms of additional data and estimations needed, may outweigh its benefits in such a context, as would re-classifying the nature of spending into categories like ‘teaching materials’. However, these details matter when producing data to meet the needs of national education policy-makers. They must also be taken into account when the data are being produced for international databases and publications that are used by a wide range of actors with different interests. For example, SDG 4 calls for monitoring of education sub-sectors (levels) and specific topics such as equity, quality and teachers. To monitor government commitment in these areas, it will be essential to have detailed and disaggregated data on education financing.
The fact that in a given country data on education financing can be collected, processed and published multiple times through these different vehicles is a cause for reflection, especially in a context where national statisticians are struggling to provide data that are nevertheless weak and insufficient. Without coordination, the figures published through the different tools can be contradictory, which raises concerns about data quality and confusion among data users. Greater coordination, sequencing and alignment of methodologies between the sponsoring agencies could increase the breadth and quality of education financing data available at national and international levels and improve the effectiveness of its collection and processing.
Overview of each tool
Public Expenditure Reviews
A Public Expenditure Review (PER) is a diagnostic instrument used to evaluate the effectiveness of public finances. A PER typically analyzes government expenditures over a few years to assess their alignment with policy priorities and the results achieved. PERs aim to help diagnose spending problems and help countries develop more effective and transparent budget allocations.2 They are mostly a World Bank tool, and have been carried out in one form or the other since the 1980s although the format has evolved over time. A search for the ‘Public Expenditure Review’ collection on the World Bank’s online publication library yielded 634 documents between 1985 and 2014 although one review often includes more than one document or volume. Some of these reviews cover all sectors while others focus on a specific sector such as health, agriculture, or education. Narrowing the search to the last five years and to single reviews, 115 reviews covering 60 countries were found, or about 20-25 per year.
A PER is a diagnostic and analysis tool, and its main output is a narrative report which is often (but not always) publically available on the World Bank website. The main partner within national governments is usually the Ministry of Finance, although relevant line-ministries are also often involved. The report will usually include tables and graphs containing data, but a PER is not a database.
2 http://wbi.worldbank.org/boost/tools-resources/public-expenditure-review

- 8 -
BOOST
BOOST is a more recent World Bank initiative, which collects and compiles detailed data on all public expenditures from national treasury systems that are presented in an Excel database with a PivotTable interface. The data on expenditures are organized using the country’s budget classification codes and compiled in a single database that covers all sectors and all spending units recorded in the treasury system.
The content of each BOOST – and its level of detail – is country-specific but the general format applies to all countries. Each database typically contains information on the approved budget, revised budget, and actual expenditure amounts broken down by government level, administrative unit, sub-national spending unit, economic transaction, functional classification (if available), program classification (if available), and financing source.3 So far, BOOST databases for 17 countries are publically available online.4
The UIS-UOE data collection on education financing
Every year, the UIS sends a survey on formal education to all countries which includes three questionnaires about: (i) data on pre-tertiary education; (ii) tertiary education (both covering students, teachers and graduates); and (iii) education financing for all levels of education. Countries that are members of the OECD and the European Union complete the UOE questionnaire, which is implemented jointly by the UIS, the OECD and Eurostat. The remaining countries receive the UIS questionnaires. Typically, the survey is sent to the Ministry of Education, which often collaborates with the Ministry of Finance to obtain and process the data on financing. Although there are some small differences between the two finance questionnaires, they are fully compatible and can produce data and indicators comparable for all countries of the world. The questionnaire covers financing by source (government, international, private), by educational institution (public, private) and by economic transaction (teacher and non-teacher compensation, current and capital expenditure). The data received from country governments are then processed and reviewed in terms of quality by the UIS before being widely disseminated through the UIS Data Centre and published by a wide range of partners, notably international organizations.
In addition to this annual survey on education expenditure, the UIS regularly provides technical support to national respondents and government agencies. Support includes workshops for groups of countries, to individual country missions which can focus on several topics in addition to education finance or more in-depth projects, such as the NEA methodology as described below. Globally, the UIS-UOE survey often serves as a framework for countries to collect and consolidate education financing statistics. The requirement to report this data annually to the UIS can serve as the impetus to put in place a more systematic data collection system. At the same time, UIS technical assistance and capacity-building activities are specifically designed to help countries complete the questionnaire, but also to use the resulting data for their own planning purposes.
3 http://siteresources.worldbank.org/INTECA/Resources/KB43onBOOST.pdf
4 Armenia, Burundi, Guatemala, Indonesia, Kenya, Kiribati, Mali, Mauritania, Mexico, Moldova,
Paraguay, Peru, Poland, Seychelles, Solomon Islands, Togo and Tunisia (and two states of Brazil) as of August 2015.

- 9 -
National Education Accounts
National Education Accounts (NEAs) represent a comprehensive approach to data collection, processing and analysis, covering the different sources of funding (government, private, international), where it goes (to education providers, regions, etc.) and economic transactions (salaries, other current expenditure such as teaching materials, infrastructure, etc.). They find their origin in National Accounts, which measure the economic activities of a country in a comprehensive way, for example calculating the GDP. Satellite accounts use the same broad framework to produce sub-accounts for specific sectors (e.g. health, tourism, environment, agriculture, etc.), providing more detail and specific categories. For example, National Health Accounts have existed for several decades and have been implemented at least once in more than 100 countries.5
So far, NEAs have only been implemented in a few countries6. With funding from the Global Partnership for Education (GPE)’s Global and Regional Activities (GRA) programme, the UIS, the International Institute for Educational Planning (IIEP) and the IIEP/Pôle de Dakar have implemented a collaborative project aimed at improving national reporting systems on education finance flows, based on the NEA methodology. The project, which is still on-going, has been supporting eight countries to collect and analyse government expenditure on education. In addition, two countries focus more specifically on: a) public resource allocation within the system; b) household expenditure; and c) external funding. The remaining countries cover all sources of funding.7
Through the project, the UIS and the IIEP are also developing international guidelines for the implementation of NEA, based on a methodology which aims to provide a solid basis for countries to produce education financing data which are systematic, comprehensive and comparable to other countries, while keeping a degree of flexibility to reflect national realities. The methodology being developed draws heavily on existing international standards such as:
The System of National Accounts (SNA);
The Government Finance Statistics manual (GFS); and
The International Standard Classification of Education (ISCED).
Data are collected from financing units (those funding education) and producing units (those providing education services). The data are then processed using common classifications of education level, type of provider and economic transaction, so that they can be consolidated under one cohesive framework, reconciling the perspectives of financing and producing units.
5 UIS-IIEP (2015). “National Education Accounts: A comprehensive framework to improve education
finance statistics”. http://www.uis.unesco.org/Education/Documents/wef-national-education-accounts.pdf
6 In recent years, this is the case in El Salvador, Kenya, Morocco, Thailand and Turkey, as well as a few
states in Nigeria. In the 1990s, this was done in Benin, the Dominican Republic, Madagascar and Mauritania.
7 Côte d’Ivoire, Guinea, Nepal, Lao People’s Democratic Republic, Senegal, Uganda, Viet Nam and
Zimbabwe.

- 10 -
Data collected under the NEA framework are compatible with the UIS data collection on finance, and can be integrated into the UIS questionnaire and categories with little to no additional estimation or processing. From the UIS point of view, the NEA is a more systematic, comprehensive and in-depth version of the type of capacity-building work it has been carrying out to support countries with education financing data.
Education Country Status Reports (CSR)
Education Country Status Reports (CSR or RESEN from its French acronym) are diagnostic tools of a national education system, aimed at helping decision makers identify strengths and weaknesses, monitor progress and choose the best education policy options. They normally cover all aspects of education: policy, progress, enrolment, teachers, quality, financing, etc. CSRs have been implemented in Africa, with technical support from IIEP/Pôle de Dakar and/or the World Bank. The GPE, along with other donors, has funded several CSRs. As with PER, a CSR is a diagnostic and analysis tool, the output being a narrative report including tables and graphs, which is generally made publically available.8
Comparison of tools
Scope and coverage
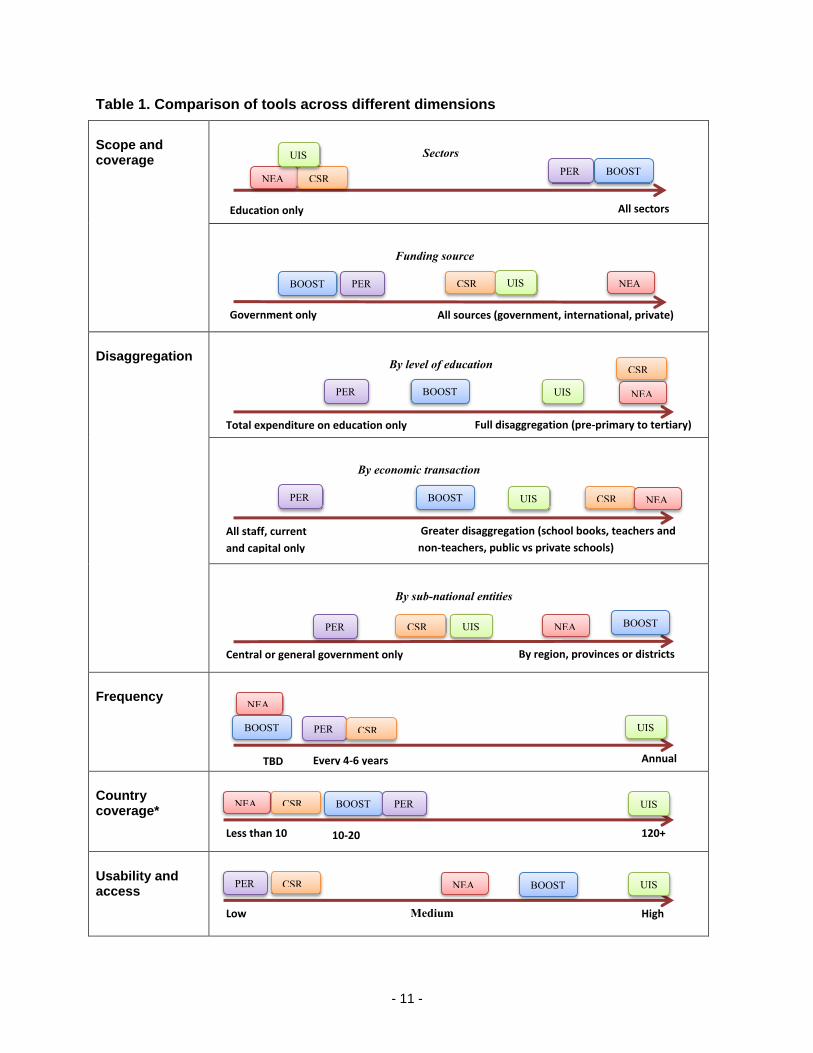
The UIS-UOE data collection and the NEA methodology are first and foremost education financing data collection and processing tools. They cover all sources of funding for education, whether they be governmental, international or private sources. In practice, however, many countries participating in the UIS survey are unable to provide data beyond government sources without active technical support—such as through an NEA. This is because data on spending by households, corporations, NGOs and off-budget donor funding is often either unavailable or available in a format which requires significant manipulation and estimations to be useable in the context of education policymaking. Both frameworks cover expenditure on all formal education programmes and include all levels of education, from pre-primary to tertiary, including vocational training.
PERs and BOOST on the other hand cover public expenditure from all sectors, although in some cases PERs may focus on a specific sector such as education. They do not necessarily cover spending from international sources, except for on-budget donor funding, which may not always be clearly disaggregated from government sources. Household expenditure is sometimes included in a PER but rarely in an integrated manner with government expenditure. Since BOOST covers all government spending, it includes spending on all levels of education. This is generally true for PER as well, although sometimes it focuses on a specific level, such as basic education.
8 https://www.iipe-poledakar.org/en/diagnostic-du-systeme-educatif-resen
- 11 -
Table 1. Comparison of tools across different dimensions
Scope and coverage
Disaggregation
Frequency
Country coverage*
Usability and access
Education only All sectors
NEA CSR
UIS
BOOST PER
Sectors
Government only All sources (government, international, private)
Funding source
BOOST PER CSR UIS NEA
Total expenditure on education only Full disaggregation (pre-primary to tertiary)
By level of education
BOOST PER UIS
CSR
NEA
All staff, current
and capital only
Greater disaggregation (school books, teachers and
non-teachers, public vs private schools)
By economic transaction
PER BOOST UIS CSR NEA
Central or general government only By region, provinces or districts
By sub-national entities
PER CSR UIS NEA BOOST
TBD Annual Every 4-6 years
NEA
BOOST PER CSR UIS
Less than 10 120+ 10-20
NEA CSR BOOST PER UIS
Low High
NEA CSR BOOST PER UIS
Medium

- 12 -
Comparability
Notes: See Annex 1 for a more detailed table. *Number of countries with data on government expenditure on education for 2010 or more recent year.
In all cases, the identification and extracting of expenditure on education from spending on other sectors may be difficult when the government’s financial system does not include a functional classification. For example, many governments classify their expenditure by administrative function rather than by sectors or programmes, i.e. following a list of ministries and agencies. While education is primarily the responsibility of the ministry of education, in some countries there can be two or three ministries of education covering different sub-sectors. In addition, other ministries such as health, labour or agriculture may also spend on education. In the absence of a classification which assigns each line of the budget to a specific sector or function, extracting data on education may require significant work. This step is part of an NEA exercise and in many cases required before countries can report complete data to the UIS, however in the case of a PER or BOOST it may not be done systematically.
Disaggregation
By level of education. The UIS-UOE data collection, an NEA or a CRS normally provide data that is disaggregated by level of education. Countries will often have to use a number of estimations based on additional data, such as the number of teachers, salary scales and/or the number of students by level, to provide this disaggregation. In practice, in the absence of technical support (such as through an NEA exercise or other capacity-building activities), not all countries are able to provide data disaggregated by level to the UIS (see Figure 1).
In the case of BOOST and PER, the level of detail depends on how data are disaggregated in the treasury’s tracking system. Separating data by education level is possible when a functional classification exists for education sub-sectors/levels. However, these sub-sectors rarely disaggregate pre-primary from primary or lower from upper secondary education. An apparent classification may also be only theoretical, especially when one or several ‘unallocated’ categories exist. For example, while the Kenya BOOST database includes a classification by level of education, between 75% and 85% of all expenditure is classified under ‘general administration’ or one of other ‘unallocated’ categories. In such cases, the classification by level must essentially be redone, using estimation techniques, such as those used in an NEA, a CSR or through the UIS reporting exercise.
By economic transaction. Most countries’ financial systems have a certain degree of disaggregation by type of economic transaction. Therefore, a PER will often (but not always) include data on salaries and current and capital expenditure on education, although rarely providing more detail. In BOOST databases, other levels of disaggregation by economic nature are often included, again based on what exists in the country’s system, although these might not be reclassified into easy-to-use sub-categories. NEAs, CSRs and the UIS-UEO frameworks often include separate items for ancillary services and expenditure on school books and teaching materials. Efforts will also be made to separate staff compensation between teachers and administrative staff, which is important for accurate education policy monitoring and
Low High
NEA CSR BOOST PER UIS
Medium

- 13 -
planning but usually requires additional estimations as data from treasury systems rarely make that distinction. This disaggregation is normally not available in a BOOST database or a PER.
By sub-region. The UIS-UOE data collection includes spending which can be separated between central, regional and local governments as a whole but does not disaggregate between individual sub-national entities. In the case of NEAs, a regional dimension may be added if there is interest from the national team. BOOST presents an added value with this feature available through the Excel tool, as long as a country’s treasury system provides a sub-regional classification.
Methodological framework
Beyond differences in scope and classifications, the various tools may also differ in terms of the conceptual framework used to organize data. One important feature of statistics on financing is that they must take into account how funds flow between statistical units and dimensions. For example, the NEA framework distinguishes between financing units, or those funding the system (such as the government or households) and the producing units, or those providing the services (such as a school or university). Data are classified along those dimensions, in addition to level of education, activity and economic transaction.
In addition, a framework considering all sources of financing must take into account that financing units do not only send money to schools but also to themselves through transfers (see Figure 3). For example, international donors may occasionally directly finance schools in a developing country, but in most cases they will go through an intermediary, such as the government or an NGO. In many cases the intermediaries include the transfers with income from other sources when reporting their own expenditure. This is often the case for government expenditure and support received from international donors. To illustrate, when these flows are recorded in the budget and expenditure tracking system, published figures on government expenditure will typically include a portion of international aid. When processing and disseminating data on education expenditure, understanding how the issue of funding vs expenditure (or initial vs final financing) is resolved is important. In both NEAs and the UIS-UOE framework, this is done through classifying flows (or transfers between financing units) separately. From the information available, it is difficult to know if or how this is considered in a systematic manner in PER, BOOST or CSRs.
Comparability
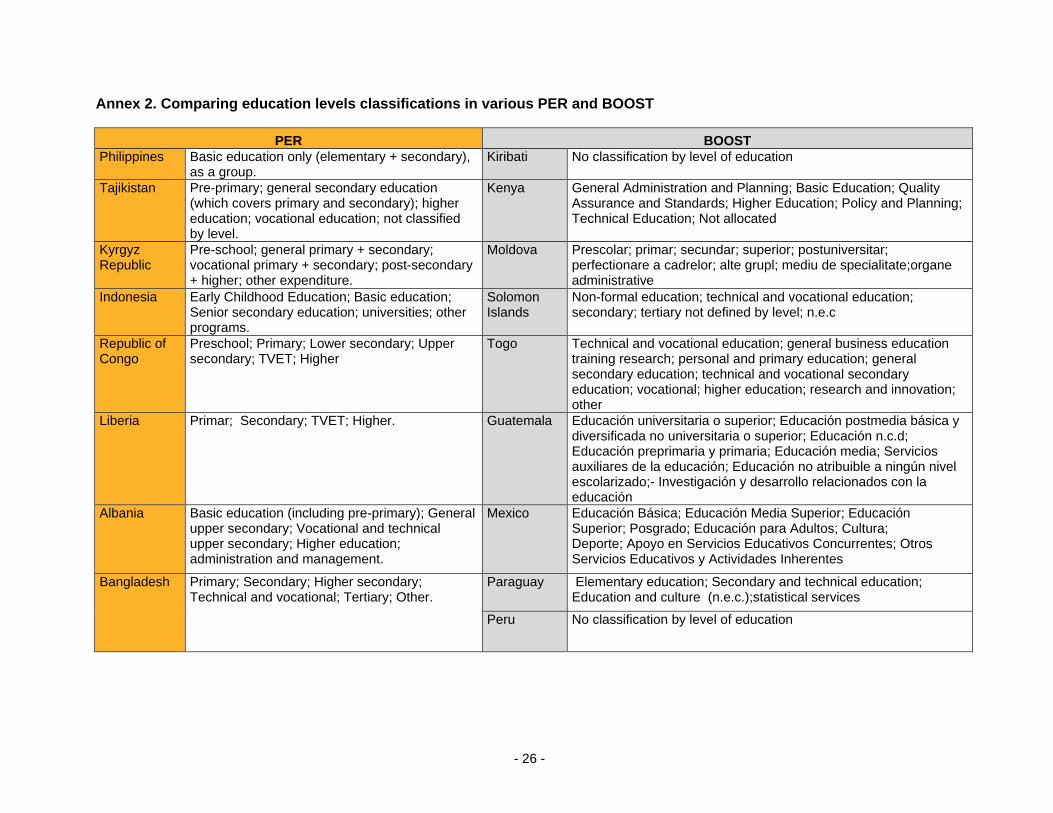
The NEA and UIS-UEO data collections are based on a classification which allows for cross-national comparability, while PER, BOOST and CSR are not. For example, the UIS-UOE and the NEA frameworks specify a common set of goods, services and activities which can be considered as expenditure on education, which is not necessarily the case for a PER or BOOST. This is normal, since these tools are not designed to be sector specific. Even when PER or BOOST may include a disaggregation of data by level of education, the categories will vary from one country to the other (see Annex 2), while the NEA methodology and the UIS-UOE data collection are compatible with ISCED.

- 14 -
Figure 3. Funding vs expenditure
The main objective of PER, BOOST or CSR is to provide data and analysis at country level, so they are not designed for comparability from the onset. In practice, however, when a financial classification system is set up based on international norms (such as GFS or the Classification of Functions of Government-COFOG), comparability may be increased. Data obtained through a CSR will present a certain degree of comparability since the method used to collect and process the data is similar; however, it does not systematically follow international classifications and standards. In an NEA and the UIS data collection, comparability is an integral part of the process.
Comparability is not just about comparing countries with each other but also about being able to compare the same country over time. National classifications tend to change more often than international ones, and in the absence of a re-classification of historical data, the data obtained in two PERs for the same country over a five-year period may not be comparable.
General
government
Central
government
Local
governments
Rest of the
World
Grants from donors
Loans from donors
Private
sector
Corporations
NGO
Households
Funding (or initial financing) Expenditure (or final financing)
Central
government
Local
governments
Households
Corporations
NGO
Grants from donors
Transfers
Reimbursement of
loans

- 15 -
Usability and access
The way in which data are presented and disseminated through these various tools influence their usability. A PER or a CSR are primarily analytical tools and not data collections. Although a lot of data may be collected and processed, they are normally only available to a larger public in the form of tables and graphs in a printed or PDF report. While this information may be publically available, its format is neither standardised nor easily extractable, often lacking details. Information about methodology, classifications and definitions are also rarely available.
BOOST and the UIS data collection, on the other hand, are tools which can provide easily accessible and usable data. As of August 2015, BOOST databases were available on the World Bank website through a set of Excel files for 17 countries. It remains to be seen how many governments accept to make their BOOST databases public, but this is a key determinant of accessibility and dissemination of data.
Comparability: What is it and why is it important?
Collecting and using education financing data are important for policy planning and monitoring at the national
level, and doing so on an annual basis will strengthen the analysis of trends. Indicators based on GDP or
other data will help make the data better understood and more easily comparable. Is spending 4% of GDP on
education high or low? Should a country be worried if 80% of its budget is spent on salaries? As such,
national reports often include regional or international comparisons. In general, more organizations tracking
and assessing the performance of education systems, global resource needs and international goals implies
the use of data which are comparable across countries.
To produce internationally comparable data, definitions and classifications must be similar on all dimensions
of education financing, whether it be the source of funding, the level of education or the economic transaction.
Comparing data from one country to the other in a table or a graph is not the same thing as producing
comparable data, in the same way that putting an orange next to a group of apples does not make it an
apple. For example, almost all PERs reviewed—and many, if not all, CSRs- include tables and graphs
comparing data between the reviewed country and others of the same region or globally using national and
UIS data. However, since PERs and CSRs are not necessarily built around the same international
classification as UIS data, the comparisons can be misleading.
For example, many countries may collect data on ‘basic education’, which in one country may cover pre-
primary and primary education, but in another, primary and lower secondary levels. Similarly, when linking
inputs to certain learning outcomes, many policymakers will seek to evaluate how much a country spends on
teacher salaries compared to school books and teaching materials. In the former, the Fast-Track Initiative
(now the Global Partnership for Education) indicative framework, countries were expected to spend 33% of
their current expenditure on other spending than teacher compensation. Countries were and continue to be
compared and assessed against that benchmark, whether to evaluate the credibility of their sector plan or to
evaluate support from donors. However, in some countries expenditure on teaching materials is classified as
current expenditure while in others it is capital or investment. In some countries the classification varies from
year to year. In the absence of a common classification framework, these indicators loose much of their
meaning.

- 16 -
Since the main purpose of the UIS-UOE data collection is to disseminate internationally comparable data, the data are widely available to a range of actors at national and international levels through the UIS Data Centre and through data exchanges with key users like the World Bank (for the EdStats and World Development Indicators databases), the Education for All Global Monitoring Report, the GPE, UNICEF and UNStats. This is mostly done through the dissemination of indicators calculated by the UIS using data received from countries and additional external sources, although some raw data or absolute figures may also be made available. By definition, when a country sends data to the UIS, the government accepts that the data will be made public and widely available.
Frequency and country coverage
The UIS-UOE data collection is the only tool which, by design, collects data on an annual basis. In practice, the regularity with which countries report to the UIS varies. For example, for a given year data on total government expenditure on education are available for about 40% to 50% of the 200+ countries and territories covered in the UIS database. While this rate is suboptimal, the framework nonetheless provides the global education community with more regular data that any other tools, through a network of contacts and focal points reaching most Ministries of Education around the world. In contrast, PERs and CSRs are not done systematically, and usually updated every four to six years. BOOST and NEAs are newer tools and therefore have not been carried out in a particularly large number of countries so far, but this could change if their use becomes more widespread. All tools however typically include several years of data.
To illustrate, Figure 4 shows the number of countries for which data on total government expenditure on education are publically available for 2010 or a more recent year.
To build its education financing indicators, the UIS regularly updates economic and population data and updates the time series data. In contrast, without updates to time series, data in a PER or a CSR can become out of date.
Figure 4. Number of countries with publically available data on government expenditure on education, 2010 or more recent year
- 17 -
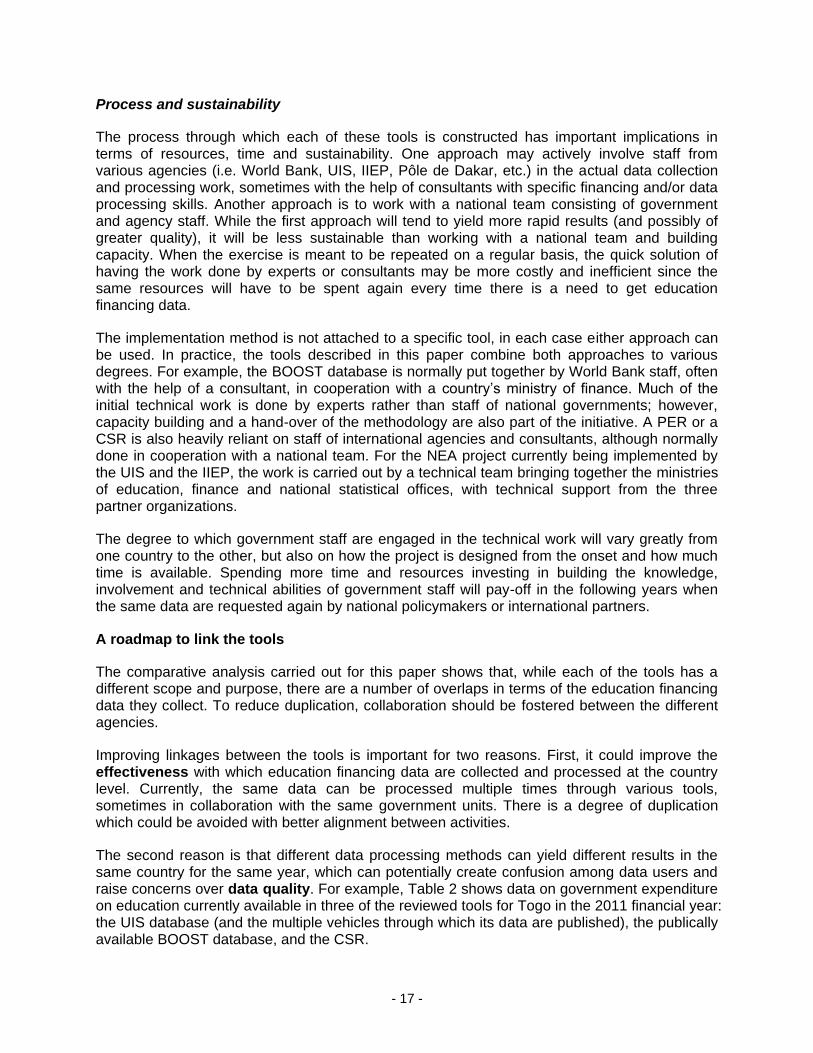
Process and sustainability
The process through which each of these tools is constructed has important implications in terms of resources, time and sustainability. One approach may actively involve staff from various agencies (i.e. World Bank, UIS, IIEP, Pôle de Dakar, etc.) in the actual data collection and processing work, sometimes with the help of consultants with specific financing and/or data processing skills. Another approach is to work with a national team consisting of government and agency staff. While the first approach will tend to yield more rapid results (and possibly of greater quality), it will be less sustainable than working with a national team and building capacity. When the exercise is meant to be repeated on a regular basis, the quick solution of having the work done by experts or consultants may be more costly and inefficient since the same resources will have to be spent again every time there is a need to get education financing data.
The implementation method is not attached to a specific tool, in each case either approach can be used. In practice, the tools described in this paper combine both approaches to various degrees. For example, the BOOST database is normally put together by World Bank staff, often with the help of a consultant, in cooperation with a country’s ministry of finance. Much of the initial technical work is done by experts rather than staff of national governments; however, capacity building and a hand-over of the methodology are also part of the initiative. A PER or a CSR is also heavily reliant on staff of international agencies and consultants, although normally done in cooperation with a national team. For the NEA project currently being implemented by the UIS and the IIEP, the work is carried out by a technical team bringing together the ministries of education, finance and national statistical offices, with technical support from the three partner organizations.
The degree to which government staff are engaged in the technical work will vary greatly from one country to the other, but also on how the project is designed from the onset and how much time is available. Spending more time and resources investing in building the knowledge, involvement and technical abilities of government staff will pay-off in the following years when the same data are requested again by national policymakers or international partners.
A roadmap to link the tools
The comparative analysis carried out for this paper shows that, while each of the tools has a different scope and purpose, there are a number of overlaps in terms of the education financing data they collect. To reduce duplication, collaboration should be fostered between the different agencies.
Improving linkages between the tools is important for two reasons. First, it could improve the effectiveness with which education financing data are collected and processed at the country level. Currently, the same data can be processed multiple times through various tools, sometimes in collaboration with the same government units. There is a degree of duplication which could be avoided with better alignment between activities.
The second reason is that different data processing methods can yield different results in the same country for the same year, which can potentially create confusion among data users and raise concerns over data quality. For example, Table 2 shows data on government expenditure on education currently available in three of the reviewed tools for Togo in the 2011 financial year: the UIS database (and the multiple vehicles through which its data are published), the publically available BOOST database, and the CSR.

- 18 -
Table 2. Comparing education expenditure data for Togo, FY 2011 (in billions local currency)
Data Point UIS CSR BOOST
Total government expenditure on education 78.6 75.1 69.7
Total government expenditure on pre-primary+ primary education 40.0 36.2 40.4
Total government expenditure on general and vocational secondary education 23.1 24 5.0
Government expenditure on staff compensation (education) 60.8 50.1 45.6
Government expenditure on other current expenditure (education) 11.7 4.8 3.8
Government expenditure on transfers (education) 4.5 18.1 18.2
Government expenditure on capital expenditure (education) 6.1 2.1 2.1
Sources: UIS database; Togo BOOST database; IIEP-Pôle de Dakar and UNICEF, 2014. TOGO : Rapport d’état du système éducatif.
Without coordination or common methodologies, different figures are available for the same data point. The total amount of education expenditure can differ depending on which ministries are included. As an example of vast differences, according to BOOST, Togo spent 7% of its education spending on secondary and vocational education in 2011. According to UIS and the CSR, the share was 33% to 34%. The difference is because the UIS and CRS assign all spending according to levels of education, while the BOOST relies on the functional classification in the treasury system (where 17% of expenditure is not allocated by education level). There is also a notable difference in what is considered as transfers vs current or capital expenditure.
The Togo example highlights the importance of collaboration. To produce education financing data, a PER is of limited use, since the data are often inconsistent and not ‘usable’. BOOST has greater potential to play a role in data collection, processing and dissemination exercises in education as well as other sectors, whether it be an NEA, a CSR, the UIS-UEO annual data collection or others. It presents data which are comprehensive in terms of government expenditure, already cleaned and classified, as detailed as government systems allow, and easy to extract and manipulate. A country doing an NEA or wanting to report data to the UIS, for example, would benefit from using BOOST as a starting point, rather than having to re-do the data collection and cleaning part for government sources. It could be logical to start with BOOST.
BOOST however does not, in itself, provide education financing data which are disaggregated and classified to fully inform education policymakers. More complete exercises, such as an NEA, are needed but BOOST could be used as a basis when the database is available.
Table 3 shows a potential path for sequencing and coordinating between BOOST, a phased NEA and the regular use and dissemination of data for national sector planning (through CSR, sector review or other means) and reporting to the UIS in a given country. The path works in phases, so that a lighter option or a longer-term engagement can be chosen depending on the context. Some activities linked to education financing data are common across different tools to illustrate a strategy of joint rather than overlapping data collection and processing. To be successful, agencies would need to actively work together in the planning and implementation of various steps, devise a flexible strategy adapted to the national context, find a balance between getting quick and regular data and working towards greater coverage and quality, and develop better aligned methodologies.

- 19 -
Table 3. A potential pathway for greater sequencing and collaboration
Activities Outputs NEA
CSR/Other
sector
planning tools
BOOST/
PER
Phase 0
Mapping of funding flows
Identification of data sources
Composition of technical team and institutional setting
Phase 1
Data on government expenditure obtained XData on teachers, salary scales, students obtained
Classification developed
Data on government expenditure cleaned, verified XData on government expenditure reclassified and
dissagregated for education sector needs
Education financing tables produced and data reconciled
National brief on education financing published XData integrated into education annual statistical
yearbook and sector review
Data reported to the UIS and published at international
level
Phase 2
Update of
Phase 1 data
New year added to data processing tools for government
expenditure X
Data on household expenditure data obtained
Additional education sector data obtained (students,
teachers, learning outcomes, etc.)X
Data on household expenditure cleaned, verified, and
reclassified
Data from all sources reconciled
CSR or other sector large-scale review report published XData reported to the UIS and published at international
levelPhase 3
Update of
Phase 2 data
New year added to data processing tools for government
and household expenditure X X
Data collectionData on other private and international expenditure
obtained XData on other private and international expenditure
cleaned, verified and reclassified XData from all sources reconciled XPublication of a full set of National Education Accounts
covering all sources XData integrated into education annual statistical
yearbook and sector review XData reported to the UIS and published at international
level X
X
X
Data collection
X
X
Data processing
and
consolidation
Analysis and
dissemination
Data processing
and
consolidation
X
X
X
Data processing
and
consolidation
Analysis and
dissemination
X
X
X
Analysis and
dissemination
Ligh
t o
pti
on
Lon
ger-
term
en
gage
me
nt
Appraisal
X
X
X
Data collectionX

- 20 -
Step 1: Coordinate and collaborate
It may seem obvious, but any collaborative strategy requires a high degree of coordination among the various agencies—something often easier said than done. Avoiding duplication requires good planning and sequencing of activities. For example, although BOOST has the potential to be a good basis for the production of education financing data, this is only the case if the data are made public and available for further analysis by the UIS, the IIEP and/or their counterparts in ministries of education. This should be discussed early in the process. Furthermore, the timing of data collection and processing will influence if and how the data are to be used in a sector review or a CSR.
In countries where it is present, the GPE should act as a coordinator for the complementary use of tools, sequencing of activities, links with planning at the country level, and the subsequent reporting of data to the UIS. The UIS, which has the mandate and expertise to produce and disseminate comparable data on education in general and financing in particular, should retain its role as the main source of data at the international level. At the same time, the IIEP and the IIEP/Pôle de Dakar should continue to lead initiatives on sector planning at country level. All of this work should build on the experience and on-going activities of the World Bank in public expenditure tracking and management. The challenge is for the various organizations to work together and coordinate rather than overlapping projects involving education financing data collection and processing.
Step 2: Adapt the strategy to country context
The tools described in this paper do not operate in an empty field. In practice, most countries have a number of existing data sources on education expenditure, with various degrees of consolidation into a ‘data system’. In some cases, even without calling these ‘BOOST’ or ‘NEA’, some of these systems may be relatively well-functioning and able to produce at least some data which can be used for national policy planning and international reporting. Any viable strategy should build on what already exists.
Taking this into account, a comprehensive strategy should include an appraisal phase before a particular course of action is chosen. Mapping existing systems, financing flows, the policy and planning context and potential data sources will help governments and their international partners choose the right tool. In some cases it could be an NEA, which could be implemented in its entirety or on a step-by-step basis. In other cases it may be an alternative tool or a new data collection. For example, it should be noted that the tools reviewed in this paper are first and foremost frameworks for the consolidation of education financing data. They do not, in themselves, produce more data. They can provide an impetus for new data collections (i.e. a new survey) and promote the use of existing but not easily accessible or usable data. The best strategy for a country may be to focus on a new data collection or the strengthening of an existing data collection system, rather than doing an NEA.
Step 3: Find a balance between data coverage, quality, and regularity
In any data collection and consolidation exercise, there is a tension between producing regular and quickly available data, or data which are more comprehensive and of greater quality. For example, data on government expenditure can be obtained more easily and frequently than data on private expenditure or external assistance to education. Similarly, each level of disaggregation implies either a more sophisticated data tracking system or the use of complementary data and estimations—both requiring more time and resources to implement

- 21 -
than simply focussing on a total. More in-depth exercises such as an NEA or a CRS are complex and demanding, which may be difficult and costly to reproduce annually in their entirety. As such, they may not always be as appealing for national policymakers and the global education community who are hungry for regular and recent financing data.
Balancing those two realities calls for a strategy which can both provide quick and regular basic data, while gradually improving its quality and coverage—including private and external sources of funding. A step-by-step approach, where each phase updates existing data, adds new data and improves its overall quality, may be advisable. It could function on an annual schedule of dissemination of data, for example starting with government expenditure. Every few years a country could do a more in-depth sectoral review (i.e. through a CSR or other sector planning tools), using data from this system rather than starting from scratch every time.
Step 4: Align methodologies
To be sustainable, a gradual or step-by-step approach would need to be built around a sound methodology which can serve multiple purposes (i.e. national policymaking and international reporting and comparisons) and anticipate the next steps. A building blocks strategy will only work if there is a plan for the whole structure, and the first blocks are placed in a way which allow for the addition of new ones in the future. The issue of funding vs expenditure, as illustrated in Figure 3, is a case in point. Classifying transfers between financing units may not appear crucial when the data collection focuses on government expenditure only—or only one level of government. However the methodological and conceptual challenges will come up as soon as other sources of funding are added.
The NEA methodology—which is still being developed—can provide such a basis since it is based on international classifications and standards, while providing flexibility for national realities, and considers the whole system from the onset. As such it may be useful to distinguish between the NEA methodology and the NEA exercise. Doing the full accounts, including a reconciliation of financing and producing units, is ambitious and may not be relevant or necessary for all countries. Nonetheless, the principles and classification behind the methodology can and should be used even in more limited data collections and processing exercises.
Conclusion
There are important differences in the data collected through PERs, BOOST, NEAs, CSRs and the UIS-UOE data collection. This is not surprising, since each tool has a different purpose. Nonetheless, some of the overlaps allow for greater collaboration, recognising that better and regular education financing data are needed while the process is time-and resource-intensive. The right sequencing and coordination, coupled with a clarification of boundaries and mandates of organizations and an alignment of methodologies, could improve the situation for the benefit of all involved, including governments and international agencies.
Figure 3: A possible sequencing of BOOST, NEA and reporting and dissemination of data

- 22 -
Annex 1. Comparing PERs, BOOST, NEAs, the UIS-UOE data collection, and CSRs
Criteria Public Expenditure
Review BOOST NEA
UIS-UOE data
collection
Education
Country Status
Reports
Public expenditure
Does it include all
levels of
governments?
Mostly, to the extent
possible
Mostly, to the extent
possible
Yes, to the extent
possible
Yes, to the extent
possible
Yes, to the extent
possible
Does it include all
levels of
education? Is the
data
disaggregated by
level?
Generally yes, but in some
cases may cover on some
sub-levels of education.
Disaggregation may vary,
will follow the way finance
data exists at country level.
All levels and type of
education normally
covered. Disaggregation
may vary, will follow the
way finance data exists
at country level.
Yes, all levels should be
included and
disaggregation should
follow national system
while being compatible
with ISCED.
Yes, guidelines
request data on all
levels of formal
education, with
disaggregation by
ISCED levels.
Yes, all levels are
included and
disaggregated following
the national system.
Does it include all
Ministries and
agencies funding
education?
Sometimes yes,
sometimes no, and
sometimes it is not clear
from the report.
Yes, since it covers all
public expenditure, but
when data is not
classified by function it
may be difficult to
separate education
clearly
Yes To the extent possible To the extent possible
Does it cover
budget or actual
expenditure?
It depends, usually actual
or both
Both
Actual Actual most times,
sometimes budget
Actual
Is the data split
between staff
compensation,
other current and
capital?
Yes, with one exception Yes
Yes Yes Yes
Is the staff
compensation
split between
teachers and non-
teachers?
No No Yes
Yes Yes
Figure 4: A possible sequencing of BOOST, NEA and reporting and dissemination of data

- 23 -
Criteria Public Expenditure
Review BOOST NEA
UIS-UOE data
collection
Education Country
Status Reports
Is there further
disaggregation
available which
can be of interest
to education
policy-makers?
Sometimes yes sometimes
no.
Sometimes yes sometimes
no.
Yes, in theory should try to
at least track spending on
ancillary services, schools
books/teaching and
materials, and
scholarships. Can
distinguish between
spending at school level vs
administrative offices.
Yes, in theory asks for
spending on ancillary
services and schools
books/teaching materials,
and scholarships.
Yes, for example school
cost construction. Can also
distinguish between
spending at school level vs
administrative offices.
Can it produce
data on average
teacher salaries?
Sometimes yes sometimes
no.
No Not part of basic scope but
can be included in analysis
and estimated from
available figures.
Can produce average
compensation by dividing
total exp. on
compensation divided by
no. of teachers. New UIS
survey on teachers asks
more specific data on
teacher salary scales.
Yes, and by teacher status
Does it specify
share of
government
funding for private
schools?
Sometimes yes (mostly in
the analysis) sometimes
no.
Mostly no
Yes
Yes, to the extent
possible
Yes
External resources
Are on-budget
donor identified
separately?
No, with a few exceptions. Sometimes yes sometimes
no.
Yes
Yes, to the extent
possible
Yes, to the extent possible
Are off-budget
donor
contributions
included?
No
No
Yes, to the extent possible Yes, to the extent
possible (few countries
can provide)
Sometimes yes,
sometimes no
If yes, how is the
data presented/
disaggregated?
N/A
Will follow same
classification as gov. exp.
when included in MoF data
Same classification (by
level, economic
transaction, provider etc.)
as other sources
By level of education
(ISCED)
By level of education,
objective, commitment and
disbursement

- 24 -
Criteria Public Expenditure
Review BOOST NEA
UIS-UOE data
collection
Private expenditure
Does it include
household
expenditure on
education?
Sometimes yes sometimes
no.
No Yes Yes, to the extent
possible (few countries
can provide)
Yes, to the extent possible
If yes, how is the
data
presented/disaggr
egated?
It depends (sometimes by
level, type of provider, or
nature, sometimes
aggregate)
N/A Same classification (by level,
nature, provider etc.) as
other sources
By level of education
(ISCED)
By level of education, by
type of expenditure
Does it include
data on spending
by other private
entities (ex.
corporations,
NGOs)
No
No
Yes, to the extent possible Yes, to the extent
possible (few countries
can provide)
No
Other issues of interest
Expenditure per
student
Yes, with a few exceptions Not part of the basic
database, but can be linked
to student data
Yes Not part of the ed. fin.
questionnaire, but data
is linked to data on
students to produce
spending per pupil
indicators.
Yes
Link with learning
outcomes data
Generally no, sometimes
learning outcomes are
mentioned in the analysis
but rarely linked to funding
data.
Not part of the basic
database, but can be linked
to learning outcomes data
It depends, not part of the
basic NEA framework but
can be added as a
dimension if there is data
and interest
No Yes when learning
outcomes data available
and possible to link with
financing (ex. by school or
district)
Disaggregation by
administrative
regions
Sometimes yes sometimes
no.
Generally yes It depends, not part of the
basic NEA framework but
can be added as a
dimension
No Sometimes yes, ex. when
CSR done in context of
decentralisation

- 25 -
Criteria Public Expenditure
Reviews BOOST NEA
UIS-UOE data
collection
Education Country
Status Reports
Usability and comparability of data
How is the data
presented? How
accessible is it?
Various tables in publically
available reports (PDF),
numbers in text, etc. Not in
a database or Excel
format, not standardized
(hard to use and extract)
Excel database (with
PivotTable) publically
available for 17 countries so
far. Format is ‘raw’. For
some countries
dissemination tables and
graphs also included.
National reports, excel
tables, databases, and
data published at
international level through
UIS (not in all cases at this
stage).
Indicators (some
absolute figures)
available in UIS data
centre and various
international publications
and databases.
Various tables in publically
available reports (PDF),
numbers in text, etc. Some
data also available through
Pôle de Dakar database
Can the data be
compared to other
countries? Are
there references
to international
classifications?
Not without some re-
classifications and
estimations. If expenditure
is classified according to
GFS and/or COFOG
comparability will be
greater.
Not without some re-
classifications and
estimations. If expenditure is
classified according to GFS
and/or COFOG comparability
will be greater.
Yes, data based on
standard framework,
classification and
definitions, with some
flexibility for national
realities.
Yes, data published by
UIS based on standard
framework, classification
and definitions.
Not really. Some degree of
comparability between
CSR since they use a
common methodology, but
data not based on
international classifications.
How frequently is
the data
available?
1-4 years between year of
data and publication.
Frequency of updates
varies greatly, but rarely
more frequent than every
4-5 years.
Hard to say when databases
were made available,
probably average 2 years’
time lag. Too early to say
how often can be updated.
Will depend, expect at
least 2 year time-lag for
actual expenditure.
Data updated annually,
on average for half of
countries. Normally
around 2 years lag for
actual expenditure data.
CSR normally done every
3-5 years, time lag of 2-3
years for actual
expenditure data
For how many
countries is there
publically
available data on
total gov. exp. on
education for 2010
or more recent, as
of August 2015?
22 17 (with additional
manipulations needed to
extract education)
N/A
134 8
- 26 -
Annex 2. Comparing education levels classifications in various PER and BOOST
PER BOOST
Philippines Basic education only (elementary + secondary), as a group.
Kiribati No classification by level of education
Tajikistan Pre-primary; general secondary education (which covers primary and secondary); higher education; vocational education; not classified by level.
Kenya General Administration and Planning; Basic Education; Quality Assurance and Standards; Higher Education; Policy and Planning; Technical Education; Not allocated
Kyrgyz Republic
Pre-school; general primary + secondary; vocational primary + secondary; post-secondary + higher; other expenditure.
Moldova Prescolar; primar; secundar; superior; postuniversitar; perfectionare a cadrelor; alte grupl; mediu de specialitate;organe administrative
Indonesia Early Childhood Education; Basic education; Senior secondary education; universities; other programs.
Solomon Islands
Non-formal education; technical and vocational education; secondary; tertiary not defined by level; n.e.c
Republic of Congo
Preschool; Primary; Lower secondary; Upper secondary; TVET; Higher
Togo Technical and vocational education; general business education training research; personal and primary education; general secondary education; technical and vocational secondary education; vocational; higher education; research and innovation; other
Liberia Primar; Secondary; TVET; Higher. Guatemala Educación universitaria o superior; Educación postmedia básica y diversificada no universitaria o superior; Educación n.c.d; Educación preprimaria y primaria; Educación media; Servicios auxiliares de la educación; Educación no atribuible a ningún nivel escolarizado;- Investigación y desarrollo relacionados con la educación
Albania Basic education (including pre-primary); General upper secondary; Vocational and technical upper secondary; Higher education; administration and management.
Mexico Educación Básica; Educación Media Superior; Educación Superior; Posgrado; Educación para Adultos; Cultura; Deporte; Apoyo en Servicios Educativos Concurrentes; Otros Servicios Educativos y Actividades Inherentes
Bangladesh Primary; Secondary; Higher secondary; Technical and vocational; Tertiary; Other.
Paraguay Elementary education; Secondary and technical education; Education and culture (n.e.c.);statistical services
Peru No classification by level of education