information, institutions, and banking sector development in west africa
TRANSCRIPT

INFORMATION, INSTITUTIONS, AND BANKING SECTOR DEVELOPMENTIN WEST AFRICA
PANICOS DEMETRIADES and DAVID FIELDING*
Using a new West African panel data set, we provide evidence on the determinantsof individual banks’ loans and assets in some of the poorest countries in the world.Higher loan default rates reduce both the loans to assets ratio and the volume of assets.However, the size of these effects is sensitive to bank age and ownership structure.Younger, private, domestically owned banks are most affected, suggesting that suchbanks face the most severe informational disadvantages. Very old government-ownedbanks benefit from high default rates. We also explore how the quality of governanceimpacts on loans and assets. (JEL G21, O16)
I. INTRODUCTION
Banks and other financial intermediaries canperform an important developmental function,especially in Africa, where alternative sourcesof finance are limited or nonexistent. By pro-viding firms with essential finance, they helpthem to take advantage of productive invest-ment opportunities which may not otherwisematerialize. By screening loan applicants, theycan help to address adverse selection in thecredit market and channel funds toward pro-ductive uses. By monitoring borrowers, theycan contain moral hazard behavior, for example,excessively risky investment activity that couldundermine a borrower’s ability to repay a loan.Through long-term bank-borrower relationships,well-established banks can address both adverseselection and moral hazard. This not only helpsbanks to remain solvent but also ensures thatbank finance is channeled toward productive andsound investments.
There is a large body of empirical evidencewhich suggests that the development of bankingsystems goes hand in hand with economic devel-opment (see, e.g., Levine 2004). Although theevidence on causality is mixed (see, e.g., Deme-triades and Hussein 1996), there is broad con-sensus that well-functioning banking systems
*We would like to thank Chris Haig for her outstandingassistance with this article.Demetriades: Department of Economics, University of
Leicester, University Road, Leicester LE1 7RH, U.K.Phone +44 116 252 2835, E-mail [email protected]
Fielding: Department of Economics, University of Otago,P.O. Box 56, Dunedin 9054, New Zealand. Phone +643479 8653, Fax +64 3479 8174, E-mail [email protected]
promote economic growth (Demetriades andAndrianova 2005). It is, therefore, a puzzle thatso many countries remain financially under-developed. This is particularly true of Sub-Saharan Africa, which remains one of themost financially under-developed regions in theworld. A recent study by the World Bank hasshown that African banking systems lack depthcompared to other regions in the world, butare also excessively liquid (Honohan and Beck2007). According to the World Bank, banksthemselves complain that there is a lack ofcreditworthy borrowers, while at the same timehouseholds and firms find finance to be a majorconstraint. The evidence presented by the WorldBank also suggests that the least developedbanking systems are also the most liquid, sug-gesting that excess liquidity is a common featureof financial under-development.
This article aims to shed light on these fea-tures of financial under-development in Africa,utilizing a panel data set comprising the banksoperating in the West African Economic andMonetary Union (UEMOA) during 2000–2005.The UEMOA provides a uniform financial sys-tem across eight countries; the structure of thissystem has changed little in the last 15 years.Therefore, we can be sure that the variations inbank behavior we observe within the UEMOA
ABBREVIATIONSCEMAC: Economic and Monetary Community of
Central AfricaUEMOA: West African Economic and Monetary Union
1
Economic Inquiry(ISSN 0095-2583)
doi:10.1111/j.1465-7295.2011.00376.x© 2011 Western Economic Association International
2 ECONOMIC INQUIRY
are not because of variations in the nature ofpublic financial institutions which the banksface. This makes feasible the identification ofthe institutional sources of the variations inbank behavior, which are not correlated withvariations in the quality of public financialinstitutions.
Our data set includes balance sheet informa-tion on each bank in the UEMOA, includingbank characteristics such as age and ownershiptype, profitability, and the number of urban andrural branches. We also utilize country-level dataon loan defaults, which provides information onthe average quality of borrowers; we use thisas a proxy for the severity of information prob-lems faced by banks in the credit market. Wecombine this information with macroeconomicdata including institutional quality indices con-structed by the World Bank. Our data set enablesus to examine the extent to which informa-tional and institutional factors, and interactionsbetween different factors, can explain a bank’sloans to assets ratio, which is an inverse mea-sure of bank liquidity. Our data set is also usedto examine the microeconomic and macroe-conomic determinants of the total volume ofassets of an individual bank, which is a goodmicro-level indicator of overall banking sectordevelopment.
Our results suggest that to a large extentfinancial under development, including excessliquidity and low banking sector development,can be attributed to severe informational prob-lems. These problems are particularly acute foryounger banks; older, more established banksare less affected. These results highlight theimportance of information capital in both devel-oping banking systems and reducing excess liq-uidity. Our results suggest that it is not so muchthe lack of creditworthy borrowers that is theobstacle for financial development, but the lackof a developed infrastructure that would enablenew banks to screen and monitor borrowers.This result is consistent with evidence on theimportance of credit registries in reducing creditconstraints (Galindo and Miller 2001). Ourresults also indicate that banking sector devel-opment in Africa does indeed follow economicdevelopment, but that it is also particularly sen-sitive to political stability and the rule of law.
This article is structured as follows. SectionII reviews the institutional setting within whichcommercial banks in the UEMOA operate, andprovides the conceptual background for ouranalysis. Section III describes the data and
modeling strategy. Section IV presents anddiscusses the empirical findings. Section V sum-marizes and concludes.
II. COMMERCIAL BANKING IN THE UEMOA
The UEMOA is a monetary union arisingfrom the final phase of French colonialismin West Africa (1948–1962), and encompassesmost of France’s former colonies in the area.The current member states are Benin, BurkinaFaso, Cote d’Ivoire, Guinea-Bissau, Mali, Niger,Senegal, and Togo. It forms part of the FrancZone, the other main component of which is asecond monetary union, the Economic and Mon-etary Community of Central Africa (CEMAC).Both monetary unions have a central bank issu-ing a currency that the French Treasury guaran-tees to exchange for Euros at a fixed rate. Thetwo currencies are both called the CFA Franc,1
but they are entirely separate. The arrangementsthat the two monetary unions have with theFrench Treasury are parallel but entirely inde-pendent of each other.
The enduring institutional link with the for-mer colonial power gives the UEMOA countriesan unusually high level of financial stabil-ity, compared to other African countries withsimilar levels of economic development. Theinstitutional framework is defined by a con-stitutional accord dating from the period inwhich the colonies became fully independent(1960–1962), and preserving many of the fea-tures of the financial system of post-war Frenchcolonial Africa. The main features are as fol-lows:
(i) Guaranteed convertibility. Article 1 ofthe accord stipulates that France will helpUEMOA member states to ensure the free con-vertibility of their currency. In practice, thismeans that the French Treasury will exchangeCFA Francs for Euros on demand. Lendingby the BCEAO (the UEMOA central bank) todomestic governments and to the private sec-tor is now limited by rules designed to preventfree-riding on the French guarantee.
(ii) A fixed exchange rate. Up until 1994,Article 2 of the accord stipulated a fixed rate of50 CFA Francs to one French Franc. The rate hasbeen changed only once, to 100:1, in January
1. CFA originally stood for Colonies Francaises enAfrique. It now stands for Communaute Financiere Africaine(for the UEMOA currency) and Cooperation Financiere enAfrique (for the CEMAC currency).

DEMETRIADES & FIELDING: BANKING SECTOR DEVELOPMENT 3
1994. The entry of France into the EuropeanMonetary Union means that the rate is nowdefined in terms of Euros, but the current Eurorate is equivalent to 100:1 against the FrenchFranc.
(iii) Free transferability. Article 6 of theaccord describes the “freedom of financial rela-tions between France and members of theUnion.” This obligation on the part of theAfrican states is not without qualification, andthe practice of member states has not alwaysbeen in harmony with the principle. Internationalcapital transfers are taxed, and occasionally(especially during the run-up to the deval-uation in 1993) the transferability has beensuspended. Nevertheless, there is usually a rea-sonable degree of capital mobility between theUEMOA and France.
(iv) Harmonization of rules governing cur-rency exchange. Article 6 of the accord notesthat the “uniform regulation of the externalfinancial relations of member states . . . will bemaintained in harmony with that of the FrenchRepublic.” These regulations cover such thingsas the remittance of salaries abroad (that is, out-side the Franc Zone), foreign investment, andborrowing from abroad.
(v) A common regulatory framework. Reg-ulation of the banking system is the respon-sibility of the UEMOA Banking Commission,which was created in 1990 with French techni-cal support. The commission has oversight overthe day-to-day activities of all banks and otherfinancial institutions in the UEMOA, and hasthe power to intervene in the operations of indi-vidual banks when its rules are infringed. Inthe case of serious infractions, the commissioncan impose disciplinary sanctions of differingdegrees of severity, ranging from a formal warn-ing to the dismissal of senior bank officials andsuspension of a bank’s activities. Commissionstaff produce regular reports on the extent ofcompliance with UEMOA banking regulations;the loan default data used in this article aretaken from statistics compiled by the BankingCommission.
The financial stability provided by these insti-tutions means that commercial banks in theUEMOA are free from some of the uncertain-ties facing financial institutions in other parts ofAfrica; the same is true of depositors. However,other risks remain. Firstly, many banks face aserious adverse selection problem arising froma low average level of borrowers’ creditworthi-ness. In our sample, the average rate of default
on bank loans exceeds 10%, which is very highby international standards. In theory, this shoulddepress the equilibrium volume of loans (Stiglitzand Weiss 1981, 1983), particularly in marketswhere credit bureaus are in their infancy likein most of Africa. Existing evidence indicatesthat the magnitude of the problem varies con-siderably across countries and over time (e.g.,Fuentes and Maquieira 2001; Koopman, Lucas,and Klaassen 2005). In our own sample, thedefault rate sometimes dips below 5%, whileit occasionally exceeds 30%. Secondly, corrup-tion could make loans less profitable, if it meansthat banks are forced to ignore the commercialworth and riskiness of projects they finance forthe political elite. Direct evidence of such cor-ruption in Kenya is discussed by Bigsten andMoene (1996), and evidence for a link betweenthe corruption of bank officials and the pro-ductivity of investments is discussed by Beck,Demirguc-Kunt, and Maksimovic (2005). Suchcorruption may reduce the loans-assets ratio, andmay also depress asset and liability growth.
Moreover, the quality of contract enforce-ment and overall political stability in the coun-try could affect the extent of moral hazard thatbanks face when making loans. Institutions pro-moting the rule of law are likely to enhancebanks’ ability to enforce loan contracts and maytherefore increase a bank’s willingness to lendand its ability to grow (Messick 1999), even atlow levels of average borrower quality. Theseinstitutions could act as a deterrent to moralhazard behavior by borrowers, helping to limitthe number as well as the cost of bad loans.Governments of some UEMOA countries haveenacted legislation to facilitate the recovery ofbad debts of individual banks (e.g., the Banquede l’Habitat du Mali); however, such support forbanks is by no means universal.
These factors must be interpreted bearing inmind that many of the banks in our sample arevery young. For 25% of our observations, theage of the bank is 7 years or less. For veryyoung banks, raising deposits is likely to beeasier than identifying creditworthy borrowers.Older banks are likely to have more informationcapital so that their ability to screen loan appli-cants is likely to be better than that of youngerbanks. The adverse selection problem is likelyto be more acute for younger banks, at anygiven average quality of borrowers. Very youngbanks may therefore opt to channel most of theirresources into building up their deposit base,while their liabilities might in the first instance

4 ECONOMIC INQUIRY
be transformed into foreign assets or claims ongovernment and other domestic financial institu-tions rather than into business loans. Therefore,we expect that very young banks will have alower loans-assets ratio than older, more estab-lished banks, ceteris paribus. We might alsoexpect younger banks to exhibit more sensitivityto borrowers’ propensity to default than olderbanks: a higher national default rate imposesmore of a cost for younger banks who find itmore difficult to screen customers.
Age is not the only factor that might affectbanks’ sensitivity to the propensity to default.Banks owned (or partly owned) by the gov-ernment might have access to better ways toscreen potential customers, as might foreign-owned banks. Banks that are operating inten-sively in provincial areas outside the financialcapital of the country, where infrastructure of allkinds is likely to be weaker, may find customersmore difficult to screen effectively. It is also pos-sible that some of the idiosyncratic variation inscreening efficiency is correlated with observ-able bank characteristics, such as profitability.
Higher levels of risk are one explanation fora relatively low ratio of loans to assets in Africa,and risk represents one channel through whichcorruption, rule of law, and political stabilitycould affect banking performance. Of course,it is not the only channel. For example, Barth,Caprio, and Levine (2004) indicate that thereis a positive association between a high levelof government corruption and the existence ofexcessively strong supervisory agencies, severerestrictions on bank activities and barriers toentry that limit banking competition. However,all of these effects reinforce the mechanisms wehave already described, either by reducing theprofitability of loans or by creating a monopo-listic incentive for banks to limit the quantity ofloans in order to increase profits.
All of these factors are relevant to mostAfrican countries. However, in most Africancountries they are correlated with financial ormonetary stability, and are therefore difficultto identify precisely. This is less of a prob-lem in our sample as we restrict our attentionto banks in the member states of the UEMOAin the period 2000–2005, where the quality ofthe financial system is uniform over time: therehas been no major revision of UEMOA legis-lation in this period. It is also uniform acrosscountries: there is a single authority—the Bank-ing Commission—responsible for regulating allbanks in the monetary union. We can therefore
be confident that the effects we identify are notbecause of variations in financial or monetarystability but due to variations in the quality ofgovernance.
III. DATA AND METHODOLOGY
A. Data
The loans and assets data used in our econo-metric model are taken from the annual BCEAOpublication Bilans des Banques et Etablisse-ments Financiers.2 These data are used to con-struct two dependent variables for bank i in yeart : the loans-assets ratio (RATIOit ) and the log-arithm of real assets (ASSETSit ). Annual dataare available for 113 banks in the UEMOAover the period 2000–2005: 15 in Benin, 14 inBurkina Faso, 27 in Cote d’Ivoire, 2 in Guinea-Bissau, 16 in Mali, 11 in Niger, 17 in Senegal,and 11 in Togo. This is not a balanced panel,because some banks came into existence dur-ing the sample period; with lags and differenc-ing, 87 banks remain in the sample. RATIOitis constructed as the ratio of commercial loans(“creances sur la clientele”) to total assets (“totalde l’actif”). ln(ASSETSit ) is constructed as thelog of total assets deflated by the consumerprice index reported in the BCEAO AnnuaireStatistique.
The econometric model also incorporates anumber of explanatory variables, as follows.The countrywide default rate facing a bankin country j in year t (DEFAULTjt ) is theratio of the total bad debt of all commercialbanks in the country to the total commerciallending of those banks. The figures for baddebt (“credits en souffrance”) are taken fromthe UEMOA Banking Commission’s RapportAnnuel. Data on the fraction of bank capitalowned by the government (GOVERNMENTit )and foreigners (FOREIGNit ), and on the num-ber of years each bank has been in opera-tion by year t (AGEit ), are taken from theBCEAO publication Annuaire des Banques etEtablissements Financiers de l’UEMOA, as aredata on the number of branches outside the
2. All publications mentioned in this section are avail-able online at www.bceao.int. Other international studiesof banking sector performance use data sources differentfrom ours, for example the Doing Business indicators of theWorld Bank or the data set of Barth, Caprio, and Levine(2001). However, for our countries the Doing Business dataare available in 2004 at the earliest, and in some cases notuntil 2008; the Barth, Caprio, and Levine (2001) data setdoes not contain any francophone developing countries.

DEMETRIADES & FIELDING: BANKING SECTOR DEVELOPMENT 5
TABLE 1Descriptive Statistics
Obs. Mean SD Min. Max.
(i) Univariate statisticsRATIO 482 0.567 0.199 0.00 0.96ln(ASSETS) 487 5.515 1.577 1.43 8.37AGE 588 17.306 16.075 0.00 106.00PROFITABILITY 392 0.076 0.103 0.00 0.59DEFAULT 588 0.143 0.085 0.05 0.42GOVERNMENT 582 0.159 0.250 0.00 1.00FOREIGN 582 0.544 0.360 0.00 1.00PROVINCIAL 522 3.736 6.355 0.00 35.00VOICE & ACCOUNTABILITY 588 −0.447 0.654 −1.54 0.41POLITICAL STABILITY 588 −0.448 0.821 −2.45 0.71GOVERNMENT
EFFECTIVENESS588 −0.678 0.401 −1.44 0.04
REGUALTORY QUALITY 588 −0.444 0.245 −1.00 −0.06RULE OF LAW 588 −0.669 0.436 −1.57 −0.04CONTROL OF CORRUPTION 588 −0.565 0.369 −1.24 0.12
VOICE & ACC-OUNTABILITY
POLITICALSTABILITY
GOVERNMENTEFFECTIVENESS
REGUALTORYQUALITY
RULE OFLAW
(ii) Weighted Correlation Coefficients for the Governance Variables (with Weights for the Number of Banks in Each Country)POLITICAL STABILITY 0.80GOVERNMENT
EFFECTIVENESS0.81 0.56
REGUALTORY QUALITY 0.65 0.57 0.76RULE OF LAW 0.88 0.83 0.84 0.73CONTROL OF CORRUPTION 0.47 0.49 0.63 0.79 0.68
financial capital (PROVINCIALit ). Data onbank profitability (PROFITABILITYit ), mea-sured as the ratio of profits to turnover, are takenfrom the Bilans des Banques et EtablissementsFinanciers.3
Data on the log of total real GDP in thecountry in which a bank is operating (GDPjt )are taken from the Annuaire Statistique; this islikely to be a correlate of the total asset volumeof the banks of the country, because higherincome will induce higher asset demand.
In order to capture the effects of varia-tion in country-specific institutions that mayimpact on contract enforcement relevant forlending, we make use of the indicators reportedin the World Bank World Governance Indica-tors. These indicators are described and dis-cussed by Kaufmann, Kraay, and Mastruzzi(2007). Our measure of the extent to whicha country is corruption-free is the “control ofcorruption” index in World Governance Indi-cators. There are several different governance
3. It makes very little difference to the results if profitsare measured as a fraction of total bank assets.
indicators that may be associated with easeof contract enforcement: “rule of law,” “voiceand accountability,” “political stability,” “gov-ernment effectiveness,” and “regulatory qual-ity.” These indicators are quite highly correlatedwith each other, so it does not make sense toinclude them all in a single regression equation.However, there are no strong a priori groundsfor supposing that one particular indicator is anespecially good measure of the extent to whichbanks are protected from moral hazard effects.The methodology section that follows explainshow we deal with the multicollinearity of thegovernance indicators.
Descriptive statistics for the variables inour model are presented in Table 1, whileFigures 1–3 depict some of our key variables.Note that the governance variables are nor-malized, so that the mean of each is equalto zero across a worldwide sample. Negativemeans in our sample indicate that the UEMOAcountries perform below the worldwide averagein terms of governance, despite their financialstability.
6 ECONOMIC INQUIRY
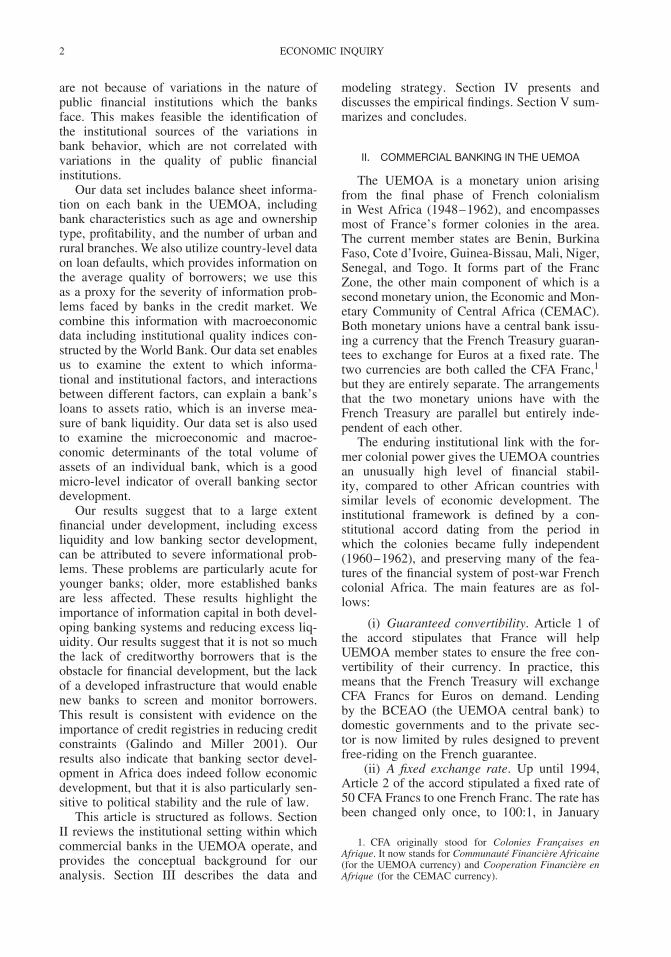
FIGURE 1Distribution of RATIO
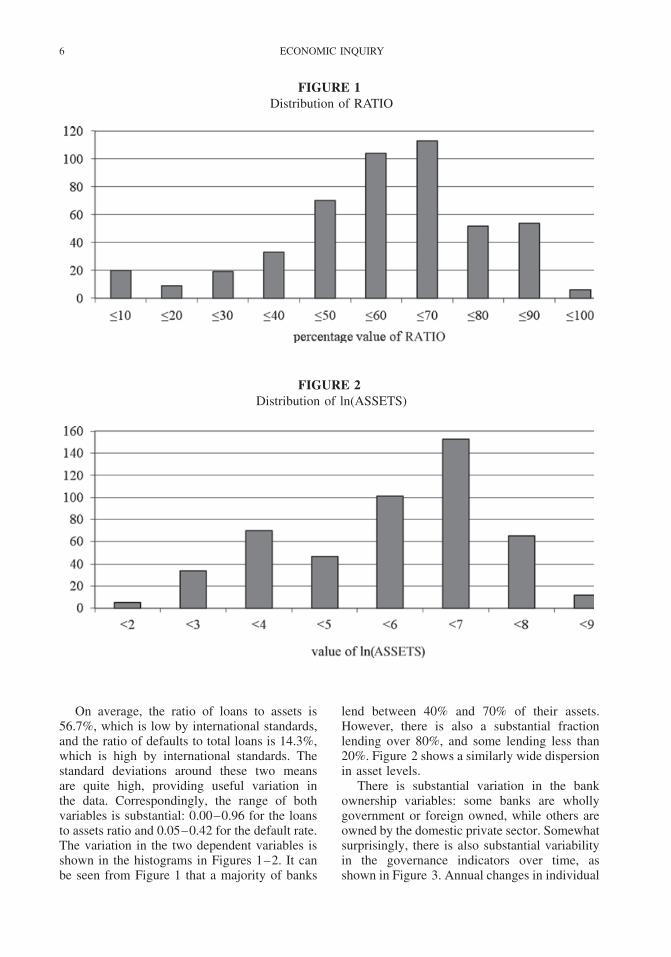
FIGURE 2Distribution of ln(ASSETS)
On average, the ratio of loans to assets is56.7%, which is low by international standards,and the ratio of defaults to total loans is 14.3%,which is high by international standards. Thestandard deviations around these two meansare quite high, providing useful variation inthe data. Correspondingly, the range of bothvariables is substantial: 0.00–0.96 for the loansto assets ratio and 0.05–0.42 for the default rate.The variation in the two dependent variables isshown in the histograms in Figures 1–2. It canbe seen from Figure 1 that a majority of banks
lend between 40% and 70% of their assets.However, there is also a substantial fractionlending over 80%, and some lending less than20%. Figure 2 shows a similarly wide dispersionin asset levels.
There is substantial variation in the bankownership variables: some banks are whollygovernment or foreign owned, while others areowned by the domestic private sector. Somewhatsurprisingly, there is also substantial variabilityin the governance indicators over time, asshown in Figure 3. Annual changes in individual

DEMETRIADES & FIELDING: BANKING SECTOR DEVELOPMENT 7
FIGURE 3Annual Changes in Governance Variables
Notes: Voice & accountability ( ); political stability ( ); government effectiveness ( ); regulatory quality ( ); rule oflaw ( ); control of corruption ( ).
governance variables are often a large fraction ofone unit (the worldwide variance in each of thevariables). Political stability is the most variablegovernance indicator, but annual changes in theothers are not always trivially small.
B. Methodology
The discussion in Section II suggests thatbanks’ willingness to lend depends on aggregate
credit market conditions, particularly borrowercreditworthiness and the quality of contractenforcement, and on individual bank character-istics that capture a bank’s informational cap-ital, such as bank age and the location of itsbranches. We conjecture that the loans-assetsratio (RATIO) is decreasing in the loan defaultrate in a country (DEFAULT), and increas-ing in the quality of governance (as captured

8 ECONOMIC INQUIRY
by the governance indicators), bank profitabil-ity (PROFITABILITY), and bank age (AGE).Age and other bank characteristics (GOVERN-MENT; FOREIGN; PROVINCIAL) may alsoaffect the impact of borrower creditworthiness,so various interaction terms in DEFAULT areincluded in our RATIO regression equation.Because we are using panel data, we also allowfor both fixed and time effects as well aspersistence in the dependent variable. Given thatthe governance indicators are quite highly cor-related with each other (see Table 1), we avoidfitting a model with more than one such indica-tor. Because we have no strong a priori view onwhich of these indicators best captures the con-tract enforcement effect, we report results withall six indicators entered one at a time in themodel. Thus, our model for the loan to assetsratio is as follows:
RATIOit = αt + βi + ρ · RATIOit−1
(1)
+ γ · AGEit + δ · PROFITABILITYit
+ φ · GOVERNANCEjt + [η0 + η1 · AGEit
+ η2 · GOVERNMENTit + η3 · FOREIGNit
+ η4 · PROVINCIALit ] · DEFAULTjt + uit
Here, i ∈ j indicates the ith bank in the j thcountry, and t indicates the year. The α and βparameters capture time and bank fixed effects,and u is a regression residual.4 GOVERNANCEis measured by one of the six governanceindicators. Note that GOVERNMENT, FOR-EIGN, and PROVINCIAL appear only in inter-action terms, not as linearly separable effects.This is because in our sample they do not exhibitany substantial variation over time, and so arecollinear with the bank fixed effects.5
Our second model is designed to explainvariations in the logarithm of real assets. Ourmodeling strategy is similar to the one above,but the assets model contains one additionaleffect: we control for the size of the economy
4. There will be some heterogeneity in the performanceof banks that is difficult to measure or observe. Some bankslend almost exclusively to firms in a specific sector; forexample, a number of agricultural banks in the Saheliancountries are highly exposed to the cotton-producing sector.
5. When an interaction term in DEFAULT and PROF-ITABILITY is included, the effect is statistically insignif-icant. Similarly, it was not possible to find any robustsignificant interaction effects in GOVERNANCE. We alsotested the sensitivity of RATIO to bank size by includingln(ASSETS) in Equation (1) as an endogenous regressor;the effect of ln(ASSETS) is statistically insignificant.
in which a bank is operating, as measured byln(GDP). However, interaction terms in GOV-ERNMENT, FOREIGN, and PROVINCIALare never statistically significant in the assetsregressions, and are excluded from the modelsreported below; the same is true of PROF-ITABILITY. Our assets regressions take the fol-lowing form:
ln(ASSETS)it = αt + βi + ρ · ln(ASSETS)it−1
(2)
+ γ · AGEit + φ · GOVERNANCEjt
+ ζ · ln(GDPjt ) + [η0 + η1 · AGEit ]
· DEFAULTjt + uit
In estimating the parameters in a dynamicpanel model such as Equation (1) or (2), weneed to allow for the fact that the lagged depen-dent variable—RATIOit−1 or ln(ASSETS)it−1 —will be correlated with the error term uit . More-over, DEFAULTjt and PROFITABILITYit mayalso be endogenous and correlated with uit .OLS estimates of the parameters will thereforebe biased. Arellano and Bond (1991) proposea GMM estimator that takes into account theendogeneity of the lagged dependent variable.Firstly, we can take differences of Equation(1) to account for country fixed effects:
�RATIOit = �αt + ρ · �RATIOit−1
(3)
+ γ · �AGEit + δ · �PROFITABILITYit
+ φ · �GOVERNANCEjt + η0
· �DEFAULTjt + η1 · �[AGEit
· DEFAULTjt ] + η2 · �[GOVERNMENTit
· DEFAULTjt ] + η3 · �[FOREIGNit
· DEFAULTjt ] + η4 · �[PROVINCIALit
· DEFAULTjt ] + �uit
The same can be done with Equation (2).For any bank i and any year t , RATIOit−2will be a valid instrument for �RATIOit−1,because as long as uit is serially uncorrelated,RATIOit−2 will be orthogonal to �uit . In fact,all the other lags back to RATIOi2000 will beorthogonal to �uit , which gives us a wholeset of moment conditions with which to iden-tify the parameter ρ : RATIOi2000 is orthogo-nal to �ui2002, RATIOi2000 and RATIOi2001 are

DEMETRIADES & FIELDING: BANKING SECTOR DEVELOPMENT 9
orthogonal to �ui2003, and so on.6 FollowingBlundell and Bond (1998), we can take theGMM approach a step further: because RATIOitis stationary, we can treat Equations (1) and(3) as a system and make use of the orthogo-nality of uit to �RATIOit−2, and to other lagsback to �RATIOi2000, to help identify ρ.
We still need to identify the δ and ηparameters in our model, bearing in mind thepotential endogeneity of PROFITABILITYit andDEFAULTjt . In the results reported below, iden-tification is achieved by using moment con-ditions analogous to those used to identify ρ,rather than by fitting separate equations forPROFITABILITYit and DEFAULTjt using someset of instrumental variables. We impose therestriction that lags of PROFITABILITYit andDEFAULTjt (including the interaction terms) areorthogonal to �uit , and that lags of �PROFIT-ABILITYit and �DEFAULTjt are orthogonal touit . In the Appendix, we explore the conse-quences of identifying the parameters by usingstandard instrumental variables. This alternativestrategy produces results that are qualitativelyvery similar to the ones that we now discuss.
IV. EMPIRICAL RESULTS
Tables 2 and 3 contain the main empiricalresults of this article: Table 2 reports the resultsof fitting Equation (1) to our data and Table 3reports the results of fitting Equation (2).
The diagnostic statistics in Table 2 provideevidence of the appropriateness of the estimatorand the validity of the instruments used. TheSargan test does not reject the over-identificationrestrictions. The residual autocorrelation testsreject the null of no first order serial correlationbut do not reject the null of no second orderserial correlation, confirming that the residualseries prior to differencing are white noiseprocesses.
In Table 2, the lagged dependent variableis positive and highly significant, suggesting
6. After taking lags and differences, our sample com-prises 4 years. If for every t we use all lags back toRATIOi2000 as instruments for �RATIOit−1 then we havedozens of moment conditions, and there is a risk of generat-ing spurious results as our degrees of freedom diminish. Inthe main results reported in the article, we use only momentconditions involving RATIOit−2. However, increasing thenumber of conditions does not make an enormous differ-ence to our results. For the model of ln(ASSETS), in whichthere are fewer regressors and more degrees of freedom, weuse lags up to t − 3.
considerable persistence and underlining theappropriateness of a dynamic panel model. Thecoefficients on the lagged dependent variable (inthe range 0.7–0.75) indicate that the half-life ofa temporary shock to the loans to assets ratio isabout 2 years. When the following paragraphsmention coefficient magnitudes, these indicatethe immediate impact of each explanatory vari-able. With a lagged dependent variable coeffi-cient of 0.75, the eventual effect of a permanentchange in an explanatory variable would be fourtimes higher.
There is strong evidence that default ratesrepresent a major obstacle to bank lending inthe UEMOA. Estimates of the η0 coefficientin Equation (1) are negative and significant inall six versions of the model (one for eachgovernance indicator). This coefficient indicatesthe effect of the default rate on the loans toassets ratio of a privately owned bank in itsfirst year of operation with branches only in thefinancial capital of its country. The coefficientis very large: estimates of η0 range from −1.51to −1.22. In our sample, the standard deviationof DEFAULT is 8.5 percentage points, so atwo standard deviation increase in this variableentails a 20–25 percentage point reduction inthe loans to assets ratio. Over the sample period,average default rates range from 8.3 percentagepoints in Burkina to 34.6 percentage points inTogo; using our estimates of η0, this spreadentails a 30–40 percentage point difference inthe average loans to asset ratio. In fact, thedifference between Burkina’s average ratio andTogo’s is only 13 percentage points, because theη0 coefficient does not represent the effect ofDEFAULT on the average bank. The variousinteraction terms in DEFAULT indicate thatthe effects of loan defaults (i) diminish withbank age (ii) increase with the number ofprovincial branches, and (iii) are much smallerfor government-owned or foreign-owned banks.
Because so many of the interaction termsin Table 2 are statistically significant, individ-ual default coefficients are not in themselvesvery meaningful. However, computation of dif-ferent linear combinations of the interactionterms (and of corresponding standard errorsusing the Delta Method) permits the follow-ing observations. Firstly, consider a privatebank with no provincial branches. If the bankis completely new, then the DEFAULT effectis given by the coefficient η0. As the bankages the DEFAULT effect diminishes, and forbanks older than 35–40 years the effect is

10 ECONOMIC INQUIRY
TA
BL
E2
Dyn
amic
Pane
lE
stim
atio
nof
the
Loa
ns-A
sset
sR
atio
(RA
TIO
)of
87W
est
Afr
ican
Ban
ksa
GO
VE
RN
AN
CE
IND
ICA
TO
R
VO
ICE
&A
CC
OU
NT
AB
ILIT
YP
OL
ITIC
AL
STA
BIL
ITY
GO
VE
RN
ME
NT
EF
FE
CT
IVE
NE
SSR
EG
UL
AT
OR
YQ
UA
LIT
YR
UL
EO
FL
AW
CO
NT
RO
LO
FC
OR
RU
PT
ION
RA
TIO
−10.
7259
***
0.71
26**
*0.
7457
***
0.74
28**
*0.
7435
***
0.74
26**
*0.0
576
0.0
479
0.0
525
0.0
493
0.0
508
0.0
520
AG
E−0
.001
4***
−0.0
011*
*−0
.000
9**
−0.0
013*
**−0
.001
1**
−0.0
013*
**0.0
004
0.0
005
0.0
004
0.0
004
0.0
005
0.0
005
GO
VE
RN
AN
CE
0.05
38**
*0.
0356
***
0.08
78**
*0.
0754
*0.
0493
***
0.06
00**
*0.0
117
0.0
080
0.0
178
0.0
397
0.0
133
0.0
166
PRO
FITA
BIL
ITY
0.02
140.
0463
0.06
79*
0.09
42**
0.06
000.
0789
*0.0
436
0.0
416
0.0
396
0.0
393
0.0
411
0.0
409
DE
FAU
LT−1
.507
7***
−1.4
427*
**−1
.217
4***
−1.2
249*
**−1
.343
7***
−1.3
040*
**0.1
587
0.1
542
0.1
522
0.1
467
0.1
523
0.1
505
DE
FAU
LT×
AG
E0.
0308
***
0.02
92**
*0.
0252
***
0.02
70**
*0.
0272
***
0.02
92**
*0.0
049
0.0
047
0.0
050
0.0
046
0.0
051
0.0
051
DE
FAU
LT×
GO
VE
RN
ME
NT
0.59
20**
*0.
4611
***
0.53
08**
*0.
4264
***
0.47
09**
*0.
3952
***
0.1
682
0.1
601
0.1
455
0.1
566
0.1
457
0.1
280
DE
FAU
LT×
FOR
EIG
N0.
5321
***
0.40
85**
*0.
4524
***
0.28
10*
0.36
47**
0.22
240.1
667
0.1
529
0.1
521
0.1
489
0.1
563
0.1
610
DE
FAU
LT×
PRO
VIN
CIA
L−0
.034
0***
−0.0
345*
**−0
.032
8***
−0.0
362*
**−0
.035
7***
−0.0
427*
**0.0
070
0.0
070
0.0
064
0.0
060
0.0
068
0.0
059
Num
ber
ofob
serv
atio
ns30
430
430
430
430
430
4Sa
rgan
test
p-v
alue
0.40
020.
5304
0.45
680.
3219
0.42
630.
5086
Res
idua
lA
R(1
)te
stp
-val
ue0.
0013
0.00
080.
0007
0.00
100.
0010
0.00
06R
esid
ual
AR
(2)
test
p-v
alue
0.87
550.
8589
0.72
960.
5068
0.74
710.
7054
a Stan
dard
erro
rsar
ein
italic
s.E
stim
ates
are
obta
ined
usin
gth
ext
dpd
com
man
din
Stat
a10
.0.
The
regr
essi
onal
soin
clud
estim
efix
edef
fect
s.*S
igni
fican
tat
10%
;**
sign
ifica
ntat
5%;
***s
igni
fican
tat
1%.

DEMETRIADES & FIELDING: BANKING SECTOR DEVELOPMENT 11
TA
BL
E3
Dyn
amic
Pane
lE
stim
atio
nof
the
Log
ofR
eal
Ass
ets
(ln(
ASS
ET
S))
of87
Wes
tA
fric
anB
anks
a
GO
VE
RN
AN
CE
IND
ICA
TO
R
VO
ICE
&A
CC
OU
NT
AB
ILIT
YP
OL
ITIC
AL
STA
BIL
ITY
GO
VE
RN
ME
NT
EF
FE
CT
IVE
NE
SSR
EG
UL
AT
OR
YQ
UA
LIT
YR
UL
EO
FL
AW
CO
NT
RO
LO
FC
OR
RU
PT
ION
ln(A
SSE
TS −
1)
0.86
93**
*0.
8669
***
0.87
73**
*0.
8835
***
0.89
96**
*0.
8895
***
0.0
313
0.0
300
0.0
323
0.0
306
0.0
302
0.0
330
AG
E−0
.010
5***
−0.0
103*
**−0
.008
8***
−0.0
090*
**−0
.008
1***
−0.0
086*
**0.0
012
0.0
011
0.0
010
0.0
010
0.0
010
0.0
010
GO
VE
RN
AN
CE
0.10
38**
*0.
1374
***
0.09
34**
0.10
01**
0.22
08**
*0.
1061
**0.0
337
0.0
199
0.0
425
0.0
472
0.0
387
0.0
486
ln(G
DP)
0.02
950.
0774
**−0
.033
5−0
.011
60.
0262
−0.0
122
0.0
305
0.0
308
0.0
268
0.0
257
0.0
284
0.0
263
DE
FAU
LT−1
.647
2***
−1.9
750*
**−1
.425
7***
−1.2
531*
**−1
.470
8***
−1.2
550*
**0.4
055
0.3
964
0.3
644
0.3
814
0.3
839
0.3
806
DE
FAU
LT×
AG
E0.
0596
***
0.07
23**
*0.
0431
***
0.04
18**
*0.
0466
***
0.03
81**
*0.0
129
0.0
127
0.0
103
0.0
105
0.0
108
0.0
105
Num
ber
ofob
serv
atio
ns38
538
538
538
538
538
5Sa
rgan
test
p-v
alue
0.06
420.
2947
0.07
280.
0493
0.19
230.
0798
Res
idua
lA
R(1
)te
stp
-val
ue0.
0350
0.03
320.
0346
0.03
340.
0440
0.03
18R
esid
ual
AR
(2)
test
p-v
alue
0.84
070.
8438
0.77
210.
7654
0.81
690.
7977
a Stan
dard
erro
rsar
ein
italic
s.E
stim
ates
are
obta
ined
usin
gth
ext
dpd
com
man
din
Stat
a10
.0.
The
regr
essi
onal
soin
clud
estim
efix
edef
fect
s.**
Sign
ifica
ntat
5%;
***s
igni
fican
tat
1%.

12 ECONOMIC INQUIRY
insignificantly different from zero. Now con-sider a bank with 35 provincial branches (themaximum observed in the sample). For a com-pletely new bank, the DEFAULT effect isapproximately twice as large as for a bank withno provincial branches, and although age dimin-ishes the effect, it is still statistically significantat age 50. At this age, the DEFAULT effect isroughly the same as for a completely new bankwith no provincial branches, that is, η0.
Now consider a bank that is partly govern-ment or foreign owned. Because the GOVERN-MENT and FOREIGN interaction terms havepositive coefficients, the DEFAULT effect fora young bank with some government or for-eign ownership is smaller, although still signifi-cantly negative. However, the effect is positivefor very old banks with a very high share ofgovernment or foreign ownership. For a bankowned completely by the government, or fora bank with at least a 70% foreign owner-ship share, the DEFAULT effect is significantlygreater than zero at age 50. In other words, theremay be some banks which increase their loansto assets ratio in the presence of high defaultrates, although most do not. A riskier environ-ment deters most banks from lending a largeshare of their assets to domestic customers, butthere are a few banks—perhaps the ones withmost informational capital—which partially fillthe resulting vacuum in the market.
As anticipated, all of the governance indica-tors have a positive and highly significant effect.The coefficients range from 0.04 (political sta-bility) to 0.09 (government effectiveness). Thatis, a unit increase in the indicator is associatedwith an increase in the loans to assets ratio ofbetween 4 and 9 percentage points. One unit cor-responds to one standard deviation in the world-wide sample, although the standard deviationsin our sample are a little smaller. At the meansample value of the default rate (14 percent-age points), a one standard deviation increase inthe governance indicator has roughly the sameeffect on the loans to assets ratio as transferringthe bank from private control to government orforeign control.
The impact of age on the loans to assets ratiodepends on the value of DEFAULT. At the min-imum sample default rate (5%), the derivativeof the ratio with respect to age is insignifi-cantly different from zero; at the maximum sam-ple value of DEFAULT (42%), the derivativeis slightly below 0.01, and significantly greaterthan zero. Age matters only when default rates
are high. At the highest default rates, one extrayear of bank life is associated with a loans toassets ratio that is just under 1 percentage pointhigher.
When we use government effectiveness orcontrol of corruption to measure governance, theprofitability coefficient is significantly greaterthan zero at the 10% level, and using regulatoryquality instead increases the significance levelto 5%. Otherwise, the effect of profitability isinsignificantly different from zero, so we haveno robust evidence that more profitable bankstend to lend more to domestic customers, ceterisparibus.7
Table 3 presents results for the models of thetotal real volume of assets. In this case, the Sar-gan test rejects the overidentification restrictionsat the 5% level in one model (the one usingregulatory quality); it also rejects the restric-tions at the 10% level in three other models.Relaxing some of the orthogonality conditionsused to identify the model reduces these sig-nificance levels, but also reduces the precisionof our estimates somewhat. The most reliableresults are the ones using political stability orrule of law to measure governance, for which theSargan test statistics are insignificant at the 10%level. The residual autocorrelation tests are uni-formly satisfactory, indicating first-order but notsecond-order serial correlation in all six cases.Again, the lagged dependent variable is posi-tive and highly significant, and takes a value ofjust less than 0.9 (implying a half-life of around5 years). Therefore, if there were any permanentchange in an explanatory variable, the even-tual impact on asset volumes would be an orderof magnitude greater than the immediate effectindicated below.
Table 3 provides additional evidence thathigh loan defaults are a major obstacle tofinancial development in the region. It showsthat a higher default rate is associated with asignificantly lower level of total assets. Thismeans that the impact of default on the totalvolume of loans is even larger than what issuggested by Table 2. The coefficient on thedefault rate in Table 3 is negative and highlysignificant, ranging from −1.25 to −1.98. Onceagain, the negative effect of loan defaults ismitigated by bank age. The model that usespolitical stability to measure governance impliesthat although a 1 percentage point increase in
7. All of our other results are qualitatively similar if theprofitability coefficient is set to zero.

DEMETRIADES & FIELDING: BANKING SECTOR DEVELOPMENT 13
the default rate reduces the loan volume of avery young bank by nearly 2%, it increases theloan volume of a 50-year old bank by over1%. Both effects are statistically significant. Thetipping point is at about 35 years of age. Again,some of the reduction in the asset volumes ofyounger banks is offset by the expansion ofolder banks, which raise not only their loans toassets ratio, but also their total asset base.
All the governance indicators have a positiveand significant effect on total asset volumes. Thecoefficient itself ranges from 0.10 (regulatoryquality) to 0.22 (rule of law).
There is only one model in which GDPper capita is statistically significant, namely themodel with political stability, in which casethe coefficient is positive, as anticipated; theelasticity is just under 0.08.
V. CONCLUDING REMARKS
Our results suggest that a major factorexplaining why most banks in Africa chooseto remain excessively liquid is a high defaultrate among borrowers. The same factor appearsto be a serious obstacle to the growth of bankbalance sheets. Our results also suggest thatolder government-owned and foreign banks suf-fer less from this problem; this is consistentwith an information capital story in which bankswithout sufficient information capital are unwill-ing to lend and unable to grow their assets.Young, privately owned banks suffer the most.It is therefore unrealistic, in current circum-stances, to expect much financial developmentto come from the emergence and growth of newbanks. Such banks will have little or no infor-mation capital, unless there is more effort toestablish credit bureaus and other mechanismsthat improve information on prospective bor-rowers (IMF 2001; Sacerdoti 2005). Given thathigh default rates and limited public informa-tion about borrowers serve to bolster the marketshare of the oldest government-owned and for-eign banks, the political will to engage in suchreform may well be lacking.
Our findings also suggest that good gover-nance, however measured, has a uniformly pos-itive on both banks’ willingness to lend and theirability to grow their balance sheets. While allaspects of governance are important, govern-ment effectiveness appears to have the largesteconomic impact on the loans to assets ratio,closely followed by control of corruption. Ruleof Law, on the other hand, appears to have by
far the largest impact on the volume of bankbusiness.
Our results relate to a region of Africa acrosswhich there is a high degree of homogeneity infinancial and monetary systems. This makes itrelatively straightforward to identify the impactof variations in governance and default rates onbank behavior. Future research might examinethe extent to which these results are more widelyapplicable in the rest of Africa, and also inother developing regions where default rates arehigh. However, such research will need to dealwith the challenge of identifying the effects ofgovernance and credit risk when there is alsosubstantial variation in financial and monetarysystems.
APPENDIX
In the model presented in the main text, DEFAULTand PROFITABILITY are potentially endogenous regres-sors; their effect on RATIO, as presented in Table 2, isidentified using moment conditions of the kind outlined byBlundell and Bond (1998). In this appendix, we present somealternative results in which the set of identifying restrictionsis supplemented by modeling DEFAULT and PROFITABIL-ITY as a function of two indicators of macroeconomic con-ditions in each country. These indicators affect the defaultrate and profitability, but are unlikely to have any directimpact on the loans to assets ratio.
The two indicators are a terms of trade index, takenfrom the World Bank World Development Indicators, andthe consumer price inflation rate. The terms of tradeindex (TOTjt ) is measured as the logarithm of the ratioof export prices to import prices. It represents a sourceof exogenous shocks to domestic income: improvementsin the terms of trade may stimulate domestic demand,increasing bank profitability and making defaults less likely.The inflation rate (INFjt ) is measured using the consumerprice index discussed in the main text. Higher inflationreflects a more unstable macroeconomic environment inwhich profitability may be lower and default more likely.Using these instruments, we first fit a regression equationfor DEFAULTjt :
DEFAULTjt = βj + ρ · DEFAULTjt−1(A1)
+ θ · TOTjt + ξ · INFjt + ujt
Here again, the lagged dependent variable is correlatedwith the error, so the parameters in Equation (A1) areestimated using the Blundell-Bond method. The parameterestimates are: ρ = −0.499 (significant at 10%), θ = −0.174(significant at 1%), and ξ = 0.886 (significant at 1%).Default rates do rise significantly when the terms of tradedeteriorate or when inflation rises. We then fit a regressionequation for PROFITABILITYit :
PROFITABILITYit = βj + ρ · PROFITABILITYit−1(A2)
+ θ · TOTjt + ξ · INFjt + ujt
In this case, the parameter estimates are ρ = 0.072, θ =−0.014, and ξ = −0.478. The estimate of θ is insignificantly

14 ECONOMIC INQUIRY
TA
BL
EA
1
Dyn
amic
Pane
lE
stim
atio
nof
the
Loa
ns-A
sset
sR
atio
(RA
TIO
)of
87W
est
Afr
ican
Ban
ksa
with
Supp
lem
enta
ryIn
stru
men
ts
GO
VE
RN
AN
CE
IND
ICA
TO
R
VO
ICE
&A
CC
OU
NT
AB
ILIT
YP
OL
ITIC
AL
STA
BIL
ITY
GO
VE
RN
ME
NT
EF
FE
CT
IVE
NE
SSR
EG
UL
AT
OR
YQ
UA
LIT
YR
UL
EO
FL
AW
CO
NT
RO
LO
FC
OR
RU
PT
ION
RA
TIO
−10.
7114
***
0.70
54**
*0.
7238
***
0.71
75**
*0.
7013
***
0.71
98**
*0.0
536
0.0
448
0.0
510
0.0
487
0.0
483
0.0
514
AG
E−0
.000
9**
−0.0
006
−0.0
003
−0.0
008*
**−0
.000
4−0
.000
60.0
004
0.0
004
0.0
003
0.0
003
0.0
004
0.0
004
GO
VE
RN
AN
CE
0.05
32**
*0.
0276
***
0.08
39**
*0.
0783
**0.
0430
***
0.06
19**
*0.0
115
0.0
079
0.0
177
0.0
399
0.0
138
0.0
164
PRO
FITA
BIL
ITY
0.02
290.
0531
0.07
02*
0.09
23**
0.06
89*
0.07
82**
0.0
407
0.0
392
0.0
364
0.0
371
0.0
382
0.0
383
DE
FAU
LT−1
.320
7***
−1.1
740*
**−1
.016
4***
−1.0
717*
**−1
.024
2***
−1.0
877*
**0.1
409
0.1
318
0.1
274
0.1
344
0.1
264
0.1
242
DE
FAU
LT×
AG
E0.
0241
***
0.02
20**
*0.
0180
***
0.02
14**
*0.
0170
***
0.02
13**
*0.0
039
0.0
036
0.0
036
0.0
038
0.0
038
0.0
037
DE
FAU
LT×
GO
VE
RN
ME
NT
0.63
67**
*0.
4280
***
0.56
92**
*0.
4551
***
0.48
79**
*0.
4088
***
0.1
741
0.1
654
0.1
548
0.1
650
0.1
583
0.1
336
DE
FAU
LT×
FOR
EIG
N0.
5877
***
0.42
70**
*0.
5431
***
0.36
01**
0.45
42**
*0.
3273
**0.1
596
0.1
430
0.1
432
0.1
424
0.1
482
0.1
483
DE
FAU
LT×
PRO
VIN
CIA
L−0
.030
6***
−0.0
300*
**−0
.029
1***
−0.0
326*
**−0
.029
1***
−0.0
372*
**0.0
066
0.0
067
0.0
060
0.0
059
0.0
065
0.0
054
Num
ber
ofob
serv
atio
ns30
430
430
430
430
430
4Sa
rgan
test
p-v
alue
0.41
080.
4567
0.44
230.
3321
0.35
760.
4422
Res
idua
lA
R(1
)te
stp
-val
ue0.
0045
0.00
290.
0024
0.00
450.
0033
0.00
27R
esid
ual
AR
(2)
test
p-v
alue
0.86
680.
8102
0.71
660.
5163
0.71
130.
6796
a Stan
dard
erro
rsar
ein
italic
s.E
stim
ates
are
obta
ined
usin
gth
ext
dpd
com
man
din
Stat
a10
.0.
The
regr
essi
onal
soin
clud
estim
efix
edef
fect
s.*S
igni
fican
tat
10%
;**
sign
ifica
ntat
5%;
***s
igni
fican
tat
1%.

DEMETRIADES & FIELDING: BANKING SECTOR DEVELOPMENT 15
different from zero, but ξ is significant at the 5% level.Profitability as we measure it does not appear to be affectedby the terms of trade, but higher profits are associated withlower inflation.
Interestingly, none of the governance indicators is statis-tically significant when added to Equations (A1) and (A2):the quality of governance has no impact on bank profitabil-ity or the propensity to default on loans. Similarly, when weinclude as a regressor the level of bank assets, we do notproduce a statistically significant coefficient: default ratesand profitability do not depend on bank size. (This resultis the same whether we use moment restrictions on lagsof the asset level or the exogenous variables in Table 3 toinstrument the current level of bank assets.) Nevertheless,the default rate does respond significantly to macroeconomicconditions, as captured by TOT and INF, and profitabilitydoes respond significantly to INF, so these variables will bestrong instruments in a regression of RATIO on DEFAULTand PROFITABILITY.
Table A1 therefore presents the results of estimates ofthe parameters in Equation (1)—the equation for RATIO—using TOT and INF as instruments for DEFAULT andPROFITABILITY. In these estimates, the effects of DE-FAULT and PROFITABILITY are identified by both themoment conditions outlined in the main text and the exclu-sion of TOT and INF from the RATIO equation. Using theSargan Tests in the table, we cannot reject the null that theexclusion restrictions are valid. Comparison of the parameterestimates in Table A1 with those in Table 2 of the main textshows very little difference between the two sets of results,either in terms of the size of the estimated coefficients or interms of their level of significance.
REFERENCES
Arellano, M., and S. Bond. “Some Tests of Specification forPanel Data: Monte Carlo Evidence and an Applica-tion to Employment Equations.” Review of EconomicStudies, 58, 1991, 277–97.
Barth, J. R., G. Caprio, and R. Levine. “The Regulationand Supervision of Banks around the World: A NewDatabase,” in Integrating Emerging Market Countriesinto the Global Financial System, Brookings-WhartonPapers on Financial Services, edited by R. E. Litan,and R. Herring. Washington, DC: Brookings Institu-tion Press, 2001.
. “Bank Regulation and Supervision: What WorksBest?” Journal of Financial Intermediation, 13, 2004,205–48.
Beck, T., A. Demirguc-Kunt, and V. Maksimovic. “Finan-cial and Legal Constraints to Growth: Does Firm SizeMatter?” Journal of Finance, 40, 2005, 137–77.
Bigsten, A., and K. O. Moene. “Growth and Rent Dis-sipation: The Case of Kenya.” Journal of AfricanEconomies, 5, 1996, 177–98.
Blundell, R., and S. Bond. “Initial Conditions and MomentRestrictions in Dynamic Panel-Data Models.” Journalof Econometrics, 87, 1998, 115–43.
Demetriades, P., and S. Andrianova. “Sources and Effec-tiveness of Financial Development: What We Knowand What We Need to Know.” Research PaperRP2005/76, World Institute for Development Eco-nomic Research, Helsinki, 2005.
Demetriades, P., and K. Hussein. “Does Financial Devel-opment Cause Economic Growth? Time Series Evi-dence from 16 Countries.” Journal of DevelopmentEconomics, 51, 1996, 387–411.
Fuentes, R., and C. P. Maquieira. “Why Borrowers Repay:Understanding High Performance in Chile’s Finan-cial Market,” in Defusing Default: Incentives andInstitutions, edited by M. Pagano. Washington, DC:Inter-American Development Bank/Johns HopkinsUniversity Press, 2001.
Galindo, A., and M. Miller. “Can Credit RegistriesReduce Credit Constraints? Empirical Evidence onthe Role of Credit Registries in Firm InvestmentDecisions.” Presentation to Towards Competitiveness:The Institutional Path, Annual Meeting of the Boardof Governors, Inter-American Development Bank andInter-American Investment Corporation, Santiago,Chile, March 16, 2001. Accessed January 31, 2010.http://socsci2.ucsd.edu/∼aronatas/project/academic/Credit%20Registries.pdf.
Honohan, P., and T. Beck. Making Finance Work for Africa,Washington, DC: The World Bank, 2007.
International Monetary Fund. Senegal: Financial System Sta-bility Assessment. Country Report 01/189, Washington,DC, 2001.
Kaufmann, D., A. Kraay, and M. Mastruzzi. “GovernanceMatters VI: Aggregate and Individual GovernanceIndicators 1996–2006.” World Bank Policy ResearchWorking Paper 4280, 2007.
Koopman, S. J., A. Lucas, and P. Klaassen. “EmpiricalCredit Cycles and Capital Buffer Formation.” Journalof Banking and Finance, 29, 2005, 3159–79.
Levine, R. “Finance and Growth: Theory and Evidence.”NBER Working Paper 10766, Cambridge, MA, 2004.
Messick, R. “Judicial Reform and Economic Develop-ment: A Survey of the Issues.” World Bank ResearchObserver, 14, 1999, 117–36.
Sacerdoti, E. Access to Bank Credit in Sub-SaharanAfrica: Key Issues and Reform Strategies. Washing-ton, DC: International Monetary Fund, Working PaperWP/05/166, 2005.
Stiglitz, J., and A. Weiss. “Credit Rationing in Markets withImperfect Information.” American Economic Review,71, 1981, 393–410.
. “Incentive Effects of Terminations: Applicationsto Credit and Labor Markets.” American EconomicReview, 73, 1983, 912–27.