information communication technologies development … · ict development in education in the...
TRANSCRIPT

Microsoft Partners in Learning Research:
INFORMATION COMMUNICATION
TECHNOLOGIES
DEVELOPMENT IN EDUCATION
IN THE BALTIC COUNTRIES
(2004-2005)
RESEARCH RESULTS
Research conducted
by:
„Latvian Facts”
and
The Social Research Laboratory at the Kaunas University of Technology in Lithuania
Research financed by:
Research supported
by:
Centre of Information Technologies of the Ministry of Education and Science of the Republic of Lithuania
Ministry of Education and Science of the Republic of Latvia
Secretariat of Minister of special tasks on Electronic
management matters of the Republic of Latvia

ICT DEVELOPMENT IN EDUCATION IN THE BALTIC COUNTRIES – 2004-2005 2
FOREWORD
Research INFORMATION COMMUNICATION TECHNOLOGIES
DEVELOPMENT IN EDUCATION IN THE BALTIC COUNTRIES (2004-2005) is
realized within the Microsoft Partners in Learning program according to the
Memorandums of Understanding signed by the Ministries of Education in Baltic
countries and Microsoft.
The objectives of the research is to evaluate and assess development of
education quality and actual situation of technologies in schools, analyze impact of
technologies in education process, as well as identify needs for development in
general education schools in Estonia, Latvia, and Lithuania. Research covers three
key conditions for information communication technology (ICT) development in the
education: access to technologies, ICT skills and digital learning content.
Research INFORMATION COMMUNICATION TECHNOLOGIES
DEVELOPMENT IN EDUCATION for the first time in Baltic countries provides
comprehensive overview not only about ICT access and usage in education
institutions, but also about main technical, emotional, and educational obstacles for
successful ICT integration in teaching and learning – from experts’, informatics
teachers’, other subject teachers’ and children’s point of views.
Research addresses education policy makers, as well as school leaders,
headmasters, teachers, children, parents and other interested parties.

ICT DEVELOPMENT IN EDUCATION IN THE BALTIC COUNTRIES – 2004-2005 3
CONTENT
I. MAIN CONCLUSIONS ........................................................................................................................ 4
II. METHODOLOGICAL DESCRIPTION OF THE EMPIRIC STUDY .................................................... 9
III. ANALYSIS OF THE RESULTS ....................................................................................................... 11
1. INFORMATION COMUNICATION TEHNOLOGIES IN SCHOOL............................................... 11
1.1. Computerisation level at schools of the Baltic states ........................................................... 11
1.2. School technical maintenance in Latvia ............................................................................... 13
1.3. School technical maintenance in Lithuania .......................................................................... 17
1.4. School technical maintenance in Estonia ............................................................................. 20
2. EVERYDAY PROBLEMS REGARDING THE ICT USAGE......................................................... 23
3. ACCESS TO INFORMATION COMMUNICATIONS TECHNOLOGIES AND THEIR USAGE ... 25
3.1. Access to computer technologies......................................................................................... 25
3.2. Usage of ICT in education .................................................................................................... 35
3.3. Supply and usage of digital teaching materials .................................................................... 68
4. TEACHERS’ TRAINING............................................................................................................... 72
4.1. Attended courses and their evaluation ................................................................................. 74
4.2. Financial sources of teachers’ training ................................................................................. 78
4.3. Readiness to use and intensity of using ICT in teaching/learning process .......................... 80
5. IMPLEMENTATION AND MANAGEMENT OF ICT IN EDUCATION.......................................... 84
5.1. Teachers’ involving in development of ICT in school ........................................................... 84
5.2. Hindrances and driving forces influencing the introduction of the of Information
communication Technologies in education ........................................................................... 86
6. SIGNIFICANCE OF INFORMATION COMMUNICATIONS TECHNOLOGIES IN
EDUCATION.............................................................................................................................. 99
6.1. ICT at school – a factor facilitating the improvement of the quality of study process........... 99
6.2. ICT at school – the image factor when selecting a school ................................................. 101

ICT DEVELOPMENT IN EDUCATION IN THE BALTIC COUNTRIES – 2004-2005 4
I. MAIN CONCLUSIONS
• In order to evaluate the computerization degree of the education system,
usually two criteria are used – the number of pupils per one computer and the
average number of computers at a school. Comparing the situation in the
Baltic states, we can see that the best status is in Estonia, where on average
at a school there are 27,1 computers and the number of pupils per one
computer is 11,1. But the worst showings are in Lithuania – 16,3 and 19,6
respectively. Latvia with 20,9 computers at a school and with 13,9 pupils per
one computer is in the middle.
• In the Baltic States each year there is a constantly growing average number
of computers at a school, besides, the number of pupils per one computer is
decreasing. However, this positive tendency only partly can be explained with
the purchase of new computer equipment. Statistical showings are essentially
influenced by the fact that each year in the Baltic States the number of pupils
is decreasing.
• During the last years in the Baltic States there is a decrease in the amount of
the funding granted from the state budget for the purchase of new computers
and for the change of the old ones; therefore there is a risk, that the level
achieved during the last decade will be gradually lost. Currently computer
stocks are mainly supplemented and renewed with municipal funds. The lack
of new computers not only hinders the usage of the latest software in training,
but also is one of the main reasons, why mainly only computer classrooms
are provided with computers.
• Although on the whole ICT are available at schools, still they are mainly
concentrated in computer classrooms. But the computer classrooms are
overburdened with IT classes, that is why teachers of other subjects quite
often have few possibilities to use a school’s computer stock for teaching their
classes.
ICT DEVELOPMENT IN EDUCATION IN THE BALTIC COUNTRIES – 2004-2005 5
• In Latvia one of the technical factors, which are essentially influencing the fact
that ICT are not sufficiently actively used in training, is the lack of multimedia
projectors. Since multimedia projectors are relatively expensive, there are
really few schools, which can afford to buy such equipment.
• Unfortunately, while developing IT education, premises for systematic
violation of equal rights principle, and premises for open or latent
discrimination occur. Such social good like IT at schools is distributed
unevenly. First, there are rather contrasting urban – rural, school types, and
gender differences. Second, there is a big unjustified contrast between
partially favorable information culture, which focuses around the subject of
computer science, and a poorer one, which is created around the rest of
school subjects. Thus, at schools there are two contrasting and almost
unrelated IT cultures. There exists a phenomenon that when teachers who do
not teach computer science and want to get access to computers and to
apply them in the process of teaching and learning, they encounter barriers.
• Outside IT classes, in other subjects IT technologies are mainly used
“passively” (writing texts), and not “actively” (forming presentations;
demonstrating simulations etc.). On the one hand, it can be explained with the
fact that schools are short of digital training aids, but, on the other hand,
teachers themselves are not sufficiently prepared, so that they on their own
initiative could establish “technological” contents for their subjects. We should
add that also regarding future teachers, although in their training digital study
aids are used quite widely and they are relatively skilful computer users, still
at universities they are not taught how to use information communications
technologies (ICT), when teaching their subject.
• Public internet facilities (including school PCs) are more important for rural
children than for urban children. Hypothetically we can assume that rural
children relatively less often have a home computer and the Internet at home
that is why it is important to preserve their access at school or other public
places.

ICT DEVELOPMENT IN EDUCATION IN THE BALTIC COUNTRIES – 2004-2005 6
• During the study we have learned that teachers and those households, which
have school age children, on average, are better equipped with computers
than in a country in general. Still the fact that teachers have access also to
computer at home, does not facilitate a more active usage of ICT in training
process, since, on the one hand, unavailability of computer equipment at
school is limited, but on the other hand, teachers do not feel sufficiently
confident of their computer user’s abilities and are afraid to become ridiculous
in the eyes of their most skilful pupils. We should stress that pupils in training
process much more actively use computers, the Internet and even
PowerPoint presentations than teachers ask them to do – it means that young
people perceive and integrate modern technologies more naturally than their
teachers.
• In Latvia and Lithuania IT courses are more or less perceived as a privilege
and not as a necessity, which should be available to every teacher. Besides,
most teachers attend courses, which are not longer than four days, thus we
can speak about the minimal training. Most probably basic knowledge is
provided, but no wider and deeper skills are acquired.
• In Lithuania and Latvia the teachers tend to treat a computer as a mediator of
information processes. Consequently, the computers are used in a certain
direction – to present and receive information, in search of information and
editing files. Opportunities to use computers for more delicate objectives,
such as simulation and modeling of nature and society processes, and virtual
surroundings for most teachers are hard to accept as the environment for
research organization, as medium for creativity and education of critical
thinking. Teachers are not inclined to agree that a computer can educate
creativity in students.
• Future teachers are more confident of their computer users’ skills than the
working teachers; besides, they more often use ICT in their daily work. It
makes us think that with the change of generations at schools many teachers’
‘permanent’ fear from modern technologies will be averted.

ICT DEVELOPMENT IN EDUCATION IN THE BALTIC COUNTRIES – 2004-2005 7
• The Estonian educational policy is at the beginning of the next important
stage. There is an urgent need for a new state study program and curricula
that integrates methodical use of ICT, its textbooks and other study materials.
Since today the use of the ICT means in the study process mostly has been
dependent on the personal enthusiasm of the teachers or the school
management
• The vision most often is a ground to achieve the successful implementation of
the set task. Unfortunately IT vision in Latvia and Lithuania still is not
completely clear in many schools and even the managers themselves assess
it quite skeptically. The fogginess of the vision could be determined by the low
involvement of teachers in its planning and forming which is partly approved
by the managers themselves.
• According to teachers, the main hindrances to integrate ICT in education are
the insufficient number of computers, the lack of financing and new software,
whereas the facilitating factors are: teachers’ interest, national support and
financial grants.
• Basing on the information obtained during the study, we can form the
following causality of the passive usage of ICT: teachers’ possibilities to use
ICT daily in training are limited// schools have no new computers, because
the state financing is not sufficient => at schools ICT are concentrated in
computer classrooms => computer classrooms are overburdened with IT
classes => teachers of other subjects have no possibilities to teach their
classes using ICT => teachers do not form skills to work with ICT and a habit
to ICT as a training aid => there is an increasing competence gap of the ICT
usage between a teacher, who in his work does not use ICT, and a pupil, who
regularly at home uses a computer => teachers strengthen their inferiority
complex and lose the psychological motivation to use ICT in training process.
Generalizing this causality, we can say that the larger are the possibilities
to use ICT, the larger is the wish to use ICT in training.

ICT DEVELOPMENT IN EDUCATION IN THE BALTIC COUNTRIES – 2004-2005 8
• In Latvia the majority of the surveyed pupils’ parents are sure that modern
technologies are very important and significant for the future of their children,
that is why skills for work with them shall be acquired daily, including those at
school. However, the usage of computer technologies in training process is
not the decisive factor, when selecting a school for a child – for parents it is
more important that the education quality of the school is corresponding to
their impression of good education and the school is located not far from
home.
• Most IT teachers in Latvia and school headmasters in Lithuania have heard
about Microsoft activities in education. In the audiences of pupils, future
teachers and teachers the percentage of those who have heard about
Microsoft educational projects is 30 to 50%.
In Latvia the most popular Microsoft projects are the Internet portal for
teachers (www.skolotajs.lv), where teachers can get a methodological
support and exchange information, and the Internet homepage competition
for schools Zelta Skudra.
But in Lithuania the most popular projects are Fresh Start for donated
Computers, within which the computers donated to schools get licensing of
the Microsoft programs, and the Innovative Teacher Competition.
In Estonia respondents have positively evaluated the software program
licensing and the program Virtuaalne õppetund (Virtual Lesson) for Innovative
Teacher competition.
In all the Baltic States respondents see further co-operation prospects
with Microsoft in the following areas: training teachers to work with ICT,
donating software to schools, offering “subsidized” software to teachers,
technically supporting teachers, which would help to strengthen the
knowledge acquired in courses to work with ICT. A wish was expressed to
receive a methodological support, which would allow using better the
possibilities of the Microsoft software, when teaching specific subjects.

ICT DEVELOPMENT IN EDUCATION IN THE BALTIC COUNTRIES – 2004-2005 9
II. METHODOLOGICAL DESCRIPTION OF THE EMPIRIC STUDY
The research organized by the Microsoft in Baltic countries had several goals:
• To provide data on computerization and internetization at Latvia’s,
Lithuania’s and Estonia’s schools of general education, on computer
and Internet usage habits;
• To clarify teachers’ and principals’ self-esteem regarding their
computer skills and their usefulness, as well as the way of obtaining
these skills;
• To clarify usage of software and computer labs at schools – both in
the educational process and in the administrative work;
• To clarify the existing and the potential usage of Internet by teachers,
pupils and school management (both reasons for using/ not using, its
frequency and Internet access points);
• To measure teachers’ readiness to use and integrate ICT in various
educational processes;
• To identify what is the driving force of ICT in education;
• To identify the study parameters and criteria, which will help to assess
the impact of ICT on education;
• To identify the criteria, which will help to develop and integrate ICT in
education;
• To identify and assess government’s priorities, the achieved and
planned things to advance and develop ICT in education;
• To prepare a database of teachers, to identify the most innovative and
active teachers.
In order to obtain the information necessary for the analysis, several empiric studies
were conducted in all the three Baltic States. The whole research consisted of:
• Desk Research;
• Qualitative study, interviews with specialists of the Education and
Science Ministry, who have competence to introduce information
science in Latvia’s educational establishments;
• Quantitative survey of target groups (including expert in-depth
interviews).

ICT DEVELOPMENT IN EDUCATION IN THE BALTIC COUNTRIES – 2004-2005 10
In order to achieve the goals set it is planned to analyze opinions of the following
target groups:
• Principals and teachers of secondary education establishments;
• Principals and teachers of comprehensive schools and of those
subjected to various ministries:
- Principals of schools/ vocational schools/ technical schools/
colleges;
- Teachers of computer science;
- Teachers of other subjects (not information science);
• Pupils of senior forms;
• Pupils’ parents;
• Managers of structural units of the Education and Science Ministry,
who are competent to introduce information science in the educational
process in Latvia, Lithuania and Estonia (e.g., Latvian educational
systems – LIIS; Information Technologies Department of the
Education and Science Ministry);
• Heads of Latvia’s, Lithuania’s and Estonia’s universities, which
prepare teachers of information science other subject teachers
• Students studying the specialty of teachers of information science.
In the study conducted in Lithuania and Latvia a harmonized methodology of empiric
studies and instrumentarium were used. In Estonia’s case the analysis was based on
the longitudinal study “Tiger in Focus”, conducted from 2000 to 2004. Along with it in
Estonia a qualitative study was conducted, and its methodological basis and results
allow us to compare it with the studies conducted in the two other Baltic States. A
detailed methodological description of all the empiric studies is added to this Report
as an Appendix.

ICT DEVELOPMENT IN EDUCATION IN THE BALTIC COUNTRIES – 2004-2005 11
III. ANALYSIS OF THE RESULTS
1. INFORMATION COMUNICATION TEHNOLOGIES IN SCHOOL 1.1. Computerization level at schools of the Baltic States
Usually, in order to evaluate the computerization level of the educational system, as
criteria are used the number of pupils per one computer and the average number of
computers at school. Comparing the Baltic States by these criteria, it can be seen
that the best situation is in Estonia with 11.1 pupils per one computer. In Lithuania
this showing is the worst in the Baltic States – 19.6.
In Latvia the number of pupils per one computer is decreasing every year – since
1996, when there were 95 pupils per one computer, the number of pupils has
decreased almost 7 times. On the one hand, it has happened due to the expansion of
the computer stock, but on the other hand, there is an essential decrease in the
number of pupils (-30,312).
Level of computarization in school (Figure 1)
19.6
13.911.1
0
5
10
15
20
25
30
35
40
45
50
number of pupils per one computer
Source:Latvia: Ministry of Education and Science (2004)
Estonia: Ministry of Education and Research (2005) Lithuania: Department of Statistics to the Government of the Republic of Lithuania; Kaunas University of tehnology (2005)
Lithuania Latvia Estonia

ICT DEVELOPMENT IN EDUCATION IN THE BALTIC COUNTRIES – 2004-2005 12
Dynamics of the ratio “pupil : computer” from 1996 to 2004 (source: LIIS and Ministry
of Education and Science):
Also comparing the Baltic states by the average number of computers at school, it
can be seen that the best situation is in Estonia, whereas the worst – in Lithuania. In
Estonia on average there are 27,7 computers at each school, in Latvia – 20,9, but in
Lithuania – 16,3.
Level of computarization in school (Figure 2)
16.320.9
27.7
0
5
10
15
20
25
30
35
40
45
50
average number of computers in school
Source:Latvia: Ministry of Education and Science (2004)
Estonia: Ministry of Education and Research (2005) Lithuania: Department of Statistics to the Government of the Republic of Lithuania;
Lithuania Latvia Estonia
Year Number of PC Number of pupils Number of pupils per one PC1996 3 593 342 801 951997 5 183 347 254 671998 6 247 348 205 561999 9 999 347 052 352000 13 763 344 822 252001 15 632 336 824 222002 17 222 325 503 192003 19 196 312 489 16

ICT DEVELOPMENT IN EDUCATION IN THE BALTIC COUNTRIES – 2004-2005 13
1.2. School technical maintenance in Latvia
According to data of the Ministry of Education and Science (MES) in 2004 in Latvia’s
educational establishments (990 schools) there were 20,774 computers (on average
~21 computers at one school), which is for 1,578 computers more than in 2003,
when according to the data of Latvia’s Education Computerization System (LIIS), at
Latvia’s schools there were 19,196 computers.
Type of school Number of PC (2004; Ministry of Education and Science)
Number of PC per 100 pupils (2004; Ministry of Education and Science)
Number of PC (2003; The
Informatization System of
Latvian Education –
LIIS)
Number of PC per 100 pupils
(2003; The Informatization
System of Latvian
Education – LIIS)
primary school 352 4,5 291 3,1
elementary
school
6448 9,1 5902 7,5
secondary
school
12945 6,3 12049 5,6
special school 1029 13,8 954 9,7
The computers at educational establishments by their type and parameters are quite
various, but in 83,6% of cases they are various computers of the Pentium type.
PC types in Latvian schools(Ministry of Education and Science 2004)
Other4%
Macintosh0,2%
IBM 386 and older3%
IBM 4868,9%
Pentium I20,7%
Pentium II42,1%
Pentium III20,8%

ICT DEVELOPMENT IN EDUCATION IN THE BALTIC COUNTRIES – 2004-2005 14
In 2004, according to the MES data, at Latvia’s schools there were 938 IT teachers
(in 2003, according to the LIIS data, there were 1,145 IT teachers). 762 of them are
with a higher teacher’s education, but 176 – with education of another kind. 167
teachers have worked for less than 5 years, 157 – from 5 to 10 years, but 614 – from
10 and more years.
In 2004 at 178 schools there was the Internet dial-up connection (18%), 48 schools
had ISDN (4,8%), 328 – up to 128 Kbps (33,1%), 213 – from 128 to512 Kbps
(21,5%), 105 – from 512 to 2 Mbps (10,6%), 50 – more than 2 Mbps (5,1%). At 68
schools there is no Internet connection at all (6,9%).
In total in the 153 educational establishments surveyed during the quantitative study
there are 3,847 computers, most of them (74,1%; 2851) are located in computer
classrooms, but the other ones are either in rooms of other subjects or at libraries, or
in premises related to school administration. 63 (1,6%) computers are located in
various other school premises – for example, at school’s self-government;
psychologist’s, social assistance or speech therapist’s room; at the information
centre; at the canteen; at the boarding-room; at the room for rest etc. Most of school
computers (85,5%; 3282) are connected in a network.
Only in two of the surveyed schools (Pociems and Litene elementary schools) there
is no access to the Internet. At the other schools mainly they have the permanent
Internet in Latvian schools(Ministry of Education and Science 2004)
No internet connection
7%Cable ower 2 Mbps
5%
Cable 512 Kbps - 2 Mbps11%
Cable 128 - 512 Kbps22%
Cable up to 128 Kbps32%
ISDN5%
Dial-up18%

ICT DEVELOPMENT IN EDUCATION IN THE BALTIC COUNTRIES – 2004-2005 15
Internet connection (98,4%), although also dial-up is used (1,6%; 51 computers are
connected). 85,1% of all the surveyed schools’ computers are connected to the
Internet. Most often the Internet connection speed is 128 to 512 Kbps (42,4%), only
in 19,3% of schools the connection speed is exceeding 2Mbps.
On average in the surveyed schools there are almost 9 (8,87) computers per 100
pupils. But regarding the other computer facilities, the situation is as follows:
projectors – 0,19; copy-machines – 0,74; scanners – 0,525; printers – 1,78. But if we
observe the number of computers per 100 pupils by their parameters, the number of
powerful and new computers per 100 pupils is scarce: computers with a processor
exceeding Pentium 2 – 3,79; computers with RAM exceeding 128Mb – 1,18;
computers with HDD exceeding 10Gb – 3,1.
During the qualitative study the surveyed experts evaluated the school maintenance
with multimedia projectors as being insufficient. The main reason for the bad school
maintenance with multimedia projectors is thought to be their high price. Since
multimedia projectors are expensive (costing about 600 lats), then there are few
schools, which can afford to buy it, but their absence reduces the ICT usage
possibilities, since one cannot for the whole class simultaneously demonstrate
pictures, simulations, formulas etc. (The Daugavpils district: Projectors are a heavy
topic, this problem has not been solved due to the lack of funding; a MES clerk: It is
very rarely that pupils have access to such equipment. We could say that actually
they don’t have any. Even for universities sometimes it is problematic to provide
teachers with these technologies. Definitely this equipment cannot be prior at
schools, since often there is even no computer equipment to work with.)
In most cases school maintenance with multimedia projectors depends on
municipality’s initiative, since until now the LIIS project has not envisaged any
funding especially for the purchase of such facilities. For example, the Riga City
Municipality has tried to solve this problem in two ways – buying 5 portable
projectors, which are rented for Riga schools, when they have such a necessity;
buying the NetOp software, which allows teacher to work in the net with all
computers of the computer classroom. But the School Board of the Valmiera district,
thanks to its friendship with Finnish and Swedish municipalities, has provided each
secondary school of the district with a multimedia projector.

ICT DEVELOPMENT IN EDUCATION IN THE BALTIC COUNTRIES – 2004-2005 16
If school maintenance with computer equipment is evaluated by its percentage
division by regions, populated places and school types, it can be seen that the
largest percentage of computer equipment is in Riga and at district centers, at
elementary schools (the only exception – at elementary schools there is the smallest
percentage of more powerful computers of the youngest generation) and at small
secondary schools, but the smallest percentage of computer equipment is in small
towns and at large secondary schools.
But if school provision is analyzed by the number of units of computer equipment per
100 pupils, then on the whole, the best provided with computer equipment are pupils
in the country and in small towns, as well as at elementary schools, but the worst –
pupils of Riga, district centers and large secondary schools.
The obtained results reflect a regularity – although the largest percentage of
computer equipment is observed in more populated places and at the largest
schools, still it is available to a smaller percentage of pupils in comparison with the
small rural schools, where there are fewer pupils (for example, at the Sala
elementary school, where there are 37 computers per 65 pupils, the ratio ‘pupil :
computer’ is 1,7:1, whereas at the Jēkabpils Secondary School Number 2, where
there are 89 computers per 1,103 pupils, this ratio is 12,4:1).
We should add that the largest percentage of more powerful computers of the
youngest generation is in Riga, where the municipality during the last years has
actively purchased computer equipment for schools.
Results of the quantitative study confirms the assumption expressed during the
qualitative study by the experts that in 95% of cases schools use Microsoft software
(an IT teacher of a grammar school: Usage of alternative programs is not possible in
this situation of the labor market: if I at my school instead of Windows Office start
working with Star Office, my pupil won’t be competitive in the labor market, because
everywhere he goes, Bill Gates will be ahead with his software. We have to be
oriented to Windows based programs...) – almost all school computers of the
surveyed schools have Microsoft operating systems, just less than 1% of computers
have Mac OS or Linux operating systems. Ten respondents also mentioned other
operating systems, which were not included in the questionnaire; however, they all
are Microsoft products: Millennium; WIN ME; WIN NT; DOS; WIN 2003.

ICT DEVELOPMENT IN EDUCATION IN THE BALTIC COUNTRIES – 2004-2005 17
1.3. School technical maintenance in Lithuania
According to the data of the Lithuanian Education and Science Ministry, at
Lithuania’s schools in 2004 there were 31,547 computers. Most of them are located
in computer classrooms – 18,392 (58,3%). In rooms of other subjects there are only
2,827 computers (8,9%), but administration has 4,196 computers (13,3%).
The distribution of computers in the area at school (source: Lithuanian Education and Science Ministry)
Year of study 2003/2004 2004/2005 Number of computers in special computing classrooms or in the room of computer studies 18052 18392
Number of computers in classrooms of different subjects or classrooms 2713 2827
Number of computers in the library and reading hall 3398 3441
Number of computers in the Teachers’ room or other places for teachers 1118 1146
Number of computers in the administrative area 3973 4196 Number of computers in other places at school 1466 1545 Totally computers 30720 31547
About one third of existing computers have processors with less than 300 MHz, and
this shows that schools are still possessing old-fashioned computers which should be
renovated. Most computers (96%) have the Microsoft operating system. In separate
cases also the Linux operating system is used.
The technical and programming profile of computers (source: Lithuanian Education and Science Ministry)
Year of study 2003/2004 2004/2005 Number of computers with processors of 300 MHz 10195 10668 Number of computers with processors of 300 MHz and better 20525 20879
Number of computers with Microsoft operational systems 29504 30301
Number of computers with LINUX operational system 268 275
A relatively small number of computers are used to perform the functions of servers.
The fact that servers are registered at schools by ICT specialists LINUX operational
system spreads faster. However, Microsoft operational system is used more often to
monitor servers and this can be explained that similar operational systems are
coordinated better inside than different. Meanwhile from 534 schools with servers

ICT DEVELOPMENT IN EDUCATION IN THE BALTIC COUNTRIES – 2004-2005 18
127 servers have installed LINUX operational systems – this comprises about 24 %
of all servers.
Servers and their operational systems
Year of study 2002/2003 2003/2004 2004/2005 Number of servers (separate, to perform server functions for computers) 115 527 534
Number of servers, using Microsoft operational systems 172 384 388
Number of servers, using LINUX operational system - 124 127
According to the data of the quantitative study, large grammar schools much more
often have a wireless Internet connection and a radio link (83,3%) than the ordinary
secondary schools (45,5%) and elementary schools (53,8%). The permanent cable
Internet connection in 18,2% of the cases is at secondary schools, in 16,7% – at
grammar schools and in 7,7% - at elementary schools. But dial-up, ISDN and ADSL
are used only at elementary schools (modem – 26,9%; ISDN – 3,8%; ADSL – 7,7%)
and at secondary schools (modem – 9,1%; ISDN – 4,5%; ADSL – 22,7%).

ICT
DE
VE
LOP
ME
NT
IN E
DU
CA
TIO
N IN
TH
E B
ALT
IC C
OU
NT
RIE
S –
200
4-20
05
19
1.3.
1. T
he
pu
rch
ase
of
com
pu
ter
equ
ipm
ent
and
so
ftw
are
The
ana
lysi
s of
the
sou
rces
of
com
pute
r eq
uipm
ent’
purc
hase
sho
wed
tha
t th
e m
ain
of t
hem
are
cen
tral
ly a
lloca
ted
finan
ces
of t
he s
tate
,
natio
nal
com
pute
rizat
ion
prog
ram
s et
c. C
ompa
ring
the
scho
ols
in t
he v
illag
e an
d ci
ty/to
wn,
the
diff
eren
ces
are
note
d w
hile
pur
chas
ing
com
pute
r eq
uipm
ent,
the
big
indu
stry
com
pani
es a
re in
the
thi
rd p
ositi
on a
ccor
ding
to
the
amou
nt o
f fu
ndin
g, a
nd in
the
citi
es/to
wns
– p
aren
ts
and
rela
tives
of
the
stud
ents
. D
ivid
ing
the
amou
nts
of f
undi
ng,
acco
rdin
g to
the
typ
es o
f sc
hool
s, o
ne m
ore
even
lar
ger
sour
ce o
f fu
ndin
g is
note
d, i.
e. r
epre
sent
ativ
es o
f loc
al b
usin
ess.
The
y m
ostly
fund
the
loca
l gym
nasi
ums
(Tab
le 1
).
T
able
1
Wh
at a
re t
he
reso
urc
es t
hat
allo
w y
ou
r sc
ho
ol t
o p
urc
has
e co
mp
ute
rs?
Wh
o f
un
ds
this
?
C
entr
ally
allo
cate
d fin
ance
s of
the
stat
e,
natio
nal c
ompu
teriz
atio
n pr
ogra
ms
etc
Fin
ance
s of
lo
cal
mun
icip
ality
Fin
ance
s of
big
na
tiona
l (L
ithua
nian
) bu
sine
ss
Priv
ate
fore
ign
finan
ces
Fin
ance
s of
lo
cal
busi
ness
men
Fin
ance
s de
note
d by
st
uden
ts’
pare
nts
Bas
ic
92,6
%
85,2
%
11,1
%
25,9
%
0,0%
7,
4%
Sec
on
dar
y
90,9
%
68,2
%
9,1%
18
,2%
9,
1%
18,2
%
Yo
u w
ork
in t
he
sch
oo
l (th
e m
ain
wo
rkp
lace
) w
hic
h is
...
Gym
nas
ium
84
,6%
53
,8%
0,
0%
7,7%
23
,1%
23
,1%
C
ity
94,3
%
74,3
%
8,6%
14
,3%
5,
7%
20,0
%
Lo
calit
y/ad
min
istr
ativ
e u
nit
o
f yo
ur
sch
oo
l is
...
To
wn
, vill
age
85,2
%
70,4
%
7,4%
25
,9%
11
,1%
7,
4%
The
re a
re f
ewer
sou
rces
of
fund
ing
the
purc
hase
of
softw
are.
Som
e su
ppor
ters
tha
t pa
rtly
fun
ded
the
purc
hase
of
com
pute
r eq
uipm
ent
alm
ost
do n
ot p
ay a
ttent
ion
to s
oftw
are.
The
sof
twar
e is
mos
tly fu
nded
by
two
mai
n so
urce
s:
1.
Cen
tral
ly a
lloca
ted
finan
ces
of th
e st
ate,
nat
iona
l com
pute
rizat
ion
prog
ram
s et
c.
2.
Fin
ance
s of
loca
l mun
icip
ality
T
he d
istr
ibut
ion
of fu
ndin
g so
urce
s sh
ows
that
the
mai
n at
tent
ion
is p
aid
to p
urch
ase
com
pute
r eq
uipm
ent.
The
pur
chas
e of
sof
twar
e is
not
so
impo
rtan
t in
the
scho
ols
(Tab
le 2
).
T
able
2
Wh
at a
re t
he
reso
urc
es t
hat
allo
w y
ou
r sc
ho
ol t
o p
urc
has
e co
mp
ute
rs s
oft
war
e? W
ho
fu
nd
s th
is?
Cen
tral
ly a
lloca
ted
finan
ces
of th
e st
ate,
na
tiona
l com
pute
rizat
ion
prog
ram
s et
c
Fin
ance
s of
lo
cal
mun
icip
ality
Fin
ance
s of
big
na
tiona
l (L
ithua
nian
) bu
sine
ss
Priv
ate
fore
ign
finan
ces
Fin
ance
s of
lo
cal
busi
ness
men
Fin
ance
s de
note
d by
st
uden
ts’
pare
nts
Bas
ic
88,9
%
66,7
%
3,7%
3,
7%
0,0%
0,
0%
Sec
on
dar
y
77,3
%
50,0
%
9,1%
4,
5%
4,5%
4,
5%
Yo
u w
ork
in t
he
sch
oo
l (t
he
mai
n w
ork
pla
ce)
wh
ich
is
Gym
nas
ium
84
,6%
61
,5%
7,
7%
0,0%
7,
7%
7,7%
C
ity
85,7
%
54,3
%
11,4
%
0,0%
2,
9%
5,7%
L
oca
lity/
adm
inis
trat
ive
un
it o
f yo
ur
sch
oo
l is:
T
ow
n, v
illag
e 81
,5%
66
,7%
0,
0%
7,4%
3,
7%
0,0%

ICT DEVELOPMENT IN EDUCATION IN THE BALTIC COUNTRIES – 2004-2005 20
1.4. School technical maintenance in Estonia
According to the data of the Estonian Educational Information Systems, in March,
2005 in Estonia there were 17,181 computers, 4,316 (25,12%) of them – in the
capital Tallinn but in the rest of Estonia – 12,865 (74,87%). In total there are 190,879
pupils in Estonia – 49,935 (26,16%) of them are in Tallinn, but in the rest of Estonia –
140,944 (73,83%).
9,458 computers of the total number of computers at Estonian schools are available
to pupils, 5,096 – to teachers, but 1,871 are freely available at school libraries and
Internet access points.
Source: EHIS (Estonian Educational Information Systems) 29.03.2005
By the opinion of all the experts, participating in the qualitative survey,
computerization of schools has reached the rather good level. In Tallinn, for example,
there are 13 students per a PC in average. However, the situation can differ
significantly at schools. This number varies by different regions as well: at several
schools in rural areas the situation is even better than at larger schools in the cities
(Much depends on the wealth of local governments. If the school is large and has
little interest for computers, there may be one semi-computerized class and the
number of students per computer could be between 70 and 80. In some smaller rural
schools there may be few students, but a proper computer class).
According to the data of Estonian Educational Information Systems, in total in
Estonia’s 620 school computer classrooms there are 9,100 computers. 550 schools
have a permanent Internet connection, but 52 have a dial-up.
Source: EHIS (Estonian Educational Information Systems) 29.03.2005
count of PC in use of the teachers
count of PC in use of pupils
count of PC in common use (libraries, Internet network point etc.)
count of PC in the schools in total
Primary schools 258 478 105 780Basic schools 1304 3046 572 4933Secondary schools 3534 5934 1194 11468Total 5096 9458 1871 17181
count of PC in computer classes a
Web- an mail-servers (not included into the count of workstations )
count of workstations, connected with Internet
Interneti permanent connection
Interneti dial-up service
Primary schools 386 13 424 60 10Basic schools 2899 85 4475 247 19Secondary schools 5815 278 10108 243 23Total 9100 376 15007 550 52

ICT DEVELOPMENT IN EDUCATION IN THE BALTIC COUNTRIES – 2004-2005 21
By the opinion of experts, nearly all the schools (at least 98%) have the Internet
access, mostly by online connection. Majority of PCs at schools are connected to the
Internet. Tallinn schools are connected via the fiber optical cable (Tallinn is super.
We are able to monitor constantly how much and how often the Internet is being
used by monitoring the situation at any time when the computers in schools go
online, what is Internet traffic, etc).
Majority of schools have 1-3 multimedia projectors, the 80 schools of Tallinn have
271 projectors today. By the opinion of the experts, this number is not enough to
integrate ICT into the study process. The more active teachers in Tallinn think that
what schools need today is not better PC classrooms, but more flexible systems
involving laptops, the Internet connection (here also WiFi is an important criteria) and
multimedia projectors in every classroom - all should be easily movable and mobile
(teacher: My understanding is that it is time to replace the computer class as such
with the subject teacher’s computer plus a multimedia projector; expert from
university: There should be more multimedia projectors and teachers really want
them. But one costs EEK 30,000 (around EUR 2,000) so that every school has
attempted to procure at least one since there are no funds to purchase more).
The age of computers in Estonia is quite various (teacher: Speaking of the age of
computers one can say that there are all sorts of PC-s. We have relatively new PC-s
that also run on more modern operation systems. But I also know that in very many
schools that have also older computers. PC-s with Pentium 166 CPU are not rare at
all). Most computers some time ago were purchased with the support of Tiigrihüppe
SA (the Tiger Leap Foundation). Now the question what to do with the old equipment
is becoming more and more topical, as well as how to change it with a new one (a
university teacher: I believe that the largest number of computers were purchased
during last elections. If you take that a computer becomes obsolete in five years,
most computers will soon run out of their useful life. If the new Tiger’s Leap program
fails to allocate state funding for renewal of hardware, we would be facing a huge
problem in 2007). Computers at many schools are no more suitable to work with
modern software (teacher: Generally, the computers in schools are very old by
modern standards. The public tender is the one before the last tender. In some
schools the computers are running on 16 MHz).

ICT DEVELOPMENT IN EDUCATION IN THE BALTIC COUNTRIES – 2004-2005 22
Regarding software, experts have indicated that more than 90% of all the operating
system used at schools is Microsoft products. In few schools they also use Linux and
the free code programs – usually they are used parallel to Microsoft operating
systems. Concerning software, in training the most often used ones are Word, Excel,
and PowerPoint; in certain subjects - also Publisher, Corel Draw etc. Experts think
that the largest problems of software are related to its expensiveness and
changeability. (Software is changing too fast and the old software does 99 percent of
the job without purchasing any new gadgets. The fact that new software versions are
coming to the market so fast is actually a major problem, for instance, in training
courses. In my opinion, there is no need in schools to rapidly upgrade software since
the educational system is not so receptive that it can sustain it. This is causing
problems also in computer classes. Some schools in Tallinn have purchased
software for whole classes while the others have not been able to do so. This creates
a situation where in one class 3 computers may look the same while 3 others would
look different than the third group of 3 computers).

ICT DEVELOPMENT IN EDUCATION IN THE BALTIC COUNTRIES – 2004-2005 23
2. EVERYDAY PROBLEMS REGARDING THE ICT USAGE
Deputy headmasters (Lithuania) and IT teachers (Latvia) within the quantitative study
were asked the following question: “How often do you face the IT problems which
can be solved only with the assistance of technicians or companies outside
the school?”
In Latvia 38,6% of the surveyed IT teachers and deputy headmasters responsible for
IT matters face ICT related problems once a month, about 45% - once a year or half
a year, but 16,3% never experience such problems.
In Latvia the teachers, who regularly face computer equipment exploitation problems,
most often work at a primary school, which is located in the rural area of Zemgale.
But usually such problems are never faced by IT teachers in Riga and district
centers.
How often do you face with the IT problems which can be solved only with the assistance of technicians or companies outside the
school? (N: Latvia - IT teachers; Lithuania - school managers)
40.7%
36.4%
53.8%
38.0%
38.3%
40.7%
38.6%
33.3%
45.5%
15.4%
30.4%
27.7%
25.9%
28.8%
14.8%
13.6%
19.0%
12.8%
14.8%
16.3%
11.1%
4.5%
7.7%
12.7%
21.3%
18.5%
16.3%
23.1%
0% 10% 20% 30% 40% 50% 60% 70% 80% 90% 100%
School managers inprimary school
School managers insecondary school
School managers ingymnasium
IT teachers in primaryschool
IT teachers insecondary school
IT teachers ingymnasium
IT teachers
Lith
uani
aLa
tvia
Latv
ia
once a month once per half of year once per academic year never

ICT DEVELOPMENT IN EDUCATION IN THE BALTIC COUNTRIES – 2004-2005 24
When comparing the results in Lithuania and Latvia, we can see that every month
ICT related problems more often are faced by teachers from large Lithuanian
secondary schools and grammar schools. The basic schools try to solve the
problems related to IT matters themselves. The managers of these schools indicated
that 11,1 % of the schools do not apply to IT technician (if he is not an employee of
the school) because of the problems in IT field, and most frequently they call IT
technician from gymnasium to solve these problems. Being aware of situation in
which IT extent is much bigger in gymnasiums, it could be assumed that this choice
is determined by the wish to ensure the maintenance of IT and, consequently,
improve the quality of exploitation. (Quantitative research, Lithuania)
IT teachers from Latvia were asked additionally to mention the problems, which
would be related to IT.
The most widespread problems with ICT are related to repairing computer equipment
(43 respondents), viruses (26) and a low-quality Internet connection (18). 21 IT
teachers have faced problems related to software – disturbances in operating
system; problems with program installation; pupils “destroying” a program, etc.
Most common difficulties with IT.LATVIA
Multiple question (Only those of managers, that have faced with IT problems)
3
3
4
4
6
8
9
18
26
43 respondents
14
51
1 11 21 31 41 51
NA
pupils “crash” software
damage of mother board
cleening/ maintenance of printer
lack of software
instalation of progarmmes
problems with operating system
outdated computers
net-work administration
low-grade internet connection
viruses
problems with technical equipment/ repairs

ICT DEVELOPMENT IN EDUCATION IN THE BALTIC COUNTRIES – 2004-2005 25
3. ACCESS TO INFORMATION COMMUNICATIONS TECHNOLOGIES AND THEIR USAGE During the study the surveyed pupils, teachers, school IT teachers and deputy
headmasters responsible for IT matters, as well as students – future teachers – were
asked questions on the access to computer technologies at home and educational
establishments or at work; computer usage intensity; access to the Internet
resources and their usage in training process. Besides, respondents were asked to
evaluate their confidence level regarding their ability to use ICT in training process.
3.1. Access to computer technologies
3.1.1. Access of PC’s.
In all Baltic States home has become as important place to work with ICT as school
for everybody – teachers, pupils and students. According to quantitative study
results, more than half of pupils and teachers have access to home computers. For
example, in Lithuania 83,3% of teachers and 67% of pupils have a computer at
home, but in Latvia and Estonia these results are 66,2% and 63%, and 80% and 74%
respectively.
In Latvia most often IT teachers (80,4%), as well as future teachers (86,1%) have
computers at home. Also households with school age children on average more often
have computers, whereas regarding the other households – the percentages are
41,4% and 29% respectively. Computerization level in the households with children
of secondary school age is even higher – 54,4%. Such a tendency shows that, when
children are becoming older, the necessity to use computer technologies increases,
that is why families find possibilities to purchase a computer.
In Estonia 72% of households with children have a computer. Regarding Lithuania
such data are not available.
The data are reflected more graphically in the Chart on the next page:

ICT DEVELOPMENT IN EDUCATION IN THE BALTIC COUNTRIES – 2004-2005 26
In Estonia, on average, teachers are better equipped with home PCs than students,
whereas four years ago the situation was the reverse (“Tiger in Focus: Executive
Summary” 2004). But according to quantitative study of 2005, in Latvia more often
students-future teachers than teachers (see the previous Chart) have access to a
computer at home.
Do you have a computer at home?
72.0%
41.4%
74.0%
63.1%
67.0%
80.0%
66.2%
83.3%
80.4%
86.1%
28.0%
58.6%
26.0%
36.9%
32.9%
20.0%
33.8%
16.7%
19.6%
13.9%
0% 10% 20% 30% 40% 50% 60% 70% 80% 90% 100%
Estonia***
Latvia (N=249)**
Estonia*
Latvia (N=2169)
Lithuania(N=1133)
Estonia*
Latvia (N=450)
Lithuania(N=528)
Latvia (N=153)
Latvia (N=101)
Hou
seho
lds
with
scho
ol a
gech
ildre
n P
upils
Teac
hers
ITte
ache
rs
Stu
dent
sof
peda
gogy
* "Tiger in Focus: Executive Summary" (2004)** Latvian Facts (May, 2005)
*** Turu-uuringute AS (May, 2005)
Yes No

ICT DEVELOPMENT IN EDUCATION IN THE BALTIC COUNTRIES – 2004-2005 27
When analyzing the obtained data by socially demographic showings, we can
observe the following tendencies:
Most often the ones who have home computers are
- male teachers;
- townspeople;
- teachers from large schools.
Do you have a computer at home? (Lithuania: Teachers - N=528; Latvia 1: Teachers - N=450; Latvia
2: IT teachers - N=152) Figure NR.1.
85.7%
68.0%
86.5%
93.8%
72.2%
80.7%
73.0%
63.6%
73.7%
85.7%
77.5%
88.3%
77.3%
65.1%
82.3%
66.7%
67.0%
80.1%
79.9%
66.3%
83.3%
86.8%
71.5%
90.9%
14.3%
32.0%
13.5%
6.3%
27.8%
19.3%
27.0%
36.4%
26.3%
14.3%
22.5%
11.7%
22.7%
34.9%
17.7%
33.3%
33.0%
19.9%
20.1%
33.7%
16.7%
13.2%
28.5%
9.1%
0% 10% 20% 30% 40% 50% 60% 70% 80% 90% 100%
Latvia 2
Latvia 1
Lithuania
Latvia 2
Latvia 1
Lithuania
Latvia 2
Latvia 1
Lithuania
Latvia 2
Latvia 1
Lithuania
Latvia 2
Latvia 1
Lithuania
Latvia 2
Latvia 1
Lithuania
Latvia 2
Latvia 1
Lithuania
Latvia 2
Latvia 1
Lithuania
City
Tow
nV
illag
eM
ale
Fem
ale
Pri
mar
ysc
hool
Sec
onda
rysc
hool
Gym
nasi
um
Yes No

ICT DEVELOPMENT IN EDUCATION IN THE BALTIC COUNTRIES – 2004-2005 28
In Latvia home computers most often are owned by teachers of social sciences
(80%), but less often – by elementary school teachers (44,4%), whereas in Lithuania
– by teachers of the humanities (86,3%) and art teachers (74,3%). If we compare
results among countries, then, irrespective of school subjects, Lithuania’s teachers
have a considerably higher computerization level in home (teachers of the
humanities for 19,9% more than those in Latvia have home computers, for 19,0%
more - teachers of natural sciences, and for 9,8% more - teachers of art). The only
exception is the social sciences, where Latvia’s teachers have almost caught up with
their Lithuanian colleagues.
Do you have a computer at home? (Lithuania: Teachers - N=528; Latvia 1: Teachers - N=450; Latvia 2:
IT teachers - N=152) Figure NR.2.
66.4%
86.3%
80.0%
83.0%
64.2%
83.2%
84.9%
64.5%
74.3%
44.4%
76.9%
83.9%
71.9%
88.9%
76.9%
70.5%
81.9%
80.4%
66.2%
88.6%
100.0%
48.0%
73.8%
33.6%
13.7%
20.0%
17.0%
35.8%
16.8%
15.1%
35.5%
25.7%
55.6%
23.1%
16.1%
28.1%
11.1%
23.1%
29.5%
18.1%
19.6%
33.8%
11.4%
52.0%
26.2%
0% 10% 20% 30% 40% 50% 60% 70% 80% 90% 100%
Latvia 1
Lithuania
Latvia 1
Lithuania
Latvia 1
Lithuania
Lithuania
Latvia 1
Lithuania
Latvia 1
Lithuania
Latvia 2
Latvia 1
Lithuania
Latvia 2
Latvia 1
Lithuania
Latvia 2
Latvia 1
Lithuania
Latvia 2
Latvia 1
Lithuania
Hu
man
ity
So
cial
scie
nce
Nat
ura
lsc
ien
ces
ITA
rts
Pri
mar
yed
uca
tio
n0-
5 ye
ars
6-15
yea
rs16
-30
year
s
Ped
ago
gic
alex
per
ien
ce31
+ ye
ars
Yes No

ICT DEVELOPMENT IN EDUCATION IN THE BALTIC COUNTRIES – 2004-2005 29
When analyzing the data on pupils both in Latvia and Lithuania, we can see that
most often the ones who have computers at home are:
- boys;
- pupils from large schools;
- secondary school pupils.
We can assume that in senior forms pupils have an increasing necessity to have a
computer at home, and their parents are trying to meet this necessity according to
their possibilities.
Do you have a computer at home? (Pupils: Latvia - N=1369; Lithuania - N=1133)
73.6%
69.20%
60.0%
57.30%
50.9%
54.40%
76.1%
64.70%
87.1%
72.80%
57.80%
57.70%
59.00%
68.10%
62.30%
61.1%
61.90%
58.3%
72.30%
76.7%
74.90%
88.5%
71.00%
26.3%
30.80%
40.0%
42.70%
48.9%
45.60%
23.9%
35.30%
12.9%
27.20%
42.20%
42.30%
41.00%
31.30%
37.70%
38.9%
38.10%
41.7%
27.70%
23.3%
25.10%
11.5%
29.00%
0% 10% 20% 30% 40% 50% 60% 70% 80% 90% 100%
Lithuania
Latvia
Lithuania
Latvia
Lithuania
Latvia
Lithuania
Latvia
Lithuania
Latvia
Latvia
Latvia
Latvia
Lithuania
Latvia
Lithuania
Latvia
Lithuania
Latvia
Lithuania
Latvia
Lithuania
Latvia
Mal
eF
emal
eP
rim
ary
sch
oo
lS
eco
nd
ary
sch
oo
lG
ymn
asiu
m5t
h6t
h7t
h8t
h
9th
10th
11th
12th
gra
de
Yes No

ICT DEVELOPMENT IN EDUCATION IN THE BALTIC COUNTRIES – 2004-2005 30
3.1.2. Access to Internet.
In Latvia at least half of the survey participants (50% of teachers, 51,1% of pupils,
54,4% of IT teachers, 63,2% of future teachers), who have indicated that they have a
home computer, also have access to the Internet and almost all the Internet users
have a permanent connection. In Lithuania 46,7% of teachers and 36,3% of pupils
have the Internet connection; in Estonia the percentages are 54% and 62%
respectively. In Lithuania 69,6% of teachers have the Internet with the permanent
connection.
If computerization was highest in Estonia, followed by Lithuania, and the last position
was taken by Latvia, then, speaking about the access to the Internet at home, Latvia
pulls ahead of Lithuania, taking the second position.
Do you have access to the internet at home?
54.0%
50.0%
46.7%
62.0%
51.1%
36.3%
54.5%
63.2%
46.0%
50.0%
53.3%
38.0%
48.9%
63.7%
45.5%
36.8%
0% 10% 20% 30% 40% 50% 60% 70% 80% 90% 100%
Estonia*
Latvia
Lithuania
Estonia*
Latvia
Lithuania
Latvia
Latvia
Teac
hers
Pup
ilsIT
teac
hers
Stu
dent
sof
peda
gogy
* "Tiger in Focus: Executive Summary" (2004)
Yes No

ICT DEVELOPMENT IN EDUCATION IN THE BALTIC COUNTRIES – 2004-2005 31
When analyzing the data by socially demographical showings, we can conclude that
the Internet access in public places (at schools etc.) would be particularly topical for
teachers of rural regions, because teachers, who live in the country, relatively less
often have the Internet at home. The said tendency can be observed both in Latvia
and in Lithuania. Most often the Internet is available for male teachers and city
people.
Do you have access to the internet at home? (Lithuania: Teachers - N=528; Latvia 1: Teachers - N=450; Latvia 2:
IT teachers - N=152) Figure NR.1.
54.2%
45.0%
56.3%
54.7%
32.0%
44.3%
38.5%
31.3%
53.3%
62.0%
33.3%
50.7%
53.7%
36.3%
47.1%
66.7%
22.0%
36.4%
74.1%
41.5%
54.7%
46.7%
25.0%
39.8%
37.0%
26.6%
22.8%
45.8%
55.0%
43.7%
45.3%
68.0%
55.7%
61.5%
68.8%
46.7%
38.0%
66.7%
49.3%
46.3%
63.7%
52.9%
33.3%
78.0%
63.6%
25.9%
58.5%
45.3%
53.3%
75.0%
60.2%
63.0%
73.4%
77.2%
0% 10% 20% 30% 40% 50% 60% 70% 80% 90% 100%
Latvia 2
Latvia 1
Lithuania
Latvia 2
Latvia 1
Lithuania
Latvia 2
Latvia 1
Lithuania
Latvia 2
Latvia 1
Lithuania
Latvia 2
Latvia 1
Lithuania
Latvia 2
Latvia 1
Lithuania
Latvia 2
Latvia 1
Lithuania
Latvia 2
Latvia 1
Lithuania
Latvia 2
Latvia 1
Lithuania
Mal
eFe
mal
e0-
5 ye
ars
6-15
yea
rs16
-30
year
s
Ped
agog
ical
expe
rien
ce31
+ ye
ars
City
Tow
nV
illag
e
Yes No

ICT
DE
VE
LOP
ME
NT
IN E
DU
CA
TIO
N IN
TH
E B
ALT
IC C
OU
NT
RIE
S –
200
4-20
05
32
Like
in t
he c
ase
of c
ompu
ters
, al
so in
the
cas
e of
the
Int
erne
t, ho
useh
olds
with
sch
ool a
ge c
hild
ren
mor
e of
ten
have
the
Int
erne
t, co
mpa
red
to
hous
ehol
ds w
ith n
o sc
hool
age
chi
ldre
n. O
n th
e w
hole
, onl
y 13
% o
f Lat
via’
s ho
useh
olds
hav
e th
e In
tern
et c
onne
ctio
n, w
here
as h
ouse
hold
s w
ith
scho
ol a
ge c
hild
ren
have
the
Int
erne
t in
18,
5% o
f ca
ses,
but
tho
se w
ith s
econ
dary
sch
ool a
ge c
hild
ren
– in
31,
6% o
f ca
ses.
(“L
atvi
an F
acts
”,
Om
nibu
s su
rvey
s).
Ho
use
ho
lds
with
...
13.1
%15
.3%
15.8
%13
.0%41
.4%
18.5
%
54.4
%58
.1%
30.7
%32
.0%
27.2
%29
.0%
0%25%
50%
75%
Jan
ua
ry 2
005
Fe
bru
ary
200
5M
arc
h 2
005
Ap
ril
2005
PC
all r
espo
nden
ts
Inte
rnet
acc
ess
resp
onde
nts
with
chi
ldre
n of
sch
ool a
geIn
tern
et a
cces
sal
l res
pond
ents
Inte
rnet
acc
ess
resp
onde
nts
with
chi
ldre
n of
SEC
ON
DA
RY
scho
ol a
ge
and
who
hav
e P
C
PC
resp
onde
nts
with
chi
ldre
n of
sch
ool a
ge
PC
resp
onde
nts
with
chi
ldre
n of
SEC
ON
DA
RY
scho
ol a
ge

ICT DEVELOPMENT IN EDUCATION IN THE BALTIC COUNTRIES – 2004-2005 33
If we compare the above mentioned data on Latvia with the information obtained
during the survey conducted in Lithuania, we can see that the tendency is the same:
the older a pupil is, the more often the household would have a computer with the
Internet connection. The Internet connection to a home computer more often is
available to pupils of large schools and secondary schools, as well as to boys more
often than to girls.
Is your home computer connected to the internet? (Pupils: Latvia - N=1369; Lithuania - N=1133)
40.5%
52.2%
31.7%
49.8%
21.6%
34.6%
40.7%
54.2%
64.3%
64.4%
40.0%
47.9%
48.1%
28.4%
54.9%
30.5%
49.2%
31.9%
57.8%
45.5%
57.7%
56.4%
59.2%
59.5%
47.8%
68.3%
50.2%
78.4%
65.4%
59.3%
45.8%
35.7%
35.6%
60.0%
52.1%
51.9%
71.6%
45.1%
69.5%
50.8%
68.1%
42.2%
54.5%
42.3%
43.6%
40.8%
0% 10% 20% 30% 40% 50% 60% 70% 80% 90% 100%
Lithuania
Latvia
Lithuania
Latvia
Lithuania
Latvia
Lithuania
Latvia
Lithuania
Latvia
Latvia
Latvia
Latvia
Lithuania
Latvia
Lithuania
Latvia
Lithuania
Latvia
Lithuania
Latvia
Lithuania
Latvia
Mal
eF
emal
eP
rim
ary
sch
oo
lS
eco
nd
ary
sch
oo
lG
ymn
asiu
m5t
h6t
h7t
h8t
h
9th
10th
11th
12th
gra
de
Yes No

ICT DEVELOPMENT IN EDUCATION IN THE BALTIC COUNTRIES – 2004-2005 34
It should be indicated additionally that in Estonia public internet facilities (including
school PCs) are more important for rural children than for urban children. (“Tiger in
Focus: Executive Summary”, 2004). Hypothetically we can assume that rural children
relatively less often have a home computer and the Internet at home that is why it is
important to preserve their access at school or other public places.
Access to computers outside home and school shall be evaluated as very high. In
Latvia only 17,7% of the surveyed teachers have admitted that they have no access
to computer. But the percentage of such pupils in Latvia was only 8,2%, in Lithuania
– 8,3% and Estonia – 3%.
Most future teachers (65,3%) and pupils (58,8%) outside their home and educational
institutions most often have access to computers when visiting their friends. But
teachers, answering the question on access to computers, most often mentioned an
alternative answer – ‘a public library’ (44,0%). Also Lithuanian pupils, as well as
Latvians, most often outside their home have access to computers when visiting their
friends (67,9%).
Do you have access to a computer somewhere else than in school and at
home?Multiple question
44.0%
13.8%
34.2%
9.9%
10.9%
39.6%
58.4%
65.3%
23.2%
32.6%
30.7%
58.8%
15.8%
40.2%
32.5%
67.9%
3.8%
0% 20% 40% 60% 80%
At kin
At parents’ home
At work
At parent's work
In public library
In Internet cafe
At friends’ home
Pupils LithuaniaPupils LatviaStudents of pedagogy LatviaTeachers Latvia

ICT DEVELOPMENT IN EDUCATION IN THE BALTIC COUNTRIES – 2004-2005 35
3.2. Usage of ICT in education
Respondents within the quantitative study in Latvia and Lithuania (teachers, future
teachers and pupils) were asked the following question: “How often do you use a
computer for educational or leisure needs?”
In Latvia most actively computers are used by future teachers: 73,3% use them both
at school and university. A similar situation can be observed regarding approximately
one third of the surveyed teachers and pupils.
The data obtained during the Estonian study (“Tiger in Focus: Executive Summary”
2004) show that the time spent on PCs in school remained at the previous level
whereas out-of-school use of ICT increased significantly. It should be explained as
follows: – the time that students spend learning with computers in the classroom
depends on multiple factors. The study revealed that the number of computers, the
supportive attitudes of students and teachers, and ICT competence are not enough
to increase the implementation of ICT. The teaching regulations laid down by the
national curriculum impose strict limits on the study process. As a result of a rigid
curriculum the average amount of time per week that children use PCs in schools
remained unchanged. At the same time out-of-school usage increased significantly.
The portion of frequent users is higher among boys, but girls show are marked
increase across all time-span categories when compared to the girls’ data from
survey 2000.

ICT DEVELOPMENT IN EDUCATION IN THE BALTIC COUNTRIES – 2004-2005 36
3.2.1. Usage of PC at home.
In Latvia computers during studies/ during the lesson preparation process every day,
one or several times a week are used by more than half of the surveyed respondents
– the provided answers are from 58,3% regarding pupils to 72,1% regarding teachers
and to 71,2% regarding future teachers.
In Lithuania 74,6% of teachers regularly use computers at home, in order to prepare
for their work. Pupils more often use home computers for entertainment and not for
studies - 68,9% and 48,8% respectively.
How often do you use a computer at home for educational or leisure needs?
(N=teachers+students of pedagogy+pupils who have computers at home)
15.7%
24.1%
20.1%
35.7%
33.1%
47.1%
52.0%
38.9%
8.0%
6.0%
11.9%
9.1%
19.4%
11.5%
11.1%
10.5%
10.1%
1.8%
9.4%
5.7%
4.7%
2.0%
6.4%
3.4%
4.5%
20.2%
1.1%
2.7%
12.9%
49.9%
20.8%
19.0%
37.5% 8.4%
2.3%
22.3%
0.4%
0% 10% 20% 30% 40% 50% 60% 70% 80% 90% 100%
Latvia
Lithuania (forleisure needs)
Lithuania (foreducational
needs)
Latvia
Latvia
Lithuania
Pup
ils
Stu
dent
sof
peda
gogy
Teac
hers
Every day Once ar a few times every week Every second weekA few times every month A few times every trimester More seldomNever NA/DK

ICT DEVELOPMENT IN EDUCATION IN THE BALTIC COUNTRIES – 2004-2005 37
Regarding pupils, more active computer users for studies both in Latvia and
Lithuania are girls. But boys more often use computers for entertainment – see the
Chart on the next page.
In Lithuania, starting with Form 10, there is a relatively increasing number of the pupils,
who use computers for studies and not for having a rest or entertainment. Although
even up to Form 12 there is a prevalence of the users, who use computers for
entertainment, however, this prevalence with each Form is decreasing and reaching
the last Form of secondary school, it has become quite small: only for 3,6% more is
the number of the pupils, who at home use a computer for entertainment every day or
one/ several times a week.
A computer at home is mostly used for educational needs by the students from
gymnasiums, and it is least used for educational purposes by the students from basic
schools. Being aware that students from gymnasiums have more computers than
students from basic and secondary school, it could be claimed that the frequency of
home computer’s usage for educational needs directly proportional to the number of
students having computers at home while comparing them according to the type of
school, in which they learn. (Quantitative research, Lithuania)

ICT DEVELOPMENT IN EDUCATION IN THE BALTIC COUNTRIES – 2004-2005 38
How often do you use a computer at home for educational or leisure needs? (N=pupils who have computers at home)
20.3%
20.7%
36.2%
10.7%
15.8%
38.5%
12.0%
21.5%
55.3%
16.9%
25.0%
65.3%
22.6%
14.9%
13.9%
23.0%
17.4%
46.0%
16.8%
23.0%
45.4%
13.5%
25.8%
46.5%
14.4%
27.0%
57.9%
17.6%
23.8%
57.1%
19.2%
32.8%
39.0%
22.5%
33.6%
41.1%
19.7%
22.3%
38.2%
18.9%
36.3%
33.4%
17.4%
53.6%
42.3%
26.7%
35.3%
36.9%
24.8%
23.4%
41.3%
21.2%
32.1%
34.4%
14.3%
23.9%
36.5%
17.1%
41.9%
46.2%
24.7%
59.0%
8.2%
7.4%
9.2%
8.6%
11.4%
7.3%
7.5%
10.8%
7.1%
5.5%
8.8%
8.5%
9.9%
6.4%
19.2%
14.2%
11.9%
19.3%
10.5%
9.0%
19.2%
10.9%
9.9%
22.0%
14.4%
12.5%
4.6%
13.3%
8.0%
13.8%
10.9%
24.8%
11.9%
7.7%
18.6%
19.5%
10.3%
20.6%
16.1%
8.2%
17.6%
10.8%
12.8%
11.4%
11.1%
8.5%
7.6%
10.3%
11.4%
9.8%
9.7%
10.9%
11.5%
12.3%
11.3%
14.6%
8.7%
9.9%
10.9%
10.5%
7.3%
6.8%
6.9%
1.3%
5.1%
7.3%
8.5%
6.4%
4.4%
6.9%
14.5%
7.0%
7.2%
5.6%
26.6%
28.7%
6.3%
31.0%
35.2%
15.2%
9.1%
12.1%
7.0%
14.6%
20.4%
24.2%
25.9%
27.2%
30.7%
16.1%
62.4%
21.0%
15.9%
36.3% 8.6%
10.4%
7.2%
1.4%
3.6%
0.6%
2.7%
0.9%
1.7%
1.5%
3.6%
10.2%
2.2%
1.8%
2.3%
2.2%
5.4%
3.9%
6.5%
15.4%
1.5%
5.2%
14.4%
3.6%
16.6%
3.8%
0.8%
2.0%
2.1%
7.7%
9.6%
3.5%
13.8%
3.6%
0% 10% 20% 30% 40% 50% 60% 70% 80% 90% 100%
Latvia
Lithuania (for leisure needs)
Lithuania (for educational needs)
Latvia
Lithuania (for leisure needs)
Lithuania (for educational needs)
Latvia
Lithuania (for leisure needs)
Lithuania (for educational needs)
Latvia
Lithuania (for leisure needs)
Lithuania (for educational needs)
Latvia
Lithuania (for leisure needs)
Lithuania (for educational needs)
Latvia
Latvia
Latvia
Latvia
Lithuania (for leisure needs)
Lithuania (for educational needs)
Latvia
Lithuania (for leisure needs)
Lithuania (for educational needs)
Latvia
Lithuania (for leisure needs)
Lithuania (for educational needs)
Latvia
Lithuania (for leisure needs)
Lithuania (for educational needs)
Latvia
Lithuania (for leisure needs)
Lithuania (for educational needs)
Mal
eFe
mal
eP
rim
ary
scho
olS
econ
dary
scho
olG
ymna
sium
5th
6th
7th
8th
9th
10th
11th
12th
gra
de
Every day Once ar a few times every week Every second weekA few times every month A few times every trimester More seldomNever

ICT DEVELOPMENT IN EDUCATION IN THE BALTIC COUNTRIES – 2004-2005 39
In Latvia for the lesson preparation at home computers more often are used by male
teachers and teachers from secondary school with 0-5 years of pedagogical
experience, but in Lithuania – by female teachers from gymnasium with 6-15 years of
experience.
How often do you use a computer at home for work (in school) needs? (N=teachers who have computers at home) Figure NR.1.
36.1%
13.2%
51.1%
14.1%
33.1%
16.7%
35.9%
12.3%
25.7%
8.0%
29.0%
12.2%
39.2%
17.2%
43.2%
10.7%
39.3%
33.9%
34.1%
32.8%
40.3%
35.6%
43.1%
37.7%
35.6%
20.0%
39.2%
36.6%
38.1%
32.8%
40.0%
32.0%
3.7%
4.7%
5.3%
4.0%
3.7%
6.8%
12.7%
2.5%
10.0%
7.8%
5.7%
7.8%
12.2%
6.8%
9.0%
7.4%
13.9%
8.0%
11.5%
5.2%
9.3%
8.2%
10.5%
10.7%
2.9%
1.7%
2.9%
4.7%
0.7%
3.8%
3.0%
4.0%
4.0%
2.8%
1.5%
3.7%
1.1%
2.9%
5.0%
6.3%
0.8%
12.7%
12.9%
9.1%
13.7%
9.0%
20.8%
17.5%
11.9%
22.5%
34.9%
28.1%
29.5%
33.8%
52.0%
37.6%
29.1%
32.0%
34.3%
15.0%
37.3%
40.0%
2.8%
2.9%
7.5%
2.8%
2.0%
5.0%
1.0%
2.2%
2.8%
2.0%
2.0%
2.0%2.0%
2.0%
1.5%
1.6%
1.7%
2.5%
3.9%
3.0%
5.3%
0% 10% 20% 30% 40% 50% 60% 70% 80% 90% 100%
Lithuania
Latvia
Lithuania
Latvia
Lithuania
Latvia
Lithuania
Latvia
Lithuania
Latvia
Lithuania
Latvia
Lithuania
Latvia
Lithuania
Latvia
Lithuania
Latvia
Mal
eFe
mal
e0-
5 ye
ars
6-15
yea
rs16
-30
year
s
Ped
agog
ical
expe
rien
ce31
+ ye
ars
Pri
mar
ysc
hool
Sec
onda
rysc
hool
Gym
nasi
um
Every day Once ar a few times every week Every second weekA few times every month A few times every trimester More seldomNever NA/DK

ICT DEVELOPMENT IN EDUCATION IN THE BALTIC COUNTRIES – 2004-2005 40
3.2.2. Usage of PC in school and university.
Both in Latvia and Lithuania pupils most often use computers in order to prepare for
the humanities, they are followed by the sciences, most of which are related to
learning IT. A similar situation can be observed regarding the Internet usage by
pupils.
During classes or lectures computers are regularly used by 79,3% of pupils in
Lithuania and by 58,3% in Latvia. The percentages regarding teachers are 30% and
13,3% respectively. Future teachers in Latvia during lectures regularly use computers
in 41,6% of cases.
How often do you use a computer during lessons in school/university?
8.9%
18.6%
4.4%
8.8%
20.8%
32.7%
11.4%
8.9%
70.5%
37.5%
4.0%
8.4%
19.8%
12.6%
5.6%
10.2%
11.9%
15.8%
32.5%
11.6%
10.1%
8.9%
18.9%
2.4%
6.4%
9.9%
24.8%
47.1%
3.6%
2.0%
4.5%
5.3%
0% 10% 20% 30% 40% 50% 60% 70% 80% 90% 100%
Latvia (N=101)
Lithuania(N=528)
Latvia (N=450)
Lithuania(N=1133)
Latvia (N=1369)
Stu
dent
sof
peda
cogy
Teac
hers
Pup
ils
Every day Once or a few times every week Every second weekA few times every month A few times every trimester More seldomNever I do not know

ICT DEVELOPMENT IN EDUCATION IN THE BALTIC COUNTRIES – 2004-2005 41
Both in Latvia and Lithuania regarding pupils a more active computer usage during
classes can be observed in the oldest forms and in the largest schools, as well as
speaking about girls.
How often do you use a computer during lessons in school?
(Pupils: Latvia - N=1369; Lithuania - N=1133)
11.4%
21.0%
6.1%
20.7%
4.3%
15.8%
9.4%
21.5%
20.0%
25.0%
13.9%
4.9%
6.1%
23.0%
6.2%
25.8%
10.8%
27.0%
29.5%
23.8%
66.8%
36.3%
74.7%
39.0%
67.7%
41.1%
72.9%
38.2%
72.4%
33.4%
42.3%
26.7%
35.3%
25.7%
36.9%
71.5%
41.3%
83.2%
34.4%
81.3%
36.5%
59.0%
46.2%
8.6%
8.2%
7.4%
9.2%
8.6%
11.4%
7.3%
7.5%
10.8%
7.1%
5.5%
8.8%
8.5%
10.5%
9.9%
9.6%
14.2%
14.0%
10.5%
10.9%
4.1%
14.4%
4.6%
13.3%
8.0%
22.9%
13.8%
14.6%
11.9%
6.9%
19.5%
16.1%
3.8%
10.8%
2.4%
11.4%
1.7%
8.5%
2.7%
10.3%
2.1%
9.8%
10.2%
10.9%
11.5%
12.3%
9.0%
11.3%
1.4%
8.7%
10.9%
1.4%
7.3%
6.9%
7.3%
5.4%
8.5%
6.4%
4.4%
6.9%
14.5%
7.0%
10.4%
7.2%
5.6%
3.9%
2.2%
2.3%
5.2%
7.2%
6.3%
4.7%
9.1%
12.1%
7.0%
25.7%
0.0%
6.4%
14.9%
23.0%
17.4%
4.2%
8.1%
0.6%
3.1%
2.6%
2.2%
1.3%
1.0%
0.9%
1.7%
1.9%
1.8%
5.4%
5.2%
3.6%
3.6%
1.8%
3.5%
2.1%
3.7%
2.0%
1.6%
0.7%
1.5%
0.8%
0% 10% 20% 30% 40% 50% 60% 70% 80% 90% 100%
Lithuania
Latvia
Lithuania
Latvia
Lithuania
Latvia
Lithuania
Latvia
Lithuania
Latvia
Latvia
Latvia
Latvia
Lithuania
Latvia
Lithuania
Latvia
Lithuania
Latvia
Lithuania
Latvia
Lithuania
Latvia
Mal
eF
emal
eP
rim
ary
sch
oo
lS
eco
nd
ary
sch
oo
lG
ymn
asiu
m5t
h6t
h7t
h8t
h
9th
10th
11th
12th
gra
de
Every day Once ar a few times every week Every second weekA few times every month A few times every trimester More seldomNever I do not know

ICT DEVELOPMENT IN EDUCATION IN THE BALTIC COUNTRIES – 2004-2005 42
Male teachers much more often than female teachers use a computer during lessons
at school – it is proven by the data obtained during the Latvia’s and Lithuania’s
quantitative studies:
How often do you use a computer during lessons in school?
(Teachers: Latvia - N=450; Lithuania - N=528) NR.1.
39.8%
12.5%
13.5%
3.7%
22.2%
6.0%
14.9%
9.6%
3.7%
7.8%
4.5%
3.9%
11.1%
2.0%
11.2%
17.5%
11.5%
8.0%
8.2%
7.5%
16.9%
13.5%
11.7%
5.9%
6.3%
12.9%
10.6%
12.8%
7.8%
13.1%
12.0%
15.0%
2.4%
1.5%
8.3%
4.7%
3.1%
3.8%
3.4%
4.0%
8.2%
15.0%
13.8%
9.6%
11.5%
7.9%
14.1%
14.4%
6.8%
11.6%
11.1%
6.0%
19.4%
5.0%
35.8%
12.2%
30.0%
35.7%
8.3%
36.5%
13.6%
29.4%
9.4%
25.9%
9.8%
33.5%
12.7%
44.4%
14.0%
12.5%
19.5%
18.0%
30.6%
17.8%
15.6%
19.7%
20.1%
16.0%
22.5%
30.0%
53.0%
13.6%
12.9%
53.1%
27.3%
44.7%
12.2%
19.4%
37.6%
4.9%
4.7%
4.0%
4.6%
18.8%
10.0%
46.0%
20.2%
47.1%
29.9%
40.7%
28.8%
49.5%
52.8%
25.3%
21.4%
0% 10% 20% 30% 40% 50% 60% 70% 80% 90% 100%
Lithuania
Latvia
Lithuania
Latvia
Lithuania
Latvia
Lithuania
Latvia
Lithuania
Latvia
Lithuania
Latvia
Lithuania
Latvia
Lithuania
Latvia
Lithuania
Latvia
Mal
eF
emal
eC
ity
To
wn
Vill
age
0-5
year
s6-
15 y
ears
16-3
0 ye
ars
Ped
ago
gic
alex
per
ien
ce31
+ ye
ars
Every day Once ar a few times every week Every second weekA few times every month A few times every trimester More seldomNever

ICT DEVELOPMENT IN EDUCATION IN THE BALTIC COUNTRIES – 2004-2005 43
Latvian and Lithuanian schools are more or less provided with computers; therefore,
pedagogues who even do not have a computer at home have possibility to work with
it at school.
Outside classes school computers are used by teachers much more actively than
during classes (in Latvia - 58,9%; +45,6%; in Lithuania – 63,5%; +33,5%). In Latvia
also future teachers are active at using computers between lectures – 52,5%. But
Latvia’s pupils outside classes use school computers much less often than during
classes – 33,6% (-24,7%).
How often do you use a computer in school beside lessons?(N=teachers+students of pedagogy+pupils)
34.3% 29.2%
14.7%
8.0%
15.8%
9.5%
30.7%
36.6%
24.1%
28.2%
4.0%
5.3%
6.1%
20.8%
6.3%
11.8%
15.3%
8.9%
6.5%
9.1%
13.1%
6.4%
5.9% 7.9%
8.2%
32.2%
0% 10% 20% 30% 40% 50% 60% 70% 80% 90% 100%
Latvia (N=2169)
Latvia (N=101)
Latvia (N=450)
Lithuania (N=5283)
Pup
ils
Stu
dent
s o
fpe
dag
ogy
Teac
hetr
s
Every day Once ar a few times every week Every second weekA few times every month A few times every trimester More seldomNever NA/DK

ICT DEVELOPMENT IN EDUCATION IN THE BALTIC COUNTRIES – 2004-2005 44
In the study conducted in Estonia (“Tiger in Focus”: Executive Summary, 2004) a
different methodology was used, that is why it would not be correct to compare the
obtained data with the Latvia’s and Lithuania’s results. However, it is worth to mark
illustratively the main findings of the Estonia’s study that school computers have
become more accessible to pupils beside lessons. 47% of pupils can use computers
after class, although they must obtain permission for this. Without permission 32% of
pupils can access computers during breaks and 42% after class. Findings revealed
that access is more strictly controlled in Russian-speaking- schools, where 67% of
pupils must ask for special permission. Over the four-year period, students in
Estonian urban schools became less interested in the option of using school
computers, while in Russian-speaking schools the opposite trend was observed. In
rural schools pupils remain very interested in using computers outside class-time –
only 9% expressed no interest in this.
Junior and male teachers use computer beside lessons more often than elder ones.
Quite evident differences between the residents of town and city and residents of
village are noted on this point in Lithuania. A computer is used every day or several
times a week by 50 percent of teachers from village while this number for the
resident of city and town respectively comprises 63 and 68 percent. (see the Chart
on the next page)

ICT DEVELOPMENT IN EDUCATION IN THE BALTIC COUNTRIES – 2004-2005 45
How often do you use a computer in school beside lessons? (N=teachers) Figure NR.1.
31.0%
30.0%
37.7%
33.0%
31.6%
38.9%
22.0%
27.1%
58.6%
32.8%
38.6%
31.8%
24.1%
30.9%
24.8%
24.0%
29.7%
27.8%
25.9%
22.5%
36.1%
16.7%
28.0%
35.5%
25.3%
32.8%
31.4%
24.2%
33.5%
31.4%
23.8%
20.0%
5.4%
5.5%
8.3%
7.8%
3.9%
4.0%
7.9%
17.2%
11.7%
14.4%
10.5%
16.8%
16.7%
16.0%
12.1%
9.2%
7.8%
7.9%
11.4%
20.0%
12.3%
21.8%
16.0%
9.9%
14.0%
9.8%
14.4%
9.5%
9.0%
5.6%
18.0%
2.3%
4.7%
14.3%
14.7%
9.3%
19.8%
12.0%
6.5%
5.6%
6.9%
8.1%
7.5%
6.5%
16.0%
7.9%
7.6%
37.5%
47.5%
32.5%
27.7%
5.0%
4.7%
6.8%
12.5% 2.5%
9.3%
9.8%
2.5%
4.7%
6.8%
6.5%
6.1%
5.9%
12.0%
4.6%
9.8%
9.9%
6.4%
12.0%
7.5%
8.5%
12.5%
8.3%
4.7%
9.4%
0% 10% 20% 30% 40% 50% 60% 70% 80% 90% 100%
Lithuania
Latvia
Lithuania
Latvia
Lithuania
Latvia
Lithuania
Latvia
Lithuania
Latvia
Lithuania
Latvia
Lithuania
Latvia
Lithuania
Latvia
Lithuania
Latvia
Mal
eFe
mal
eC
ityTo
wn
Vill
age
0-5
year
s6-
15 y
ears
16-3
0 ye
ars
Ped
agog
ical
expe
rien
ce31
+ ye
ars
Every day Once ar a few times every week Every second weekA few times every month A few times every trimester More seldomNever

ICT DEVELOPMENT IN EDUCATION IN THE BALTIC COUNTRIES – 2004-2005 46
Computers at school beside the lessons are more often used by teachers of
informatics (Lithuania), social sciences (Latvia) and more seldom by specialists of
basic education (Lithuania). The usage of school computers of beside lessons
depends on the type of school. In Lithuania teachers working in gymnasiums use
computers more often than teachers of basic and secondary schools.
How often do you use a computer in school beside lessons? (N=teachers) Figure NR.2.
32.7%
37.3%
53.6%
26.2%
24.5%
29.7%
34.0%
30.0%
25.8%
33.1%
84.9%
12.5%
25.8%
4.2%
33.3%
28.6%
26.6%
27.6%
27.8%
27.2%
27.9%
30.2%
30.2%
35.0%
35.1%
23.2%
13.7%
37.5%
32.3%
50.0%
33.3%
28.6%
5.2%
6.8%
4.7%
6.0%
11.1%
14.3%
16.8%
13.6%
15.6%
9.7%
11.3%
20.4%
12.9%
13.2%
15.0%
15.9%
11.9%
1.4%
15.6%
25.0%
15.9%
14.1%
7.5%
5.2%
7.8%
15.6%
15.1%
15.2%
10.6%
6.5%
4.2%
11.1%
28.6%
7.0%
6.0%
11.1%
7.9%
11.1%
11.6%
7.5%
7.9%
3.1%
27.1%
28.6%
32.2%
29.1%
3.2%
5.0%
4.7%
10.7%
6.5%
8.2%
31.3%
5.0%
10.8%
6.8%
9.7%
5.2%
7.3%
2.1%
16.1%
7.9%
10.0%
8.2%
14.6%
7.5%
6.1%
16.7%
0% 10% 20% 30% 40% 50% 60% 70% 80% 90% 100%
Lithuania
Latvia
Lithuania
Latvia
Lithuania
Latvia
Lithuania
Latvia
Lithuania
Latvia
Lithuania
Latvia
Lithuania
Lithuania
Latvia
Lithuania
Latvia
Latvia
Pri
mar
ysc
hool
Sec
onda
rysc
hool
Gym
nasi
umH
uman
ityS
ocia
ls
cien
ceN
atur
alsc
ienc
esIT
Art
s P
rim
ary
educ
atio
nO
ther
Every day Once ar a few times every week Every second weekA few times every month A few times every trimester More seldomNever

ICT DEVELOPMENT IN EDUCATION IN THE BALTIC COUNTRIES – 2004-2005 47
3.2.3. Usage of Internet.
In Latvia 68,3% of future teachers and 50,4% of pupils regularly (every day or several
days a week) use the Internet for their studies at school, university or home. In
Lithuania pupils regularly use the Internet at school (42%), but 29,2% – at home.
Teachers in Latvia and Lithuania regularly use the Internet for studies in 38,7% and
26,7% of cases respectively.
It should be noted that the Internet usage in teaching is one of the research’s
questions, which are mostly determined by the social-demographic factors.
Internet is used in teaching more (see the Chart on the next page):
- by junior teachers having less experience of pedagogical work;
- more by the teachers from city (Lithuania) or town (Latvia) than the teachers
from village;
- more by male than female teachers.
How often do you use internet for learning needs/ teaching?(N=teachers+pupils+students of pedagogy)
3.3%
16.8%
11.6%
9.1%
38.7%
51.5%
27.1%
17.6%
8.9%
5.3%
25.4%
5.0%
12.4% 16.0%
22.1%
10.3%
12.9%
18.9%
37.5% 7.5%
14.8%
9.8%
28.0%
10.9%
12.0%
25.8%
5.7%
9.8%
15.5%
4.0%
14.9%
7.0%
2.0%
50.2%
14.6%
14.5%
0% 10% 20% 30% 40% 50% 60% 70% 80% 90% 100%
Latvia
Lithuania (athome)
Lithuania (atschool)
Latvia
Latvia
Lithuania
Pup
ils
Stu
dent
sof
peda
gogy
Teac
hers
Every day Once ar a few times every week Every second weekA few times every month A few times every trimester More seldomNever NA/DK

ICT DEVELOPMENT IN EDUCATION IN THE BALTIC COUNTRIES – 2004-2005 48
-
How often do you use the internet in teaching? (N=teachers who have computers at home) Figure NR.1.
6.9%
10.2%
10.6%
12.0%
7.3%
16.7%
6.1%
10.3%
14.0%
12.5%
12.4%
14.4%
7.5%
9.8%
3.1%
10.0%
15.3%
26.8%
18.8%
27.0%
18.5%
25.0%
8.2%
27.6%
25.6%
28.1%
17.5%
26.5%
13.0%
27.9%
17.5%
24.0%
5.1%
6.0%
2.8%
7.8%
5.4%
4.0%
15.0%
10.0%
28.4%
12.2%
26.3%
11.0%
29.1%
13.9%
12.2%
12.6%
30.2%
10.9%
26.3%
13.6%
27.3%
11.8%
19.6%
10.0%
16.0%
27.9%
15.4%
21.8%
15.5%
29.1%
19.4%
34.7%
17.4%
12.5%
25.5%
28.0%
17.2%
29.9%
22.0%
7.5%
9.5%
13.9%
24.0%
21.5%
22.5%
15.9%
38.8%
12.8%
18.2%
15.9%
24.2%
18.0%
25.0%
27.0%
30.0%
4.5%
5.1%
7.5%
9.8%
13.6%
10.0%
8.0%
12.7%
14.4%
15.0%
12.9%
10.9% 17.2%
15.4%
8.3%
18.0%
16.6%
10.0%
22.0%
14.2%
29.9%
0% 10% 20% 30% 40% 50% 60% 70% 80% 90% 100%
Lithuania
Latvia
Lithuania
Latvia
Lithuania
Latvia
Lithuania
Latvia
Lithuania
Latvia
Lithuania
Latvia
Lithuania
Latvia
Lithuania
Latvia
Lithuania
Latvia
Mal
eFe
mal
eC
ityTo
wn
Vill
age
0-5
year
s6-
15 y
ears
16-3
0 ye
ars
Ped
agog
ical
expe
rien
ce31
+ ye
ars
Every day Once ar a few times every week Every second weekA few times every month A few times every trimester More seldomNever DK/NA

ICT DEVELOPMENT IN EDUCATION IN THE BALTIC COUNTRIES – 2004-2005 49
It should be noted that Internet in teaching is used more by teachers working in
gymnasiums (Lithuania) or secondary schools (Latvia) than the teachers working in
primary schools. The Internet is most widely used by the teachers of informatics
(Lithuania); and of social as well as natural sciences (Latvia).
How often do you use the internet in teaching? (N=teachers who have computers at home) Figure NR.2.
7.0%
17.9%
18.8%
9.7%
3.4%
10.8%
3.9%
10.0%
2.7%
13.9%
39.7%
6.9%
6.5%
11.1%
14.3%
18.7%
31.3%
20.8%
24.3%
9.6%
25.9%
21.6%
30.0%
12.8%
27.8%
39.7%
13.8%
32.3%
15.0%
22.2%
28.6%
4.5%
7.8%
6.9%
2.6%
22.2%
23.3%
13.1%
27.8%
9.0%
27.1%
33.6%
12.5%
35.3%
10.0%
25.5%
11.9%
11.0%
27.6%
20.0%
30.5%
21.9%
16.4%
20.8%
16.5%
28.8%
21.6%
34.9%
15.2%
6.8%
6.5%
11.1%
14.3%
16.4%
11.6%
11.1%
24.3%
24.6%
12.5%
24.7%
17.6%
24.2%
31.0%
1.9%
0.4%
0.7%
11.1%
8.5%
6.7%
25.8%
15.2%
4.7%
10.0%
16.1%
13.6%
13.1%
15.0%
20.7%
15.9%
12.6%
9.0%
10.0%
42.9%
12.9%
8.7%
2.7%
11.1%
65.0%
17.8%
11.9%
17.5%
15.9%
15.0%
15.2%
25.8%
0.5%
0% 10% 20% 30% 40% 50% 60% 70% 80% 90% 100%
Lithuania
Latvia
Lithuania
Latvia
Lithuania
Latvia
Lithuania
Latvia
Lithuania
Latvia
Lithuania
Latvia
Lithuania
Lithuania
Latvia
Lithuania
Latvia
Latvia
Pri
mar
ysc
hool
Sec
onda
rysc
hool
Gym
nasi
umH
uman
ityS
ocia
lsc
ienc
eN
atur
alsc
ienc
esIT
Art
s P
rim
ary
educ
atio
nO
ther
Every day Once ar a few times every week Every second weekA few times every month A few times every trimester More seldomNever DK/NA

ICT DEVELOPMENT IN EDUCATION IN THE BALTIC COUNTRIES – 2004-2005 50
In pupils audience Internet for learning is mostly used in the city and it is used least in
village since the number of computers and the number of Internet access in village
are also less than in a city/town.
In Lithuania the usage of computer during the lessons depends on the grade of a
pupil. The pupils use computers mostly during the lessons of informatics. Informatics
is scheduled in the plans of teaching as a compulsory subject in grades from 9 to 11.
However, it is optional in the 8th grade, therefore, computers are used less
frequently. The usage of a computer in the 12th grade decreases since informatics is
used only by those who are going to pass the exam of informatics.
The Chart on the next page shows how pupils use a computer at home for
educational needs. It should be noted that although the informatics is not studied in
the 8th grade in Lithuania, pupils use a computer in similar manner as in 9th and 10th
grade, where informatics is already studied. A home computer is started to be used
more intensively for educational needs in the 11th and 12th grades.
In Latvia, starting from Form 9, there is a constantly increasing number of the pupils,
who use the Internet for educational needs (see the Chart on the next page).

ICT DEVELOPMENT IN EDUCATION IN THE BALTIC COUNTRIES – 2004-2005 51
How often do you use internet for learning needs? (Pupils: Latvia - N=1369; Lithuania - N=1133)
3.8%
12.2%
8.4%
2.7%
7.5%
6.8%
0.8%
14.3%
9.3%
3.3%
18.4%
22.8%
10.2%
7.9%
7.3%
13.2%
10.5%
5.1%
2.1%
12.8%
7.3%
1.0%
18.1%
10.0%
1.9%
21.3%
12.7%
6.0%
20.2%
20.8%
6.5%
37.8%
37.1%
15.0%
39.7%
36.6%
9.6%
35.5%
39.2%
22.6%
38.6%
36.7%
32.9%
48.8%
36.3%
22.7%
40.4%
41.9%
16.9%
23.2%
34.4%
16.0%
38.1%
41.2%
13.7%
38.5%
42.1%
23.6%
43.5%
48.6%
33.8%
51.9%
7.9%
6.9%
7.0%
8.7%
7.6%
4.9%
6.9%
6.7%
8.1%
9.0%
9.3%
8.7%
8.2%
13.8%
30.1%
11.4%
16.0%
25.9%
7.9%
12.4%
28.5%
10.3%
16.9%
28.4%
11.8%
25.9%
5.9%
10.1%
6.3%
10.5%
15.4%
26.8%
11.1%
15.6%
28.3%
15.3%
16.2%
28.8%
13.7%
14.2%
28.6%
8.7%
26.0%
8.5%
12.3%
11.0%
18.8%
9.6%
14.6%
10.1%
18.7%
4.6%
11.9%
8.2%
10.2%
25.4%
14.3%
12.6%
10.2%
16.7%
8.2%
13.8%
8.2%
2.6%
10.4%
7.9%
8.6%
6.8%
5.2%
9.2%
10.8%
9.5%
6.1%
7.1%
55.5%
12.9%
21.7%
65.3%
20.6%
11.1%
27.4%
30.4%
14.8%
53.7%
22.5%
57.3%
19.9%
52.6%
14.1%
8.1%
13.7%
12.2%
37.9%
22.5%
7.0%
15.6%
9.1%
5.9%
7.2%
9.7%
7.8%
3.8%
7.6%
6.3%
5.2%
1.2%
8.8%
5.1%
3.4%
6.1%
3.3%
1.6%
2.3%
10.9%
44.0%
9.0%
27.5%
7.2%
12.8%
11.1%
2.2%
5.2%
16.1%
13.1%
45.3%
15.9%
2.2%
44.4%
33.8%
0% 10% 20% 30% 40% 50% 60% 70% 80% 90% 100%
Latvia
Lithuania (at home)
Lithuania (at school)
Latvia
Lithuania (at home)
Lithuania (at school)
Latvia
Lithuania (at home)
Lithuania (at school)
Latvia
Lithuania (at home)
Lithuania (at school)
Latvia
Lithuania (at home)
Lithuania (at school)
Latvia
Latvia
Latvia
Latvia
Lithuania (at home)
Lithuania (at school)
Latvia
Lithuania (at home)
Lithuania (at school)
Latvia
Lithuania (at home)
Lithuania (at school)
Latvia
Lithuania (at home)
Lithuania (at school)
Latvia
Lithuania (at home)
Lithuania (at school)
Mal
eFe
mal
eP
rim
ary
scho
olS
econ
dary
scho
olG
ymna
sium
5th
6th
7th
8th
9th
10th
11th
12th
gra
de
Every day Once ar a few times every week Every second weekA few times every month A few times every trimester More seldomNever NA/DK

ICT DEVELOPMENT IN EDUCATION IN THE BALTIC COUNTRIES – 2004-2005 52
When asked on how respondents learn about the Internet homepages, where they
can obtain the necessary information for their studies, they as an information source
most often mentioned their friends (69,2% of pupils in Latvia, 63,3% - in Lithuania
and 62,4% of future teachers in Latvia). Approximately one third of students admit
that they look for the necessary information themselves, using the Internet browsers
(pupils in Latvia – only 13,8%), whereas family members are a more significant
source of information in the case of pupils.
The boys find out about the useful websites for learning from elsewhere (other
websites and alike) more frequently than girls who find out this information from
teachers and friends (Quantitative research Lithuania).
How do you find out about the websites where the useful information for your learning is?Multiple question
2.0%
60.4%
62.4%
7.1%
38.2%
63.3%
13.8%
15.2%
41.6%
69.2%
35.6%
0% 20% 40% 60% 80%
Internet search programm
From family members
From teachers
From friends
Pupils LatviaPupils LithuaniaStudents of pedagogy Latvia

ICT DEVELOPMENT IN EDUCATION IN THE BALTIC COUNTRIES – 2004-2005 53
A stable second position regarding the provision of information on the Internet
homepages, in the opinion of future teachers and pupils, is taken by teachers and
university teachers (60,4% and 41,6% in Latvia respectively and 38,2% (pupils)
Lithuania). Teachers themselves also admit that they regularly (Lithuania – 23,8%;
Latvia 22,7%) or at least sometimes (Lithuania – 65,3%; Latvia 56,4%) recommend
their pupils to use the necessary Internet resources.
How often do you recommend your pupils the specific websites
where they can find the material relevant to their learning?(N=teachers)
22.7%
23.8%
56.4%
65.3%
20.9%
10.9%
0% 10% 20% 30% 40% 50% 60% 70% 80% 90% 100%
Latvia
Lithuania
Constantly Sometimes Never

ICT DEVELOPMENT IN EDUCATION IN THE BALTIC COUNTRIES – 2004-2005 54
3.2.4. Usage of programs in education
In Latvia the majority of the surveyed pupils and future teachers admitted that they
have been taught to work with basic Microsoft software – MS Word, MS Excel and
MS PowerPoint, as well as with the Internet. Pupils’ training level to a larger (Excel,
PowerPoint) or smaller extent (Word, Internets) falls behind that of future teachers
regarding all the showings.
In Latvia regarding all questions on the performance of certain activities in the
environment of basic Microsoft programs and in the Internet definite leaders are the
future teachers, who most often use various technological possibilities and solutions
in training process.
When comparing pupils’ answers in Latvia and in Lithuania, we can see that the
possibilities, provided by software, more actively are used by Latvia’s pupils.
Students of pedagogy and pupils in Latvia, who have been taught to work with ...
75.2%
71.2%
91.1%
90.7%
99.1%
100.0%
100.0%
96.0%
0% 20% 40% 60% 80% 100%
Internet
MS PowerPoint
MS Excel
Microsoft Word
Students of pedagogy Latvia
Pupils Latvia
Students of pedagogy Latvia
Students of pedagogy Latvia
Students of pedagogy Latvia
Pupils Latvia
Pupils Latvia
Pupils Latvia

ICT DEVELOPMENT IN EDUCATION IN THE BALTIC COUNTRIES – 2004-2005 55
Regarding software usage, teachers in Latvia essentially fall behind not only future
teachers but also their pupils. The said tendency is repeating, both when speaking
about MS Word, MS Excel, MS PowerPoint and the Internet. It means that students
and also pupils rather perceive the ICT usage in training process as a suitable and a
natural phenomenon.
USAGE OF MICROSOFT WORD in doing homeworks and preperation for lessons/ during the lessons
66.1%
56.4%
34.4%
56.4%
23.3%
13.8%
17.1%
9.1%
42.4%
45.2%
60.4%
78.6%
94.1%
88.4%
96.0%
0% 25% 50% 75% 100%
Students of pedagogy Latvia
Pupils Latvia
Pupils Lithuania
Teachers Latvia (in preperation for lessons)
Teachers Latvia (during the lessons)
Students of pedagogy Latvia
Pupils Latvia
Pupils Lithuania
Teachers Latvia (in preperation for lessons)
Teachers Latvia (during the lessons)
Students of pedagogy Latvia
Pupils Latvia
Pupils Lithuania
Teachers Latvia (in preperation for lessons)
Teachers Latvia (during the lessons)
To w
rite
the
text
To
arr
ange
the
text
; to
form
at th
e ta
bles
and
diag
ram
sTo
inse
rt h
yper
links
and
tode
sign
con
tent

ICT DEVELOPMENT IN EDUCATION IN THE BALTIC COUNTRIES – 2004-2005 56
USAGE OF MS EXCEL in doing homeworks and preperation for lessons/ during the lessons
13.8%
11.1%
5.3%
80.2%
47.1%
41.7%
31.8%
13.1%
73.3%
39.4%
83.2%
33.6%
21.3%
12.8%
6.4%
0% 25% 50% 75% 100%
Students of pedagogy Latvia
Pupils Latvia
Pupils Lithuania
Teachers Latvia (in preperation for lessons)
Teachers Latvia (during the lessons)
Students of pedagogy Latvia
Pupils Latvia
Pupils Lithuania
Teachers Latvia (in preperation for lessons)
Teachers Latvia (during the lessons)
Students of pedagogy Latvia
Pupils Latvia
Pupils Lithuania
Teachers Latvia (in preperation for lessons)
Teachers Latvia (during the lessons)
To p
erfo
rm s
impl
em
athe
mat
ical
ope
ratio
ns
To
perf
orm
mat
hem
atic
alop
erat
ions
usi
ng th
est
anda
rd s
et o
f for
mul
asTo
mak
e ta
bles
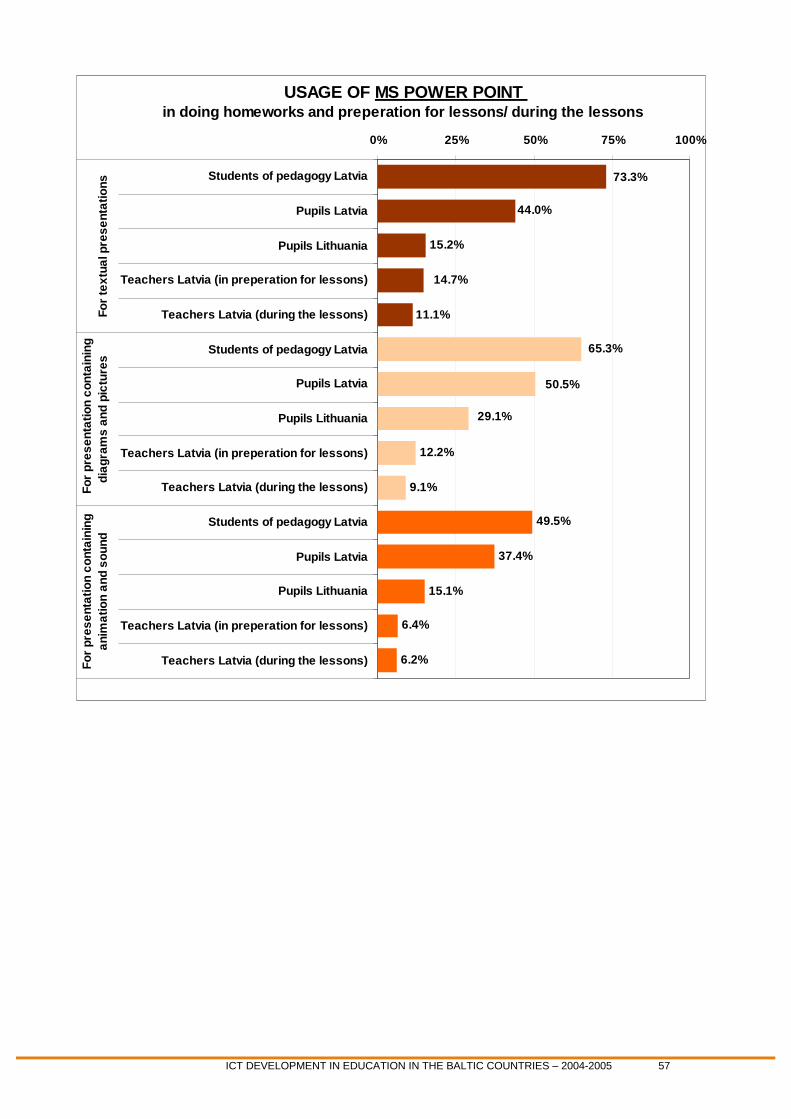
ICT DEVELOPMENT IN EDUCATION IN THE BALTIC COUNTRIES – 2004-2005 57
USAGE OF MS POWER POINT in doing homeworks and preperation for lessons/ during the lessons
15.2%
12.2%
9.1%
49.5%
37.4%
15.1%
6.4%
6.2%
11.1%
29.1%
14.7%
50.5%
73.3%
44.0%
65.3%
0% 25% 50% 75% 100%
Students of pedagogy Latvia
Pupils Latvia
Pupils Lithuania
Teachers Latvia (in preperation for lessons)
Teachers Latvia (during the lessons)
Students of pedagogy Latvia
Pupils Latvia
Pupils Lithuania
Teachers Latvia (in preperation for lessons)
Teachers Latvia (during the lessons)
Students of pedagogy Latvia
Pupils Latvia
Pupils Lithuania
Teachers Latvia (in preperation for lessons)
Teachers Latvia (during the lessons)
For
text
ual p
rese
ntat
ions
For
pre
sent
atio
n co
ntai
ning
diag
ram
s an
d pi
ctur
esFo
r pr
esen
tatio
n co
ntai
ning
anim
atio
n an
d so
und

ICT DEVELOPMENT IN EDUCATION IN THE BALTIC COUNTRIES – 2004-2005 58
USAGE OF INTERNET in doing homeworks and preperation for lessons/ during the lessons
71.1%
24.7%
12.0%
42.6%
25.9%
9.2%
6.2%
2.7%
33.3%
42.5%
50.4%
60.9%
99.0%
82.8%
96.0%
0% 25% 50% 75% 100%
Students of pedagogy Latvia
Pupils Latvia
Pupils Lithuania
Teachers Latvia (in preperation for lessons)
Teachers Latvia (during the lessons)
Students of pedagogy Latvia
Pupils Latvia
Pupils Lithuania
Teachers Latvia (in preperation for lessons)
Teachers Latvia (during the lessons)
Students of pedagogy Latvia
Pupils Latvia
Pupils Lithuania
Teachers Latvia (in preperation for lessons)
Teachers Latvia (during the lessons)
For
sear
ch o
f inf
orm
atio
n
For
elec
tron
icco
rres
pond
ence
To
cre
ate
pers
onal
web
site
s

ICT DEVELOPMENT IN EDUCATION IN THE BALTIC COUNTRIES – 2004-2005 59
An interesting situation can be observed, if we compare data on the teachers, who
for the preparation of homework makes pupils use ICT, and data on the pupils, who
use ICT in the homework preparation process. We can conclude that teachers less
often make pupils use computer technologies than the pupils use them themselves.
Software usage from pupils’ side is partly voluntary – in accordance with their own
will – not waiting for teachers’ requirements or recommendations. It is possible that
pupils are more used to computer technologies and to their usage than their
teachers. An additional explanation also could be as follows: not always it is possible
to ensure that all pupils have access to a computer, that is why teachers cannot set
categorical requirements regarding program usage.
Usage of programms in learning/ teaching process(N=TEACHERS, that direct pupils to use IT for homeworks, + PUPILS, that use IT for
preparing their homeworks)
4.4%
14.9%
79.4%
8.3%
15.4%
16.7%
24.1%
6.1%
11.8%
21.9%
71.1%
82.0% 92.3%
82.1%
24.3%
41.1%
35.0%
46.0%
49.2%
27.0%
63.5%
86.4%
39.0%
52.8%
To w rite the text
To arrange the text; toformat the tables and
diagrams
To insert hyperlinks and todesign content
To perform simplemathematical operations
To perform mathematicaloperations using the
standard set of formulas
To make tables
For textual presentations
For presentationcontaining diagrams and
pictures
For presentationcontaining animation and
sound
For search of information
For electroniccorrespondence
To create personalw ebsites
Mic
roso
ft W
ord
MS
Exc
elM
s P
ower
Poi
ntIn
tern
et
Teachers Latvia (N=228) Pupils Latvia (N=2078)

ICT DEVELOPMENT IN EDUCATION IN THE BALTIC COUNTRIES – 2004-2005 60
Both in Latvia and Lithuania several situations were described for the surveyed
teachers and they were asked to evaluate how often in the particular school year
they have faced them. The following Chart shows teachers’ answers.
We can see that as soon as a situation is presented, when a pupil is asked to work
with complicated technologies (for example, A pupil accumulates and changes
contents in the virtual work environment or Pupils use simulators and browsers to get
access and investigate specific information), there is a considerable increase in the
number of the teachers, who never face the relevant situation.
Besides, very scarce is the feedback from pupils, using e-mail to share the
information on materials found on the Internet. A large part of teachers (83,1% in
Latvia and 68,2% in Lithuania) in this school year have not had such kind of
experience.
A computer is mostly used to search for information. It should be noted that teachers
tend to provide students the assignments of search without giving them the
addresses of particular websites. The least part of teachers used a computer for
experiments, the stimulation of experiments, students’ research. Thus, a computer is
used rather as a mediator of information transfer processes than the instrument of
research or instrument of knowledge construction. We can conclude that in ICT field
just the very minimum is being done and computer technologies are rather used
passively and not actively.

ICT DEVELOPMENT IN EDUCATION IN THE BALTIC COUNTRIES – 2004-2005 61
How often do you face with following situations during teaching process?
(N = all teachers)
4,7%
2,4%
11,0%
3,4%
4,7%
27,1%
11,3%
23,8%
12,7%
25,1%
20,2%
42,0%
18,2%
16,4%
19,1%
40,4%
35,7%
40,2%
25,6%
40,7%
25,8%
45,8%
40,3%
35,9%
43,1%
45,9%
41,1%
38,2%
30,7%
14,3%
3,6%
3,1%
1,6%1,8%
1,8%
1,4%
0,2%
0,9%
0,7%
1,2%
0,4%
0,9%
1,0%7,2%
5,2%
4,4%
9,5%
2,2%
10,7%
10,7%
21,8%
20,1%
72,8%
73,6%
68,2%
69,2%
44,4%
76,4%
83,1%
3,6%
4,4%
4,9%
3,6%
0% 10% 20% 30% 40% 50% 60% 70% 80% 90% 100%
LATVIA
LITHUANIA
LATVIA
LITHUANIA
LATVIA
LITHUANIA
LATVIA
LITHUANIA
LATVIA
LITHUANIA
LATVIA
LITHUANIA
LATVIA
LITHUANIA
Pup
ils w
rite
e-
mai
ls to
me
tosh
are
the
info
rmat
ion
they
have
foun
d in
Inte
rnet
Pup
ils u
sesi
mul
ator
s an
dbr
owse
rs to
get
acce
ss a
ndin
vest
igat
esp
ecifi
cin
form
atio
n
A p
upil
accu
mul
ates
and
chan
ges
cont
ents
in th
e vi
rtua
l wor
ken
viro
nmen
t
Pup
ils r
ecei
ve a
task
, for
the
prep
arat
ion
ofw
hich
they
hav
eto
find
info
rmat
ion
in s
peci
ficho
mep
ages
Whe
n pu
pils
hav
eto
ana
lyze
and
proc
ess
info
rmat
ion,
they
use
Wor
d, E
xcel
,P
ower
Poi
nt to
show
wha
t the
yha
ve le
arne
d
Pup
ils u
seso
ftw
are
for
thei
rda
ily s
tudi
es a
ndas
aux
iliar
ym
eans
whe
nst
udyi
ng
Pup
ils r
ecei
ve a
task
, for
the
prep
arat
ion
ofw
hich
they
inde
pend
ently
have
to fi
nd s
ome
info
rmat
ion
inIn
tern
et
in almost all classes in 3-9 classes in 1-2 classes never DK/ NA

ICT DEVELOPMENT IN EDUCATION IN THE BALTIC COUNTRIES – 2004-2005 62
In Lithuania teachers were asked on how often in this school year they have used
specific criteria or instruments, in order to evaluate their pupils’ results. In this school
year on the whole most often teachers have asked pupils to present their work
publicly in the classroom, in order to receive both teacher’s and classmates’
evaluation (this method was used in 68,9% of cases). But least often (in total in
15,4% of cases in this school year) respondents have used a digital portfolio, in order
to register pupils’ results. At the same time its usage is extreme – teachers either use
it in every class (13,3%) or do not use it at all (84,6%).
How often did you use the following criteria and instruments of evaluation while grading your students during this academic year?
(N=teachers Lithuania)
25.2%
25.0%
38.0%
3.9%
5.7%
0.9%
1.4%
13.3%
22.7%
11.8%
8.2%
0.7%
15.3%
1.4%
25.6%
31.1%
61.7%
75.1%
48.4%
84.6%
0% 10% 20% 30% 40% 50% 60% 70% 80% 90% 100%
The digital portfolio wasused to register progress
and to grade students
Students registered theirown progress for each
topic with a study-planneron a computer and youmonitored the generalprogress and provided
feedback
Students used tests fromthe Web and for which they
received graduos
The software was used toexamine students
Students used informationtechnologies to presenttheir work in the class.
They were evaluated by ateacher and/or the whole
class
in almost all classes in 3-9 classes in 1-2 classes never

ICT DEVELOPMENT IN EDUCATION IN THE BALTIC COUNTRIES – 2004-2005 63
3.2.5. Support of ICT in education.
3.2.5.1. Support of teachers in Latvia
Almost three fourths of Latvia’s teachers (71,3%) admit that they more or less help
each other regarding ICT related matters.
At the same time almost half of teachers (48,2%) have also indicated that they do not
have a support for the ICT usage in the study process outside their school’s team.
Such results most probably show that in the case of ICT problems schools mainly
look for a solution, relying on their own resources and not looking for an external
assistance.
Speaking about teachers of your school, to what extent do you help each other regarding ICT-related matters?
LATVIA(N=teachers)
Help to a very large extent
18,9%
Help sometimes52,4%
Help neither to a small, nor a large
extent9,8%
Help to a small extent15,6%
Do not help at all2,9%
NA0,4%
To what extent do you have access to the ICT usage in training process, if it comes from other sources and not from your school?
LATVIA(N=teachers)
Very much accessible
6,9%
Accessible sometimes
35,6%
Neither small, nor large access
10,2%
Small access29,1%
No access at all19,1%
NA1,1%

ICT DEVELOPMENT IN EDUCATION IN THE BALTIC COUNTRIES – 2004-2005 64
3.2.5.2. Support of pupils in Latvia and Lithuania.
On the basis of quantitative survey data in Latvia and Lithuania, we can state that the
pupils most often get the assistance to answer the questions related to IT usage
matters from teachers of informatics. Most computer teachers (97,4%) and pupils (in
Latvia 80,9% and in Lithuania – 77,0%) consider that in the case of uncertainty they
can ask their IT teacher for advice, but the future teachers in Latvia are equally
(54,5%) sure that they should ask for help both their IT teacher and their course
mates. It should be stressed that IT teachers again provide a more positive
evaluation than the other audiences, in the particular case – than pupils. Only 1,3%
of all IT teachers have answered that the help is not available, whereas this answer
variant was selected by 11,9% of pupils in Latvia and by 15,6% in Lithuania.
The formation of special crew of pupils consulting on the questions of IT usage would
be purposeful and useful, however, unfortunately there is no such a practice,
especially in Lithuania, to form special crews of pupils for mutual assistance which
could help to clarify the problems raised in IT usage field. But, as it can be seen, in
the opinion of future teachers, such organization of help is quite successful.
Is there any organized help in IT-matters for pupils/ students in your school/ university?
Multiple question
6,4%
7,2%
5,9%
5,9%
15,6%
11,9%
1,3%
1,1%
10,9%
6,5%
34,7%
7,9%
6,6%
24,8%
54,5%
77,0%
80,9%
1,0%
54,5%
97,4%
0% 20% 40% 60% 80% 100%
Students of pedagogy Latvia
Pupils Lithuania
Pupils Latvia
IT teachers Latvia
Students of pedagogy Latvia
Pupils Lithuania
Pupils Latvia
IT teachers Latvia
Students of pedagogy Latvia
Pupils Lithuania
Pupils Latvia
IT teachers Latvia
Students of pedagogy Latvia
Pupils Lithuania
Pupils Latvia
IT teachers Latvia
Students of pedagogy Latvia
Pupils Lithuania
Pupils Latvia
IT teachers Latvia
Oth
erH
elp
is n
otav
aila
ble
A h
elpd
esk
with
a c
rew
of
pupi
ls/
stud
ents
Info
rmat
ion
Tech
nolo
gies
tech
nici
an
Com
pute
rS
cien
cete
ache
r
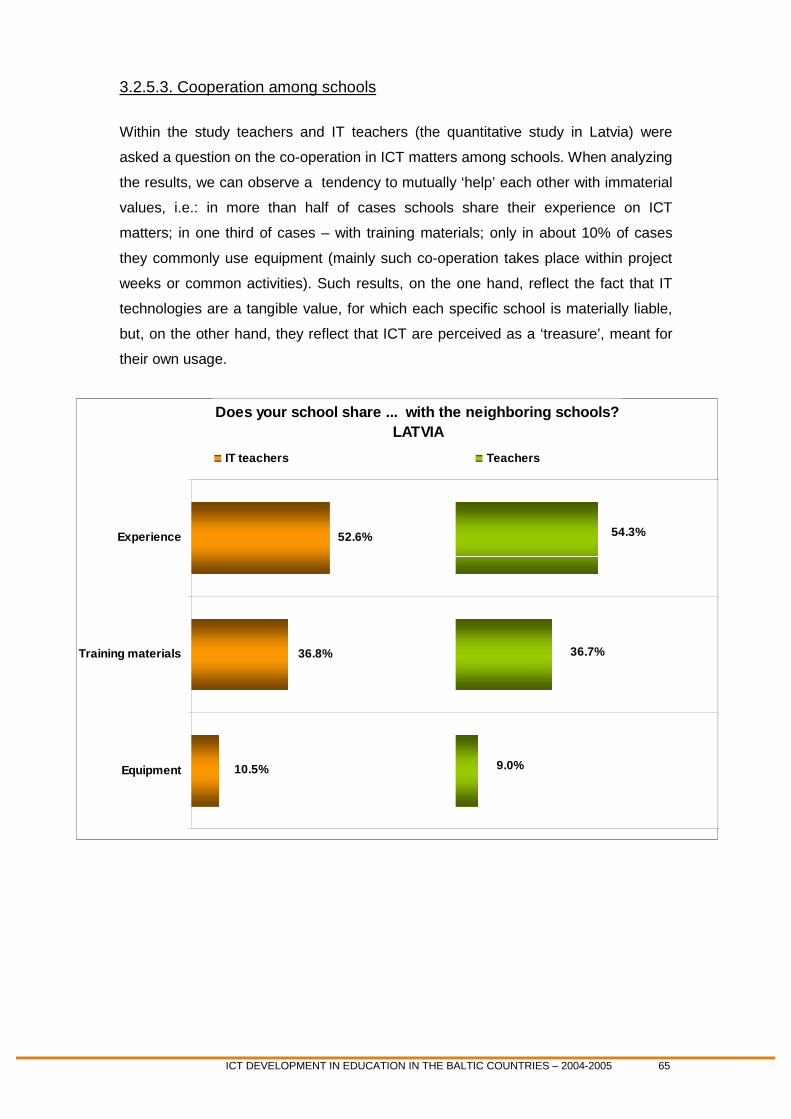
ICT DEVELOPMENT IN EDUCATION IN THE BALTIC COUNTRIES – 2004-2005 65
3.2.5.3. Cooperation among schools
Within the study teachers and IT teachers (the quantitative study in Latvia) were
asked a question on the co-operation in ICT matters among schools. When analyzing
the results, we can observe a tendency to mutually ‘help’ each other with immaterial
values, i.e.: in more than half of cases schools share their experience on ICT
matters; in one third of cases – with training materials; only in about 10% of cases
they commonly use equipment (mainly such co-operation takes place within project
weeks or common activities). Such results, on the one hand, reflect the fact that IT
technologies are a tangible value, for which each specific school is materially liable,
but, on the other hand, they reflect that ICT are perceived as a ‘treasure’, meant for
their own usage.
Does your school share ... with the neighboring schools?
LATVIA
52.6%
36.8%
10.5% 9.0%
36.7%
54.3%Experience
Training materials
Equipment
IT teachers Teachers

ICT DEVELOPMENT IN EDUCATION IN THE BALTIC COUNTRIES – 2004-2005 66
3.2.6. Confidence in ability to use ICT
Most confident of their abilities (‘very’ and ‘rather confident’ of themselves), when
using a computer in training process, are Lithuanian teachers (66,6%), followed by
Latvia’s future teachers and pupils, who are 59,4% and 57,8% of cases respectively.
But from teachers in Latvia more often than from the other groups of survey
participants we received the answer alternative ‘feeling very unconfident’ (12,7%).
The said results could be explained as follows – teachers in Latvia relatively less
often than their Lithuanian colleagues have access to a home computer, they also
less often use ICT in study process (both during classes and when preparing for
them) thus their usage experience is not so large and the teachers themselves
feel unconfident.
How confident or unconfident of your abilities do you feel , when using a computer in the study process?
6.0%
24.4%
31.1%
42.2% 20.5%
15.7%
12.9%
20.7%
7.2%
6.0%
5.9%
12.7%
5.1%
12.5%
16.8%
45.3%
42.6%
20.5%
29.5%
21.8%
0.6%
0% 10% 20% 30% 40% 50% 60% 70% 80% 90% 100%
Latvia
Latvia
Latvia
Lithuania
Pup
ilsS
tude
nts
ofpe
dago
gyTe
ache
rs
Very confident Rather confident Neither confident, nor unconfident
A little unconfident Very unconfident NA/DK

ICT DEVELOPMENT IN EDUCATION IN THE BALTIC COUNTRIES – 2004-2005 67
In Estonia in the quantitative study („Tiger in Focus” – Executive Summary, 2004) a
different methodology was used – teachers were asked to estimate their competence
themselves on a 3-point scale; statements were dividend into 2 categories. The first
category measured general skills in using ICT; the second category measured the
professional application of ICT in teaching the subject. As we might expect, teachers’
general skills were higher than their professional ICT competence. Comparing with
2000, we can observe a rapid increase in the number of the teachers, who evaluate
their competence level, application of ICT in teaching the subject as being high.

ICT DEVELOPMENT IN EDUCATION IN THE BALTIC COUNTRIES – 2004-2005 68
3.3. Supply and usage of digital teaching materials
The surveyed respondents (teachers and IT teachers) in Latvia evaluate school
maintenance with digital training aids more critically than their Lithuanian colleagues
– the maintenance with digital training materials was found very good or good by only
20,3% of teachers and by 17,6% of IT teachers. Regarding the said question, the
negative evaluations tend to dominate – 44,9% of the surveyed teachers, providing
the answer to the said question, chose the alternatives - a ‘bad’ or ‘very bad’
maintenance with digital training materials. The percentage of negative answers
provided by IT teachers reached 43,8%.
It is interesting to note that Lithuanian school managers’ opinion is considerably
different from that of teachers - 38,3% consider that the maintenance with training
materials shall be evaluated as good, whereas only 21% of Lithuania’s school
teachers provide a similar opinion.
Supply of digital teaching materials for teachers in school.
16.3%
38.3% 14.9%
24.7%
36.7%
24.8%
36.9%
20.2%
19.8%
19.0%
9.9%
2.9%
1.3%
1.6%
0.6%
18.7%
20.4%
32.0%
38.6%
22.5%
0% 10% 20% 30% 40% 50% 60% 70% 80% 90% 100%
Latvia (teachers)
Lithuania (teachers)
Latvia (IT teachers)
Lithuania (schoolmanagers)
Very good Good Neither good, nor bad Bad Very bad NA/DK

ICT DEVELOPMENT IN EDUCATION IN THE BALTIC COUNTRIES – 2004-2005 69
In Latvia future teachers, speaking about a subject’s provision with such digital
training aids as computer encyclopedias, simulations, picture archives etc. are more
optimistic and providing a more positive evaluation than teachers – most probably it
shall be explained with the impression of the ICT possibilities formed during their
studies which are not actually corresponding to the real situation at schools.
It should be noted that teachers in Lithuania much more positively evaluate the
maintenance of their subject with digital training materials than their colleagues in
Latvia.
The arrangement of the provided answers can be seen in the Chart below:
How would you characterize the supply of digital teaching material for your subject?
33.7%
29.3%
32.3%
20.8%
19.3%
11.0%
5.9%
3.8%
1.1%
2.0%
31.3%
14.0%
21.7%
37.6%
32.7% 3.6%
0% 10% 20% 30% 40% 50% 60% 70% 80% 90% 100%
Latvia
Lithuania
Latvia
Teac
hers
Stu
dent
s of
peda
gogy
Very good Good Neither good, nor bad Bad Very bad NA/DK

ICT DEVELOPMENT IN EDUCATION IN THE BALTIC COUNTRIES – 2004-2005 70
During the survey also a question was asked on who should be responsible for
providing teachers with digital training materials. Here we can observe an interesting
regularity: in most cases teachers think that liable are IT teachers and headmasters
for IT matters (48,2%), whereas IT teachers think that teachers themselves are
responsible for the provision (45,1%). We can conclude that none of the parties is
particularly willing to be responsible for the specific sphere.
Who is responsible for the supply of digital teaching material for the teachers in your school?
LATVIAMultiple question (N= IT teachers & teachers)
4,6%
2,6%
9,2%
3,9%
6,6%
15,0%
0,9%
1,6%
2,5%
3,1%
4,9%
13,5%
0,7%
38,6%
45,1%
32,7%
48,2%
0% 10% 20% 30% 40% 50%
Other (<1%)
Latvian Education Informatization System (LIIS)
Regional methodological association
Local municipality
Regional department of education
School administration
Government/ Ministry of Education and Science
Teachers themselves
The school manager for IT matters
IT teachers Teachers
In Lithuania the said question was asked only to teachers, thus, it is not possible to
compare teachers’ provided answers with school managers’ opinions, still we can
see that, like in Latvia, also in Lithuania teachers think that the ones responsible for
the provision with digital training materials are school managers for IT matters.
Who is responsible for the supply of digital teaching material for the teachers in your school?
(N=teachers Lithuania)
The school manager and teachers
7,9%
Teachers themselves
35,3%The school manager
for IT matters56,9%

ICT DEVELOPMENT IN EDUCATION IN THE BALTIC COUNTRIES – 2004-2005 71
Latvia’s teachers and future teachers were asked to mention sources of digital
training materials. The most frequently mentioned answer was the Internet (future
teachers – 42,6% and teachers – 15,5%). However, here we can observe a very
large percentage of ignorant respondents: more than half or 58,2% of teachers and
36,6% of students could not provide an answer. It means that irrespective of the
relatively high degree of computerization, respondents still lack knowledge and
information on more modern ICT and their usage possibilities.
Finally teachers were asked to answer on what digital training materials are used in
training process. Most respondents could not provide an answer or they clearly
indicated that they do not use such materials. However, a relatively small part
mentioned some types of digital training materials. More detailed information can bee
seen in the Chart:
What sources of digital training materials do you know?LATVIA
Multiple question(N= teachers & students of pedagogy)
6.7%
10.0%
2.4%
8.0%
15.5%
4.0%
5.0%
5.0%
5.9%
6.9%
42.6%
58.2%36.6%
0% 10% 20% 30% 40% 50% 60%
NA
Training programmes
Computer-encyclopedia
Data base
LIIS home page
Tilde
CD
Internet
Teachers Students of pedagogy
What digital training materials do you use for training?LATVIA
Multiple question (N= teachers)
15.3%
2.7%
3.3%
6.0%
6.9%
8.4%
9.5%
9.6%
43.8%
0% 10% 20% 30% 40% 50%
NA
Do not use
LIIS home page
Games
Internet
Pictures
CD materials
Training programmes
Computer-encyclopedia

ICT DEVELOPMENT IN EDUCATION IN THE BALTIC COUNTRIES – 2004-2005 72
4. TEACHERS’ TRAINING Relatively the best situation regarding teachers training is in Estonia – „All teachers
have had possibilities to participate in different ICT courses, organized either by the
state (TLF), the other organizations or the schools themselves.” (Development of ICT
in Estonian Education, Qualitative survey, 2005)
But a part of Latvia’s (19,8%) and Lithuania’s (7,2%) teachers admitted that no
training has been offered to them, when new IT hardware and software are
purchased in school.
Comparing the results, we can conclude that IT teachers are more optimistic than,
probably, the real situation would allow it – just 9,8% of IT teachers have answered
that teachers of their school never participate in training (see the next page),
whereas 19,8% of teachers of other subjects have mentioned that no training has
been offered to them in cases when the school has acquired new ICT.
Are you offered training, when new IT hardware and software are purchased?(N=all teachers)
28.9%
52.0%
51.1%
40.7%
19.8%
7.2%
0% 10% 20% 30% 40% 50% 60% 70% 80% 90% 100%
Latvia
Lithuania
Always Sometimes Never

ICT DEVELOPMENT IN EDUCATION IN THE BALTIC COUNTRIES – 2004-2005 73
To illustrate the situation additionally, it is useful to observe IT teachers’ provided
answers (Latvia, quantitative survey) – as we can see in the following Chart, in a little
more than half of cases (52,2%) only few and specially selected teachers participate
in training, if the school has acquired new ICT facilities or software.
Actually in Latvia and Lithuania the courses more or less are perceived as a
privilege and not as a daily phenomenon and necessity, which should be available to
every teacher. Besides, most teachers still attend courses, which are not longer than
four hours, thus, we can speak only about the minimal training. It is possible that
basic knowledge is provided, however, no wider and deeper skills are acquired.
Do teachers of your school participate in training, when your school acquires new ICT facilities or software?
LATVIA(N=IT teachers)
Never9,8%
Some selected teachers sometimes
participate in the training34,6%
Some selected teachers always participate in the
training 17,6%
All teachers sometimes
participate in the training31,4%
All teachers always participate in the
training6,5%
What is the percentage of your teachers, who during the last year have attended ICT courses which have lasted longer than four hours?
7.9%
5.2%
24.5%
7.8%
46.8%
28.8%
19.4%
41.8%
1.4%
16.3%
0% 10% 20% 30% 40% 50% 60% 70% 80% 90% 100%
IT teachers Latvia
Managers Lithuania
67% and more between 34% – 66% between 11%- 33% less than 10% none

ICT DEVELOPMENT IN EDUCATION IN THE BALTIC COUNTRIES – 2004-2005 74
4.1. Attended courses and their evaluation
It is considered that refresher courses in the area of IT for teachers are significant
factor in the improvement of teaching. 41,7% of pedagogues in Lithuania pointed that
during the last 6 months they had to attend the refresher courses and training in IT.
It should be noted that relatively more often they are middle-aged teachers from city/
town:
Have you attended any IT courses/training during the last 6 months?LITHUANIA
(N= teachers)
Yes41,7%
No58,3%
Teachers, who have attended any IT courses/ training during the last 6 months.
LITHUANIA
43.8%
36.4%
44.4%
42.1%
37.8%
38.2%
44.2%
44.9%
34.9%
39.5%
40.3%
47.1%
36.4%
42.1%
44.6%
25.5%
0% 10% 20% 30% 40% 50% 60% 70% 80% 90% 100%
Primary
Secondary
Gymnasium
Female
Male
20-30 years old
31-40 years old
41-50 years old
51 and older
0 - 5 years
6 -15 years
16 - 30 years
< 30 years
City
Town
Village
Sch
oo
lS
exA
ge
Ped
ago
gic
alex
per
ien
ce
Pla
ce

ICT DEVELOPMENT IN EDUCATION IN THE BALTIC COUNTRIES – 2004-2005 75
Almost half or 49,7% of all Latvia’s IT teachers during the last six months have
attended ICT courses. Most often they are teachers from rural primary schools.
Have you attended any IT courses/training during the last 6 months?LATVIA
(N= IT teachers)
No50,3%
Yes49,7%
IT teachers, who have attended any IT courses/ training during the last 6 months.LATVIA
56.8%
50.0%
41.3%
34.4%
60.6%
56.3%
61.9%
33.3%
52.4%
50.0%
48.1%
42.9%
53.6%
48.5%
47.0%
77.8%
0% 10% 20% 30% 40% 50% 60% 70% 80% 90% 100%
primary school (forms 1-4)
elementary school (forms 5-9)
high school (forms 10-12)
Female
Male
20-35 years old
36-50 years old
51-65 years old
Riga
Vidzeme
Kurzeme
Zemgale
Latgale
City
Town
Village
Sch
oo
lS
exA
ge
Reg
ion
Pla
ce

ICT DEVELOPMENT IN EDUCATION IN THE BALTIC COUNTRIES – 2004-2005 76
The answers on the courses most frequently mentioned by Latvia’s respondents,
which they have attended during the last six months, are reflected in the following
Charts:
Attended courses/ trainings according to the IT teachers.LATVIA
Multiple question
2.6%
3.9%
3.9%
6.6%
6.6%
7.9%
9.2%
11.8%
13.2%
14.4%
14.4%
10.5%
15.6%
0% 5% 10% 15% 20%
Other (mentioned by one respondent)
LPA seminars
Network administration
Programming courses
"Frontpage" courses
Home page creating
LIIS courses
Courses of IMC methods in IT
Courses for IT teachers
Inservice training courses
ECDL courses
Courses in school/ highschool
The courses of computer literacy (in general)
Attended courses/ trainings according to the teachers.LATVIA
Multiple question
2.3%
3.1%
3.8%
4.6%
5.4%
6.2%
6.2%
10.8%
58.5%
7.7%
7.1%
0% 10% 20% 30% 40% 50% 60%
Other (mentioned by one respondent)
Courses "IT and Society"
Courses for librarians
Courses organised by school-board
First steps in computers
Programming courses
Courses organised by Educational department
LIIS courses
Courses in school/ highschool
Remote teaching via Internet
The courses of computer literacy (in general)

ICT DEVELOPMENT IN EDUCATION IN THE BALTIC COUNTRIES – 2004-2005 77
In Latvia more than one third of IT teachers (36,6%) and more than one fourth of
(26,0%) teachers of other subjects admitted that the attended courses to a great
extent are corresponding to their necessities. Relatively more critical were IT
teachers – 7,6% considered that courses a little or even not at all were corresponding
to their necessities.
Since at the study, which was conducted in Lithuania, a different evaluation scale
was used, the obtained results are shown in the second Chart:
On the whole, we can see that teachers both in Latvia and in Lithuania consider
courses as being useful, necessary and more or less corresponding to their
necessities.
To what extent the courses you attended correspond to your needs as a teacher?
LATVIA(N= teachers & IT teachers, who attended IT courses)
26.0%
36.6%
61.7%
52.7%
7.8%
3.2%
3.9%
6.5%
0.6%
1.1%
0% 10% 20% 30% 40% 50% 60% 70% 80% 90% 100%
Teachers
IT teachers
Very much corresponding Much correspondingNeither corresponding, nor not corresponding A little correspondingAbsolutely not corresponding
Were the courses you attended useful for you as a teacher?(N=teachers Lithuania, who attended IT courses)
Very useful57,0%
Useful33,0%
Useless9,0%
Very useless1,0%

ICT DEVELOPMENT IN EDUCATION IN THE BALTIC COUNTRIES – 2004-2005 78
4.2. Financial sources of teachers’ training
When analyzing the data obtained during the quantitative study on the financing
sources of the attended ICT courses, we shall conclude that in Latvia IT teachers
more often have attended the courses financed by MES or LIIS (37,5%), but teachers
of other subjects have had more possibilities to acquire additional knowledge on ICT
matters in courses financed by a municipality or school (30,7% and 25,0%
respectively).
But in Lithuania most often course financing comes from school (34,9%), as well as
from the MES (22,8%) or from teacher’s own pocket (22,7%).
The financing source of attended courses.LATVIA
Multiple question (N= teachers who attended IT courses)
4.8%
15.1%
25.0%
5.4%
37.5%
25.1%
17.5%19.8%
19.1%
30.7%
0%
5%
10%
15%
20%
25%
30%
35%
40%
Ministry ofEducation and
Science
Personal finance Municipality School Other
IT teachers Teachers

ICT DEVELOPMENT IN EDUCATION IN THE BALTIC COUNTRIES – 2004-2005 79
The financing source of attended courses.LITHUANIA
(N= teachers who attended IT courses)Other12,3%
Municipality7,4%
Personal finance22,7%
Ministry of Education and Science
22,8%
School34,9%
In both countries, Latvia and Lithuania, the payment for the courses is often quite a
serious financial problem to teachers and school. For instance, the network of
schools being disorderly, there are quite big number of vacant positions for students
in small schools, particularly in villages, therefore, the student’s basket is hardly
sufficient for the earnings of teachers. On the other hand, the number of teachers in
the small schools being little, it is difficult to cumulate the greater amount of money
and intend it to the teachers’ refresher courses. Although the teachers claim that their
salaries are too small to pay for the refresher courses, however, due to the
decreasing number of working places and increasing competition of teachers,
relatively many teachers pay the refresher courses in IT from their own finances
(22,7% of Lithuanian teachers and 25,1% of IT teachers in Latvia).

ICT DEVELOPMENT IN EDUCATION IN THE BALTIC COUNTRIES – 2004-2005 80
4.3. Readiness to use and intensity of using ICT in teaching/learning
process
During the studies IT teachers and other experts in Latvia and Estonia were asked to
evaluate the following things: teachers’ readiness to use ICT in training and the
training intensity of the ICT usage. The said questions in Latvia were included both in
the qualitative and the quantitative part of the study, whereas in Estonia – only in the
qualitative study.
Situation with readiness to use and intensity of using ICT in teaching/learning
process in Latvia is not very optimistic.
The information obtained during the qualitative study shows that in none of Latvia’s
universities they teach methodology how to integrate ICT in training process.
Teachers can learn about the ICT usage methodology only at Methodological
centers. Unfortunately this methodology quite often is “fragmentary” and does not
cover the whole subject, but just a separate topic of it. To some extent it can be
explained with the fact that educational standard envisages the ICT usage during
training process only as a recommending assumption, that is why it has not been
necessary to draft methodological recommendations for teaching the whole subject,
using ICT (LU: Educational standard has general sentences, regarding which you
can say that they express everything. However, one should specifically say that ICT
SHALL be used also when teaching other subjects, then MES should draft the
methodology). However, experts admit that such “instructions from above” would not
be too helpful to use ICT actively in training, if there are no technical possibilities
provided to use ICT at school.
Generalizing we could say that teachers’ willingness to use ICT in training process is
just proportionally dependent on school’s technical possibilities – tthhee llaarrggeerr aarree tthhee
ppoossssiibbiilliittiieess to use ICT (administration’s support; computer classrooms are not
overburdened; projectors are available; teachers have easy access to a [home,
school] computer), tthhee llaarrggeerr iiss tthhee wwiilllliinnggnneessss to use ICT in training.
In Estonia the total school computerization and internetisation is relatively highest in
the Baltic States and most teachers use a computer and the Internet mainly to make
preparations for their lessons, some - also for communicating with colleagues and
parents, printing out worksheets, and only few – also for making small programs.
Still, as for the study process itself, teachers integrate computers much less.
“Teachers of different subjects are different. While the general competence has

ICT DEVELOPMENT IN EDUCATION IN THE BALTIC COUNTRIES – 2004-2005 81
increased, the implementation of tools in teaching these subjects is still modest and a
lot remains to be done.” (Development of ICT in Estonian Education, Qualitative
survey, 2005)
Formally Latvia’s teachers would be ready to use ICT in training process. More than
half (59,4%) of the IT teachers surveyed during the quantitative study consider that
teachers of their school to a large or very large extent are ready to use ICT in
teaching process.
However answering the question „How actively ICT are used during the study
process at your school?”, only one third of IT teachers have provided the answer
variants ‘used actively’ or ‘very actively’. And almost the same percentage of
respondents (32,7%) consider that ICT in training process are used inactively or are
not used at all.
To what extent teachers of your school are ready to use ICT in the training process?
LATVIA(N=IT teachers)
Ready to a very large extent
14,4%
Sometimes ready45,0%
Ready neither to a large, nor a small
extent17,6%
Ready to a very small extent
22,2%
Not ready at all0,7%
How actively ICT are used during the study process at your school?LATVIA
(N=IT teachers)
Not used2,0%
Used inactively30,7%
Used neither actively, nor
inactively34,0%
Used actively30,1%
Used very actively3,3%

ICT DEVELOPMENT IN EDUCATION IN THE BALTIC COUNTRIES – 2004-2005 82
Respondents were asked to explain their answer, mentioning, what the main factors
are determining the fact that at their school ICT during the study process are used
inactively. The following phenomena were mentioned as the main reasons:
- Lack of computer equipment;
- Teachers’ inability to use ICT in training;
- Pupils’ and teachers’ work/ study load;
- Conservative teachers’ views.
More detailed information in the next Chart:
What are the main factors determining the fact that at your school ICT
during the study process are used INACTIVELY?Multiple question, most frequently mentioned answers
(N=IT teachers who said that ICT is used inactively in their schools: N=50)
2
2
4
6
6
6
7
11
17 respondents
6
2
7
3
0 2 4 6 8 10 12 14 16 18 20
not informed aboutpossibilities of ICT
lack of teachings materials
fear of teachers
no prepared teachingprograms
slow/ not qualitative internet
lack of finances
oldening of technicalequipment
disinterest/ lack ofmotivation
overburdened computerclassrooms
conservative viewvs ofteachers
teachers' and pupils'busyness
inefficiency worki with ICT
technical equipment

ICT DEVELOPMENT IN EDUCATION IN THE BALTIC COUNTRIES – 2004-2005 83
But the ICT usage in training process to a larger extent is based only on teachers’
own enthusiasm (12 respondents):
Similar conclusions were made also in Estonia: „Using the means of ICT in the study
process depends enormously on the enthusiasm of a teacher, and the attitude of
his/her school leaders to ICT.” (Development of ICT in Estonian Education,
Qualitative survey, 2005).
What are the main factors determining the fact that at your school ICT during the study process are used ACTIVELY?
Multiple question, most frequently mentioned answers(N=IT teachers who said that ICT is used actively in their schools: N=51)
2
3
8
9
10
10
3
1
12
0 2 4 6 8 10 12 14
participating in international projects
helps to teach and do material more understandable
support of administration of school
background of teachers
necessity of life/ requirement of cours
possibility to get information and communicate withininternet
availability of technical equipment
teaching materials availability
pupils'/ teachers' involvement

ICT DEVELOPMENT IN EDUCATION IN THE BALTIC COUNTRIES – 2004-2005 84
5. IMPLEMENTATION AND MANAGEMENT OF ICT IN EDUCATION 5.1. Teachers’ involving in development of ICT in school
Most teachers (Latvia and Lithuania), school managers (Lithuania), as well as IT
teachers (Latvia) consider that IT teachers or deputy headmasters responsible for IT
matters take the leading role in ICT matters, as well as to a larger or smaller extent
create a future vision of ICT matters.
The vision most often is a ground to achieve the successful implementation of the set
task and unfortunately, teachers’ participating in the formation of the ICT
development vision in schools, is evaluated much lower than both in Latvia and
Lithuania.
To what extent ...(N=teachers & IT teachers Latvia & managers Lithuania)
8.5%
34.4%
13.4%
38.6%
15.5%
29.3%
45.5%
36.6%
60.6%
35.3%
64.1%
25.3%
48.3%
32.0%
69.7%
37.3%
34.4%
28.8%
26.8%
26.8%
2.8%
22.7%
30.6%
17.6%
7.0%
16.4%
14.3%
20.3%
7.0%
26.9%
11.3%
26.1%
21.8%
11.3%
6.3%
10.5%
6.3%
12.4%
3.9%
11.8%
3.5%
4.6%
8.9%
6.2%
39.1%
20.3%
15.2%
13.4%
4.9%
1.4%
0.7%
1.3%
2.0%
2.6%
2.8%
2.9%
1.4%
32.7%
25.5%
3,5%
0.9%
0.4%
3.3%
0% 20% 40% 60% 80% 100%
TeachersLatvia
TeachersLithuania
IT teachersLatvia
ManagersLithuania
TeachersLatvia
TeachersLithuania
IT teachersLatvia
ManagersLithuania
TeachersLatvia
TeachersLithuania
IT teachersLatvia
ManagersLithuania
... d
o th
e te
ach
ers
pa
rtic
ipa
te in
the
form
atio
n o
f th
e IC
T d
eve
lop
me
ntvi
sio
n o
f you
r sc
ho
ol?
... d
oe
s IT
tea
che
r/ d
ep
uty
he
adm
ast
er r
esp
on
sib
le fo
r IT
ma
tters
, cre
ate
a fu
ture
vis
ion
of
ICT
ma
tters
?
... d
o y
ou
ag
ree
with
the
sta
tem
en
t:“
IT te
ach
ers
/ de
pu
ty h
ea
dm
ast
ers
resp
on
sibl
e fo
r IT
ma
tters
at o
ur
sch
oo
l ha
ve th
e le
ad
ing
role
reg
ard
ing
ICT
ma
tters
?
To a large extent To some extent Neither to a small nor a large extent To a small extent Not at all

ICT DEVELOPMENT IN EDUCATION IN THE BALTIC COUNTRIES – 2004-2005 85
The managers in Lithuania claim themselves that teachers are too less involved
(91,5%). IT vision still is not completely clear in many schools and even the
managers themselves assess it quite skeptically. The fogginess of the vision could
be determined by the low involvement of teachers in its planning and forming which
is partly approved by the managers themselves
To what extent ... (LITHUANIA)
40.1%
38.3%
51.4%
31.8%1.6%
4.2%
6.5%
4.2%
21.7%
0% 10% 20% 30% 40% 50% 60% 70% 80% 90% 100%
... do you engage theteachers in formingcommon vision of IT
development?(N=MANAGERS)
... do the managers involvethe teachers in the
articulation of visionarydevelopment in IT?
(N=TEACHERS)
To a large extent To some extentNeither to a small nor a large extent To a small extentNot at all

ICT DEVELOPMENT IN EDUCATION IN THE BALTIC COUNTRIES – 2004-2005 86
5.2. Hindrances and driving forces influencing the introduction of the of
Information communication Technologies in education
The studies conducted in the Baltic States show that the main hindrances to the
intensive ICT usage in training are both technical (lack of computers) and financial
(lack of funding), as well as intellectual (lack of methodological support and training
programs) and psychological (fear to look incompetent in the eyes of pupils).
5.2.1. Situations at school hindering the ICT usage in training
During the quantitative study conducted in Latvia teachers were asked a question on
whether they at school have faced various situations, hindering the ICT usage in
training. Almost one fifth of teachers (24,7%) indicated that they have faced a
situation of psychological barriers, when ICT are not used in training process,
because they are afraid to look incompetent in the eyes of pupils. The obtained
information is in line with that learned during the qualitative study that „It is
psychologically difficult for adults to admit that they are not able to do something –
children do not have such problems, if they cannot do anything, they ask others, but
really few teachers dare to ask a pupil to give him advice. Teacher would feel
ashamed to ask. Teachers of the Latvian language should put up with the fact that in
the 7th form three fourths of pupils would have a better knowledge of computers than
they, when learning, how to write official documents. It is a psychological problem of
the generation, since young people will always have better knowledge of new
technologies.” (Specialist of the Riga district Education Board)
The second most frequently mentioned situation (24,4% of teachers), which hinders
the intensive ICT usage in the training process, is the fact that computer classrooms
are too occupied with IT classes. Due to this business and due to the fact that in
most cases classrooms of other subjects have no computers and projectors,
teachers of other subjects cannot teach their classes in the IT classroom, for training
using ICT (see the Chart on the next page).

ICT DEVELOPMENT IN EDUCATION IN THE BALTIC COUNTRIES – 2004-2005 87
Source: Latvian Facts quantitative survey 2005
Teachers, that have faced the following situations at their school. (N=teachers Latvia)
8.0%
13.6%
19.6%
24.4%
24.7%
5.6%
0% 10% 20% 30%
School administration thinks that computers are really atreasure, that is why, w ith the exception of IT classes,the computer classroom is not accessible to teachers
of other subjects
Although there is a sufficient number of computers atour school, still teachers cannot freely use them due to
administrative restrictions – one has to submit anapplication to a headmaster/ superintendent, in details
substantiating the necessity for the
Teachers cannot independently perform all theoperations w ith computers that they find necessary.
Computers can be used only through an administratorof the computer classroom/ an IT teacher – he performs
all the necessary activities instead of teachers
The usage of Internet in the study process is restrictedwith the defined time limit, that can be spent by each
teacher in Internet
Computer classrooms are so occupied w ith just ITclasses that teachers of other subjects cannot use
them for teaching their subjects
Teachers do not use information and communicationtechnologies in the training process, because they areafraid to be found ignorant by their pupils – the fact that
a pupil could be more informed about moderntechnologies, creates psychological discomfort

ICT DEVELOPMENT IN EDUCATION IN THE BALTIC COUNTRIES – 2004-2005 88
Also within the quantitative study conducted in Lithuania teachers were asked a
question about various situations hindering the ICT usage in education. Like in
Latvia, also Lithuanian teachers most often (28%) mentioned that they have faced
fear to look more incompetent than their pupils. But the second most frequently
mentioned situation was the limited access to ICT without an IT teacher’s mediation
(22.5%).
Source: Social Research Laboratory at the Kaunas University of Technology
quantitative survey 2005
Teachers, that have faced the following situations at their school. (N=teachers Lithuania)
5.5%
8.9%
22.5%
28.0%
2.7%
0% 10% 20% 30%
Although there are enough computers in the school,the teachers cannot use them freely up to now due to
the prohibitions/restrictions posed by theadministration
Time of being on the Internet which is used by theteachers for learning is limited.
Only the informatics teachers work in the computerclassrooms. The teachers of other subjects cannot
use them for teaching their subject.
The teachers just do not have the access tocomputers. They can use computers only through the
administrator of computer classrooms/informaticsteacher
The teachers avoid to use information andcommunication technologies in teaching (learning),
since they are afraid to turn out to be less sofisticatedthan their students

ICT DEVELOPMENT IN EDUCATION IN THE BALTIC COUNTRIES – 2004-2005 89
5.2.2. Hindrances delaying the ICT introduction and their intensive usage
in training process
According to IT teachers and teachers of other subjects surveyed during the
quantitative study in Latvia, the main hindrance delaying the ICT introduction and
their intensive usage in training process is the lack of funding (62,1% of IT teachers;
57,3% of teachers). As the next reason is mentioned the schools’ bad technical
maintenance (20,3% and 19,7% respectively). The other answers, which are mainly
related to teachers’ interest and preparation level, are mentioned in less than 10% of
the cases.
Source: Latvian Facts quantitative survey 2005
What are the main hindrances to introduce and use ICT at schools?Multiple question, most frequently mentioned answers
(N=IT teachers+ teachers) LATVIA
15.1%
1.8%
9.8%
2.0%
7.3%
19.7%
2.6%
3.3%
4.6%
62.1%
57.3%
14.7%
9.1%
5.2%
3.3%
20.3%
12,4%
0% 10% 20% 30% 40% 50% 60% 70%
NA/DK
Other
Lack of specialists'
Teachers' busyness
Inefficiency of teachers'working with computers'
Disinterest of teachers'
Lack of knowledges/courses
Unsatisfactory techniscalbase
Lack of finances
Teachers (N=450) IT teachers (N=153)

ICT DEVELOPMENT IN EDUCATION IN THE BALTIC COUNTRIES – 2004-2005 90
Also the results of the qualitative study conducted in Lithuania show a similar picture
– 63% of Lithuanian teachers think that the main hindrance is the lack of funding, but
32% – the insufficient provision with computer equipment. Unlike Latvia, in Lithuania
respondents most often (68%) as the main hindrance to the introduction of ICT in
education have mentioned the problems related to software – 32% consider that they
are short of legal software, 20% - that software is outdated, 12% - that they would
need special training programs.
Lithuanian qualitative study: main hindrances to the ICT introduction in education
Main difficulties and obstacles encountered in the past few years by implementing IT in Lithuanian schools (N =42)
Category (%) Subcategory (%) Lack of legal software 32% Out-of-date hardware and/or software 20% Lack of teaching/learning software (especially in Lithuanian language)
12%
Lack of teaching/learning software (especially for pupils with special needs)
2%
Problems concerned with ‘software’
68%
Viruses 2% Lack of funds/sponsorship 61% Financial problems 63% Small investments from municipalities 2%
Lack of computers 32% Insufficient teachers’ computer literacy skills 20% Insufficient computer
literacy skills 27%
Insufficient student’s computer literacy skills 7% Lack of competitive IT’s specialists
24%
„Slow Internet“/ insufficient quality of the Internet line
24%
No possibilities to renew computers’ appliances
17%
Not clear politics of government and/or municipality
10%
Insufficient legal basis 2%
Problems considered with legal basis
15%
Inadequacy of national curriculum for IT integration
2%
Teachers avoid to use IT in the educational process
12%
There are some unusable/unused possibilities of IT in educational process
9%
Additional time for the preparation of lessons 4%
Other problems 27%
Low-quality hardware which are handed over from Ministry of Education and Science
2%

ICT DEVELOPMENT IN EDUCATION IN THE BALTIC COUNTRIES – 2004-2005 91
But, according to the qualitative study conducted in Estonia, Estonians consider that
the main hindrance is the non-existence of a specific state program, which would
ensure the ICT introduction in education (there is the educational policy without ICT,
and the ICT policy without education). Currently Estonian curricula have no elements
related to ICT usage – training programs, methodologies etc. (I think that we would
have better use if the national curriculum said that ICT means are to be used, if
textbooks contained tasks that requires the use of a computer and if exercise books
can be filled out on the Internet rather than on paper. Because teachers see that she
or he no longer has to think of what to use and what activities to develop. This would
be a methodological guidance and a fixed direction that would be very helpful; State
curriculum should make a clearer reference to integration of ICT means. Because the
Intel training is too one-sided (lack of pedagogical and e-school support, too much
focused on Microsoft software), we organize a course that is mainly based on e-
learning, in the key of digital didactics. This should be continued and made more
massive).

ICT DEVELOPMENT IN EDUCATION IN THE BALTIC COUNTRIES – 2004-2005 92
5.2.3. Driving forces of ICT introduction in training process
In Latvia teachers think that the main driving force for the introduction of modern
technologies in educational system is teachers’ own interest (teachers - 23,6% and
IT teachers - 21,5%). In the next position we can observe an essential difference
between the opinions of teachers of other subjects and IT teachers or deputy
headmasters responsible for IT matters. Thus, teachers are willing to receive state
institutions’ (for example, Ministry’s of Education) support on a political level,
whereas IT teachers or deputy headmasters responsible for IT matters, who take
care of school’s technical maintenance, think that the ICT introduction can be
intensified, if increasing financing.
Source: Latvian Facts quantitative survey 2005
What are the main driving forces to introduce and use ICT at schools?Multiple question, most frequently mentioned answers
(N=IT teachers+ teachers) LATVIA
4.6%
5.9%
5.9%
5.2%
6.5%
5.9%
5.9%
22.9%
21.5%
13.1%
14.8%
22,9%
23.6%
5.2%
3.3%
11.5%
1.4%
6.4%
22.2%
0% 10% 20% 30%
NA/DK
New and qualitativeteachings materials
Pupils'/ parents'involvement
Financial support
Tehnological development
Easy to get information andexchange with it
Involvement ofadministration
Expanding possibilities
State institution support/State policy
Teachers' involvement
IT teachers (N=153) Teachers (N=450)

ICT DEVELOPMENT IN EDUCATION IN THE BALTIC COUNTRIES – 2004-2005 93
Regarding the facilitation of teachers’ interest, within the Latvia’s qualitative study
experts indicated that there could be at least two scenarios – the optimistic and the
pessimistic one.
According to the optimistic scenario, teachers could be motivated to use ICT in
training process with an additional payment to their salary for an innovative approach
(such an opinion is popular at those schools, in which ICT already are used relatively
widely – for example, at the Ogre Grammar School), as well as supporting teachers
technically – if a teacher at home or at school has a free access to a computer, he
loses his “fear” from it and forms routine work skills (this approach is popular at the
schools, in which ICT are used relatively rarely).
However, some experts mentioned that one should not overestimate the additional
payment for innovation, since it may happen that traditional methods also may have
good results (Headmaster of a grammar school: If we speak about additional
payments, it really matters, how large it could be – 10-15 lats won’t be a significant
payment, whereas 80 lats will be an abnormal payment. A person, who does not use
ICT, perhaps just with chalk and a blackboard has very good success in his training
work, but he will not receive the additional payment just due to the fact that
somebody else will show nice pictures on the computer. It won’t be right).
But the pessimistic scenario envisages that the problem will be solved of its own, with
the change of teachers’ generations and when ICT would become a life’s necessity
like bank settlement cards and cellular telephones (an IT teacher of a grammar
school: There are possibilities to use a computer, but, if these skills are not acutely
necessary, you can use your time much more usefully. If we compare it with other
things, we could say as follows – there was a period, when they stopped paying
salaries in cash and you were forced to start using bankcards. Before that it was also
possible to open a bank account, but in most cases teachers did not do it, because it
was complicated. The same was regarding cellular telephones – at the beginning
many people considered that it is exclusive but now it is our daily life, and it is hard to
do without it. The same is regarding computers – school is a conservative institution,
which does not quickly react to changes in the surrounding environment and the
same refers to teachers. The people who for years can work at school are ones with
conservative opinions, sticking to their own views).
According to all experts, the problem shall be solved, drafting a national level
computerization strategy of educational system and renewing financing for the LIIS

ICT DEVELOPMENT IN EDUCATION IN THE BALTIC COUNTRIES – 2004-2005 94
project, which could mean the purchase of new computers and the change of old
computers.
Also within the Lithuanian qualitative study experts have indicated that the main
driving force for the ICT introduction is financing (80%). As the next factor facilitating
the ICT usage was mentioned the fact that more attention is paid to software (34%).
Almost one fifth of respondents consider that teachers shall be additionally taught to
work with ICT, but about 15% think that a driving force should be a national support
to educational organizations.
Lithuanian qualitative study: the necessary support to the ICT introduction in
education
Recommendations to Lithuanian government, structures of business, influential NGOs (N =42)
Category (%) Subcategory (%) Give more finances to schools’ computerization and/or renewal of computers appliances
56%
Investment not only to „hardware“, but also to „software“
13%
IT’s coordinator establishment 7%
To invest funds 80%
Raise the payment of IT’s specialist in the schools 3% Establish legal software in the schools / give more attention to software
17% Pay more attention to software
34%
Create common integrated software package in a school
17%
Organize teaching, computer literacy’s seminars
19,5%
Government’s support to organizations maintaining education
14,6%
Control IT’s implementation process in the schools 5% Administer the control 12% Control use of finances 7%
Legally regulate IT’s establishment and usage in the schools
12%
Create united informational system
12%
IT hardware in schools consign to care of the professional firms
5%
Include ICT requirement to employees’ official specifications
5%
Other 12%
Contract and hold connection with different foundations and organizations that can support IT development
2%

ICT DEVELOPMENT IN EDUCATION IN THE BALTIC COUNTRIES – 2004-2005 95
The impact of the lack of financing on the ICT introduction in education is well
characterized by the information obtained during the Latvian qualitative study. During
the last two years the state is granting no more financing for the purchase of
computers within the LIIS project, that is why not only the purchase of new
computers has stopped, but also the change of the old ones, which is necessary for
the maintenance of the already achieved level. According to the LIIS representatives’
calculations, in 2004, just in order to maintain the existing level, 5,208 computers
should have been changed, and it would cost 2.604.000 lats (a LIIS project manager:
In order to maintain the existing level, this year we need 2,5 millions, whereas for
computerization for the next two years only 1,5 million lats are envisaged). But, in
order to ensure development and achieve, for example, the EU level of 2002, in 2004
we should have purchased 12,122 computers, which would cost 6.061.000 lats.
The LIIS forecast shows that, if the computer stock is not regularly renewed, by year
2008 one would reach a 0 point, when the computerization of the educational system
should be started anew (a representative of the Education and Science Ministry:
Computers’ life is from 3 to 5 years. In order just to maintain the achieved level, each
year one should change at least 1,000 computers, but now there has been an
interruption for several years). However, in this forecast, ignoring the reality that
during the last years Latvia’s school computer stock is renewed mainly with municipal
funds, it is assumed that all computers functioning in education system are bought
only for state budget funds.
Thus, constantly not renewing and not supplementing a computer stock, there is an
increasing number of the computers, which are difficult to use in training process (a
representative of the Education and Science Ministry: About 60% of computers
cannot be used to teach people to work with modern programs) – outdating
equipment just deepens the unsolved problem of overburdened computer
classrooms which is typical for many schools. Experts mentioned the occupation of
computer classrooms as one of the main reasons, why ICT are not actively used,
when teaching other subjects than IT.

ICT DEVELOPMENT IN EDUCATION IN THE BALTIC COUNTRIES – 2004-2005 96
5.2.4. Causality determining the inactive ICT usage in training process
To a large extent the data obtained during the Latvia’s school survey correlate with
the reasons (which are causing obstacles) identified during the qualitative study and
with the factors which are causing the negative background for the ICT usage in
training. Generalizing, it is possible to form a chain of regularities, due to which
teachers do not use ICT too actively in training process.
1. Until now in Latvia there has not been a uniform long-lasting education
computerization strategy of a national (ministry) level, which would provide
regular financing for the achievement of the set goals; thus, the government
has easily managed to refuse from the financing of the LIIS project, which
until now has ensured computerization of Latvia’s schools (Secretariat of
Minister of special tasks on Electronic management matters (SMSTEMM):
Until now they were employees of the Computer Science Institute of the
University of Latvia (UL), who had their vision, and not employees of the
Ministry of Education (ME), as it should be. At that time it was the UL initiative
and it is very good that it was, but it is definitely clear that now the initiative
should come from the ME, which should also draft the strategy. If the ME
forms education policy in Latvia, and computerization strategy, as well as
further separate projects are based on it, regular financing also should be
envisaged for it. Until now everything has been just the opposite – the UL
came with a specific project and further it was developing as it was managed
by the UL. No initiative has come from the state, most likely due to the fact
that the ME has not had a particular specialist, who would concentrate on the
computerization of education. Actually, just the lack of strategy shows that
until now nobody has dealt with it. And thanks God that the UL people had
their initiative, otherwise at schools we would not have anything at all.
2. When the financing ended, the process of supplementing and renewing
computer stock stopped (LIIS project manager: Until 2003 every year we
received about 3 million lats, but now - only so much that we can ‘preserve’
LIIS life, i.e. – about 300.000).
3. School administrations themselves usually do not have a sufficient
understanding of the ICT significance for education (Clerk of the Education
and Science Ministry: If at school there are sufficiently active people, who
understand the importance of ICT, then the school is very well computerized
even in poverty conditions, because both various foundations and social

ICT DEVELOPMENT IN EDUCATION IN THE BALTIC COUNTRIES – 2004-2005 97
projects are used. If at school there is no such a leader, then most probably
there are only the compulsory 3 computers for the school administration),
thus, no alternative finance sources are searched in order to supplement or
renew the existing computer stock.
4. In the situation of not renewing and not supplementing school computer
stock, computer classroom is not unburdened from IT classes, besides,
computer equipment is continuing to get old and becoming unusable for
intensive usage. Thus, the already scarce possibilities for teachers of other
subjects to use a computer classroom for teaching their subjects are
decreasing dramatically (Head of the School Board of the Daugavpils District:
It is problematic that there is only one computer classroom; if it is a large
school, all the time there are IT classes. The classrooms are occupied and
the others cannot get there).
5. A part of teachers do not have home computers, since in comparison with
their salary computers are expensive (Chief Specialist of the School Board of
the Riga District: In Sweden a teacher has to work for a month maximally in
order to buy a computer, whereas in Latvia – half a year… That is why so few
teachers have their own computers at home – it is good that they have
children, then at least they force to buy one), besides, at school possibilities
to use computers (due to the busy computer classrooms) are limited. Thus,
teachers of other subjects cannot strengthen the knowledge acquired at
computer courses – they do not develop their skills to work with computers
and they do not have a habit to use ICT (IT teacher in Gymnasium: It would
be ideal, if at teacher’s working place, which quite often is his home, there
were a computer, but due to financial reasons quite often it is not possible. If
computers were available, then, in my opinion, there would be no problems at
all, because it would become a daily phenomenon. If you use a computer too
rarely, you do not develop any skills. You have knowledge, but no skills).
6. Quite often pupils at home have newer computers and they can work better
with them than teachers. Thus, a teacher, making sure about the modesty of
his skills, strengthens his “fear to become ridiculous” in the eyes of pupils and
he loses the willingness to try to use ICT when teaching his subject (Chief
Specialist of the School Board of the Riga District: It is psychologically difficult
for adults to admit that they are not able to do something – children do not
have such problems, if they cannot do anything, they ask others, but really
few teachers dare ask a pupil to give him advice. Teacher would feel

ICT DEVELOPMENT IN EDUCATION IN THE BALTIC COUNTRIES – 2004-2005 98
ashamed to ask. Teachers of the Latvian language should put up with the fact
that in the 7th form three fourths of pupils would have a better knowledge of
computers than they, when learning, how to write official documents. It is a
psychological problem of the generation, since young people will always have
better knowledge of new technologies).
7. As a result: no practical possibilities => no skills => no confidence of one’s
strength => no psychological motivation to use ICT in training process.
The scheme shows the chain of regularities identified during the qualitative study,
why teachers do not use ICT in training process:
Combining the data obtained during the qualitative and quantitative studies, we can
conclude that, although relatively many teachers have access to a home computer,
still the actual lack of possibilities (computer classrooms are occupied; there is a
shortage of new computers at schools) to use them in training process, combined
with teachers’ doubt about their skills and fear to look ridiculous in the eyes of their
“computerized” schoolchildren hinder the ICT usage in training process. At the same
time regarding the other subjects, where ICT are used (with the exception of IT
classes) we should rather speak about passive usage (writing of texts) of computer
technologies and not about the active one (simulations, presentations).
The state has no strategy No money
Inertial administration, not looking for alternative
possibilities
No sufficient number of computers at school
Overburdened computer classrooms
Teachers have nocomputers at home
Teachers of other subjects no possibilities
to work with ICT
No skills developingto work with ICT
The knowledge acquired during training is lost
The psychological barrier “pupil is clevererthan I” is strengthening
Teacher loses the motivation to use ICT in training process
even if there is such apossibility
ICT ARE NOT USED IN TRAINING PROCESS

ICT DEVELOPMENT IN EDUCATION IN THE BALTIC COUNTRIES – 2004-2005 99
6. SIGNIFICANCE OF INFORMATION COMMUNICATIONS TECHNOLOGIES IN EDUCATION
6.1. ICT at school – a factor facilitating the improvement of the quality of
study process
Study participants (IT teachers (in Latvia), teachers of other subjects (in Latvia and
Lithuania) and future teachers (in Latvia)) had to evaluate to what extent they agree
or disagree with several statements on the ICT impact on training process.
Respondents mainly agree with the fact that the ICT usage has an informatively
communicative potential – the statements, that they help both pupils and teachers to
get information, on average are supported by 85% and more respondents. At the
same time the statement that ICT facilitate communication between pupils and
teachers is supported by approximately 50% of respondents in Latvia and by
approximately 70% in Lithuania. The statement that the usage of computer
technologies facilitates pupils’ motivation to learn and develops their critical thinking,
is supported by approximately 75% of respondents in Lithuania and by only about
half or fewer respondents in Latvia. On the whole, the respondents in Latvia tend to
be a little more reserved than the Lithuanians (see Chart on the next page).
No essential tendencies can be observed in the respondents’ socially demographic
groups.

ICT DEVELOPMENT IN EDUCATION IN THE BALTIC COUNTRIES – 2004-2005 100
Source: Latvian Facts quantitative survey 2005
The usage of ICT in training…
9.2%
5.9%
40.4%
12.4%
12.4%
11.9%
43.8%
14.7%
15.0%
5.9%
28.6%
13.6%
17.0%
9.9%
32.9%
12.4%
25.5%
26.7%
31.9%
25.3%
26.1%
36.6%
76.3%
54.7%
71.9%
30.7%
79.0%
54.7%
72.6%
32.0%
32.7%
36.0%
33.8%
37.3%
29.7%
35.4%
36.0%
45.1%
32.7%
40.7%
35.6%
38.6%
41.6%
45.8%
47.8%
50.3%
33.7%
30.7%
41.6%
43.1%
46.5%
21.3%
38.7%
24.8%
49.5%
18.6%
34.4%
26.1%
49.5%
26.1%
31.1%
34.0%
19.1%
34.4%
38.0%
44.6%
16.0%
32.9%
28.8%
29.7%
19.8%
30.2%
32.0%
35.6%
16.8%
26.2%
13.9%
2.2%
16.8%
2.2%
19.8%
9.1%
19.6%
22.9%
3.8%
12.9%
11.1%
11.9%
3.8%
12.7%
10.5%
27.7%
9.9%
15.8%
11.8%
8.9%
3.3%
10.0%
7.8%
2.0%
2.0%
6.4%
2.0%
9.6%
5.9%
22.9%
32.7%
22.8%
41.3%
3.3%
0.7%
8.2%
2.6%
22.2%
31.9%
31.7%
34.7%
24.4%
16.3%
5.9%
1.0%
0.9%
1.6%
4.6%
22.8%
5.3%
5.2%
0.6%
1.3%
1.0%
0.2%
0.2%
3.1%
0.7%
0.7%
1.0%
0.7%
2.0%
2.0%
0.7%
1.8%
0.8%
2.0%
2.6%
2.0%
5.8%
0.6%
4.0%
6.4%
1.0%
4.0%
0.7%
0.7%
4.0%
1.2%
2.8%
0% 10% 20% 30% 40% 50% 60% 70% 80% 90% 100%
students of pedagogy (Latvia)
teachers (Lithuania)
teachers (Latvia)
IT teachers (Latvia)
students of pedagogy (Latvia)
teachers (Lithuania)
teachers (Latvia)
IT teachers (Latvia)
students of pedagogy (Latvia)
teachers (Lithuania)
teachers (Latvia)
IT teachers (Latvia)
students of pedagogy (Latvia)
teachers (Lithuania)
teachers (Latvia)
IT teachers (Latvia)
students of pedagogy (Latvia)
teachers (Lithuania)
teachers (Latvia)
IT teachers (Latvia)
students of pedagogy (Latvia)
teachers (Lithuania)
teachers (Latvia)
IT teachers (Latvia)
students of pedagogy (Latvia)
teachers (Lithuania)
teachers (Latvia)
IT teachers (Latvia)
students of pedagogy (Latvia)
teachers (Lithuania)
teachers (Latvia)
IT teachers (Latvia)…
dev
elo
ps
pu
pils
’cr
itic
al t
hin
kin
g
…in
crea
ses
pu
pils
’m
oti
vati
on
to
stu
dy
…in
crea
ses
co-
op
erat
ion
am
on
gp
up
ils
…fa
cilit
ates
com
mu
nic
atio
nb
etw
een
pu
pils
and
tea
cher
s
…in
crea
ses
pu
pils
’ab
iliti
es t
o s
olv
ep
rob
lem
s
…h
elp
s p
up
ils w
ith
spec
ial
nec
essi
ties
…fa
cilit
ates
pu
pils
’ab
ility
to
acq
uir
ein
form
atio
n
…fa
cilit
ates
teac
her
s’ a
bili
ty t
oac
qu
ire
info
rmat
ion
Completely agree Rather agree Neither agree, nor disagree Rather disagree Absolutely disagree DK/NA

ICT DEVELOPMENT IN EDUCATION IN THE BALTIC COUNTRIES – 2004-2005 101
6.2. ICT at school – the image factor when selecting a school
Within a monthly Latvian public opinion poll parents of school age children were
asked questions on the factors influencing them, when making a decision on to which
school to send their children and on the significance of ICT in their children’s
education and further life.
For respondents with school age children, when selecting a school for their child, the
most significant aspect is the school’s location - close to their home, their personal
impression of the education quality provided by the school and the fact, whether
during the study process modern technologies are used. If the first factor is really
practical, but the second one – emotional and subjective, then the third one is
rational and objective, because it is oriented to the development of skills necessary
for the future work market. It is proven also by the parents’ attitude toward the usage
and acquiring of the modern technologies – most parents completely or rather agree
with the statements which prove the necessity for modern technologies in daily life
and at school and their significance for their children’s future. Only 14 respondents
(5,6%) agree with the statement that acquiring of modern technologies makes no
sense and they will not be necessary for their children.
No essential tendencies can be observed in the respondents’ socially demographic
groups.

ICT DEVELOPMENT IN EDUCATION IN THE BALTIC COUNTRIES – 2004-2005 102
For more than half (57,4%) of the respondents with school-age children, surveyed in
a monthly public opinion poll, the most important factor, determining the selection of
a school for their children’s studies, is the fact that it is located close to their home.
For almost half (49%) of respondents very important is the personal opinion of the
quality of the school’s provided education. The usage of modern technologies in
training is important for approximately one fourth of respondents (26,5%). But most
respondents, when selecting a school, would not care, whether it has a swimming-
pool (71,9%) or a new gymnasium (43,7%).
Factors, which perhaps influence people, when they make a decision on which school will be attended by their child in the future
(respondents who personally have a school-age child/ children: N=249)*
8.4%
10.8%
12.4%
21.3%
45.0%
7.6%
18.1%
14.9%
16.9%
27.7%
12.4%
17.3%
8.4%
15.7%
24.5%
16.9%
15.3%
12.0%
9.2%
24.1%
12.0%
10.4%
15.3%
18.5%
12.0%
7.2%
33.7%
29.3%
10.0%
9.6%
7.6%
6.4%
10.0%
42.6%
16.9%
8.0%
10.8%
1.2%
0.4%
2.4%
5.2%
8.4%
24.5%
20.9%
15.3%
6.4%
2.8%
6.4%
3.6%
0.4%
0.8%
0.4%
0.4%
0.4%
0.4%
0% 10% 20% 30% 40% 50% 60% 70% 80% 90% 100%
The school has a new or agood gymnasium
The school has a new or agood swimming-pool
Modern technologies areused during the studyprocess (computers,
Internet)
The dominating publicimpression of the school/
prestige of the school
School specialization(mathematics, literature,
languages, chemistry,etc.)
Personal impression ofthe education quality
guaranteed by the school
The school is close tohome
*Omnibus survey: Latvia, April 2005 1 - the most important 2 3 4 5 6 7- the least important DK/NA

ICT DEVELOPMENT IN EDUCATION IN THE BALTIC COUNTRIES – 2004-2005 103
When analyzing the obtained results by the average showings, we can see that in the
scale from 1 to 7, where 1 means “of a minor importance”, whereas 7 – “very
important”, a school’s close location to home has been evaluated by respondents
with 5,161 points, but their personal opinion of the school – with 5 points, which shall
be considered as medium high evaluations. But the usage of modern technologies in
training has been evaluated with 4,448 points, which is a little above the average
evaluation. As it can be seen, for children’s parents the most important thing is the
fact that school is located close to home and their child can easily reach the school,
and not the fact that the school has a swimming-pool or a new gymnasium. Also
usage or non-usage of modern technologies is not the main factor, when selecting a
school, because parents’ choice is subjected to personal opinions on the quality of
the education provided by the school.
Factors, which perhaps influence people, when they make a decision on which school will be attended by their child in the
future (respondents who personally have a school-age child/ children: N=249) Average rating*
2.138
3.032
3.923
4.343
4.448
5.000
5.161
1 2 3 4 5 6 7
The school has a new or a good swimming-pool
The school has a new or a good gymnasium
The dominating public impression of the school/prestige of the school
School specialization (mathematics, literature,languages, chemistry, etc.)
Modern technologies are used during the studyprocess (computers, Internet)
Personal impression of the education qualityguaranteed by the school
The school is close to home
*Om
nib
us
surv
ey:
Lat
via,
Ap
ril
2005
the least the mostimportant important
C

ICT DEVELOPMENT IN EDUCATION IN THE BALTIC COUNTRIES – 2004-2005 104
At the same time, evaluating various statements on the role of modern technologies
in children’s life, almost all respondents (97,2%) consider that their child could not do
without them and that they should be acquired already at school. Such a position is in
line with the opinion of experts, clarified as a result of the qualitative study, that labor
market requires skills to work with computer technologies and schools should teach
children to work with them (an IT teacher of a grammar school: If I don’t teach my
pupils to work with computers, they won’t be competitive in the labor market). The
opinion that modern technologies will have no importance in children’s future, is
supported by just approximately 5% of respondents.
Several expressions, which sometimes can be heard from children’s parents, when speaking about modern technologies and their
acquirement. (respondents who personally have a school-age child/ children: N=249)*
30.5%
38.6%
46.2%
60.2%
73.5%
24.9%
42.2%
37.8%
31.7%
23.7%
15.3%
70.3%
19.7%
0.4%
5.2%
2.0%
5.6%
22.9%
24.1%
10.0%
0.8%
0.4%
3.2%
2.4%
2.0%
2.8%
1.6%
0.8%
1.2%
0% 10% 20% 30% 40% 50% 60% 70% 80% 90% 100%
I don’t think it makes sense to acquire thesetechnologies, my children won’t need them
These skills will not be necessary for our generation, but they could be useful for our children
These skills are important and modern technologieshave a future, however unfortunately our children in
most cases use them uselessly (for example, playing games and not using for their
studie
They are necessary for all of us, that is why both I andmy children are using and acquiring the new
possibilities
Children shall acquire modern technologies not onlyat school, but also at home one shall guarantee the
appropriate conditions (computers, Internet), so thatthey could use them substantially
In the modern world children can’t do without themanymore, that is why they should acquire them
already at school
*Omnibus survey: Latvia, April 2005Completely agree Rather agree Rather disagree
Absolutely disagree DK/NA

ICT DEVELOPMENT IN EDUCATION IN THE BALTIC COUNTRIES – 2004-2005 105
When analyzing the obtained results by average showings, it can be seen that in the
scale from 1 to 4, where 1 means “absolutely disagree”, but 4 – “completely agree”,
parents have evaluated the statement “in the modern world children can’t do without
them anymore, that is why they should acquire them already at school” with 3,699
points, which is a very high evaluation. Also the other statements, which prove the
significance of computer technologies and the necessity to acquire them, on average
have been evaluated with 3 and more points. But the statement “I don’t think it
makes sense to acquire these technologies, my children won’t need them” has been
evaluated with 1,350 points, which is a very low evaluation.
Several expressions, which sometimes can be heard from children’s parents, when speaking about modern technologies
and their acquirement. (respondents who personally have a school-age child/ children: N=249)
Average rating*
1.350
3.699
3.549
3.306
3.188
2.668
1 2 3 4
I don’t think it makes sense to acquire thesetechnologies, my children won’t need them
These skills will not be necessary for ourgeneration, but they could be useful for our
children
These skills are important and moderntechnologies have a future, however unfortunately
our children in most cases use them uselessly (for example, playing games and not using for
their studie
They are necessary for all of us, that is why both Iand my children are using and acquiring the new
possibilities
Children shall acquire modern technologies notonly at school, but also at home one shall
guarantee the appropriate conditions (computers,Internet), so that they could use them substantially
In the modern world children can’t do withoutthem anymore, that is why they should acquire
them already at school
*Om
nib
us
surv
ey:
Lat
via,
Ap
ril
2005
Absolutely Completely disagree agree