information capacity of full body...
TRANSCRIPT

Information Capacity of Full-Body Movements
Antti Oulasvirta Max Planck Institute for Informatics
Germany
Teemu Roos, Arttu Modig, Laura Leppänen Helsinki Institute for Information Technology HIIT
University of Helsinki and Aalto University, Finland ABSTRACT We present a novel metric for information capacity of full-body movements. It accommodates HCI scenarios involv-ing continuous movement of multiple limbs. Throughput is calculated as mutual information in repeated motor se-quences. It is affected by the complexity of movements and the precision with which an actor reproduces them. Compu-tation requires decorrelating co-dependencies of movement features (e.g., wrist and elbow) and temporal alignment of sequences. HCI researchers can use the metric as an analy-sis tool when designing and studying user interfaces.
Author Keywords Information capacity; full-body movement; measurement; throughput; gesture-based interfaces; information theory
ACM Classification Keywords H.5.m. Information interfaces and presentation (e.g., HCI): Miscellaneous.
INTRODUCTION A fundamental problem for human–computer interaction (HCI) is to identify user interfaces that effectively map hu-man movement to virtual movement. To assess joint hu-man–computer performance, the “tempting but naïve” solu-tion is to examine average speed and accuracy in a task [21]. This approach, however, overlooks the fact that data from easy and from difficult motor acts are incommensura-ble. Information theory has contributed to the measurement of user performance in HCI by providing a metric that col-lapses data on speed and accuracy into a single metric: throughput (bits/s, or bps) [7,12,13,21]. Throughput is often measured as statistical variability in aimed movements wherein the user brings an end-effector (pointer) on top of a spatially expanded target. Information capacity denotes the rate at which the user could have sent messages, given her speed and accuracy for given target properties. Selecting targets with the mouse, for instance, yields throughputs of 3.7–4.9 bps [17]. Although the metric has been contested, no better alternatives exist for comparing performance across tasks, conditions, and devices.
This paper extends the measurement of throughput from aimed movement to full-body movement—that is, multiple contributing limbs in continuous movement that does not need to be aimed at targets prescribed by an experimenter.
In so-called configural movements, the goal is to produce a shape or pattern in movement. This can be contrasted to aimed movements, wherein only the end point of movement counts. Examples would be drawing on a surface with mul-tiple fingers, gesturing in the air to conduct a virtual orches-tra, and dancing with motion sensors. In these examples, a user’s ability to produce desired shapes reliably is more im-portant than where in the space the movement ends.
Our method takes as input motion data with any number of movement features (observation points on the human body). It calculates throughput from mutual information of two or more deliberately repeated movement sequences. Our defi-nition of mutual information captures the intuition that a skilled actor can produce complex (surprising) movements and reenact them precisely at will. Figure 1 illustrates com-plexity and reproducibility with the example of drawing a shape. For instance, linear motions with constant velocity, no matter how accurately repeated, are predictable and thus of low throughput. Analyzing precision in repeated efforts allows us to distinguish the controlled from uncontrolled aspects of movement. A newborn, for example, while able to produce complex-looking movements, does not have the capacity to reproduce them.
The metric is useful in HCI, because high throughputs po-tentially make more information available to an external observer such as a user interface—there are more “messag-es” the user could have sent by moving the body.
Figure 1. Information capacity is the mutual information of repeated movements (here: blue and light-blue trajectories),
determined by their complexity and the precision of reproduc-tion. Highly complex and precisely reenacted movements yield
the highest throughputs.
Permission to make digital or hard copies of all or part of this work for personal or classroom use is granted without fee provided that copies are not made or distributed for profit or commercial advantage and that copies bear this notice and the full citation on the first page. To copy otherwise, or republish, to post on servers or to redistribute to lists, requires prior specific permission and/or a fee. CHI 2013, April 27–May 2, 2013, Paris, France. Copyright © 2013 ACM 978-1-4503-1899-0/13/04...$15.00.

APPROACH The concept of information capacity here follows the Gaussian channel interpretation of Paul Fitts [6,7,12] but applies it to mutual information I(x; y) in movement se-quence x and its repetition y. I(x; y) denotes the reduction in bits in entropy of x when y is known. Since our I(x; y) ex-cludes most of the uncontrolled movements and inaccura-cies due to the actor’s inability to repeat the movement pre-cisely, it provides a measure of the controlled information in x and y. Computation is done in five steps (see Figure 2):
In Step I: Motion Capture, an actor is asked to carry out a movement and repeat it as precisely as possible. The motion of movement features is sampled. This procedure allows users to find natural ways to move—the only demand is that the same movement be repeated. In contrast, we believe that in some studies of aimed movements, constraining tra-jectories to end at experimenter-defined targets lowers throughputs. In Step II: Complexity Estimation, an auto-regressive model is fitted to each movement feature. We take the residuals as an indicator of its complexity, or its “surprisingness.” In Step III: Dimension Reduction, latent variable models are fitted to the residuals of x and y, reduc-ing the co-dependencies among features. Non-linear dimen-sion reduction is preferred in multi-feature motion data in order to avoid overestimation of throughput. In a violinist’s movement, for example, it decreases correlation between the elbow and the wrist. In Step IV: Temporal Alignment, the best alignment of frames between x and y is identified. Temporal alignment is necessary in multi-feature data be-cause the corresponding movement features of x and y may be differentially out of sync. In Step V: Mutual Infor-mation, I(x; y) is calculated by taking the frame-by-frame correlations of the model of x and y after dimension reduc-tion. Throughput is now estimated as I(x; y) per second.
To assess the potential of the method for research and de-sign in HCI, we report on three proof-of-concept studies. Study I studies information in a ballerina’s performance, and Study II analyzes trajectories in aimed movement. Study III examines human factors in the bimanual gestur-ing scenario of the movie Minority Report.
We conclude by discussing limitations and use in HCI.
Background: Information in Aimed Movements Because of space limitation, we refer the reader to existing reviews [7,13,21] and provide only the basics here. For dis-crete aimed movements, throughput TP is given by
TP = ID / MT (1)
where MT is movement time and ID the index of difficulty. It is determined by the width of target W and its distance D:
ID = log2 (D / W + 1) [12], and (2a)
ID = log2 (2D / W) [6]. (2b)
A variant generalizes a constant TP over a range of D and W conditions [21]. When MT obeys Fitts’ law,
MT = a + b ID, (3)
throughput is calculated as the slope of Fitts’ model:
TP = 1 / b. (4)
The benefit of using TP as an index of user performance is that it is found to be (relatively) robust to changes in the us-er’s performance objective, or the speed–accuracy tradeoff. For example, trying to reach the target too rapidly results in lower accuracy, but TP remains in a constant range. A vari-ant takes changes in performance objective into account by scaling W according to observed inaccuracies: The effective width is defined via the distribution of offsets from target center We = 4.133 σ [13,17]. Extensions of Fitts’ law mod-els to continuous aimed movements [1] covered only path width and length originally but were later extended to cur-vature [11]. However, to our understanding, these models have no interpretation in information theory.
Our metric shares with Fitts-TP the Gaussian channel inter-pretation of movement as a limited transmission channel [4]: “information capacity is limited only by the amount of statistical variability, or noise, that is characteristic of re-peated efforts to produce the same response” [6: p. 262]. In our metric, changes in direction and velocity during move-ment determine complexity. As with the idea of We, varia-bility in trajectories among the repeated efforts affects the total complexity of the repeated performance x and y. Our metric is also sensitive to changes in performance objec-tives (Study II).
Figure 2. Overview of computation steps in calculating information capacity (TP) in full-body movement.
x"
y"
Autoregressio
n+ rx"
ry"
Gaussia
n+process+ r’x"
r’y"
II Complexity estimation
rxp1 rxp2 rxp3 rxp4 rxp5 rxp6
ryp1 ryp2 ryp3 ryp4 ryp5 ryp6
TP
V Mutual information III Dimension reduction
ρyx"
Correla2
ons+
I Capture
Canonical+2me+warping+ix,y"
IV Temporal alignment
xt xt+1 xt+2 xt+3 xt+4 xt+5
εt(x) εt(x) εt(x) εt(x) εt(x) εt(x)
εt(y)
yt yt+1 yt+2 yt+3 yt+4 yt+5
εt(y) εt(y) εt(y) εt(y) εt(y)

Figure 3. To estimate complexity, second-order autoregressive models are fitted to movements x (above) and y (bottom). Re-
siduals εt expose the “innovativeness” of the trajectory.
COMPUTATION We here present details for computing I(x; y).
Step I: Motion Capture A pair of movement sequences is recorded in controlled conditions wherein an actor is asked to carry out a sequence (x) and repeat it as precisely as possible (y).
When performing y, the actor starts in the same initial posi-tion and posture. The repetition should take (about) as long as the original sequence. Multiple sequence pairs can be recorded, and throughput averaged over pairwise compari-sons, but the unit of analysis is always a pair, and we focus here on that case. The administration of repetitions and the metric itself are agnostic of movement constraints: Trajec-tories in aimed movements can be analyzed, as we show in Study III. However, sometimes imposing constraints may lead to underestimation or overestimation of capacity, as in the case of sliding movements on a physical surface.
The collected data on x represent a movement sequence with a single movement feature or a set of them moving in time in a 2D or 3D coordinate system. Let x = x-1,..., xn de-note a sequence where xt gives the value of the measured feature at time t. Similarly, we denote by y = y-1,..., yn the repeated sequence of the same length. The multi-feature case is a vector of such sequences (see Step III).
Step II: Complexity Estimation We let the complexity of a sequence be given by its entro-py. We assume that both x and y follow a second-order au-toregressive model (see Figure 3):
xt = β0 + β1 xt−1 + β2 xt−2 + εt(x), (5)
yt = η0 + η1 yt−1 + η2 yt−2 + εt(y), (6)
where β0, β1, β2, and η0, η1, η2 are real-valued parameters to be tuned via least squares. We start the sequence from x−1 instead of x1 for notational convenience: the first two en-tries guarantee that an autoregressive model with a look-back (lag) of two steps can be fitted to exactly n data points (Figure 3). The benefit of a second-order model is its sim-plicity and interpretability: it captures the physical principle that once the movement vector (direction and velocity) is
specified, constant movement contains no information. The errors (or “innovations”) ε(x) and ε(y) are assumed to be zero mean Gaussian variates. Since the two sequences are sup-posed to be instances of the same movement pattern, they will typically be correlated. We denote the Pearson correla-tion coefficient of ε(x) and ε(y) by ρ ∈ (−1,1). The innova-tions for different time frames t ≠ t′ are assumed to be inde-pendent of each other. After parameter fitting, we obtain the residuals
t t t ( 0 1 t−1 2 t−2), (7)
t t t (𝜂 0 𝜂1 t−1 𝜂2 t−2), (8)
where t and t denote the predictions obtained by plug-ging in least squares estimates 0, 1, 2, and 𝜂0, 𝜂1, 𝜂2, re-spectively. This formulation captures complexity as the shape of trajectory.
Step III: Dimension Reduction In handling of p-dimensional sequences, p > 1, where each time frame xt is composed of p measured movement fea-tures, xt ( ,..., ), it would be invalid simply to add up the information throughput of all of the features. For us to calculate the “genuine” capacity of the leg, any correla-tion in the movement of the knee and the calf must first be removed. We therefore perform dimension reduction.
Our preferred solution is Gaussian Process Latent Variable Modeling (GP-LVM)[16] administered separately on the re-siduals of x and y. GP-LVM models have been used to model human movement, such as walking [18]. In our ex-perience, GP-LVM provides more effective dimension re-duction than does Principal Component Analysis (PCA), which is limited to linear relationships. Using GP-LVM typically reduced TPs by a factor of 2–4 when compared to PCA. However, GP-LVM is (very) slow to compute. We have learned that, most of the time, dimension reduction with PCA preserves the order of TPs and can be used if ab-solute throughput values are unimportant.
For computation, we utilize Fast GP-LVM [10] to transform the two sequences and obtain two new time series, r(x′) and r(y′). Each frame in the new sequences represents a latent variable corresponding to a frame in the original sequence. Figure 4 shows a projection of a GP-LVM model with three latent dimensions.
For this step, the residuals of sequences are normalized such that each feature has mean zero and unit variance. Sca-leinvariance is essential for the comparison of fine-grained and gross movements.
As we discuss in the next section, the number of latent vari-ables (dimensions) in PCA/GP-LVM should be decided case by case by keeping reconstruction error at an accepta-ble level. In our studies, we have used RSME (root square mean error) as an indicator of reprojection error and used .05 as our criterion for an acceptable level.
εt-1y)
xt-1 xt xt+1 xt+2 xt+3 xt+4
yt-1 yt yt+1 yt+2 yt+3 yt+4
εt-1(x) εt(x) εt+1(x) εt+2(x) εt+3(x) εt+4(x)
εt(y) εt+1(y) εt+2(y) εt+3(y) εt+4(y)
€
rt(x )
€
=
€
x
€
− x̂
€
=
€
x
€
−
€
ˆ β
€
+
€
ˆ β x̂
€
+
€
ˆ β x̂
€
rt(y )
€
=
€
y
€
−
€
ˆ y
€
=
€
y
€
−
€
+
€
ˆ y
€
+
€
ˆ y
x̂
€
ˆ y
€
ˆ β
€
ˆ β
€
ˆ β
€
=
€
xt(1)
€
xt(p )

Figure 4. Two dimension-reduced dances: The plots are GP-
LVM model manifolds with three latent dimensions.
Step IV: Temporal Alignment A problem in predicting one motion sequence from another is possible temporal misalignment of the sequences and their features. Single-feature sequences can be aligned manually, but this is impossible with a large number of fea-tures. Even in carefully repeated movements, some features are more out of sync than others (e.g., the toe could lag be-hind the wrist). Hence, in prediction of the tth frame of x, the most useful frame of sequence y may be not the tth frame but the (t+δ)th one, δ ≠ 0. Therefore, we must tempo-rally align frames in x with frames in y.
Our solution is to align sequence pairs with Canonical Time Warping (CTW), a state-of- the-art technique for aligning sequences that describe human behavior [22]. CTW uses the more traditional Dynamic Time Warping [1] as an initial solution but improves it by adopting features from Canoni-cal Correlation Analysis. The result is a pairwise alignment of x and y, ix,y, such that each frame in x is matched to the most likely frame in y. To achieve this, CTW duplicates some of the frames in each sequence so as to “slow down” a sequence at suitable points. When measuring throughput, we skip duplicated frames in sequence x in order to avoid unnecessarily magnifying their impact. Hence, if frame t is duplicated in sequence x such that in the aligned sequence frames t and t + 1 are identical, we skip the (t + 1)th frame (of both x and y) when computing throughput. It is im-portant to note also that in Step II we compute the residuals of both sequences from the unaligned sequences where there are no duplicate frames. Figure 5 shows an example in which two ballet sequences (Study I) have been aligned.
Step V: Mutual Information and Throughput Under models (5) and (6), the differential entropy of each sequence can be estimated by plugging the residual vari-ance into the familiar formula for the Gaussian entropy:
, , (9)
where is the residual variance of x.
The mutual information, which yields the reduction in bits in the entropy of one sequence when we are given the other, is now fully determined by the residuals and, in particular, their correlation ρ:
. (10)
However, since we do not in general know the true correla-tion coefficient, we need to estimate it from the data, which
causes some statistical error. The statistical variation of the mutual information estimate obtained by plugging the em-pirical correlation coefficient into Eq. (10) can be character-ized by means of results from classical likelihood ratio test theory [3,8]. In the case ρ = 0, the estimator asymptotically follows a χ2 distribution scaled by a factor 0.5 or, equiva-lently, a Gamma distribution Γ (k = 1 / 2, θ = 1), and in the case ρ ≠ 0, its distribution is asymptotically Gaussian, cen-tered at the true value of ρ. Hence, in the former case, the estimator has a positive asymptotic bias given by 0.5 times the mean of a χ2 distributed random variable, 𝑙𝑜𝑔!(𝑒) 2 ~ 0.731 bits, where e denotes the Euler constant. Although we do not know in advance which of the two cases holds for each feature of the data sequences, we subtract the bias 𝑙𝑜𝑔!(𝑒) 2 from each feature, which gives a conservative es-timate of I(x; y). Consequently, we estimate I 𝑥; 𝑦 = − 𝑛
!𝑙𝑜𝑔! 1 − 𝑝! − 𝑙𝑜𝑔!(𝑒) 2 (11)
where the last term is the bias correction.
The above method applies to unidimensional sequences. After the dimension reduction step, each movement se-quence is represented as a sequence of (low-dimensional) feature vectors. In Step V, we handle each feature inde-pendently as described above and sum the obtained mutual information estimates to obtain the total throughput esti-mate Îtot. We can then calculate TP in a multivariate se-quence x conditioned on sequence y as Îtot(x; y) per second:
𝑇𝑃 𝑥 𝑦 = 𝑅𝐼!"! 𝒙;𝒚𝑛
= − 𝑅!
𝑙𝑜𝑔! 1 − 𝑝! − 𝑅! 𝑛
𝑙𝑜𝑔!(𝑒), (12)
where R denotes the frame rate (frames per second).
Implementation Computation takes, on average, about 2.5 seconds to run for two 111-feature ballet sequences of 1,100 frames, and about 7.5 s for another two dances approx. four times that length. With regard to the number of movement features, computa-tion time scales linearly. However, times are longer with dimension reduction. While PCA adds only a few seconds, GP-LVM takes hours to days for such data. Below, we run some of our analyses with PCA. The caveat is that the abso-lute TPs values will be overestimated.
Figure 5. Two CTW-aligned sequences in the Ballet data. Each line is a one-dimensional movement feature. The y-axis shows
deviation from starting position. The alignment of the first (top) and the second repetition (bottom) is nearly perfect.
€
h(x) ≈n2
log2(2πe ˆ σ x2)
€
h(y) ≈n2
log2(2πe ˆ σ y2)
€
ˆ σ x2 = (rt
(x ))2 /nt=1
n∑
€
I(x;y) = −n2log2(1− ρ
2)
0 500 1000 1500
−2000
02000
Sequence 7
Frames
0 500 1000 1500
−2000
02000
Sequence 8
Frames
0 500 1000 1500
−2000
02000
Sequence 7
Frames
0 500 1000 1500
−2000
02000
Sequence 8
Frames
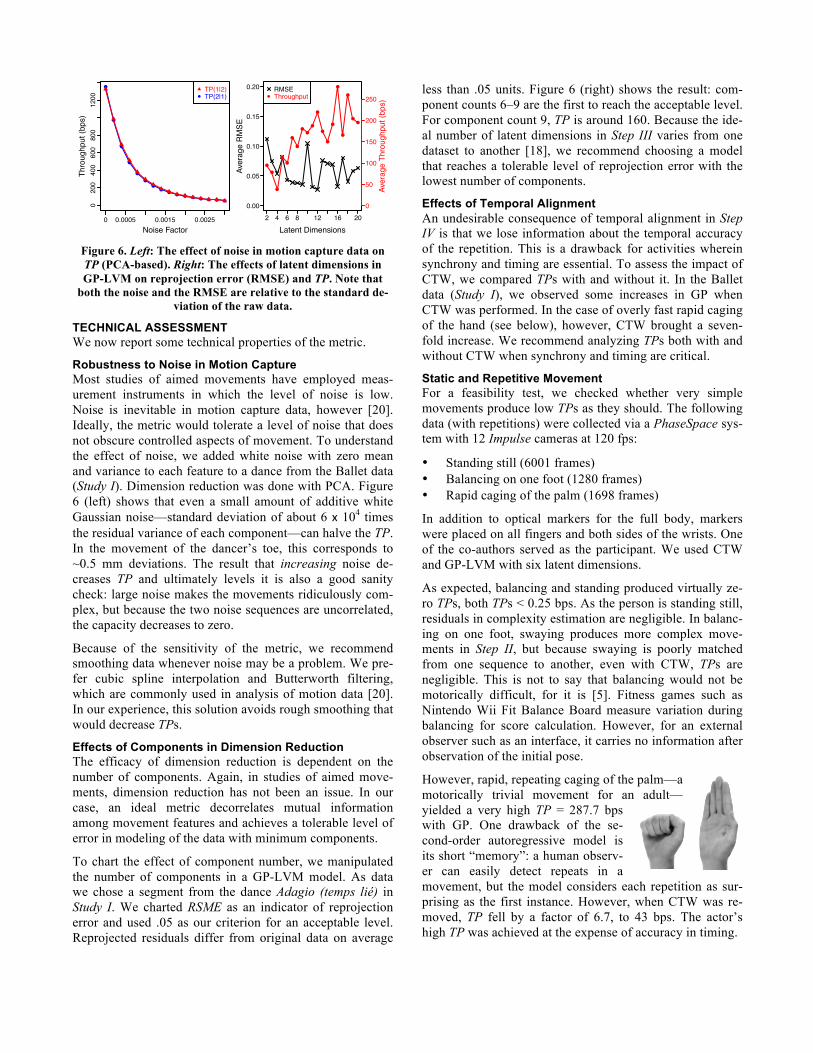
Figure 6. Left: The effect of noise in motion capture data on TP (PCA-based). Right: The effects of latent dimensions in GP-LVM on reprojection error (RMSE) and TP. Note that
both the noise and the RMSE are relative to the standard de-viation of the raw data.
TECHNICAL ASSESSMENT We now report some technical properties of the metric.
Robustness to Noise in Motion Capture Most studies of aimed movements have employed meas-urement instruments in which the level of noise is low. Noise is inevitable in motion capture data, however [20]. Ideally, the metric would tolerate a level of noise that does not obscure controlled aspects of movement. To understand the effect of noise, we added white noise with zero mean and variance to each feature to a dance from the Ballet data (Study I). Dimension reduction was done with PCA. Figure 6 (left) shows that even a small amount of additive white Gaussian noise—standard deviation of about 6 x 10⁴ times the residual variance of each component—can halve the TP. In the movement of the dancer’s toe, this corresponds to ~0.5 mm deviations. The result that increasing noise de-creases TP and ultimately levels it is also a good sanity check: large noise makes the movements ridiculously com-plex, but because the two noise sequences are uncorrelated, the capacity decreases to zero.
Because of the sensitivity of the metric, we recommend smoothing data whenever noise may be a problem. We pre-fer cubic spline interpolation and Butterworth filtering, which are commonly used in analysis of motion data [20]. In our experience, this solution avoids rough smoothing that would decrease TPs.
Effects of Components in Dimension Reduction The efficacy of dimension reduction is dependent on the number of components. Again, in studies of aimed move-ments, dimension reduction has not been an issue. In our case, an ideal metric decorrelates mutual information among movement features and achieves a tolerable level of error in modeling of the data with minimum components.
To chart the effect of component number, we manipulated the number of components in a GP-LVM model. As data we chose a segment from the dance Adagio (temps lié) in Study I. We charted RSME as an indicator of reprojection error and used .05 as our criterion for an acceptable level. Reprojected residuals differ from original data on average
less than .05 units. Figure 6 (right) shows the result: com-ponent counts 6–9 are the first to reach the acceptable level. For component count 9, TP is around 160. Because the ide-al number of latent dimensions in Step III varies from one dataset to another [18], we recommend choosing a model that reaches a tolerable level of reprojection error with the lowest number of components.
Effects of Temporal Alignment An undesirable consequence of temporal alignment in Step IV is that we lose information about the temporal accuracy of the repetition. This is a drawback for activities wherein synchrony and timing are essential. To assess the impact of CTW, we compared TPs with and without it. In the Ballet data (Study I), we observed some increases in GP when CTW was performed. In the case of overly fast rapid caging of the hand (see below), however, CTW brought a seven-fold increase. We recommend analyzing TPs both with and without CTW when synchrony and timing are critical.
Static and Repetitive Movement For a feasibility test, we checked whether very simple movements produce low TPs as they should. The following data (with repetitions) were collected via a PhaseSpace sys-tem with 12 Impulse cameras at 120 fps:
• Standing still (6001 frames) • Balancing on one foot (1280 frames) • Rapid caging of the palm (1698 frames)
In addition to optical markers for the full body, markers were placed on all fingers and both sides of the wrists. One of the co-authors served as the participant. We used CTW and GP-LVM with six latent dimensions.
As expected, balancing and standing produced virtually ze-ro TPs, both TPs < 0.25 bps. As the person is standing still, residuals in complexity estimation are negligible. In balanc-ing on one foot, swaying produces more complex move-ments in Step II, but because swaying is poorly matched from one sequence to another, even with CTW, TPs are negligible. This is not to say that balancing would not be motorically difficult, for it is [5]. Fitness games such as Nintendo Wii Fit Balance Board measure variation during balancing for score calculation. However, for an external observer such as an interface, it carries no information after observation of the initial pose.
However, rapid, repeating caging of the palm—a motorically trivial movement for an adult—yielded a very high TP = 287.7 bps with GP. One drawback of the se-cond-order autoregressive model is its short “memory”: a human observ-er can easily detect repeats in a movement, but the model considers each repetition as sur-prising as the first instance. However, when CTW was re-moved, TP fell by a factor of 6.7, to 43 bps. The actor’s high TP was achieved at the expense of accuracy in timing.
●
●
●
●
●
●●
●● ● ● ● ● ● ● ●
0 0.0005 0.0015 0.0025
020
040
060
080
012
00
Noise Factor
Thro
ughp
ut (b
ps)
●
TP(1|2)TP(2|1)
0.00
0.05
0.10
0.15
0.20
Aver
age
RM
SE
●
●
●
●●
●
●
●●
●
●
●
●
●
●
●
●
●●
0
50
100
150
200
250
Aver
age
Thro
ughp
ut (b
ps)
2 4 6 8 12 16 20
Latent Dimensions
●
RMSEThroughput

Figure 7. Top: Image from the recording of the Ballet dataset.
Bottom: Snapshots of a sequence and its repetition.
STUDY I: BALLET Computer vision and other sensors have enabled the map-ping of almost any movement feature of a user’s body to virtual movement; but how can we measure such perfor-mance and learn about it for design? In principle, a re-searcher could set up movement targets in a laboratory and chart the capacity of a user’s limbs in aimed movements, one at a time and in combinations. This would be time-consuming, however, and would not capture information in trajectories or of the individual limbs.
Study I is a proof of concept demonstrating the suitability of our metric for analyzing very complex full-body perfor-mance. We study a skilled and highly overlearned multi-limb performance, ballet, as an analogue of the “highly overlearned” tapping movements in Fitts' studies [6]. We calculate throughput in a ballerina’s movement to under-stand the metric in a situation wherein all movement fea-tures of the body are skillfully controlled for longer periods of time. We disregard the question of how actually to map physical movement to virtual movement in a real applica-tion and focus on how much information there is in theory.
Method and Analysis We recorded the performance of a teacher of classic and romantic ballet with several years of experience (Figure 7). Out of her vast repertoire, she was asked to select dances that would be fast, be complex and engage as many limbs as possible. The repetitions were to be as precise as possi-ble, both temporally and spatially. These movements could be repeated as many times as desired until she was satisfied with the quality of the repetition. To assist her in quality-control, she was given the opportunity to see her perfor-mance from the recording device. Six sequences were even-tually chosen (see Table 1).
The recordings were performed in a motion capture lab us-ing Vicon with 12 F40 cameras at 120 fps. For each frame, the data contain p = 111 features, corresponding to the 3D-coordinates of 37 markers. Butterworth smoothing was ap-plied. For calculation of TP, we used PCA for all sequences with 90% of variance explained. PCA was carried out for
the full sequence. We also calculated TP from the averages of GP-LVM performed on three segments of 500 frames. This analysis was carried out with and without CTW.
Findings TPs for the dances are listed in Table 1. The table shows a range of 208 to 584 bps with GP-LVM. The worst-performing dance involved slow movement and stopping movement in static postures. The best-performing dance, by contrast, featured fast movements, circlings, and jumps.
Obviously, estimating TP from a single sequence yields a gross overestimation and the raw number per se is not in-formative. For instance, if the ballerina were to achieve 100 bps, she would move the 37 markers such that she sends one message out of 2100 alternative (distinguishable) mes-sages per second! Achieving such rates in HCI would be impossible since the other implied dances would be re-quired of the dancer. The metric can, however, be used for closer analysis of factors contributing to performance.
To understand the accuracy of timing and synchrony, we compared TPs with and without CTW (Table 1). Without CTW, the TPs are considerably reduced for some dances, but not for all. In contrast, the dance with the highest TP had almost no reduction when CTW was skipped. Figure 7 shows a matched sampling (from frames 0–3,960) of the dance and its repetition.
Furthermore, to understand which limbs are the best candidates for con-trolling an interface, we estimated limbs’ contribution to the capacity. We averaged raw TPs per movement feature across the dances. As the adja-cent figure shows, the two hands and the right foot had the largest through-puts, all above 12 bps. Markers for the torso, head, and dis-tal parts of the feet had far lower values. This analysis re-veals a laterality effect (left vs. right hand) and that torso and leg movements may be less well-rehearsed and im-portant aspects of the teacher’s dancing. An interface de-signer could use such information when mapping human movements to virtual controls.
Sequence TP TP TP (GP) (raw) (PCA) CTW No CTW
Tombé pas de bourrée, Italian fouetté, piqué turn, jeté en tournant
4092 1307 584 510
Adagio (passé devant développé, ara-besque, écarté devant pas de bourré)
198 107 393 323
Petit jeté (glissade jeté, ballotté, ballon, entrechat, assemblé)
3335 755 308 283
Petit jeté (temps de cuisse, sissonne devant fermée, derrière fermée, sis-sonne ouvért pas de bourrée)
3013 764 238 191
Adagio (temps lié, arabesque, pas de bourrée, balancé)
1153 577 208 161
Grand jeté (battement développé, chassé, grande jeté développé, ara-besque, fouetté sauté, jeté en tournant)
2654 698 267 141
Table 1. Throughputs in six sequences in the Ballet data
21-33
12-15
17-18

Figure 8. The setup of a cyclical tapping task done in two con-
ditions: with and without an additional weight.
STUDY II: CYCLICAL TAPPING WITH MOUSE Study II examines capacity in aimed movements in a cycli-cal selection task carried out with a mouse on a desktop PC (Figure 8, top). We chose to replicate a well-studied variant of the Fitts paradigm in order to compare our metric to the Fittsian metric. Although here not intending to “express in-formation” when moving towards a target, the user spends most of the total time on the way. Our metric complements the Fittsian metric by showing that variability in trajectories is not always reducible to the Fittsian TP.
We predicted that our metric would show higher TPs in conditions wherein the approach trajectories can be kept close to each other. So with all else equal, decreasing W should increase TP. The shape of the curvature upon turn-ing toward the next target should affect TP as well. A “spiky” turn would be surprising for the autoregressive model. To hamper such behaviors selectively, we added a condition with 4 kg wrist weight (see Figure 8).
Method One of the authors carried out the experiment by using cus-tom-made software that presented nine target circles on the monitor and recorded mouse clicks and movements at 96 Hz. Each trial consisted of clicking through the circle three times. After removal of the first tap of each trial, this yield-ed 26 clicks per trial. The D and W values were randomized from a range of 2.6 ≤ ID ≤ 6.1, but the encumbrance condi-tion (4 kg) was administered in only two ID conditions: ID = 2.6 and ID = 6.1, both with three repeats.
The subject was instructed to complete the task as quickly and accurately as possible. Plenty of practice was provided, both with and without the weight. The experiment was started when performance with the weight had stabilized.
Findings When effective width We is used as W in Eq. (2b) is used, Fitts-TPs for the 0 kg and 4 kg conditions were 3.8 and 2.45 bps, respectively. This is in line with the range of Fitts-TPs in previous studies [17]. As expected, the added weight had
a decreasing effect (see [6]). The fits of our Fitts’ law mod-els were R2 = 0.90 and R2 = 0.93 for the two conditions, re-spectively (note, however, that using stimuli from only two ID conditions within the 4 kg condition improves the fit).
Our analysis reveals an interesting crossover when the nov-el metric is used. We compared trajectories from the condi-tions ID = 2.6 and ID = 6.1 between the 0 kg and 4 kg con-ditions and considered the complete movement trajectories from the each trial. We averaged the TPs obtained from pairwise comparisons. Dimension reduction and smoothing were unnecessary in this case.
The trajectories and TPs in each condition are presented in Figure 9. We made three observations: 1) In the unencum-bered condition (0 kg), TPs are around 37 bps for both low and high IDs. Although MTs are higher in the high-ID con-dition, the trajectories are more closely “packed,” which in-creases TP. 2) When the 4 kg wrist weight is added, TP in the low-ID condition falls to 24 bps. 3) Surprisingly, how-ever, when ID = 6.1, TP with the 4 kg wrist weight is again 37 bps.
We observed that, with the added weight, the subject rotat-ed his hand carefully in the high-ID condition before start-ing to move it toward the target. This is manifested in the closely aligned trajectories in Figure 9. Thereby the user compensated for the slower average movement velocity. In contrast, accurate premovement aiming was not necessary in the low-ID condition, since the targets were larger, and we saw more scattered trajectories and a reduction in TP.
We conclude that the two TP metrics can be used technical-ly in the same experiment. We also conclude that a higher Fitts-TP in aimed movements does not imply a higher TP obtained from our metric.
Figure 9. Movement trajectories (size normalized) and TPs in
a cyclical tapping task with mouse.
Unencumbered 4 kg additional weight
0 kg
4 kg
38 bps
24 bps 37 bps
37 bps
Low ID High ID

Figure 10. Movement trajectories and throughputs when a
constant inter-click interval of 1000 ms was enforced (ID 4.1).
A Follow-up with Constant Time We hypothesized that the surprising benefit of the wrist weight in the high-ID condition should disappear if the user is forced to make quicker movements. Rushing in the rota-tion-plus-aiming stage would result in less well-aligned tra-jectories. To test this hypothesis, the same subject carried out the task in a condition wherein MT was kept at a con-stant 1,000 ms with a metronome. The subject practiced performance before the experiment proper. Only one ID condition (4.1) was necessary for testing this hypothesis. After extensive practice, three trials were carried out per weight condition. The data were analyzed as previously.
As Figure 10 shows, the trajectories in the 0 kg condition (mean of MT 999.1 ms, SD 0.0793, target hitrate 95.0%) are much more closely aligned in space. In the 4 kg condition (mean of MT 1,005 ms, SD 0.0777, 89.6%), TP is markedly lower than in the 0 kg condition, as expected. With the in-creased tempo, it was indeed harder to perform accurate aiming in the premovement phase, which manifested itself in increased variability in trajectories.
STUDY III: BIMANUAL IN-AIR GESTURING The problem of designing interfaces with full-body control is that the number of possible movements is too enormous to study empirically. One alternative would be to sample the space of possible movements aggressively [19] and av-erage TPs. Another is to impose constraints in order to ex-pose human factors relevant to interface design.
Our solution is to divide the interaction space into move-ment conditions and ask a user to produce an overlearned motor act, such as signing one’s name, in each condition. The overlearned motor act is a surrogate for any complex movement that a user could produce with practice. The idea in such manipulations is that learned motor programs retain some invariance when transferred from a familiar context to another [15]. For example, one can sign one’s name with the teeth or behind one’s back. The effects of constraints such as position, rotation, or scale on TP show how robust the user’s movements are to the conditions imposed by the interface. A usable interface sees uniformly high TPs across all commonly occurring conditions.
As a feasibility study we investigate the now-famous in-air gesturing scene in the movie Minority Report (Figure 11). The case is relevant to HCI, because such interfaces are touted without regard for the fact that bimanual continuous control suffers from interference effects [14]. As the critical condition we study the hand position’s effect. Inspired by the movie, we assume a user gesturing with both hands raised to a space of 120° of the field of view. With this ma-nipulation, we study whether user performance significantly changes if the hands are switched or operate at different dis-tances from each other.
Method In the experiment, the subject signs his name in the air with one hand and simultaneously makes another continuous movement, of the same duration, with the other hand (a G clef). The hands are interchangable. In our attempt to emu-late the determination and skill of Captain John Anderton (played by Tom Cruise in the movie), our subject practiced the two movements, both in isolation and together, for three days before the experiment began. In the study, we divided the space in front of the standing subject into four seg-ments, and asked him to perform the two movements in all combinations of segments such that the left hand is on the left side of the right hand. The dominant and the nondomi-nant hand both performed the signature and the clef. In all, 12 trials were recorded, each with enough repetitions that the subject was satisfied with the precision of the repetition we included in our data. In a surprise test afterward, we asked the subject to change the clef to another gesture of similar complexity (the letter “g”).
One author, a healthy male in his twenties, volunteered for the task. We used the PhaseSpace system with 12 Impulse cameras at 120 fps and a full-body tracking suit with addi-tional markers on the fingers and wrists. For simplicity, we restrict the analysis to the two index fingers. Since we were interested in a comparison within the study, PCA was used for dimension reduction. Capacity is calculated as the aver-age of the three best TPs achieved within a condition.
Figure 11.The Minority Report scenario is here studied in a task wherein a user produces bimanual gestures with two
hands simultaneously. The segments of the movement space emulate those of an in-air UI.
0 kg 4 kg
42 bps 36 bps

Findings The adjacent fig-ure shows as ex-amples the best and the worst performances (repetitions su-perimposed on top of each oth-er). Four observa-tions were made. First, not surpris-ingly, through-puts (PCA) were higher for the dominant hand, with 217.8 bps vs. 199.7 bps for the dominant and the non-dominant hand, respectively. Second, the user could express genuine information with two-hand interaction: Throughput was 182.7 bps with dom-inant hand removed, 217.8 bps with non-dominant hand removed, and 322.1 bps with both hands. Thus, bimanual gesturing genuinely increased TP from that of single-handed gesturing. Third, changing the G-clef gesture to the previously unpracticed movement hampered bimanual ca-pacity: the average throughput decreased by about 100 bps, from 322.1 to 220.5 bps. This TP is not far from the sub-ject’s singlehand performance. Fourth, the most surprising observation was that making the movements such that the hands are close to each other lowered TP. As shown by av-erage TPs (PCA) in the three best repetitions per condition, the actor’s performance was at its best with one segment (_) between the left and right hands:
L R 313.3 bps L _ R 353.0 bps
L _ _ R 286.5 bps
A theory of bimanual distraction suggests that the distrac-tion in the condition with the hands close to each other (here 61 cm apart) is due to perceptual distraction: seeing both hands moving distracts from their control [14]. When the hands are further apart (94 cm), there is less distraction. When the hands are very far apart (125 cm), control is again more difficult, perhaps for biomechanical reasons.
DISCUSSION We have presented a novel metric for the information ca-pacity of full-body movements. The new metric extends Fitts-TP metric by considering
• the shape of continous trajectory as the source of in-formation instead of target width and distance and
• the accuracy of the reproduced movement as the source of noise instead of end-point variation.
Moreover, the speed of performance affects the rate of in-formation, as in Fitts-TP.
The metric allows researchers to examine any scenario wherein users’ motion can be represented as a sequence of vectors of movement features, from mouse movements to
full-body motion. Naturally occurring movement can be an-alyzed, with the precondition that the data include matcha-ble repetitions. The known extensions of Fitts’ law from discrete to continuous movements are predictive models of MT (e.g., [1,11]) and do not carry an interpretation in in-formation theory. Moreover, they are incapable of dealing with multi-feature arbitrary trajectories in 3D space.
The metric is based on estimation of mutual information in repeated motor sequences. It should not be confused with the intrinsic difficulty of performing the movement nor with the motor system’s capacity. In fact, neuromechanically simple mechanisms can produce high TPs, and some com-plex feats, such as balancing, have zero TP. Rather, the metric is best understood as an index of the information available to an external observer, as defined by the com-plexity and reproducibility of observed movements.
The new metric however, lacks one important feature of Fitts-TP: interpolation. Fitts-TP is relatively robust to changes in the target’s W or D. This is a known conse-quence of the agonist–antagonist neuromechanical pattern that produces the aimed response [5]. With more complex motor control, interpolation cannot be expected. Even slight changes in movement direction may invoke different con-trol patterns.
The metric makes almost no assumption about the data, which makes it suitable for a wide range of uses. On the other hand, because of its generality, the absolute TP values are high when compared to the familiar range seen in aimed movements. This high range is expected, because the metric is based on high-frequency multivariate sampling of con-tinuous movement but also because the model has no model of the performer, or the environment, as a prior. Even if the absolute values are high, however, we have shown that the metric responds as expected to conditions such as noise.
To address the issue of high absolute values and improve the model, the most important goal for future work is to combine the now-separate steps of complexity estimation, temporal alignment, and dimension reduction in a single GP model. Further improvement can be achieved if complexity estimation is informed with a skeletal model of dimensions and movement ranges of bones and joints.
Applications The metric can inform efforts in HCI where the expressive-ness of continuous movement is important. We foresee three use cases for the metric:
1. Evaluation and comparison: The metric can be used to study the motor capacity allowed by novel interface designs and to compare alternative solutions. These tasks involve collecting movement data that span the space of possible movements. Because most movement spaces are too large to be exhausted empirically, com-plex overlearned patterns such as signatures (Study III) can be used to represent performance that users could attain with practice. Comparative studies should target
489 bps
1 bps
obtaining a large number of comparable complex movements produced with each user interface.
2. Analysis: We showed that the metric is sensitive to some well-known effects in motor control, such as that of laterality (Study III), encumbered movement (Study II), change in performance objective such as speed (Study II), and perceptual distraction of bimanual con-trol (Study III). The metric can also be used to analyze the contributions of different limbs in users’ continuous full-body movements (Study I) and to expose perfor-mance-affecting factors (Study III). Temporal align-ment (CTW) can be dropped for estimation of the accu-racy of timing and synchrony. The metric can also ex-pose patterns in trajectories of aimed movements in-volving only single end-effector (Study II).
3. Exploration: Because the metric allows studying throughput independent of a intermediary device or target conditions, it could be used to explore potentials for user interfaces. For example, if there are multiple ideas on how a game could be controlled, they can be compared through asking users to produce the same movement sequence within each condition.
Unlike with Fitts-TP, calculation of the novel metric is computationally intensive, particularly if GP-LVM is used. Intensity is unavoidable, because the metric must account for multiple movement features moving over time. Moreo-ver, it must addess three issues inherent to throughput cal-culation in multi-feature data: estimating the complexity of a trajectory, decorrelating interrelated features, and aligning sequences in time. Future work can explore efficient simpli-fications to this pipeline.
To help practitioners apply the metric, we provide a Web service. After sending movement data, the user chooses pa-rameters for the five steps in the computation. The output contains an overall TP, a breakdown by movement feature, and the optio of analyzing different time segments. We pro-vide a converter from angular representation (angles of joints) to the coordinate system (x, y, z position).
ACKNOWLEDGEMENTS This work has been funded by the Academy of Finland (Starting Grant Booster, the Finnish Centre of Excellence in Computational Inference Research COIN 251170, MODEST), the Max Planck Center for Visual Computing and Communication (MPC-VCC), EIT ICT Labs, and the Emil Aaltonen Foundation. We thank Rod Murray-Smith, Heiko Drewes, John Williamson, Antonio Krüger, Per Ola Kristensson, Antti Honkela, Miikka Miettinen, David MacKay, and Scott Klemmer for helpful comments. Also, we are indebted to Frank E. Pollick, Walter Boot, Christian Theobalt, and Carsten Stoll for sharing equipment and data, and to Naree Vachananda for the beautiful ballet. Code, da-ta, and the service are available through our project page.
REFERENCES 1. Accot, J., and Zhai, S. Performance evaluation of input devices
in trajectory-based tasks: an application of the steering law. Proc. CHI’99, ACM Press (1999), pp. 466-472.
2. Berndt, D., and Clifford, J. Using dynamic time warping to find patterns in time series. In AAAI-94 workshop on knowledge discovery in databases, vol. 2 (1994).
3. Brillinger, D.R. Some data analyses using mutual information. Brazilian J. Probability and Statistics 18, (2004), 163-183.
4. Cover, T., Thomas, J., and Wiley, J. Elements of Information Theory. Wiley Online Library, 1991.
5. Enoka, R. Neuromechanics of human movement. Human Ki-netics Publishers, 2008.
6. Fitts, P. The information capacity of the human motor system in controlling the amplitude of movement. Journal of Experi-mental Psychology 47, 6 (1954), 381.
7. Fitts, P., and Posner, M. Human Performance. Brooks/Cole, Belmont, CA, 1967.
8. Kendall, M.G., and Stuart, A. The Advanced Theory of Statis-tics, Hafner, New York, 1968.
9. Lashley, K. An examination of the continuity theory as applied to discriminative learning. Journal of General Psychology (1942).
10. Lawrence, N. Probabilistic non-linear principal component analysis with gaussian process latent variable models. The Journal of Machine Learning Research 6 (2005), 1783–1816.
11. Liu, L., and van Liere, R. The effect of varying path properties in path steering. Proc. EGVE/EuroVR/VEC, Eurographics As-soc. (2010), pp. 9-16
12. MacKenzie, I. A note on the information-theoretic basis for Fitts’ law. Journal of Motor Behavior 21, 3 (1989), 323–330.
13. MacKenzie, I. Fitts’ law as a research and design tool in hu-man-computer interaction. Human-computer interaction 7, 1 (1992), 91–139.
14. Mechsner, F., Kerzel, D., Knoblich, G., and Prinz, W. Percep-tual basis of bimanual coordination. Nature 414, 6859 (2001), 69–72.
15. Pew, R. Performance of human operators in a three-state relay control system with velocity-augmented displays. IEEE Transactions on Human Factors in Electronics, 2 (1966).
16. Rasmussen, C., and Williams, C. Gaussian Processes for Ma-chine Learning. MIT Press, Cambridge, 2006.
17. Soukoreff, R., and MacKenzie, I. Towards a standard for pointing device evaluation: Perspectives on 27 years of Fitts’ law research in HCI. International Journal of Human-Computer Studies 61, 6 (2004), 751–789.
18. Wang, J., Fleet, D., and Hertzmann, A. Gaussian process dy-namical models for human motion. IEEE TPAMI 30, 2 (2008), 283–298.
19. Williamson, J., and Murray-Smith, R. Rewarding the original: explorations in joint user-sensor motion spaces. Proc. CHI’12, ACM Press (2012), pp. 1717-1726.
20. Winter, D., Sidwall, H., and Hobson, D. Measurement and re-duction of noise in kinematics of locomotion. Journal of bio-mechanics 7, 2 (1974), 157–159.
21. Zhai, S. Characterizing computer input with Fitts’ law parame-ters: The information and non-information aspects of pointing. IJHCS 61, 6 (2004), 791–809.
22. Zhou, F., and De la Torre, F. Canonical time warping for alignment of human behavior. Proc. NIPS, (2009), 1–9.