information appliances and tools: simplicity and power
TRANSCRIPT

IEEE Computer Graphics and Applications, Volume 17, Number 4, July/August 1997, 32-41.
Information Appliances and Tools: Simplicity andPower Tradeoffs in the
Visage Exploration EnvironmentJohn Kolojejchick, Steven F. Roth
Carnegie Mellon UniversityRobotics Institute, School of Computer Science
5000 Forbes AvenuePittsburgh, PA 15213, USA
Tel: 1-412-268-8812E-mail: {jake+, roth+}@cs.cmu.edu
Peter LucasMAYA Design Group, Inc.
2100 Wharton StreetPittsburgh, PA 15203
http://www.maya.com/
INTRODUCTION
Most people who work with large amounts of information use special-purpose applications,
each with its own customized visualizations, operations, and interfaces. In domains like
transportation scheduling and tracking (which we have been using as a test case), analysts
use one system to generate and display shipping schedules, another for tracking the location
of cargo in transit, and a third for managing warehouse inventory and requisition handling.
Each application provides operations and visualizations appropriate to the specific data
analysis tasks it supports. There is rarely any general mechanism for exploring relationships
among the data used among a suite of applications. Users of such “stove-pipe” systems are
often unable to explore important relationships in their data. For example, it is very difficult
for transportation planners to use existing systems to explore the relationship between the
locations where supplies are stored, the people who order them, and when they are scheduled
to be shipped.

Information Appliances and Tools: Simplicity and Power Tradeoffs in the Visage Exploration Environment • 2
This lack of a common set of operations and ways to integrate information across multiple
applications continues to be a problem in current research on general purpose tools and
techniques for exploring and manipulating information. This research has focused on new
ways to visualize information, new techniques for interacting with visualizations to
manipulate information, and new tools to support the creation of visualizations. Some of this
research has led to the development of general purpose analysis tools, each with its own
strengths. For example, the Table Lens [1] is a dynamic spreadsheet environment for
exploring large, multidimensional data sets with techniques for focusing attention on subsets
while viewing the rest as context. Its strengths include techniques for rapidly creating and
viewing the relations among data attributes. Another evolving analysis package is IVEE [2],
which provides the ability to rapidly create multiple dynamic query sliders to filter data. A
third example is the SAGE system [3], whose central feature is rapid design of visualizations
that integrate multiple attributes.
Taken together, these systems lead to a number of fundamental design questions: how can we
use the complementary features of different visualization and analysis tools in a coordinated
way? What user interface approach would enable people to easily move and combine
interesting subsets of information across the isolating boundaries imposed by different
applications? These questions suggest the need for a user interface environment for people
who work in information-intensive domains—an electronic workspace for people who
explore and analyze large amounts of data daily. Ideally, such a workspace would provide
several key capabilities that enable users to:
• select and combine information from multiple application interfaces, visualizations, and
analysis tools,
• rapidly generate visualizations that integrate information from these diverse sources, and
• manipulate information: i.e. filter information, control its level of detail, navigate through
it, and create new information wherever it is displayed.
A workspace for supporting these information analysis tasks must also support a continuum
of levels of user expertise and user tasks. At one extreme, it must support specific analysis
and reporting tasks that are performed frequently for the same data and purpose (e.g.
checking weather conditions or inventory levels of a part). These are tasks that might be
Information Appliances and Tools: Simplicity and Power Tradeoffs in the Visage Exploration Environment • 3
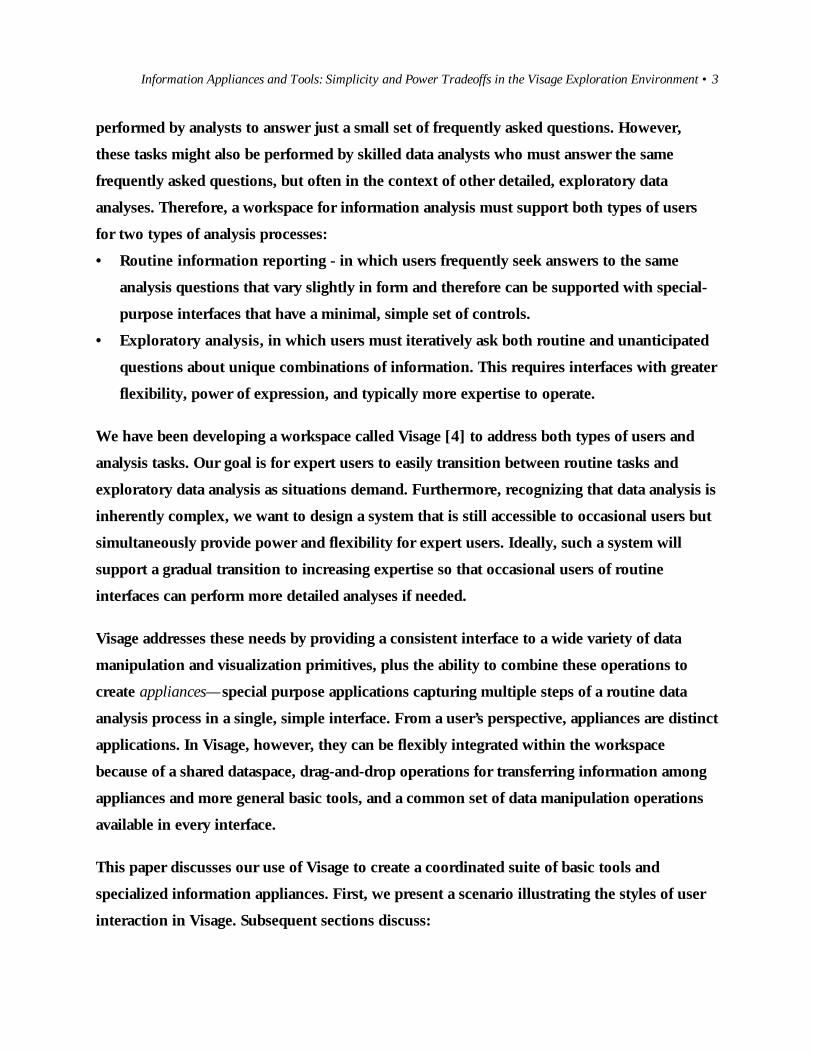
performed by analysts to answer just a small set of frequently asked questions. However,
these tasks might also be performed by skilled data analysts who must answer the same
frequently asked questions, but often in the context of other detailed, exploratory data
analyses. Therefore, a workspace for information analysis must support both types of users
for two types of analysis processes:
• Routine information reporting - in which users frequently seek answers to the same
analysis questions that vary slightly in form and therefore can be supported with special-
purpose interfaces that have a minimal, simple set of controls.
• Exploratory analysis, in which users must iteratively ask both routine and unanticipated
questions about unique combinations of information. This requires interfaces with greater
flexibility, power of expression, and typically more expertise to operate.
We have been developing a workspace called Visage [4] to address both types of users and
analysis tasks. Our goal is for expert users to easily transition between routine tasks and
exploratory data analysis as situations demand. Furthermore, recognizing that data analysis is
inherently complex, we want to design a system that is still accessible to occasional users but
simultaneously provide power and flexibility for expert users. Ideally, such a system will
support a gradual transition to increasing expertise so that occasional users of routine
interfaces can perform more detailed analyses if needed.
Visage addresses these needs by providing a consistent interface to a wide variety of data
manipulation and visualization primitives, plus the ability to combine these operations to
create appliances—special purpose applications capturing multiple steps of a routine data
analysis process in a single, simple interface. From a user’s perspective, appliances are distinct
applications. In Visage, however, they can be flexibly integrated within the workspace
because of a shared dataspace, drag-and-drop operations for transferring information among
appliances and more general basic tools, and a common set of data manipulation operations
available in every interface.
This paper discusses our use of Visage to create a coordinated suite of basic tools and
specialized information appliances. First, we present a scenario illustrating the styles of user
interaction in Visage. Subsequent sections discuss:

Information Appliances and Tools: Simplicity and Power Tradeoffs in the Visage Exploration Environment • 4
• an overview of the information-centric approach underlying the design of the Visage
environment,
• the basic components of Visage, and
• the rationale for providing primitive operations, power tools, and appliance-like interfaces
within the same environment and some examples of these in Visage.
AN EXAMPLE: TRANSITIONING AMONG APPLIANCES & TOOLS IN VISAGE
The variety of styles of interaction encountered in Visage applications are best illustrated in
an example. The following example is based on an application we are developing for the U.S.
Army for analyzing a shipment tracking system database. The Army fills orders for supplies
requested by its units throughout the world. Supplies for each order are grouped in
shipments.
The database contains information about each shipment’s contents, priority, origin, and
destination. Attached to each shipment is a transmitter, called an tag, whose purpose is to
report the location of the shipment. As each tagged shipment arrives at a staging area, an
entry is automatically entered into the database.
Sometimes, a user is interested in locating an individual shipment. More often, though,
analysts are interested in monitoring the performance of the whole transportation and
distribution system. Users want to find problem areas and either route shipments around
them or assign additional resources (e.g. trucks and personnel). Analyses often consider both
current and historical information about the location, movement, quantities, status, priority,
and related information about shipments and the units that requested them. Analysts often
need to check the status of an intermediate staging area in a distribution network, asking
questions like: “How long have shipments been waiting at a particular staging area”?, “How
much cargo is heading from this area to other areas”? “What’s the rate at which a staging area
has been handling cargo (receiving and moving it out)”?
Figure 1 shows two Visage frames. The top frame contains a map showing a portion of a
shipping network; the bottom frame is an aligned chart currently showing no data. Frames
are displays of information that provides different views and arrangements of data. All of the

Information Appliances and Tools: Simplicity and Power Tradeoffs in the Visage Exploration Environment • 5
interfaces and visualizations in this example are contained in Visage frames. Frames provide
operations that are universal to the Visage environment as well as specialized to the unique
task that the frame was designed to support. We discuss frames in detail in later sections.
Figure 1: Elements representing collections of shipments passing through various staging areas in a
transportation network are shown on a map for a selected region. Air and ground routes connecting
staging areas are indicated with thick black lines. A collection of shipments from one staging area is
being dragged to another frame below it for more detailed analysis.

Information Appliances and Tools: Simplicity and Power Tradeoffs in the Visage Exploration Environment • 6
The user creates the “Routes” frame at the top of Figure 1 by dragging an empty instance
from a palette of commonly used frames, then selecting a region of the shipping network and
a time interval from a menu within a caption interface attached to the bottom of the frame. In
this case, the user selects the region “Bosnia” and the time interval “last 3 weeks”. The
caption interface responds to the user’s selections by extracting the relevant data from the
database and forming collections of shipments passing through each staging area in the
specified time interval. The resulting collections are visualized as circles on the map. The area
shows the total number of tagged shipments that have moved through a staging area in the
specified time interval. The color shows the average age of tags, defined as the number of
days that a tagged shipment remained at a staging area before it was moved elsewhere. The
links show the shipment routes between staging areas (straight lines indicating air
movements and irregular lines indicating truck routes).
Used in this way, the routes frame is an appliance with two simple controls (date and location
menus). It gives users an overview of the state of a portion of the shipping network during a
particular time period. The caption at the bottom of the display serves two purposes. It
reminds the user what data is shown in the frame but it also represents an interface for
specifying inputs for populating the frame with data.
An important operation in Visage is the ability to drag graphical objects representing
information among visualizations and other application interfaces in the workspace. For
example, noting the large number of aging shipments indicated by the large yellow circle
(which represents a supply handling area called the “123rd-MSB”), the user can see more
detailed data by dragging a copy of the circle to an empty "Daily Tag Summary" frame. This
operation is suggested by the blue arrow in Figure 1.
As with the initial display, the "Daily Tag Summary" frame is a specialized appliance that
extracts data from a database, aggregates it in a prescribed way and creates a set of aligned
charts showing a particular view of the data.
This appliance takes as input a staging area and a range of dates for which information should
be shown. The frame shows several attributes for the specified area for each day (see Figure
2). The horizontal axis indicates date. The bottom chart shows the number of shipments

Information Appliances and Tools: Simplicity and Power Tradeoffs in the Visage Exploration Environment • 7
remaining at the staging area at the end of each day. The middle double bar chart shows the
number of new tagged shipments arriving and leaving the staging area each day (green
signifies arriving and blue departing shipments for that day). In the top chart, the points
show the mean age of shipments at the specified staging area at the end of each day (i.e.
where age equals the number of days that a shipment has been at the staging area).
This example illustrates a convenient operation for populating frames with data. A subset of
data represented by a graphical element is copied and dragged from the Routes frame into the
Daily Tag Summary Frame. The caption interface uses the underlying data to compute a date
range and identify a staging area of interest for input to its data reorganization script. In this
case, performing the drag and drop operation is much easier than selecting the corresponding
staging area and time interval from the menus in the caption interface. Hence, the user can
remain focused on the analysis task at hand.

Information Appliances and Tools: Simplicity and Power Tradeoffs in the Visage Exploration Environment • 8
Figure 2: The populated Daily Tag Summary frame shows historical information
for the tags arriving, leaving and remaining daily at a specified staging area. The
data within the frame can be specified using the caption interface or by dropping
data on it from other frames. A collection of tags remaining at the staging area on
October 7th are dragged to an Outliner frame for further analysis.
Examining the Daily Tag Summary frame, the analyst first notices a strong periodicity in the
data. Each week, a large number of shipments arrive on two consecutive days (indicated by
the 3 pairs of green bars in the middle bar chart) which are delivered to their subsequent

Information Appliances and Tools: Simplicity and Power Tradeoffs in the Visage Exploration Environment • 9
destinations during the remainder of the week (indicated by the blue bars in the middle bar
chart). It appears to the analyst that this staging area (the 123rd-MSB) is operating near its
capacity because each week’s incoming shipments are barely moved out before the next
week’s shipments arrive. The analyst also notes that the number of shipments processed early
each week seems to be higher than those processed on later days.
To gain more visibility into the apparent periodic decrease in throughput, the user decides to
perform an analysis on the most recent week’s shipments. This is accomplished by dragging a
bar from the bottom-most chart to the outliner frame, also shown in Figure 2. This bar
represents all tagged shipments that remain in the 123rd-MSB on October 7th.
The outliner provides a hierarchical, spreadsheet-like interface, that enables the user to view
multiple attributes of the data textually while performing drill-down and roll-up operations.
These operations are discussed in greater detail in [5]. On the right side of the outliner in
Figure 2, the user selects the attributes of the objects in the first column that they want to
have displayed, such as the total cargo weight, number of tags, and mean age of the
shipments contained in each collection. These attributes can be taken from the database or
created dynamically as derived attributes using a scripting language.
Figure 3: In the Outliner, the user performs a recomposition operation on the
members of the collection representing tagged shipments located at the 123rd-MSB
on 7-Oct-1996. In one step, these tagged shipments are reorganized into new
collections based on their destination.

Information Appliances and Tools: Simplicity and Power Tradeoffs in the Visage Exploration Environment • 10
Starting from the aggregate containing all the tagged shipments located at the 123rd-MSB on
October 7th, the analyst is offered a menu of alternative dimensions along which they may
drill down (illustrated in Figure 3). Choosing the attribute called members would drill down
to all the shipments represented by the aggregate (i.e. the shipments in this set). There are
too many to view individually, so the user chooses to recompose or reorganize this set of
shipments into new collections, grouped by the shipment’s “destination” attribute. The result
is a set of collections, each containing all tagged shipments going to a particular destination.
These are highlighted and indented in the Outliner frame shown in Figure 4. Such dynamic
drill-down and roll-up capabilities are a fundamental operation in the Visage environment
and can occur in every display.
The outliner is a flexible tool that requires awareness of these basic operations and some of
the structure of the underlying object representation. Therefore, it requires more experience
to use than the two previous frames, though the latter also provide the same drill-down
operations on its elements in addition to their simpler caption-like appliance controls.

Information Appliances and Tools: Simplicity and Power Tradeoffs in the Visage Exploration Environment • 11
Figure 4: Newly recomposed collections of shipments are dragged to the original
Routes frame where they are shown at their destination.
In Figure 4, the analyst drags these seven newly created collections of shipments to the
original map frame (shown in Figure 1) to view them at their subsequent destinations.
Recall that the resulting seven points are a reorganization of a portion of the shipments
represented by the yellow circle that were categorized by their destination. In other words,
the seven circles represent the destinations of shipments originating at the yellow circle. The
circles form two clusters south of that location. The analyst selects an orange painting color
and paints one cluster of shipment destinations on the map by dragging a bounding box
around them. Note that the corresponding items in the Outliner display are also painted
orange. Painting is another fundamental operation in the Visage environment and is
coordinated across all frames.

Information Appliances and Tools: Simplicity and Power Tradeoffs in the Visage Exploration Environment • 12
Figure 5: A cluster of elements is painted orange in the Routes frame, causing
elements representing the same concepts to be painted in the Outliner.
From these two coordinated views of the data, the analyst gets a clearer picture of the
problem. The 123rd-MSB is supplying several destination units that are quite far away and
which represent the majority of actual cargo weight shipped. This explains the drop in the
throughput after the first day: trucks take a long time to deliver these shipments and return
for more cargo. A possible solution is to reroute some shipments to these destinations
through another staging area (i.e. the smaller green circle) or to assign the 123rd-MSB
additional truck crews.

Information Appliances and Tools: Simplicity and Power Tradeoffs in the Visage Exploration Environment • 13
In summary, this example illustrates several important aspects of the Visage environment:
• Information is represented by first-class graphical objects that are directly manipulated by
users and can be copied and transferred across frames
• Painting operations are applied to objects and coordinated in multiple frames via a
common underlying object database
• Drill down, roll up, and other general-purpose operations can be performed directly on
objects in all frames, again through the common underlying object representation
• General-purpose operations are available for experienced users, but special-purpose
appliance-like interfaces are available in some frames for routine tasks and for occasional
users. The latter may use appliances to obtain basic information without using any of the
drag, drill-down and other operations
VISAGE GOALS
Our goal in the design of Visage is to incorporate basic information exploration components
within a consistent user interface approach that contains the following key elements:
1. A uniform object-oriented data space. The Visage object representation provides a
common medium for user interactions and data sharing among applications whose interfaces
are implemented in the Visage environment.
2. A consistent information-centric user interface paradigm. As the name implies, this
paradigm strives to provide users with greater direct contact with objects that represent
information they need to view and manipulate to perform their work. In this paradigm,
information is represented as first-class objects that can reside and be manipulated in
visualizations, application user interfaces, on desktops, in briefing materials, or anywhere else
people elect to place it. It is ultimately concerned with usability (i.e. it is user-centered).
Visage seeks to reduce the complexity and restrictions created when people cannot access
information directly and instead must face the mechanics of running and coordinating
applications and working with file system metaphors.
Information Appliances and Tools: Simplicity and Power Tradeoffs in the Visage Exploration Environment • 14
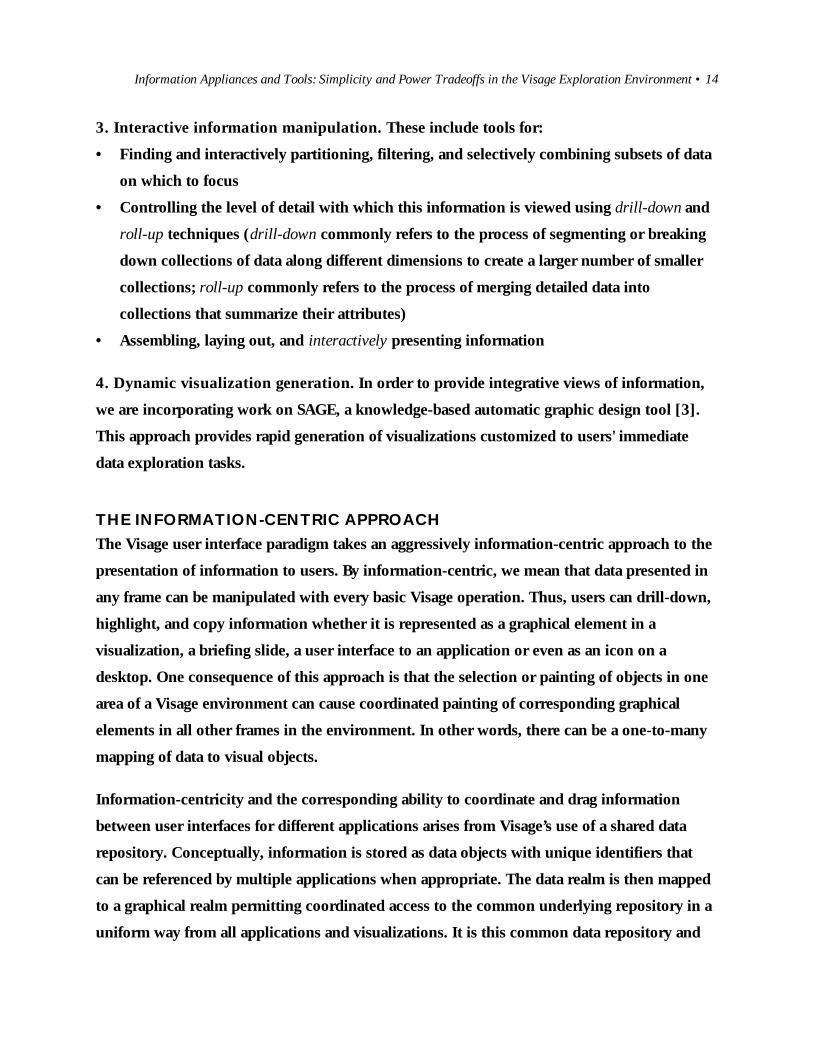
3. Interactive information manipulation. These include tools for:
• Finding and interactively partitioning, filtering, and selectively combining subsets of data
on which to focus
• Controlling the level of detail with which this information is viewed using drill-down and
roll-up techniques (drill-down commonly refers to the process of segmenting or breaking
down collections of data along different dimensions to create a larger number of smaller
collections; roll-up commonly refers to the process of merging detailed data into
collections that summarize their attributes)
• Assembling, laying out, and interactively presenting information
4. Dynamic visualization generation. In order to provide integrative views of information,
we are incorporating work on SAGE, a knowledge-based automatic graphic design tool [3].
This approach provides rapid generation of visualizations customized to users' immediate
data exploration tasks.
THE INFORMATION-CENTRIC APPROACH
The Visage user interface paradigm takes an aggressively information-centric approach to the
presentation of information to users. By information-centric, we mean that data presented in
any frame can be manipulated with every basic Visage operation. Thus, users can drill-down,
highlight, and copy information whether it is represented as a graphical element in a
visualization, a briefing slide, a user interface to an application or even as an icon on a
desktop. One consequence of this approach is that the selection or painting of objects in one
area of a Visage environment can cause coordinated painting of corresponding graphical
elements in all other frames in the environment. In other words, there can be a one-to-many
mapping of data to visual objects.
Information-centricity and the corresponding ability to coordinate and drag information
between user interfaces for different applications arises from Visage’s use of a shared data
repository. Conceptually, information is stored as data objects with unique identifiers that
can be referenced by multiple applications when appropriate. The data realm is then mapped
to a graphical realm permitting coordinated access to the common underlying repository in a
uniform way from all applications and visualizations. It is this common data repository and

Information Appliances and Tools: Simplicity and Power Tradeoffs in the Visage Exploration Environment • 15
consistent mapping to graphics that enables the graceful coordination of special-purpose,
customized appliances with more primitive operations performed throughout Visage frames.
The information-centric approach may be thought of as the next logical step along the path
from application-centric architectures to the modern document-centric approach. The
distinctions among the three approaches hinges on differences in the basic currency through
which users interact with the system.
In application-centric architectures, the basic currency is the file. The file system is
completely exposed to the user and a somewhat detailed understanding of its workings is a
prerequisite to the productive use of the system. Moreover, although files in the file system
are the basic unit of information, the files themselves are of little use to the user. To access
the information in their files, users must rely on applications to fetch and display the
information from the files on their behalf. In this regard, applications are like remote
manipulator arms in nuclear power plants—users are not allowed to touch their data, except
indirectly via various special-purpose tools. Each application has its own user interface that
defines what kinds of files people can manipulate and what they can do with them.
With the introduction of graphical user interfaces and the desktop metaphor, files became
concrete visual objects, directly manipulable by the user, storable on the desktop or in
folders, and--to a limited extent - arrangeable by users and software in semantically
meaningful ways. But the contents of those files were still out of direct reach of the user.
The advent of document-centric interface paradigms has introduced many positive changes
into this story. In this world, the basic currency is no longer the file but rather the
document—an entity with some potential meaning in the user's world-outside-the-computer.
The role of the application is subordinated (and perhaps ultimately eliminated) in favor of
component architectures whose interactions with the user are focused on direct
manipulations of documents. Documents may be kept on the desktop in addition to files and
may be directly activated and manipulated via drag-and-drop operations. Documents may
serve as containers for other documents, enabling natural modes of grouping and attaching
information together in meaningful units. Some extremely document-centric interfaces (e.g.
Workscape [5], Web Forager [6]) permit the spatial arrangement of large numbers of
Information Appliances and Tools: Simplicity and Power Tradeoffs in the Visage Exploration Environment • 16
documents, enabling effective visualizations of the relationships among them. The application
of dynamic query techniques in a document-centric world enables visual search paradigms.
In document-centric interfaces, users can almost "get their hands on" their documents.
The information-centric approach in Visage simply represents a natural continuation of these
trends. Visage abandons the primacy of the document wrapper as the central focus of user
interaction in favor of the data element as the basic currency of the interface. Rather than
limiting the user to files and documents as targets of direct manipulation, Visage permits
direct drag-and-drop manipulation of data at any level of granularity. A numeric entry in a
table, selected bars from a bar chart, and a complex presentation graphic are all first-class
candidates for user manipulations, and all follow the same "physics" of the interface.
The object-oriented nature of this approach clearly is not unique to Visage and indeed was
introduced and explored in Smalltalk [7]. Work done more recently on ARK [8] and Self [9]
have applied similar principles to simulation and programming environments. Such object-
focused environments eschew the use of separate views and tools to make the objects
themselves the focus of attention.
The design principles of directness and liveness [10] are central to approaches taken in Self,
Workscape and Visage. In all these environments, operations are always performed directly
on representations of the objects themselves rather than through some alternative
representation or tool. Objects respond to user action or the influence of other objects in an
active and animated fashion.
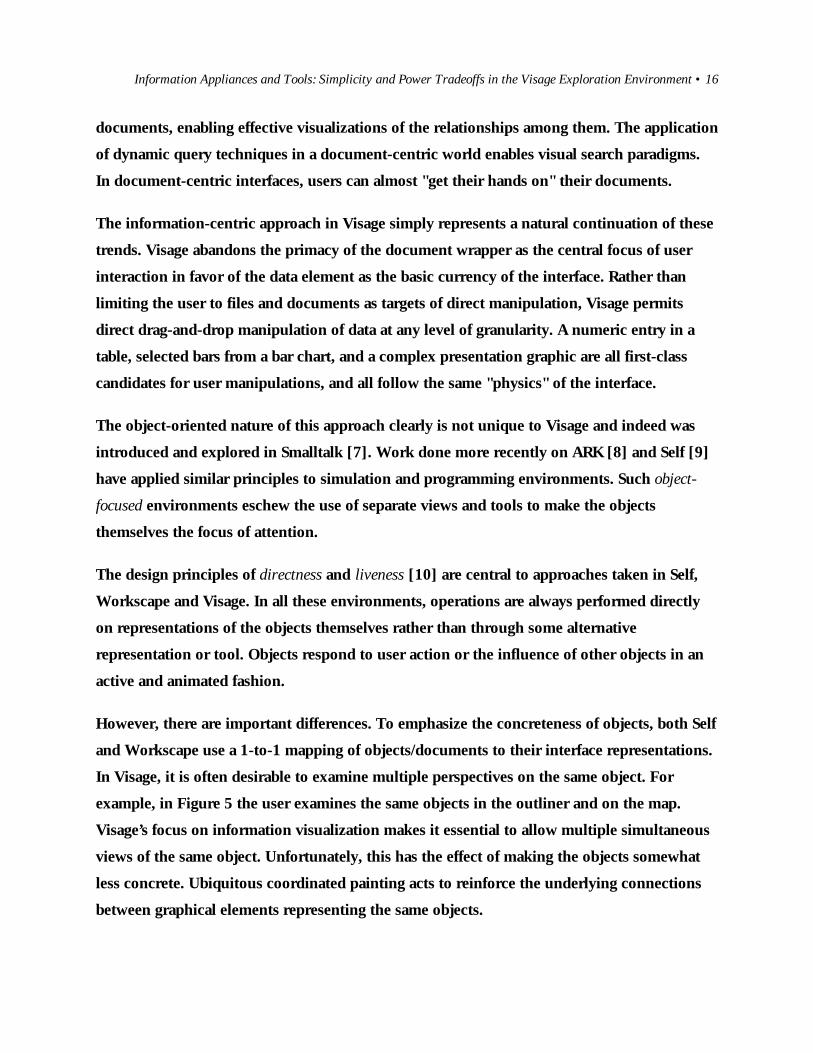
However, there are important differences. To emphasize the concreteness of objects, both Self
and Workscape use a 1-to-1 mapping of objects/documents to their interface representations.
In Visage, it is often desirable to examine multiple perspectives on the same object. For
example, in Figure 5 the user examines the same objects in the outliner and on the map.
Visage’s focus on information visualization makes it essential to allow multiple simultaneous
views of the same object. Unfortunately, this has the effect of making the objects somewhat
less concrete. Ubiquitous coordinated painting acts to reinforce the underlying connections
between graphical elements representing the same objects.

Information Appliances and Tools: Simplicity and Power Tradeoffs in the Visage Exploration Environment • 17
MAIN COMPONENTS OF THE VISAGE ENVIRONMENT
The Visage interface environment strives to minimize the number of fundamentally different
kinds of objects that must be understood by users. Objects exist in either the data realm or
the graphical realm.
Visage uses an object-oriented representation for data in its database. From a user’s
perspective, Visage has two basic object types: concepts and collections. Concepts are simply
buckets of attribute-value pairs, with values being either literals such as integers, strings, and
dates or links (i.e. relations) to other concepts. Collections are themselves represented as
concepts but are distinguished because users are encouraged to view them as groupings (i.e.
aggregates) of other concepts.
Visage employs a much simpler object model than traditional object-oriented systems—
focused less on the encapsulation and representation of verbs and focused more on nouns. In
other words, rather than placing primary focus on the encapsulation of program code as
methods (i.e. the verbs of the environment), it deals with the representation of information
content in a simple, universally accessible form (i.e. nouns). Rather than hiding data details,
the contents of objects are available for examination and use by all applications and users.
In the graphical realm, Visage has only two basic object types: visual elements and frames. The
term visual elements (or simply elements) refers to any atomically-manipulable graphical
object in a Visage display. Examples of elements are bars in a bar chart, the text label of an
axis, a point in a scatter chart, or a numeric value in a spreadsheet-like cell. Each visual
element corresponds to a concept in the database. Note that this relationship is one-to-many:
each element is associated with exactly one concept, but the same concept may be
represented by multiple elements.
Frames, the second basic graphical object type, serve as pasteboards for elements. Strictly
speaking, frames are themselves elements, but are sufficiently distinct in the user's model of
the interface as to warrant separate treatment. Like windows in traditional GUI designs,
frames provide a grouping function for related elements as well as a frame of reference for
their arrangement. Unlike windows, however, frames are lightweight objects, easily created
and destroyed, frequently manipulated by the user, and are themselves subject to the entire

Information Appliances and Tools: Simplicity and Power Tradeoffs in the Visage Exploration Environment • 18
repertoire of direct-manipulation actions available for other elements (duplication, drag &
drop, dynamic scaling, etc.). Indeed, as an element, a frame is represented by a single
underlying concept, which typically serves as an aggregate (i.e. collection) of all data
concepts represented within the frame, as well as all graphical elements that are contained in
the frame (e.g. the elements representing the data concepts, graph axes, table columns, map
guidelines and other visualization components).
Frames and their contents may be freely scaled, either by direct manipulation or by script. A
given frame may be shrunk to thumbnail size for temporary storage, or expanded to full-
screen during a presentation. This capability enables the efficient and flexible usage of the
available screen real estate.
All Visage displays of information (i.e. visualizations) are made up exclusively of collections
of elements arranged by a frame to form the display. For example, the chart in Figure 2 is not
a discrete picture, but rather an arrangement of elements that can be broken apart by a user
and manipulated separately. In this sense, Visage frames are not so much drawn as they are
composed of arrangements of elements. As the illustration shows, this makes it easy for a user
to select bars from a frame and drag them to another frame. This ability to directly drag small
collections of data forms the basis of the information-centric approach to interface design
described above. It is a central feature for enabling the coordination of appliances and tools
that is the focus of this paper.
Hints of this approach may be found in a few existing interfaces. For example, Microsoft
Word supports the ability to drag selected text from one place in the document to another -
thus bypassing the often criticized invisible clipboard as a mechanism for moving data
around within an application (however text cannot be dragged onto the desktop or into other
applications). On some platforms, Netscape enables images to be dragged from web page
windows onto the desktop (though they are immediately replaced by icons and hidden within
files).
Likewise, several visualization tools support representing data objects graphically and provide
filtering, painting of linked displays, and related operations [11,12,13,14]. In Visage, these
capabilities are promoted from special-purpose features to capabilities provided everywhere

Information Appliances and Tools: Simplicity and Power Tradeoffs in the Visage Exploration Environment • 19
in the environment. They become part of the basic physics of the interface, empowering the
user to directly perform simple actions where other systems require the use of complicated or
inconsistent interface features.
The Visage user interface is highly scripted. Beyond the processing of basic user events, such
as mouse-dragging and clicking, much of the high-level behavior of the system is controlled
by user-accessible script rather than hard-coded methods.
The scripting environment is the basis for delivering to the user the drill-down and roll-up
data navigation features described above. Such operations form the basis for very powerful
incremental data navigation and summarization which would require complex queries in
conventional database systems. The Visage scripting language is similar to HyperTalk or
Visual Basic and contains language features tuned to data navigation and aggregation
functions (e.g. for stepping across links among objects, iterating over object sets and
accumulating sums of values of quantitative attributes).
Scripting provides a mechanism for specifying derived attributes, an essential feature in
support of the Visage's data exploration operations. Although the underlying database being
explored may have many data values directly given, many other values typically need to be
derived in a very situation-specific manner. For example, in a transportation scheduling
application, the database may contain attributes of a commodity such as gross weight and
package weight. The user, however, may require a display of net shipping weight, which is
not directly given. Visage allows the definition of scripts that compute these derived
attributes. Once defined, these scripts make available to the user data indistinguishable from
that directly given in a database.
Finally, the process of rendering a visualization is the responsibility of a frame’s script. For
both SAGE-generated and hand built frames, creation and arrangement of elements within a
frame are managed by the frame’s scripts. When elements are dropped into a Visage frame, its
script identifies the concepts represented by the elements, determines those appropriate to
the frame, and either directly maps these concepts to new visual elements of a type
appropriate to the frame (e.g. text for an outliner table or bars for a chart). These new
elements are then arranged in the style specified by the frame.
Information Appliances and Tools: Simplicity and Power Tradeoffs in the Visage Exploration Environment • 20
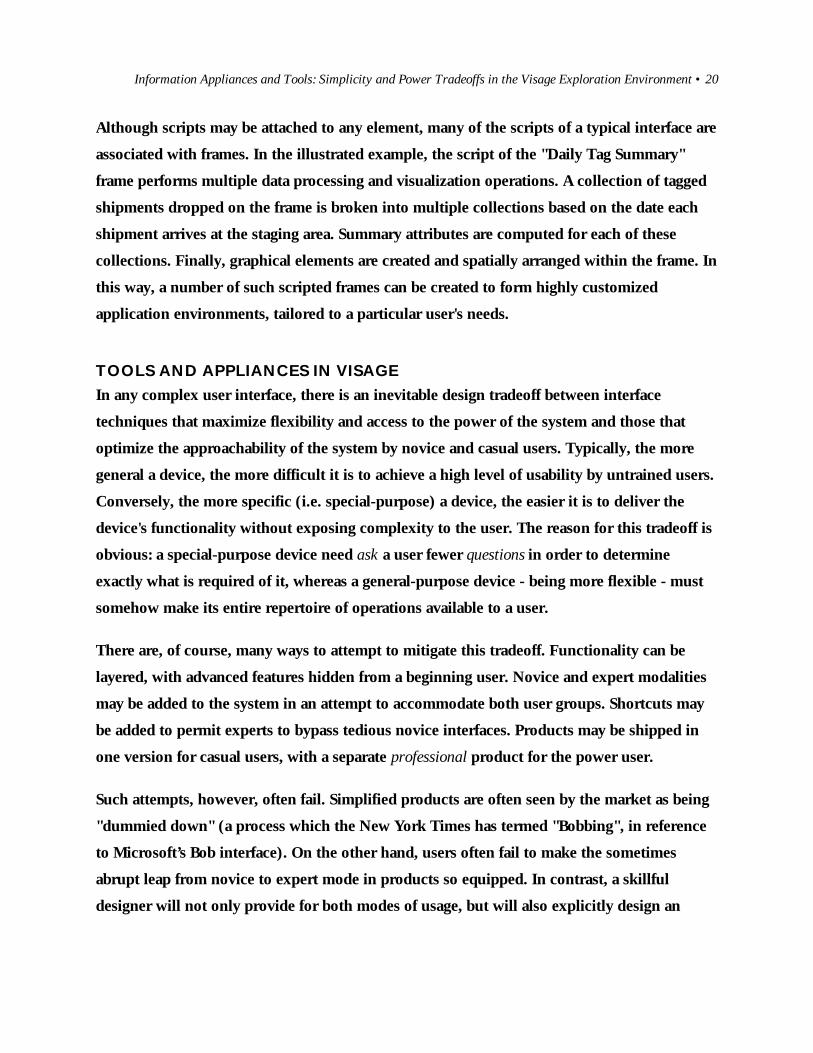
Although scripts may be attached to any element, many of the scripts of a typical interface are
associated with frames. In the illustrated example, the script of the "Daily Tag Summary"
frame performs multiple data processing and visualization operations. A collection of tagged
shipments dropped on the frame is broken into multiple collections based on the date each
shipment arrives at the staging area. Summary attributes are computed for each of these
collections. Finally, graphical elements are created and spatially arranged within the frame. In
this way, a number of such scripted frames can be created to form highly customized
application environments, tailored to a particular user's needs.
TOOLS AND APPLIANCES IN VISAGE
In any complex user interface, there is an inevitable design tradeoff between interface
techniques that maximize flexibility and access to the power of the system and those that
optimize the approachability of the system by novice and casual users. Typically, the more
general a device, the more difficult it is to achieve a high level of usability by untrained users.
Conversely, the more specific (i.e. special-purpose) a device, the easier it is to deliver the
device's functionality without exposing complexity to the user. The reason for this tradeoff is
obvious: a special-purpose device need ask a user fewer questions in order to determine
exactly what is required of it, whereas a general-purpose device - being more flexible - must
somehow make its entire repertoire of operations available to a user.
There are, of course, many ways to attempt to mitigate this tradeoff. Functionality can be
layered, with advanced features hidden from a beginning user. Novice and expert modalities
may be added to the system in an attempt to accommodate both user groups. Shortcuts may
be added to permit experts to bypass tedious novice interfaces. Products may be shipped in
one version for casual users, with a separate professional product for the power user.
Such attempts, however, often fail. Simplified products are often seen by the market as being
"dummied down" (a process which the New York Times has termed "Bobbing", in reference
to Microsoft’s Bob interface). On the other hand, users often fail to make the sometimes
abrupt leap from novice to expert mode in products so equipped. In contrast, a skillful
designer will not only provide for both modes of usage, but will also explicitly design an

Information Appliances and Tools: Simplicity and Power Tradeoffs in the Visage Exploration Environment • 21
incremental path from novice to expert usage. Moreover, an ideally designed interface would
support frequent and casual switching between novice and expert usage modes.
In Visage, we addressed these needs in the context of a single data exploration and
visualization environment that provides functionality in two distinct but seamless modes. The
first mode is represented by a set of general purpose capabilities delivered to the user in the
form of tools. Like real tools, they are very general and flexible, but require the skilled hand
of the expert crafter in order to be used effectively. They are composable: they can be
combined in unique ways to perform sequences of operations. However, such composition
requires knowing how to select the right tools and sequence to achieve each information
analysis goal.
The second mode is embodied in an open-ended set of highly specific scripted appliances that
are specialized to meet the needs of specific users, tasks and contexts. Appliances are much
less general than tools, but they tend to be very easy to learn and use due to their high level of
specificity. Appliances tend not to be composable: the results they generate cannot typically
serve as input to other appliances. These properties produce both the ease of use as well as
inflexibility in most systems. In Visage, we have attempted to achieve flexible composition by
supporting transfer of information among appliances and tools and application of tools
directly in specialized appliances.
The techniques described here is a generalization of an approach pioneered by computer
spreadsheet programs. In typical use, spreadsheets are more than just applications. They are
media for creating special purpose analysis appliances—created by power users for the use in
very specific situations by very specific user communities. It was this ability of spreadsheets
to permit a small number of power users to directly support a larger community of end users
without the need to have expert programmers in the loop that made spreadsheets the first
enormous success in the personal computer market. Spreadsheets also demonstrated the
value of providing a continuum of interfaces, ranging from primitive basic operations, so-
called power tools and macros, and customized programs.
Similarly, in Visage, it was necessary to support a range of users and tasks. The tasks varied in
how frequently they were performed and whether they were performed in relative isolation of

Information Appliances and Tools: Simplicity and Power Tradeoffs in the Visage Exploration Environment • 22
each other or flexibly combined and coordinated. A continuum of interface types emerged
along the tool-appliance spectrum. We refer to these as primitive tools, power tools and
appliances.
PRIMITIVE TOOLS: BASIC, COMPOSABLE, UBIQUITOUS OPERATIONS
Primitives operations in Visage are available throughout the entire environment and are
applied to elements in all frames. We present a brief overview here to describe their relation
to more appliance-like interfaces. More detailed discussion is contained in [4]. Primitives
include elemental data manipulation, filtering, and visualization operations:
• Navigation or drill-down - traversing a link from a data object represented by a visual
element to related objects in the database
• Drag and drop filtering - controlling the set of objects and attributes shown by removing
them from one frame and/or combining them from multiple frames to another frame
• Creating collections - creating a new collection from a group of selected concepts and
summarizing the attributes of those concepts (e.g. means, totals, ranges of the collection).
• Coordinated painting - when one element is painted a color, all elements showing the
same underlying concept are also painted the same color. The painting of elements in
Visage is globally coordinated across all frames of the interface, enhancing a user's ability
to identify related information across frames. Painting is composable with other
operations: painted elements can be copied and/or dragged as a group to other frames.
• Dynamic query - controlling the objects shown in a frame with a dynamic query slider or
other in-place interface to control the scope of information viewed. Dynamic query tools
[12] are provided in Visage to permit the interactive control of the visual properties of
elements based on attributes of underlying data (typically controlling elements’ visibility,
though color and other properties can be controlled by sliders as well). Analysts may add
sliders to frames to select a subset of objects and then drag the subset to other frames for
other analyses. Likewise, a subset can be aggregated into collections and summarized.
• Visualization creation - selecting the frames of reference, the visual elements to appear
within them and the mappings from data to the properties of visual elements. SageBrush
[3], an interface for designing new visualizations, provides a set of primitive operations
for selecting and composing graphical objects (e.g. axes, tables, networks, bars, points,

Information Appliances and Tools: Simplicity and Power Tradeoffs in the Visage Exploration Environment • 23
links) and for picking properties of these objects to encode data attributes (e.g. position,
color, size, shape). The resulting visualizations are subject to all the above operations.
POWER TOOLS: CUSTOMIZED SETS OF REUSABLE OPERATIONS
Power tools typically consist of a sequence of primitive operations structured to allow a user
to perform a frequently needed task more quickly. Some are tailored to a particular analysis
domain, others are general operations that simplify what would otherwise require numerous
repetitive steps. Power tools are still composable operations and tend to be available in most
Visage interfaces. Some examples include:
• Recomposition - grouping objects (retrieved by navigating across a relation) by common
values of a specified attribute. Recall from the example, the elements of the "October 7"
aggregate were recomposed by the destination attribute. Without the recomposition power
tool, a user would have listed all the elements of the collection (i.e. all the shipments),
then selected all that share a particular value for "destination" (e.g. all shipments going to
New York) and created a new collection composed of just those elements. If this step
were repeated for each unique value in destination then the result would be the same as
the recompose operation.
• Scripted derived attribute - a new attribute whose value is determined by executing
script code.
• Scripted navigation paths - the creation of shortcut relations (i.e. paths) among objects.
For example, a unit makes a requisition, which is filled by a tagged shipment, which is
currently at a location. A scripted navigation path can be added to the unit concept to
represent this path directly as a single link called the order_location if this is a frequently
traversed set of links:
Unit Requisition Shipment Location
requires_supplies filled_by currently_at
order_location

Information Appliances and Tools: Simplicity and Power Tradeoffs in the Visage Exploration Environment • 24
• Visualization reuse - the storing and reuse of a visualization by creating a "stationery
pad" from which a user may tear off new visualizations. Thus, once a visualization has
been specified through basic design operations, it is then available as a power tool for
making new visualizations of the same type.
In Visage, power tools such as recomposition menus are available anywhere an element
appears: in the outliner, on a map, or in a chart. Although Visage’s recomposition mechanism
provides a general capability to reorganize collections in flexible ways, it is important to
recognize that users must understand the structure of the database in order to use this
mechanism effectively. The recomposition mechanism requires knowing the names of the
relations and attributes that will be used in the operation. Furthermore, analysts must
recognize the use of the recomposition tool as a means to achieve their analysis goals. In
contrast, when recomposition operations are captured within an appliance-like interface,
these options are specified by the appliance-builder, freeing the user from knowing the
specifics of the database structure and therefore enabling users to communicate at a much
higher, but less flexible level. For example, the Routes appliance collected shipments passing
through specified staging areas during the specified time period. The user didn’t need to
know the specific objects and relations that must be used to define those sets.
APPLIANCES: LOW EXPERTISE, HIGHLY SPECIFIC OPERATIONS
Appliances are specialized tools that perform operations specific to an application domain, a
user, or a particular analysis. Appliances typically allow the user to perform an analysis task
without requiring knowledge of the structural details of the database. Appliances are usually
frames with a small number of specialized interface controls. Examples include the caption
interfaces at the bottom of the Routes and Daily Tag Summary frames described in the
example.
Just as recomposition rolls together a sequence of primitive navigation and composition
steps, appliances encapsulate operations by rolling together a sequence of primitive and
scripted operations. Appliances can also capture operations that are not expressible using
primitives because they require visualization operations or data manipulations that can only
Information Appliances and Tools: Simplicity and Power Tradeoffs in the Visage Exploration Environment • 25
be accomplished in script. An example might be an appliance that performed a clustering
algorithm, generating a collection for each cluster of values.
Operations encapsulated within an appliance can be parameterized by simple interface
controls. For example, the controls on the caption on the Daily Tag Summary frame (in
Figures 2 and 3) allow the user to specify a staging area and date range. The appliance uses
these values as parameters to a script which filters the data to be shown in the frame.
In addition to specifying data input to appliances using special purpose interfaces, users can
drag and drop subsets of objects onto their frames. In the example, the "Routes" frame pulled
the data directly from the database in response to the user selecting a staging area and date
range. The Daily Tag Summary frame used the object dropped by the analyst to determine
which data to extract and visualize.
Primitives and power tools realize much of their power through their ability to compose
together multiple operations to form expressive queries. In contrast, appliances are generally
not as composable because they do not provide access to the intermediate steps leading to the
results they generate. They are therefore not customizable beyond those parameters that may
be changed in the interface.
However, well constructed appliances still follow the information-centric paradigm enabling
the user to drag elements representing results to other frames, add dynamic query sliders to
filter data, and perform drill down operations.
CONCLUSIONS
Combinations of different styles of interaction allow for more effective user interface
environments for data exploration. The ability to dynamically combine appliances with
primitive operations gives users the ability to choose among alternative processes for
achieving analysis goals based on user expertise and ease of use for supporting analysis tasks.
As system designers, we try to observe and try to anticipate the steps our users perform
frequently during their analyses. We build appliances to support these steps, enabling people

Information Appliances and Tools: Simplicity and Power Tradeoffs in the Visage Exploration Environment • 26
to perform them quickly and easily. We further support them by making it easy to transition
from routine data access and report generation to exploratory data analysis.
By holding steadfastly to the information-centric approach, we compound the usefulness of
our interfaces. Elements can be dragged from each frame to eliminate irrelevant data, to focus
on subsets in new ways in other frames for further analysis, or to categorize subsets of data
from the original frame by painting them in the context of attributes viewed in a new frame.
The universal availability of general purpose tools and primitive operations in the Visage
environment enables users to analyze data in ways that developers can not anticipate. Because
users aren't limited to just the appliances we provide, they can, at any time, consider
alternative steps that better serve the analysis at hand.
REFERENCESRao, R. and Card, S. K., The table lens: Merging graphical and symbolic representations in an
interactive focus+context visualization for tabular information. Proceedings CHI '94
Human Factors in Computing Systems, ACM, 318-322.
Ahlberg, C. and Wistrand, E., IVEE: An environment for automatic creation of dynamic
queries applications. Conference Companion, CHI '95 Human Factors in Computing Systems,
ACM, 15-16.
Roth, S. F., Kolojejchick, J., Mattis, J., and Goldstein, J., Interactive Graphic Design using
Automatic Presentation Knowledge. Proceedings CHI'94 Human Factors in computing
Systems, ACM, 112-117.
Roth, S. F., Chuah, M. C., Kerpedjiev, S., Kolojejchick, J, Lucas, P., Towards an Information
Visualization Workspace: Combining Multiple Means of Expression, Human-Computer
Interaction, Lawrence Erlbaum, CA, In press.
Ballay J. M., Designing Workscape: An Interdisciplinary Experience. Proceedings CHI '94
Human Factors in Computing Systems, ACM, 10-15.
Card, S.K., Robertson, G.C., and York, W., The WebBook and the Web Forager: An
Information Workspace for the World-Wide Web, Proceedings of the CHI’96 Conference on
Human Factors in Computing Systems, ACM, 111-117.
Tessler, L., The Smalltalk Environment, Byte Magazine, 6, 8, Aug 1981, 90-147.
Information Appliances and Tools: Simplicity and Power Tradeoffs in the Visage Exploration Environment • 27
Smith, R. B., Experiences with the Alternate Reality Kit, An Example of the Tension Between
Literalism and Magic, Proceedings of ACM CHI+GI'87 Conference on Human Factors in
Computing Systems and Graphics Interface, ACM, 61-67
Chang, B. W., Ungar, D., Smith, R. B., Getting Close to Objects: Object-Focused
Programming Environments Published in Visual Object Oriented Programming, Burnett,
M., Goldberg, A. and Lewis, T. Prentice Hall 1995, 185-198.
Maloney, J. H. and Smith, R. B. Directness and Liveness in the Morphic User Interface
Construction Environment, Proceedings of the ACM UIST’95 Symposium on User Interface
Software and Technology, ACM, 21-28
Eick, S. G. and Wills, G. J., Navigating large networks with hierarchies. Proceedings
Visualization'93, IEEE, October 1993.
Ahlberg, C. and Shneiderman, B., Visual information seeking: tight coupling of dynamic
query filters with starfield displays. Proceedings of the CHI '94 Conference on Human
Factors in Computing Systems, ACM, 313-317.
Goldstein, J., Roth, S.F., Kolojejchick, J., and Mattis, J., A framework for knowledge-based
interactive data exploration, Journal of Visual Languages and Computing, 5, 339-363.
McDonald, J. A., Painting multiple views of complex objects. Proceedings of the
ECOOP/OOPSLA '90 Conference, ACM, 245-257.