informatics and data analytics to support for exposome-based discovery
TRANSCRIPT
Informatics and data analytics to support exposome-based discovery
Perspectives from a NIEHS workshop
Chirag J Patel International Society of Exposure Science
Henderson, NV (by way of Boston, MA) 10/20/15
[email protected] @chiragjp
www.chiragjpgroup.org

Arjun Manrai (Harvard)* Yuxia Cui (NIEHS)
Pierre Bushel (NIEHS) Molly Hall (Penn State, now U Penn)*
Spyros Karakitsios (Aristotle U, Greece) Carolyn Mattingly (NCSU)
Marylyn Ritchie (Geisinger Health/Penn State) Charles Schmitt (NIEHS)
Denis Sarigiannis (Aristotle U, Greece) Duncan Thomas (USC)
David Wishart (U Alberta, Canada) David Balshaw (NIEHS)
The workgroup discussed informatics capability for high-throughput exposome research
(late 2014 to early 2015)

We are now in the era of high-throughput biology and biomedicine.
(now possible to assay thousands to millions of datapoints today)

We are now in the era of high-throughput biology and biomedicine: examples of genomic advances
genetic arrays gene expression
common genetic variants epigenome (methylation)
whole genome sequencing (WGS) full genome sequencing
mRNA-seq epigenome (3D, histone)
3 x 10⁹ nucleotide bases
3-4 x 10⁴ genes106 to 107 variants

Informatics has enabled discovery in genomics investigations.
1. infrastructure/standards,
2. analytics,
3. databases

Information infrastructure has enabled discovery in genomics (example: UCSC genome browser)

Analytic methods have enabled discovery in genomics (example: genome-wide association [GWAS])
A search engine for genetic influence in phenotypes Genome-wide association studies (GWASs)
580 VOLUME 42 | NUMBER 7 | JULY 2010 NATURE GENETICS
A RT I C L E S
13 autosomal loci exceeded the threshold for genome-wide significance (P ranging from 2.8 × 10⁻⁸ to 1.4 × 10⁻²²) with allele-specific odds ratios (ORs) between 1.06 and 1.14 (Table 1 and Fig. 2). All signals remained close to or beyond genome-wide significance thresholds (the least significant P value was 5.2 × 10⁻⁸) when we repeated analyses after implementing a second (post meta-analysis) round of genomic control adjustment within stage 1 data (Supplementary Note).
We extended our search for susceptibility signals to the X chromo-some, identifying one further signal in the stage 1 discovery samples meeting our criteria for follow-up (represented by rs5945326, near DUSP9, P = 2.3 × 10⁻⁶). This SNP showed strong evidence for replication in 8,535 cases and 12,326 controls (OR (allowing for X-inactivation) 1.32 (95% CI 1.16–1.49), P = 2.3 × 10⁻⁵), for a combined association P value of 3.0 × 10⁻¹⁰ (OR 1.27 (95% CI 1.18–1.37)) (Table 1 and Fig. 2).
Fourteen signals reaching genome-wide significanceTwo of the 14 signals reaching genome-wide significance on joint analysis (those near MTNR1B and IRS1) represent loci for which T2D associations have been recently reported in samples which partially overlap with those studied here10,14–16 (Table 1).
A third signal (rs231362) on 11p15 overlaps both intron 11 of KCNQ1 and the KCNQ1OT1 transcript that controls regional imprint-ing17 and influences expression of nearby genes including CDKN1C, a known regulator of beta-cell development18. This signal maps ~150 kb from T2D-associated SNPs in the 3 end of KCNQ1 first identified in East Asian GWA scans8,9. SNPs within the 3 signal were also detected in the current DIAGRAM+ meta-analysis (for example, rs163184, P = 6.8 × 10⁻⁵), but they failed to meet the threshold for initiating replication. A SNP in the 3 region (rs2237895) that was reported to reach genome-wide significance in Danish samples9 was neither typed nor imputed in the DIAGRAM+ studies. In our European-descent samples, rs231362 and SNPs in the 3 signal were not correlated
(r2 < 0.05), and conditional analyses (see below) establish these SNPs as independent (Fig. 2 and Supplementary Table 4). Further analysis in Icelandic samples has shown that both associations are restricted to the maternally transmitted allele11. Both T2D loci are independent of the common variant associations with electrocardiographic QT intervals that map at the 5 end of KCNQ1 (r2 < 0.02, D < 0.35 in HapMap European CEU data)19,20 (Supplementary Table 5).
Of the remaining loci, two (near BCL11A and HNF1A) have been highlighted in previous studies7,21–23 but are now shown to reach genome-wide significance. Rare mutations in HNF1A account for a substantial proportion of cases of maturity onset diabetes of the young, and a population-specific variant (G319S) influences T2D risk in Oji-Cree Indians24. Confirmation of a common variant association at HNF1A brings to five the number of loci known to harbor both rare mutations causal for monogenic forms of diabetes and common vari-ants predisposing to multifactorial diabetes, the others being PPARG, KCNJ11, WFS1 and HNF1B. A T2D association in the BCL11A region was suggested by the earlier DIAGRAM meta-analysis (rs10490072, P = 3 × 10⁻⁵), but replication was inconclusive7; there is only modest linkage disequilibrium (LD) between rs10490072 and the lead SNP from the present analysis (rs243021, r2 = 0.22, D = 0.73 in HapMap CEU).
The remaining nine signals map near the genes HMGA2, CENTD2, KLF14, PRC1, TP53INP1, ZBED3, ZFAND6, CHCHD9 and DUSP9 (Table 1 and Figs. 1 and 2) and represent new T2D risk loci uncovered by the DIAGRAM+ meta-analysis.
Understanding the genetic architecture of type 2 diabetesCombining newly identified and previously reported loci and assuming a multiplicative model, the sibling relative risk attributable to the 32 T2D susceptibility variants described in this paper is ~1.14. With addition of the five T2D loci recently identified by the Meta-Analysis of Glucose and Insulin-related traits Consortium (MAGIC) investigators12,13 and
50 Locus established previouslyLocus identified by current studyLocus not confirmed by current study
BCL11A
THADANOTCH2
ADAMTS9
IRS1
IGF2BP2
WFS1ZBED3
CDKAL1
HHEX/IDEKCNQ1 (2 signals*: )
TCF7L2
KCNJ11CENTD2MTNR1B
HMGA2 ZFAND6PRC1
FTOHNF1B DUSP9
Conditional analysis
Unconditional analysis
TSPAN8/LGR5HNF1A
CDC123/CAMK1DCHCHD9
CDKN2A/2BSLC30A8
TP53INP1
JAZF1KLF14
PPAR
40
30
–log
10(P
)–l
og10
(P)
20
10
10
1 2 3 4 5 6 7 8Chromosome
9 10 11 12 13 14 15 16 17 18 19 20 21 22 X0
0
Suggestive statistical association (P < 1 10–5)
Association in identified or established region (P < 1 10–4)
Figure 1 Genome-wide Manhattan plots for the DIAGRAM+ stage 1 meta-analysis. Top panel summarizes the results of the unconditional meta-analysis. Previously established loci are denoted in red and loci identified by the current study are denoted in green. The ten signals in blue are those taken forward but not confirmed in stage 2 analyses. The genes used to name signals have been chosen on the basis of proximity to the index SNP and should not be presumed to indicate causality. The lower panel summarizes the results of equivalent meta-analysis after conditioning on 30 previously established and newly identified autosomal T2D-associated SNPs (denoted by the dotted lines below these loci in the upper panel). Newly discovered conditional signals (outside established loci) are denoted with an orange dot if they show suggestive levels of significance (P < 10−5), whereas secondary signals close to already confirmed T2D loci are shown in purple (P < 10−4).
Voight et al, Nature Genetics 2012 N=8K T2D, 39K Controls
GWAS in Type 2 Diabetes

758,000 individuals >400 studies
>>1B datapoints (genotypes and phenotypes) >950 manuscripts (Paltoo et al., Nature Genetics 2014)
Accessible data repositories have enabled discovery in genomics investigation:
(ex: Databases of Genotypes and Phenotypes)
We claim that there is need for informatics analytic methods, databases, and standards for the exposome-driven discovery.
EWAS akin to GWAS?

Why?courtesy: colabria.com

P = G + E

σ2P = σ2G + σ2E

σ2G
σ2P H2 =
Heritability (H2) is the range of phenotypic variability attributed to genetic variability in a population

Eye colorHair curliness
Type-1 diabetesHeight
SchizophreniaEpilepsy
Graves' diseaseCeliac disease
Polycystic ovary syndromeAttention deficit hyperactivity disorder
Bipolar disorderObesity
Alzheimer's diseaseAnorexia nervosa
PsoriasisBone mineral density
Menarche, age atNicotine dependence
Sexual orientationAlcoholism
LupusRheumatoid arthritis
Crohn's diseaseMigraine
Thyroid cancerAutism
Blood pressure, diastolicBody mass index
DepressionCoronary artery disease
InsomniaMenopause, age at
Heart diseaseProstate cancer
QT intervalBreast cancer
Ovarian cancerHangoverStrokeAsthma
Blood pressure, systolicHypertensionOsteoarthritis
Parkinson's diseaseLongevity
Type-2 diabetesGallstone diseaseTesticular cancer
Cervical cancerSciatica
Bladder cancerColon cancerLung cancerLeukemia
Stomach cancer
0 25 50 75 100Heritability: Var(G)/Var(Phenotype) Source: SNPedia.com
H2 estimates for complex traits are low and variable: massive opportunity for high-throughput E research
Type 2 Diabetes (25%)
Heart Disease (25-30%)
Autism (50%???)
Gaugler et al, Nature Genetics (2014)

Eye colorHair curliness
Type-1 diabetesHeight
SchizophreniaEpilepsy
Graves' diseaseCeliac disease
Polycystic ovary syndromeAttention deficit hyperactivity disorder
Bipolar disorderObesity
Alzheimer's diseaseAnorexia nervosa
PsoriasisBone mineral density
Menarche, age atNicotine dependence
Sexual orientationAlcoholism
LupusRheumatoid arthritis
Crohn's diseaseMigraine
Thyroid cancerAutism
Blood pressure, diastolicBody mass index
DepressionCoronary artery disease
InsomniaMenopause, age at
Heart diseaseProstate cancer
QT intervalBreast cancer
Ovarian cancerHangoverStrokeAsthma
Blood pressure, systolicHypertensionOsteoarthritis
Parkinson's diseaseLongevity
Type-2 diabetesGallstone diseaseTesticular cancer
Cervical cancerSciatica
Bladder cancerColon cancerLung cancerLeukemia
Stomach cancer
0 25 50 75 100Heritability: Var(G)/Var(Phenotype) Source: SNPedia.com
H2 estimates for complex traits are low and variable: massive opportunity for high-throughput E research
H2 < 50%

©20
15N
atur
e A
mer
ica,
Inc.
All
righ
ts r
eser
ved.
NATURE GENETICS ADVANCE ONLINE PUBLICATION 1
A N A LY S I S
Despite a century of research on complex traits in humans, the relative importance and specific nature of the influences of genes and environment on human traits remain controversial. We report a meta-analysis of twin correlations and reported variance components for 17,804 traits from 2,748 publications including 14,558,903 partly dependent twin pairs, virtually all published twin studies of complex traits. Estimates of heritability cluster strongly within functional domains, and across all traits the reported heritability is 49%. For a majority (69%) of traits, the observed twin correlations are consistent with a simple and parsimonious model where twin resemblance is solely due to additive genetic variation. The data are inconsistent with substantial influences from shared environment or non-additive genetic variation. This study provides the most comprehensive analysis of the causes of individual differences in human traits thus far and will guide future gene-mapping efforts. All the results can be visualized using the MaTCH webtool.
Specifically, the partitioning of observed variability into underlying genetic and environmental sources and the relative importance of additive and non-additive genetic variation are continually debated1–5. Recent results from large-scale genome-wide association studies (GWAS) show that many genetic variants contribute to the variation in complex traits and that effect sizes are typically small6,7. However, the sum of the variance explained by the detected variants is much smaller than the reported heritability of the trait4,6–10. This ‘missing heritability’ has led some investigators to conclude that non-additive variation must be important4,11. Although the presence of gene-gene interaction has been demonstrated empirically5,12–17, little is known about its relative contribution to observed variation18.
In this study, our aim is twofold. First, we analyze empirical esti-mates of the relative contributions of genes and environment for virtually all human traits investigated in the past 50 years. Second, we assess empirical evidence for the presence and relative importance of non-additive genetic influences on all human traits studied. We rely on classical twin studies, as the twin design has been used widely to disentangle the relative contributions of genes and environment, across a variety of human traits. The classical twin design is based on contrasting the trait resemblance of monozygotic and dizygotic twin pairs. Monozygotic twins are genetically identical, and dizygotic twins are genetically full siblings. We show that, for a majority of traits (69%), the observed statistics are consistent with a simple and parsi-monious model where the observed variation is solely due to additive genetic variation. The data are inconsistent with a substantial influence from shared environment or non-additive genetic variation. We also show that estimates of heritability cluster strongly within functional domains, and across all traits the reported heritability is 49%. Our results are based on a meta-analysis of twin correlations and reported variance components for 17,804 traits from 2,748 publications includ-ing 14,558,903 partly dependent twin pairs, virtually all twin studies of complex traits published between 1958 and 2012. This study provides the most comprehensive analysis of the causes of individual differences in human traits thus far and will guide future gene-mapping efforts. All results can be visualized with the accompanying MaTCH webtool.
RESULTSThe distribution of studied traits is nonrandomWe systematically retrieved published classical twin studies in which observed variation in human traits was partitioned into genetic and environmental influences. For each study, we collected reported
Meta-analysis of the heritability of human traits based on fifty years of twin studiesTinca J C Polderman1,10, Beben Benyamin2,10, Christiaan A de Leeuw1,3, Patrick F Sullivan4–6, Arjen van Bochoven7, Peter M Visscher2,8,11 & Danielle Posthuma1,9,11
1Department of Complex Trait Genetics, VU University, Center for Neurogenomics and Cognitive Research, Amsterdam, the Netherlands. 2Queensland Brain Institute, University of Queensland, Brisbane, Queensland, Australia. 3Institute for Computing and Information Sciences, Radboud University Nijmegen, Nijmegen, the Netherlands. 4Center for Psychiatric Genomics, Department of Genetics, University of North Carolina, Chapel Hill, North Carolina, USA. 5Department of Psychiatry, University of North Carolina, Chapel Hill, North Carolina, USA. 6Department of Medical Epidemiology and Biostatistics, Karolinska Institutet, Stockholm, Sweden. 7Faculty of Sciences, VU University, Amsterdam, the Netherlands. 8University of Queensland Diamantina Institute, Translational Research Institute, Brisbane, Queensland, Australia. 9Department of Clinical Genetics, VU University Medical Center, Neuroscience Campus Amsterdam, Amsterdam, the Netherlands. 10These authors contributed equally to this work. 11These authors jointly supervised this work. Correspondence should be addressed to D.P. ([email protected]).
Received 13 February; accepted 1 April; published online 18 May 2015; doi:10.1038/ng.3285
Insight into the nature of observed variation in human traits is impor-tant in medicine, psychology, social sciences and evolutionary biology. It has gained new relevance with both the ability to map genes for human traits and the availability of large, collaborative data sets to do so on an extensive and comprehensive scale. Individual differences in human traits have been studied for more than a century, yet the causes of variation in human traits remain uncertain and controversial.
Nature Genetics, 2015
17,804 traits of the phenome 2,748 publications
14,558,903 twin pairs
Average H2 (genome): 0.49
Exposome plays an equal role.
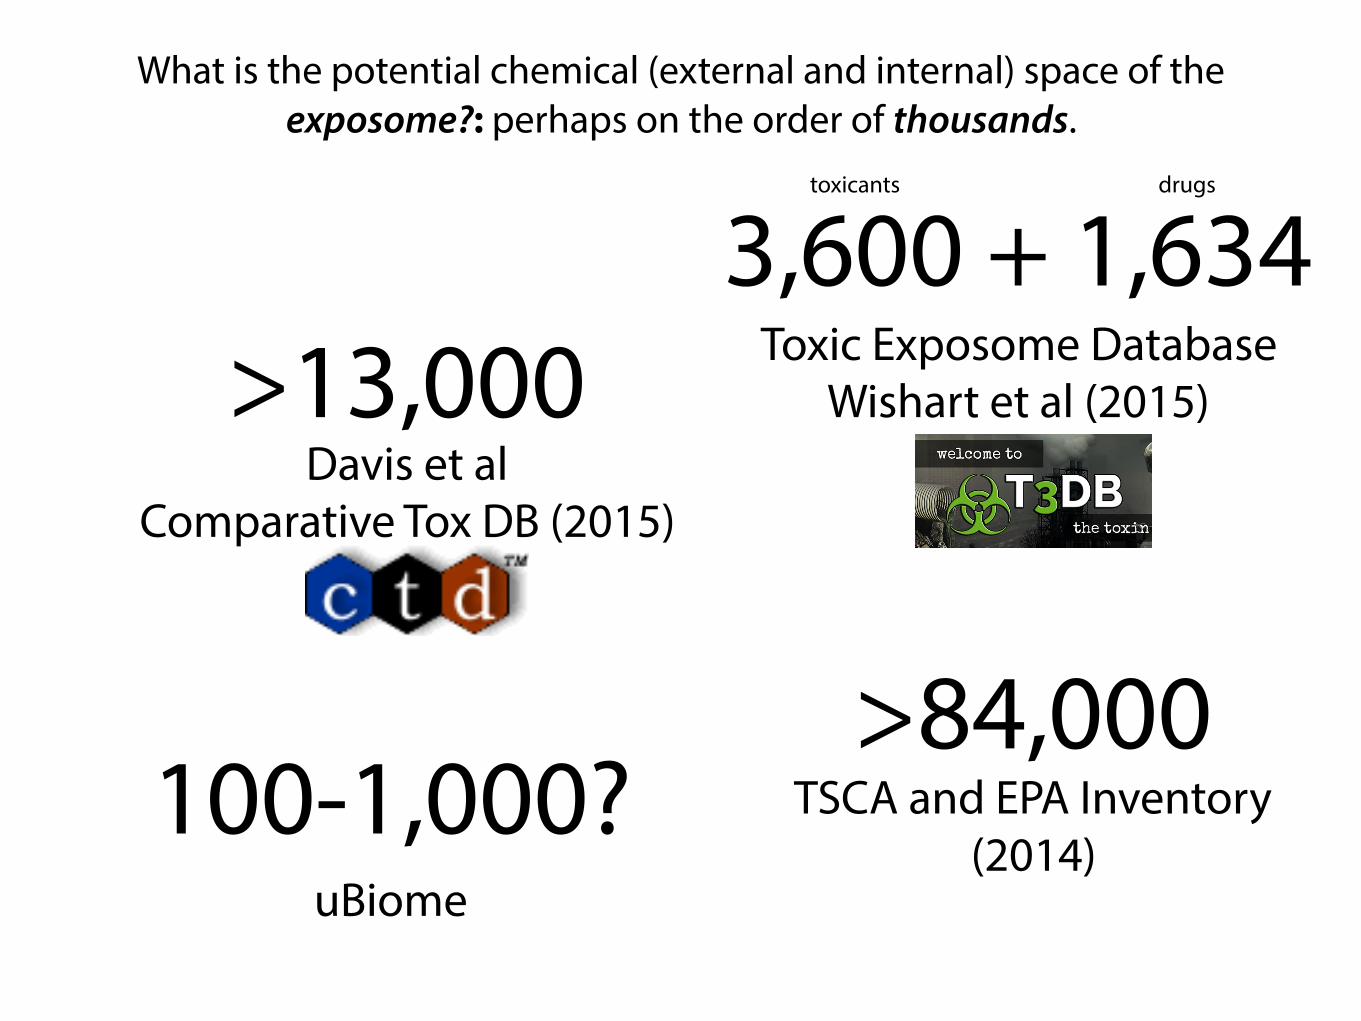
What is the potential chemical (external and internal) space of the exposome?: perhaps on the order of thousands.
>84,000TSCA and EPA Inventory
(2014)
>13,000Davis et al
Comparative Tox DB (2015)
3,600 + 1,634Toxic Exposome Database
Wishart et al (2015)
toxicants drugs
100-1,000? uBiome

What will the exposome data structure look like?: a high-dimensioned 3D matrix of (1) exposure measurements
on (2) individuals as a function of (3) time
time
exposome phenome
pollutants
diet
metabolites . . .
gut flora
height
weightCVD
BPT2D
cancer
xenobiotics . . .
indi
vidu
als
GWAS, RVAS, pathway analysis..etc.
EWAS, PheWAS..etc.
geno
me
(sta
tic)
mixtures of exposures
time
drugs
integrative
mixtures of phenotypes
(A) (C)
(B)
exposome factors
nutrient value for individual i
individual i

What will the exposome data structure look like?: a high-dimensioned 3D matrix of (1) exposure measurements
on (2) individuals as a function of (3) time
time
exposome phenome
pollutants
diet
metabolites . . .
gut flora
height
weightCVD
BPT2D
cancer
xenobiotics . . .
indi
vidu
als
GWAS, RVAS, pathway analysis..etc.
EWAS, PheWAS..etc.
geno
me
(sta
tic)
mixtures of exposures
time
drugs
integrative
mixtures of phenotypes
(A) (C)
(B)
longitudinal
system
genome

Data-driven investigation for novel exposome factors in the phenome: Exposome-wide, phenome-wide, and genome-exposome-wide discovery
time
exposome phenome
pollutants
diet
metabolites . . .
gut flora
height
weightCVD
BPT2D
cancer
xenobiotics . . .
indi
vidu
als
GWAS, RVAS, pathway analysis..etc.
EWAS, PheWAS..etc.
geno
me
(sta
tic)
mixtures of exposures
time
drugs
integrative
mixtures of phenotypes
(A) (C)
(B)
Informatics methods to integrate heterogeneous data (E, G, and P) and to conduct EWAS, GxEWAS, and PheWAS
EWAS
PheWAS

Integration challenges in conducting data-driven investigation for novel exposome factors in the phenome:
The exposome is heterogenous and G does not equal E.
platform scale
time-dependent type
correlation
mass-spec: targeted vs. untargeted external vs. internal
sampling and life trajectories continuous vs. categorical
dense!
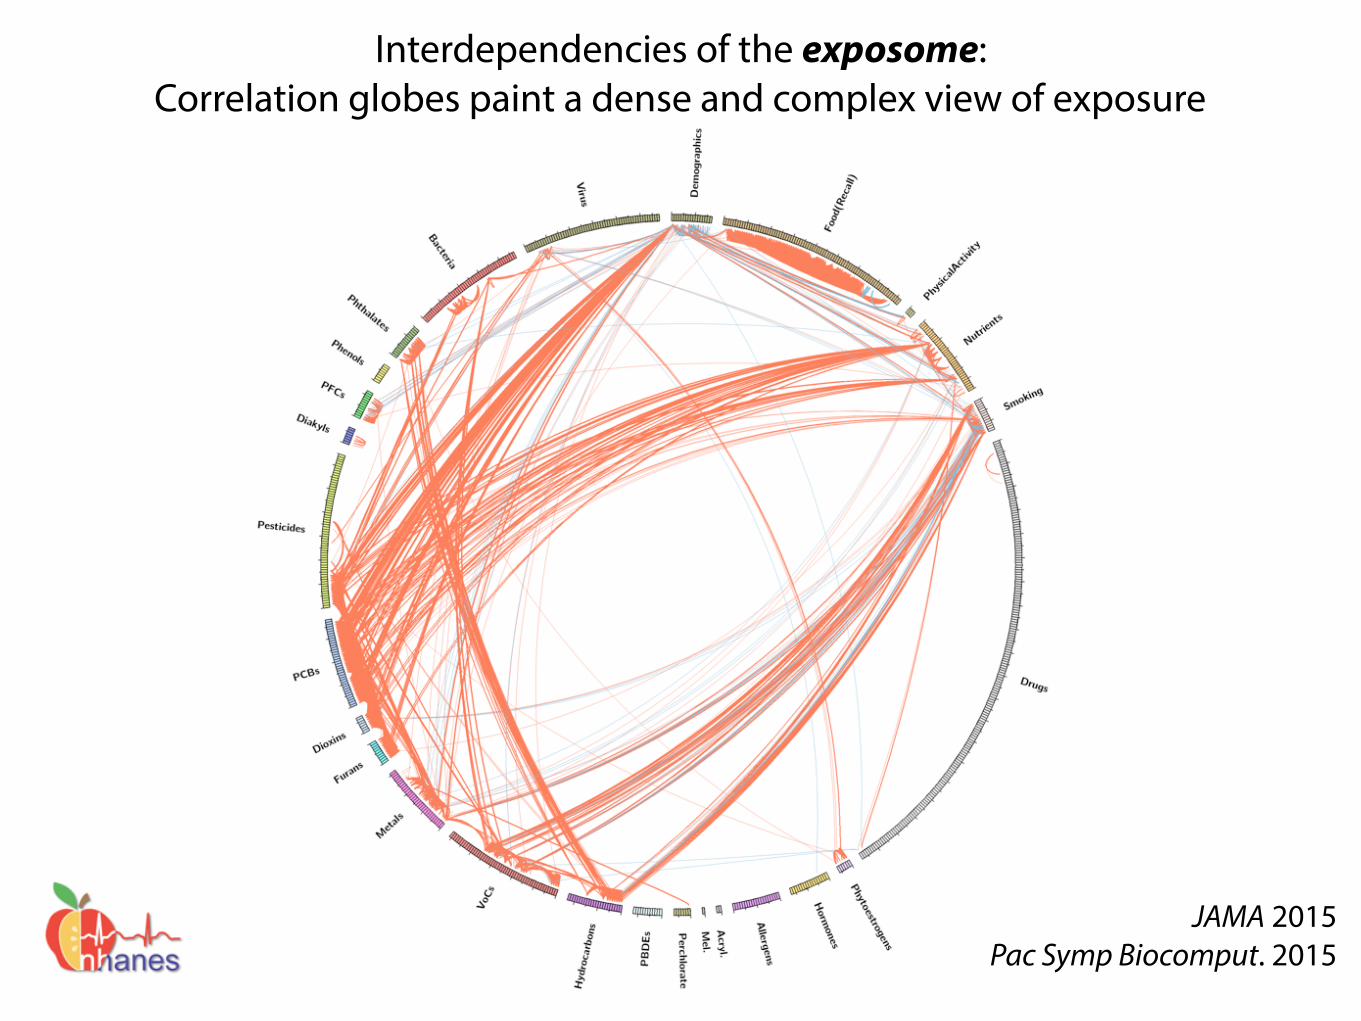
Interdependencies of the exposome: Correlation globes paint a dense and complex view of exposure
JAMA 2015 Pac Symp Biocomput. 2015

σ2P = σ2G + σ2E
σ2E ???

Alpha-carotene
Alcohol
Vita
min
E a
s al
pha-
toco
pher
olBeta-carotene
Caffeine
Calcium
Carbohydrate
Cholesterol
Copper
Beta-cryptoxanthin
Folic
aci
dFo
late
, DFE
Food
fola
teD
ieta
ry fi
ber
Iron
Energy
Lycopene
Lute
in +
zea
xant
hin
MFA
16:
1M
FA 1
8:1
MFA
20:
1Magnesium
Tota
l mon
ouns
atur
ated
fatty
aci
dsMoisture
Niacin
PFA
18:
2P
FA 1
8:3
PFA
20:
4P
FA 2
2:5
PFA
22:
6To
tal p
olyu
nsat
urat
ed fa
tty a
cids
Phosphorus
Potassium
Protein
Retinol
SFA
4:0
SFA
6:0
SFA
8:0
SFA
10:
0S
FA 1
2:0
SFA
14:
0S
FA 1
6:0
SFA
18:
0Selenium
Tota
l sat
urat
ed fa
tty a
cids
Tota
l sug
ars
Tota
l fat
Theobromine
Vita
min
A, R
AE
Thiamin
Vita
min
B12
Riboflavin
Vita
min
B6
Vita
min
CV
itam
in K
Zinc
No
Sal
tO
rdin
ary
Sal
ta-Carotene
Vita
min
B12
, ser
umtrans-b-carotene
cis-b-carotene
b-cryptoxanthin
Fola
te, s
erum
g-tocopherol
Iron,
Fro
zen
Ser
umC
ombi
ned
Lute
in/z
eaxa
nthi
ntrans-lycopene
Fola
te, R
BC
Ret
inyl
pal
mita
teR
etin
yl s
tear
ate
Retinol
Vita
min
Da-Tocopherol
Daidzein
o-Desmethylangolensin
Equol
Enterodiol
Enterolactone
Genistein
Est
imat
ed V
O2m
axP
hysi
cal A
ctiv
ityD
oes
anyo
ne s
mok
e in
hom
e?To
tal #
of c
igar
ette
s sm
oked
in h
ome
Cotinine
Cur
rent
Cig
aret
te S
mok
er?
Age
last
sm
oked
cig
aret
tes
regu
larly
# ci
gare
ttes
smok
ed p
er d
ay w
hen
quit
# ci
gare
ttes
smok
ed p
er d
ay n
ow#
days
sm
oked
cig
s du
ring
past
30
days
Avg
# c
igar
ette
s/da
y du
ring
past
30
days
Sm
oked
at l
east
100
cig
aret
tes
in li
feD
o yo
u no
w s
mok
e ci
gare
ttes.
..nu
mbe
r of d
ays
sinc
e qu
itU
sed
snuf
f at l
east
20
times
in li
fedr
ink
5 in
a d
aydr
ink
per d
ayda
ys 5
drin
ks in
yea
rda
ys d
rink
in y
ear
3-fluorene
2-fluorene
3-phenanthrene
1-phenanthrene
2-phenanthrene
1-pyrene
3-be
nzo[
c] p
hena
nthr
ene
3-be
nz[a
] ant
hrac
ene
Mon
o-n-
buty
l pht
hala
teM
ono-
pht
hala
teM
ono-
cycl
ohex
yl p
htha
late
Mon
o-et
hyl p
htha
late
Mon
o- p
htha
late
Mon
o--h
exyl
pht
hala
teM
ono-
isob
utyl
pht
hala
teM
ono-
n-m
ethy
l pht
hala
teM
ono-
pht
hala
teM
ono-
benz
yl p
htha
late
Cadmium
Lead
Mer
cury
, tot
alB
ariu
m, u
rine
Cad
miu
m, u
rine
Cob
alt,
urin
eC
esiu
m, u
rine
Mer
cury
, urin
eIo
dine
, urin
eM
olyb
denu
m, u
rine
Lead
, urin
eP
latin
um, u
rine
Ant
imon
y, u
rine
Thal
lium
, urin
eTu
ngst
en, u
rine
Ura
nium
, urin
eB
lood
Ben
zene
Blo
od E
thyl
benz
ene
Blo
od o
-Xyl
ene
Blo
od S
tyre
neB
lood
Tric
hlor
oeth
ene
Blo
od T
olue
neB
lood
m-/p
-Xyl
ene
1,2,3,7,8-pncdd
1,2,3,7,8,9-hxcdd
1,2,3,4,6,7,8-hpcdd
1,2,3,4,6,7,8,9-ocdd
2,3,7,8-tcdd
Beta-hexachlorocyclohexane
Gamma-hexachlorocyclohexane
Hexachlorobenzene
Hep
tach
lor E
poxi
deMirex
Oxychlordane
p,p-DDE
Trans-nonachlor
2,5-
dich
loro
phen
ol re
sult
2,4,
6-tri
chlo
roph
enol
resu
ltPentachlorophenol
Dimethylphosphate
Diethylphosphate
Dimethylthiophosphate
PCB66
PCB74
PCB99
PCB105
PCB118
PC
B13
8 &
158
PCB146
PCB153
PCB156
PCB157
PCB167
PCB170
PCB172
PCB177
PCB178
PCB180
PCB183
PCB187
3,3,4,4,5,5-hxcb
3,3,4,4,5-pncb
3,4,4,5-tcb
Per
fluor
ohep
tano
ic a
cid
Per
fluor
ohex
ane
sulfo
nic
acid
Per
fluor
onon
anoi
c ac
idP
erflu
oroo
ctan
oic
acid
Per
fluor
ooct
ane
sulfo
nic
acid
Per
fluor
ooct
ane
sulfo
nam
ide
2,3,7,8-tcdf
1,2,3,7,8-pncdf
2,3,4,7,8-pncdf
1,2,3,4,7,8-hxcdf
1,2,3,6,7,8-hxcdf
1,2,3,7,8,9-hxcdf
2,3,4,6,7,8-hxcdf
1,2,3,4,6,7,8-hpcdf
Measles
Toxoplasma
Hep
atiti
s A
Ant
ibod
yH
epat
itis
B c
ore
antib
ody
Hep
atiti
s B
Sur
face
Ant
ibod
yH
erpe
s II
Albumin, urineUric acidPhosphorusOsmolalitySodiumPotassiumCreatinineChlorideTotal calciumBicarbonateBlood urea nitrogenTotal proteinTotal bilirubinLactate dehydrogenase LDHGamma glutamyl transferaseGlobulinAlanine aminotransferase ALTAspartate aminotransferase ASTAlkaline phosphotaseAlbuminMethylmalonic acidPSA. totalProstate specific antigen ratioTIBC, Frozen SerumRed cell distribution widthRed blood cell countPlatelet count SISegmented neutrophils percentMean platelet volumeMean cell volumeMean cell hemoglobinMCHCHemoglobinHematocritFerritinProtoporphyrinTransferrin saturationWhite blood cell countMonocyte percentLymphocyte percentEosinophils percentC-reactive proteinSegmented neutrophils numberMonocyte numberLymphocyte numberEosinophils numberBasophils numbermean systolicmean diastolic60 sec. pulse:60 sec HRTotal CholesterolTriglyceridesGlucose, serumInsulinHomocysteineGlucose, plasmaGlycohemoglobinC-peptide: SILDL-cholesterolDirect HDL-CholesterolBone alkaline phosphotaseTrunk FatLumber Pelvis BMDLumber Spine BMDHead BMDTrunk Lean excl BMCTotal Lean excl BMCTotal FatTotal BMDWeightWaist CircumferenceTriceps SkinfoldThigh CircumferenceSubscapular SkinfoldRecumbent LengthUpper Leg LengthStanding HeightHead CircumferenceMaximal Calf CircumferenceBody Mass Index
-0.4 -0.2 0 0.2 0.4
Value
050
100
150
Color Keyand Histogram
Count
http://bit.ly.com/pemap
phen
otyp
es
exposures
+- EWAS-derived phenotype-exposure association map: A 2-D view of 86 phenotype by 252 exposure associations

TriglyceridesTotal CholesterolLDL-cholesterol
Trunk FatAlbumin, urine
InsulinTotal Fat
Head CircumferenceBlood urea nitrogen
AlbuminHomocysteineC-peptide: SI
C-reactive proteinBody Mass Index
FerritinThigh Circumference
Maximal Calf CircumferenceDirect HDL-Cholesterol
Total calciumTotal bilirubin
Red cell distribution widthGamma glutamyl transferase
Mean cell volumeMean cell hemoglobinWhite blood cell count
Uric acidProtoporphyrinHemoglobinTotal protein
Alkaline phosphotaseWaist Circumference
HematocritWeight
Standing Height1/CreatinineCreatinine
Trunk Lean excl BMCMethylmalonic acid
Triceps SkinfoldLymphocyte number
Subscapular SkinfoldTotal Lean excl BMC
Segmented neutrophils numberLactate dehydrogenase LDH
Bone alkaline phosphotaseTIBC, Frozen Serum
Aspartate aminotransferase ASTPhosphorus
Lumber Pelvis BMDGlycohemoglobin
GlobulinChloride
BicarbonateAlanine aminotransferase ALT
60 sec. pulse:Upper Leg Length
Total BMDPotassium
Glucose, serumGlucose, plasma
Red blood cell countLumber Spine BMD
Platelet count SIMCHC
OsmolalityMonocyte number
mean systolicLymphocyte percent
Segmented neutrophils percentRecumbent Length
Eosinophils numberMonocyte percent
Head BMDmean diastolic
Prostate specific antigen ratio60 sec HR
Basophils numberSodium
PSA, freeMean platelet volume
Eosinophils percentPSA. total
Basophils percent
0 10 20 30 40R^2 * 100
1 to 66 exposures identified for 81 phenotypes
Additive effect of E factors: Describe less than 10% of variability in P
(On average: 8%)
Stan Shaw, Hugues Aschard, JP Ioannidis
σ2E?
Exposome may enable realization of
remainder of P (>40%)
Recall: H2 <= 50%

What do we do now? Recommendations from the workgroup
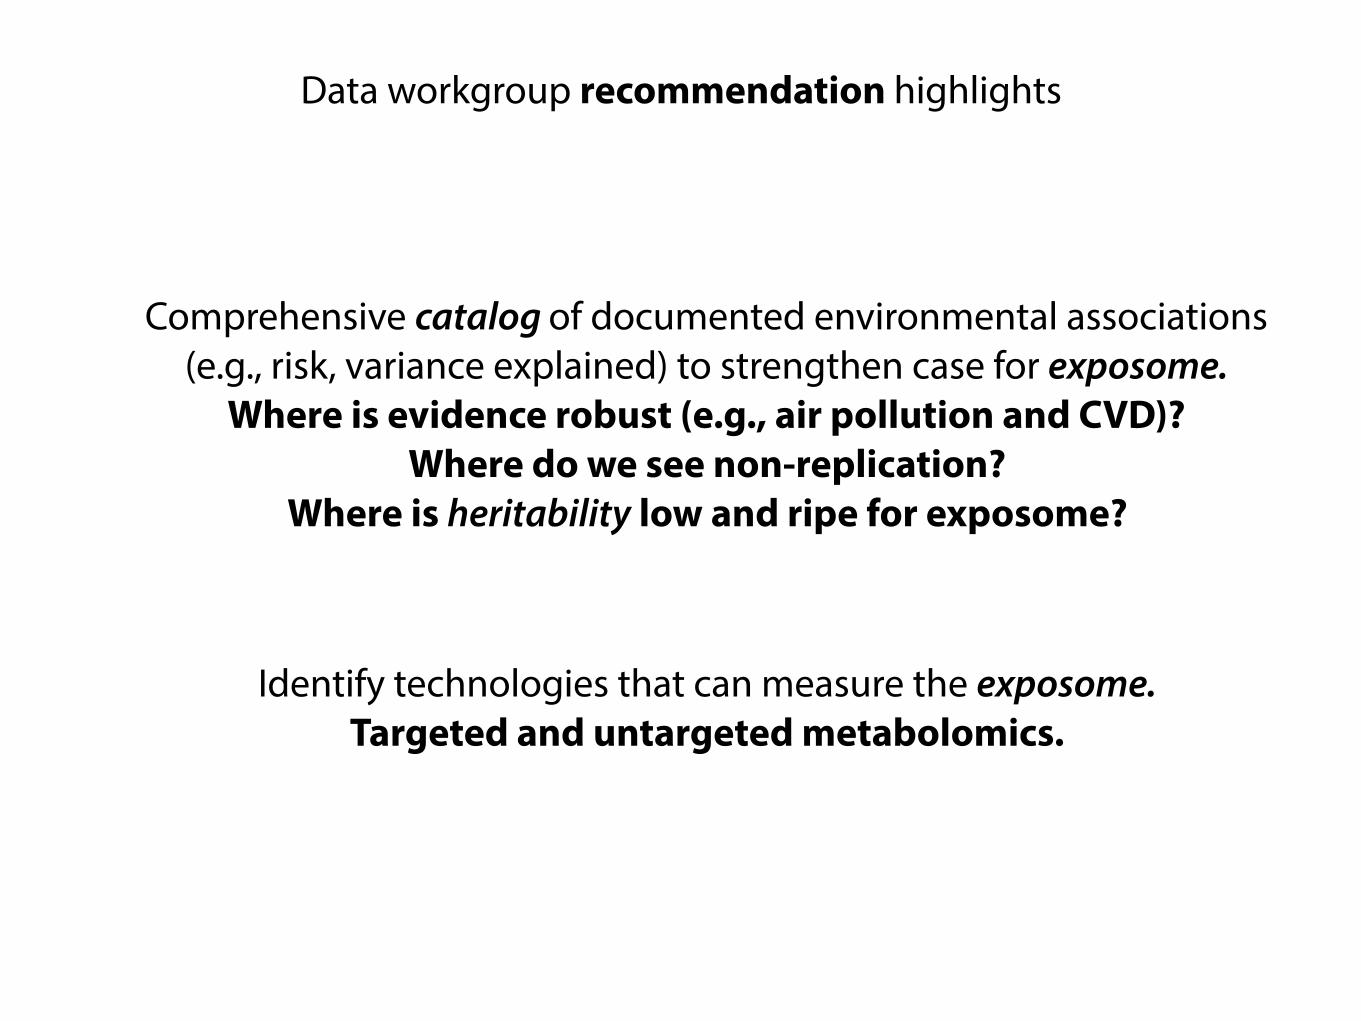
Data workgroup recommendation highlights
Comprehensive catalog of documented environmental associations (e.g., risk, variance explained) to strengthen case for exposome.
Where is evidence robust (e.g., air pollution and CVD)? Where do we see non-replication?
Where is heritability low and ripe for exposome?
Identify technologies that can measure the exposome. Targeted and untargeted metabolomics.

Develop high-throughput data analytic capability. Statistical methodologies for the 3D matrix!
Encourage a shift from 1 E to many Es. Link external and internal exposome measures.
Data workgroup recommendation highlights
time
exposome phenome
pollutants
diet
metabolites . . .
gut flora
height
weightCVD
BPT2D
cancer
xenobiotics . . .
indi
vidu
als
GWAS, RVAS, pathway analysis..etc.
EWAS, PheWAS..etc.
geno
me
(sta
tic)
mixtures of exposures
time
drugs
integrative
mixtures of phenotypes
(A) (C)
(B)
Develop data repositories to house and disseminate individual-level exposome data.
Assess the variability of the exposome in diverse populations

Data workgroup recommendation highlights
Identify data standards for exposome research. Develop data standards to enable the re-use of research to build
large exposome-rich cohorts.
Identify analytics standards for reproducible research. Software libraries and tools to share methods and findings.
Incentivize other parties (e.g., researchers, funders, and industry) to integrate the exposome in their existing programs.
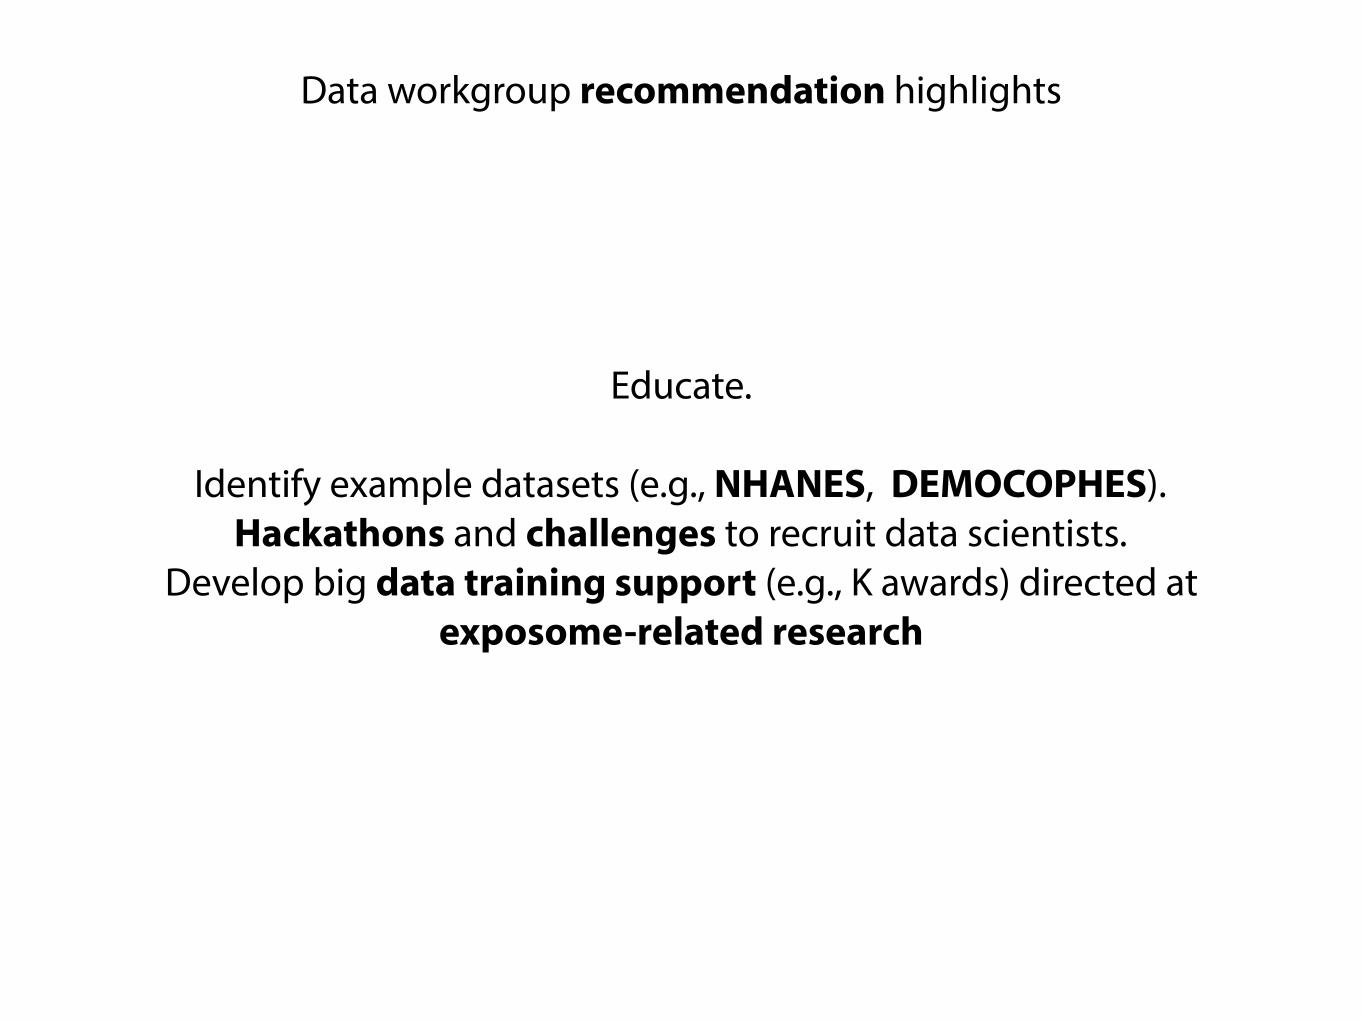
Data workgroup recommendation highlights
Educate.
Identify example datasets (e.g., NHANES, DEMOCOPHES). Hackathons and challenges to recruit data scientists.
Develop big data training support (e.g., K awards) directed at exposome-related research

google: “niehs chear”

Informatics will enable us to decipher the role of the emerging exposome in phenotypes to capture the missing σ2P
σ2P = σ2G + σ2E

Arjun Manrai (Harvard)* Yuxia Cui (NIEHS)
Pierre Bushel (NIEHS) Molly Hall (Penn State, now Penn)*
Spyros Karakitsios (Aristotle U, Greece) Carolyn Mattingly (NCSU)
Marylyn Ritchie (Geisinger/Penn State) Charles Schmitt (NIEHS)
Denis Sarigiannis (Aristotle U, Greece) Duncan Thomas (USC)
David Wishart (U Alberta, Canada) David Balshaw (NIEHS)
Thanks again to the group:
Funded in part by the NIEHS.
