inform decision making small capacity solarpowered
TRANSCRIPT

IOSR Journal of Mechanical and Civil Engineering (IOSRJMCE) eISSN: 2320–7388,pISSN: 2320–737X Volume 6, Issue 3 Ver. IV (May. Jun. 2016), PP 114126 www.iosrjournals.org
DOI: 10.9790/7388060304114126 www.iosrjournals.org 1 | Page
Small Capacity SolarPowered Desalination Units: Analysis to Inform Decision Making
A.M.K. ElGhonemyDepartment of Mechatronics Engineering, High Institute of Engineering and Textile Technology, Egypt
Abstract: The photovoltaic powered reverseosmosis system is one of the new technologies for producing fresh water from either brackish or seawater, especially small units for remote areas. The present paper is directed to study the performance and economics of a small scale brackish water desalination unit, using four types of power supply systems. These are: system1: PV modules, batteries, and inverter, system2: PV modules, batteries, inverter and diesel generator, system3: diesel generator, and system4: Local national grid electricity. The results showed that electrical energy costs are 0.46, 0.25, 0.1 $/KWh, for system1, system3, and system4 respectively. In addition, regarding economic and environmental benefits, the results proved that system1 can compete with system2, whenever the price of PV module is reduced down to 1$/Wp or less. Also, the unit cost of fresh water is found to be 3.12, 2.23, 1.787, and 1.382 $/m3 for system1, system2, system3, and system4 respectively.Keywords: Brackish Water, Reverse Osmosis, Photo Voltaic, Desalination, Economics
I. IntroductionDesalination systems with capacity up to 60 m3/day are considered as Small capacity. Reverse osmosis
(RO) is a desalination system uses a membrane. Advantages of RO are low energy requirements, modularity, compactness, easy installation, and simplicity in operation [1–8]. Consequently producing cheap fresh water is possible.
Solar photovoltaic water pumping (SPVWP) has been implemented around the world as an alternative electric energy source for remote Areas in developed countries [9–21]. Canada, Mexico, western US, and Australia are the biggest portion of the SPVWP system users [11].
Simulation and field tests for a photovoltaic powered water pumping system, employing an induction motor pump, has been developed by Daud, et. al. [18].The system average daily capacity was 50 m3 at 37 m head. The system was installed on a desert well in Jordan based on the average solar radiation amount =5.5kWh/m2/day.
A small case study for application of solar powered pump to a deep well in Zambia was analyzed by Romas, J. S. [19]. The case was to supply 10 families with a consumption of 100L/day each. The well depth was 100m. They concluded that, the water cost is 1.07£/m3 and investment cost is 3019£. The pump power is154W, and solar array of 195WP is necessary. Also, as indicated to make the presizing process is easier, the following figures are important:1. The necessary PV power for each m3/day of water pumping is 195WP/m3.2. The PV power for each watt of pump power installed is 195/154 = 1.27WP/WLoad.3. The power of water pump needed per m3 is 154WLoad / m3.
Finally, they mentioned that PV pumping is the best economic solution compared to diesel generators or the extending electric grid.
Other figures for sizing the PV pumping system were reported by Alawaji et. al. [15]. It was concluded that, based on 600L/h at 50 m head using submersible pump motor of 0.55 KW, the following components are necessary: 16 PV modules, each of 70WP (1120WP) with control unit of 1500W, variable voltage and frequency and soft starter of 12.5A DC at120VDC.
From practice, PV pumping system is more economic and reliable than diesel pumping system for areas of average solar intensity higher than 5kW/m2/day (under the condition of water requirements are lower than 100m3/day and depths of 1560 m) [18,19].
Different capacities of solar pumps are available in the market (flow rates up to11m3/h and head up to 240m) [21]. For example, to lift water from depths exceeding 65m at 5.7l/min, power required is less than 150W. In sunny day (10h of sunrise) it can lift 3400 Liter which is enough for several families. The power source from PV can be connected to the pump motor directly or using either DC/DC inverter or DC/AC inverter.[21].
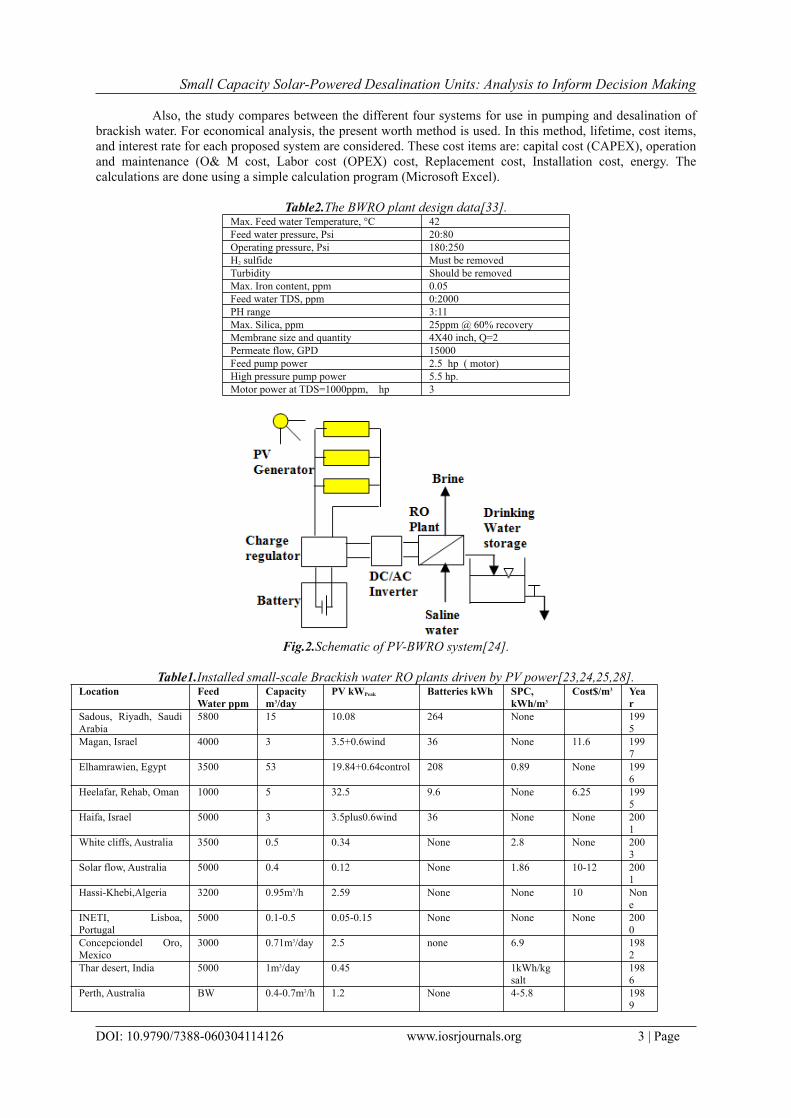
A summary of Installed BWRO plants driven by PV power is given in table (1). Also, the main components of PVBWRO are shown in fig.(2).

Small Capacity SolarPowered Desalination Units: Analysis to Inform Decision Making
DOI: 10.9790/7388060304114126 www.iosrjournals.org 2 | Page
The present paper is directed to study the performance and economics of a small scale Brackish water pumping and desalination units, using the following four types of power supply systems as shown in figures (2a, b, c and d): System1: PV array, batteries, and inverter System2: PV array, batteries, inverter and diesel generator System3: diesel generator System4: Local national grid electricity.
Fig.(1a). Block diagram forSystem1.
Fig.(1b). Block diagram forSystem2.
Fig.(1c). Block diagram for System3.
Fig.(1d). Block diagram for System4.
Small Capacity SolarPowered Desalination Units: Analysis to Inform Decision Making
DOI: 10.9790/7388060304114126 www.iosrjournals.org 3 | Page
Also, the study compares between the different four systems for use in pumping and desalination of brackish water. For economical analysis, the present worth method is used. In this method, lifetime, cost items, and interest rate for each proposed system are considered. These cost items are: capital cost (CAPEX), operation and maintenance (O& M cost, Labor cost (OPEX) cost, Replacement cost, Installation cost, energy. The calculations are done using a simple calculation program (Microsoft Excel).
Table2.The BWRO plant design data[33].Max. Feed water Temperature, °C 42Feed water pressure, Psi 20:80Operating pressure, Psi 180:250H2 sulfide Must be removedTurbidity Should be removedMax. Iron content, ppm 0.05Feed water TDS, ppm 0:2000PH range 3:11Max. Silica, ppm 25ppm @ 60% recoveryMembrane size and quantity 4X40 inch, Q=2Permeate flow, GPD 15000Feed pump power 2.5 hp ( motor)High pressure pump power 5.5 hp.Motor power at TDS=1000ppm, hp 3
Fig.2.Schematic of PVBWRO system[24].
Table1.Installed smallscale Brackish water RO plants driven by PV power[23,24,25,28].Location Feed
Water ppmCapacity m3/day
PV kWPeak Batteries kWh SPC, kWh/m3
Cost$/m3 Year
Sadous, Riyadh, Saudi Arabia
5800 15 10.08 264 None 1995
Magan, Israel 4000 3 3.5+0.6wind 36 None 11.6 1997
Elhamrawien, Egypt 3500 53 19.84+0.64control 208 0.89 None 1996
Heelafar, Rehab, Oman 1000 5 32.5 9.6 None 6.25 1995
Haifa, Israel 5000 3 3.5plus0.6wind 36 None None 2001
White cliffs, Australia 3500 0.5 0.34 None 2.8 None 2003
Solar flow, Australia 5000 0.4 0.12 None 1.86 1012 2001
HassiKhebi,Algeria 3200 0.95m3/h 2.59 None None 10 None
INETI, Lisboa, Portugal
5000 0.10.5 0.050.15 None None None 2000
Concepciondel Oro, Mexico
3000 0.71m3/day 2.5 none 6.9 1982
Thar desert, India 5000 1m3/day 0.45 1kWh/kg salt
1986
Perth, Australia BW 0.40.7m3/h 1.2 None 45.8 1989
Small Capacity SolarPowered Desalination Units: Analysis to Inform Decision Making
DOI: 10.9790/7388060304114126 www.iosrjournals.org 4 | Page
Gillen Bore, Australia 1600 1.2 4.16 None 1996
Wano Road, Australia BW 6Kasir Ghilen, Tunis 5700 50 7.25 200
6CoitePedreias, Brazel BW 0.25 1.1 9.6 34.7 14.9Mesquite, Nevada 3500 1.5 0.4 1.38 3.6 200
3North of Jawa, Indonesia
BW 12m3/day 25.5 2008
Eritrea BW 3m3/day 2.4 2004
Ksar Ghilène, Tunis 3500 42m3/day,2.1m3/h
10 72(600AhX120VDC)
2006
Gaza, Palestine 4200 15 5.4(9x600W) 1.4 67 2006
4000 5m3/day 3 11.7 1.44 3.98 2010
University of Almeria, Almeria, Spain
BW 2.5m3/h 23.5
II. RO System SelectionBased on the water analysis, the right RO system can be selected. Then system components can be
defined (prefiltration, the type, number, and configuration of membranes, pumps and motors). Table (2) shows the specifications of the BWRO unit which is considered under the study[33].
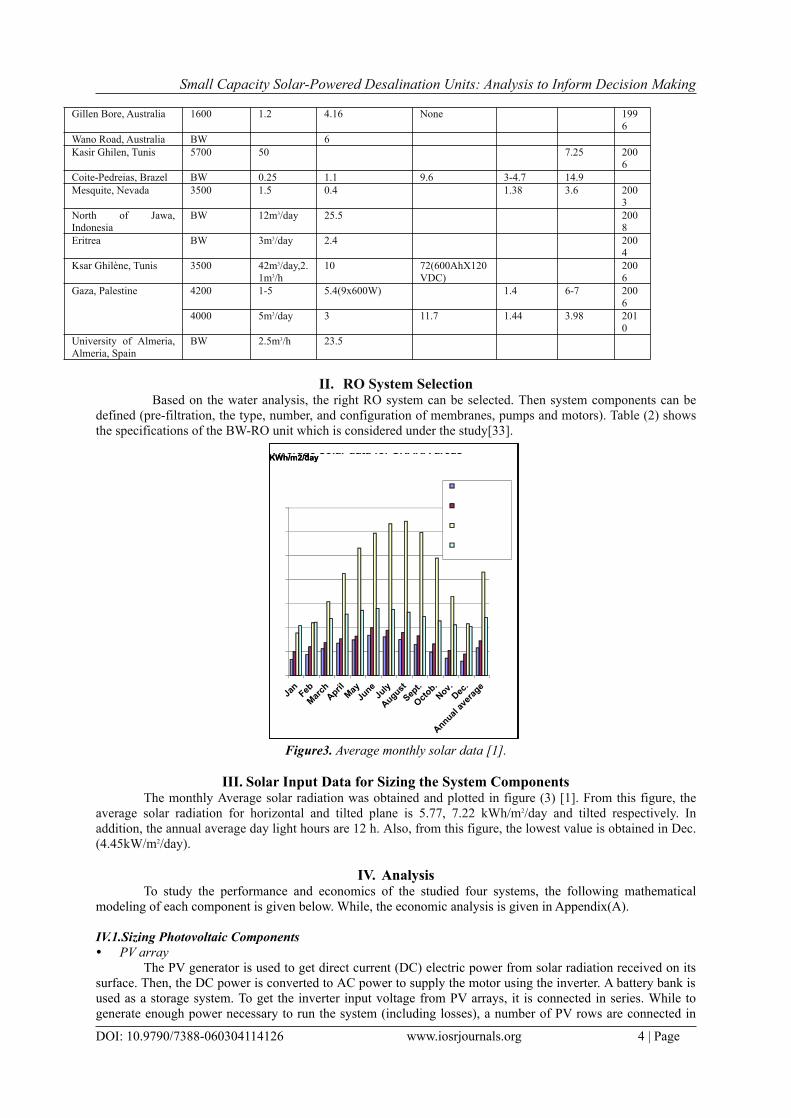
05101520253035 Month Average solar data for SKAKA areas H hori,KWh/m2/dayH tilted,KWh/m2/dayTa, CPSSH, hrs
Figure3. Average monthly solar data [1].
III. Solar Input Data for Sizing the System ComponentsThe monthly Average solar radiation was obtained and plotted in figure (3) [1]. From this figure, the
average solar radiation for horizontal and tilted plane is 5.77, 7.22 kWh/m2/day and tilted respectively. In addition, the annual average day light hours are 12 h. Also, from this figure, the lowest value is obtained in Dec. (4.45kW/m2/day).
IV. AnalysisTo study the performance and economics of the studied four systems, the following mathematical
modeling of each component is given below. While, the economic analysis is given in Appendix(A).
IV.1.Sizing Photovoltaic Components PV array
The PV generator is used to get direct current (DC) electric power from solar radiation received on its surface. Then, the DC power is converted to AC power to supply the motor using the inverter. A battery bank is used as a storage system. To get the inverter input voltage from PV arrays, it is connected in series. While to generate enough power necessary to run the system (including losses), a number of PV rows are connected in
Small Capacity SolarPowered Desalination Units: Analysis to Inform Decision Making
DOI: 10.9790/7388060304114126 www.iosrjournals.org 5 | Page
parallel.Assuming the inverter efficiency (ηinv = 90%), the battery efficiency (ηb=85%) and the PV array thermal losses in the local environment about15% (Fth = 0.85), the PV array Peak power equation is given[27];PV array Peak power= (1)where: PSSH is the average peak sun shine hours., EL is the load energy in kWh/day. Batteries capacity:The battery bank is selected to operate the system for one day. The power of battery bank is calculated as follows[22]: (2)Where DOD is a battery maximum depth of discharge (50%).Considering that 24V is the voltage output from the battery, the required battery bank capacity inAmpere hour(Ah) = Battery capacity1000/24 (3) The inverterTo convert from DC power to AC power, the inverter is used. The inverter is sized based on the peak power of the PV array, and its input and output voltages must be suitable for the operation of the battery and ROunit. Batteries chargerCharge controller acts as interface between PV array and the batteries. Considering the controller efficiency, the charger output is: (4)Where, PPVR : is the output power of the charger,PPVout: is the PV output power, andηPVR: is efficiency of the controller.The rating of charge controller is chosen according to the battery voltage and the output power from PVarray.
IV.2. Calculations of Pumping Power ConsumptionThe ideal hydraulic power to drive a pump depends on the mass flow rate, the liquid density and the
differential height – either it is the static lift from one height to another, or the friction head loss component of the system can be calculated as follows[10]:Ph=Qρgh/(3.6106) (5)Where
Ph=Hydraulic power(kW)Q=Flow capacity(m3/h)ρ=Density of fluid(kg/m3)g=Gravity(9.81m/s2)h=Differential head(m)
The shaft power is the power transferred from the motor to the shaft of the pump, which depends on the efficiency of the pump and can be calculated as:Ps=Ph/η (6)Where, η is the overall pump efficiency, which is taken equal to 0.6 during the present study.Hence, the specific power consumption can be expressed as: (7)where,is the total electric power consumed by feed and high pressure pumps, kandis the permeate flow rate at outlet from RO membranes unit,m3/h.
IV.3. Stage Recovery Calculations for RO Passes (R%)Recoveryistheratioofpermeatetomembranefeedflows,typicallyexpressedasapercentage. (8)Where,is the permeate flow rate at out let from RO membranes unit, m3/h, andis the feed flow rate at inlet to RO membranes unit, m3/h.
IV.4.Diesel GeneratorAn approximation for fuel consumption relation with rated power of the diesel generator and the actual
power provided by this diesel generator is given below[40].
(9)Where F: is fuel consumption (Liter/h),PGout: is the actual operating output power(kW),PGr: is the rated electric power of diesel generator(kW),

Small Capacity SolarPowered Desalination Units: Analysis to Inform Decision Making
DOI: 10.9790/7388060304114126 www.iosrjournals.org 6 | Page
0.246: is an empirical factor and it is in (liters/kWh), and0.08415: is also an empirical factor and it is in (liters/kWh).
IV.5. RO Product Cost CalculationsThe RO cost data includes the following [28]: Direct capital cost (DCC) in US$ Membrane purchase cost(@60%DC) Membrane annual replacement cost(@10% of Membrane purchase cost. Plant capacity (m) = m3/day Electric cost (c) = $/m3
Specific consumption of electric power(w)=kWh/m3
Specific cost of operating labor(L)=$/m3
Specific chemicals cost (k) = $/m3
The calculations proceed as follows:1. The amortization factor, a:
$/year2. The annual fixed charges, A1:
A1=(a)(C)3. The annual electric power cost, A2:
A2=(c)(w)(f)(m)(365)$/year4. The annual chemicals cost, A3:
A3= (k) (f) (m) (365) = $/year5. The annual membrane replacement cost, A4:
A4 = $/year6. The annual labor cost, A5:
A5= (i) (f) (m) (365) = $/year7. The total annual cost, At:
At =A1+A2+A3+A4+A5 $/year8. The unit product cost per m3, As :
As= At / ((f) (m) (365)) = $/m3 (10)
V. AssumptionsThe following values which are applicable for the present application are used as input data for
studying the proposed four systems [55, 56, and 57]:
PV system components The sizes of the PV system components (arrays, batteries and inverter) are estimated using the peak sun hour method and solar energy availability for the specified site. The average daily solar radiation of 5.77 kWh/m2/day was used [13].
PV array: Polycrystalline Ppeak = 250W, Vpeak = 30V, Ipeak = 8.33 A, VOC = 36V, ISC=10A. The efficiency factors of losses in battery and inverter are estimated to be 0.8 and 0.85, respectively. Investment cost (I.C) of PV arrays is5$/WP. Installation cost PV arrays is16% of its I.C. Operation and maintenance cost of PV is 3% of its IC, annually. Life time of PVarraysis20years. Batteries Investment cost(I.C) is 250 $/kWh. Battery O&M cost is 3% of its I.C, annually. Battery replacement cost=I.C Battery lifetime is10years. Inverter I.C of Inverter is 500$/KWP. I.C of charger is 400$/KWP.
Diesel Generators cost data[31,32]:

Small Capacity SolarPowered Desalination Units: Analysis to Inform Decision Making
DOI: 10.9790/7388060304114126 www.iosrjournals.org 7 | Page
Investment cost(I.C), $/KW:500 Installation cost is 6% of its I.C. Specific fuel consumption of 0.41 Liter/kWh Lifetime is 3 years Annual usage: 8322h (95% availability) Annual maintenance and operating cost: 500$/kW Top overall maintenance cost is15% of I.C., annually. Salvage value is 1000$(revenue at end of lifetime). Local Fuel cost is 0.3SR/Liter=0.081$/Liter. Amount of CO2 produced=2.4:2.8 kgCO2/ Liter fuel.
VI. Economic Analysis [37,38]The present calculations are based on the present worth values of capital, maintenance, repair and
energy. The repair and replacement costs include the costs of replacing solar batteries every five years. Equipment prices were obtained from suppliers. The expected lifetime of PV panels is 20years. The interest rate and the inflation rate is considered as 10 and 4% respectively .An exchange rate of 3.7 was used to convert the costs in local currency to US$. More details for economic analysis are given in Appendix(A).
VII. Solution TechniqueAll calculations were performed using the above mentioned equations and assumptions. Technical and
economic results are obtained using Microsoft Excel program.
VIII. Results and DiscussionsVIII.1. Electricity Generated Using PV System
Based on solar radiation data shown in fig.(4) and assuming the PV array conversion efficiency of 15%, The estimated average electricity can be obtained as plotted in fig.(4).
012345678910 Month H tilted, KWh/m2/dayElectricity generated KWh/m2/day
Figure4. Estimated average monthly electricity production at 15% conversion efficiency of PV system.
VIII.2. The Load Demand for Pumping and Desalination Systema. For pumping the underground Brackish water from the well, the calculated power consumption is 2kW
against flow of 4m3/h at 100m head.b. For the selected BWRO desalination unit, to produce permeate flow of 2.5m3/h at max TDS of 2000ppm,

Small Capacity SolarPowered Desalination Units: Analysis to Inform Decision Making
DOI: 10.9790/7388060304114126 www.iosrjournals.org 8 | Page
the total power required is 10kW (peak load).
VIII.3. Sizing Results for System Components PV Generator
1. Assuming the system will operate 7hrs daily, the pumping load energy (EL) = 72 =14kWh/day. Similarly, for BWRO unit= 710 =70 kWh/day.
2. Peak power of PV array=EL/70.850.850.9. Hence the PV array peak power =3.2 and 15.3 kW for pumping and desalination respectively.
3. If PV arrays of the monocrystalline silicon type are selected each of 250 W peak power, then:a. Number of modules in each parallel string =3200/250=13 and 15300/250=62 modules are required for
pumping and desalination respectively.b. Number of modules in each series string (according to the required battery voltage) =1 , as VPVmodule at max.
power point =30V.c. Hence the total number of PV modules =ab=(14+62)1=76.
Fig.5. Sizing results for components of Solar PV system.
Noting that, it is preferable to make the PV array voltage higher than battery voltage and to use a max. power point charge controller. In this case, the number of solar panels in each string = 2 to get 60V. Then the total number of modules is doubled.
Batteries sizing results:1. Batteries capacity for pumping =14KWh/0.50.850.9=37kWh, similarly for desalination =183kWh.2. Considering that 24V voltage output is required from the battery bank, the required AH is 1542 and
7625AH for pumping and desalination respectively.By selecting 12v@1766AH battery, then a batteries bank of 2 battery (212=24V) is required for pumping, and additional 52=10 batteries for desalination.
3. The suitable battery charge controller for this system is selected to be able to handle the short circuit current of the PV array. Thus, it is selected with the specification of 60V and 24V at input and output respectively,18.5kW.
4. The selected inverter has the specifications of 24V/220Vsingle phase,18kW.A summary of sizing results is shown in fig.(5).

Small Capacity SolarPowered Desalination Units: Analysis to Inform Decision Making
DOI: 10.9790/7388060304114126 www.iosrjournals.org 9 | Page
Fig.6. Electricity and Water prices for the studied four systems (note: electricity price for system2 is not included in the figure as it is hybrid).
VIII.4. Energy CostAs depicted in fig.(6), the electrical energy costs are 0.46, 0.25, 0.1$/kWh, for PV system (system1), Diesel generator (system3), and local national grid (system4) respectively. As shown, electricity price from national grid is the lowest one, because of promotion from the government. Also, the price from Diesel generator is lower than PV system, due to the lower local price of fuel.
Now considering the fact that the future of PV system is promising, consequently, the price is expected to be decreased more and more. So, the prices from system1 was recalculated and plotted at different prices of PV arrays, as shown in fig.(7).
0.10.20.30.40.50246 Elctricity cost $ / KWh PV price $ / Wp
Fig.7. PV system electricity unit cost($/kWh),at different prices of PV modules. It is clear from Fig.(7) that, The PVsystem can compete with Diesel generator, whenever the PV
array price is reduced down to 1$/WP or less. This will reflects very good economic and environmental benefits of using the PV system.
VIII.5.Water Production Cost For PV unit (System1), the calculations are based on 7h/day operation, so the BWRO capacity is reduced
from50m3/day down to onethird of this value. For hybrid unit (system2), the BWRO unit will give its full capacity of 50 m3/day. Where, the PV unit will
operate to give onethird of capacity, while the diesel generator will operate to give the other twothird of capacity. Based on this, looking in figure (6), the unit cost of fresh water is 3.12, 2.23, 1.787, and 1.382 $/m3 for system1, system2, system3, andsystem4 respectively.
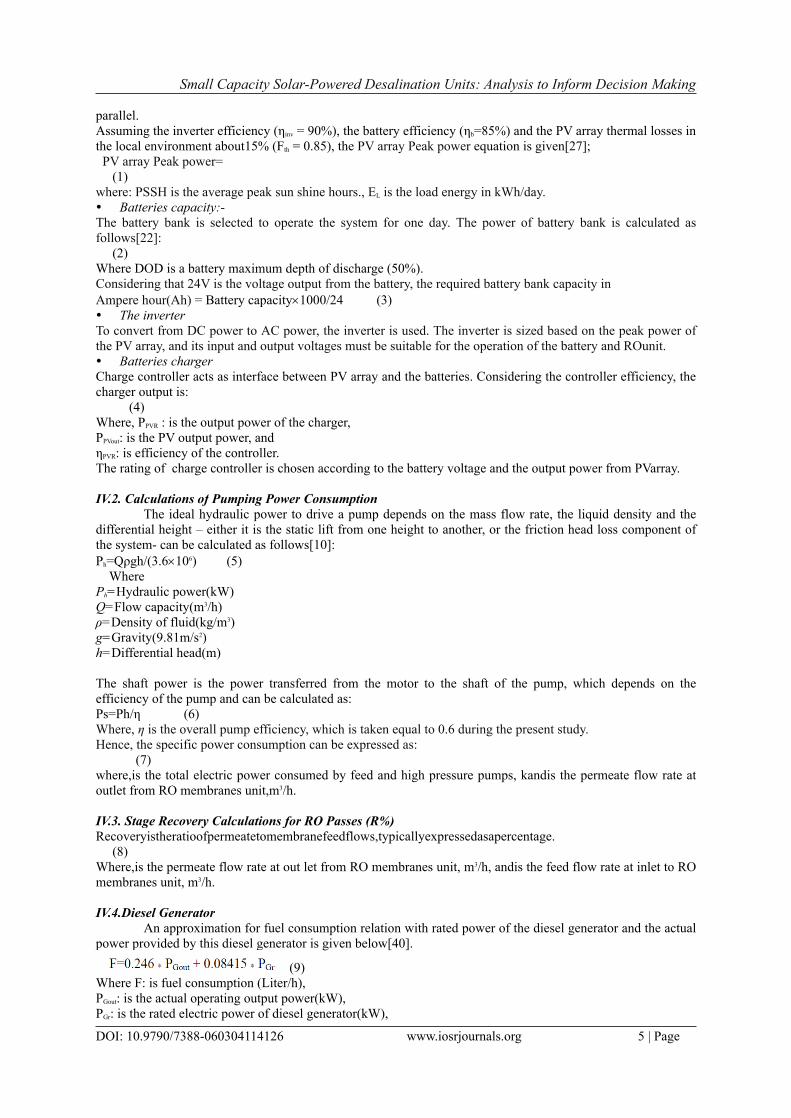
Similarly, the product water cost using system1 was recalculated and plotted at different prices of PV arrays, as shown in fig.(8).
Small Capacity SolarPowered Desalination Units: Analysis to Inform Decision Making
DOI: 10.9790/7388060304114126 www.iosrjournals.org 10 | Page
Fig.8.Water production cost using system1,at different prices of PV arrays.
VIII.6. Environmental Benefits of Using PVOperated BWRO SystemThe estimated annual reduction in Green house gases (GHG) represented by kg CO2 is 100% (zero
emission) , 32,223, 96,768 using system1, 2, and 3 respectively. It is clear that a significant reduction is achieved using either of system1 or system2.
VX. Reject Water ManagementReject water is by product of RO desalination plant. It has higher salts Concentration than that of feed water. So, this reject Water needs to be disposed properly to avoid contamination and disturbance for the ecosystem. Consequently, disposal of concentrate is one of the important factors to be considered in cost estimation. Recently, environmental regulations for disposal of concentrate have to be followed.A summary of reject water disposal method is given in Table (3)
Table3.Methods of reject water disposal in USA out of 137 plants with capacity of 98 m3/day or more.[4,30].Method of disposal %Surface water 48Discharged to waste water treatment plant
23
Land application 13Deep well injection 10Evaporation ponds 6
VY. ConclusionsThe performance and economics of a small scale Brackish water pumping and desalination units has
been estimated to compare between the studied four types of power supply systems. It is concluded that:1. Electrical energy costs are 0.46, 0.25, 0.1 $/kWh, for PV system (system1), Diesel generator (system3) ,
and local national grid (system4) respectively. In addition, whenever the PV array price is reduced down to 1$/WP or less, this reflects good economic and environmental benefits of using the PV system.
2. The unit cost of fresh water is 3.12, 2.23, 1.787, and 1.382 $/m3 for system1, system2, system3, and system4 respectively.
3. Common methods for RO reject water disposal are mentioned.
NomenclatureACT Total Annual CostART Total Annual RevenueaSi AmorphousSiliconBOS Balance of SystemCI(G)S Copper Indium (Gallium) DiselenideCOE Cost of EnergyDC Direct currentDOD Depth of DischargeELT Total load EnergyEPBT Energy Pay Back TimeF FuelISC Short Circuit CurrentkVAR Kilo Volt Ampere ReactivekWh Kilo Watt HourLCC Life Cycle CostMPPT Maximum Power Point

Small Capacity SolarPowered Desalination Units: Analysis to Inform Decision Making
DOI: 10.9790/7388060304114126 www.iosrjournals.org 11 | Page
NOCT Normal Operating Cell TemperatureNPV Net Present ValueO&M Operation and maintenanceppm Parts per million(milli gram per liter)PSH Peak Sun HourPV Photovoltaic(PVRO) photovoltaicpowered reverse osmosis systemPWF Present Worth FactorPWFC Cumulative Present Worth FactorPWV Present Worth ValueSCSi Single Crystalline SiliconSOC State of ChargeSOD Self of DischargeSPC Specific power consumption, kWh/m3
TDS Total dissolved solids contained in waterVOC Open Circuit VoltageWp Watt peakGreek Symbolsη efficiencySubscriptsb batteryGout Generator actual powerGr Generator rated powerinv inverterout outputP PeakPV PhotovoltaicPVR PV chargerPVout PV output powerth thermal
Appendix(A)Economic analysis of the system life cycle cost (LCC)[60].A.1. Present worth (PW) analysisThe present worth method converts all cash flows to a single sum equivalent at time zero using i= MARR over the planning horizon.(brings all cash flows back to “time zero” and add them up)
Wherei is the annual interest rate %: is the annual value at year n.A.2.Costs of System ComponentsCosts of a system include: components initial costs, components replacement costs, maintenance costs, fuel and operation costs, and salvage revenues. Initial costs include purchasing the following equipment required by the hybrid system: Costs of PV modulesThe PV module is characterized by its peak watt (Wp) at standard test conditions. Price of PV module depends mainly on its Wp and its type. For high rated power it can be considered about 5 ($/Wp) [www.affordablesolar.com].The values of installation costs depend mainly on the location of installation and mounting structures. For domestic applications, it can be considered about 16% of capital costs. PV maintenance costs are often collected in monthly payments for inspection by a maintenance technician. The PV panels are assumed to have life times of more than 20 years (no PV replacement costs during its lifetime). Costs of batteriesAny battery is characterized by its nominal voltage and its rated Ah capacity. The 2V cell block batteries are the most common ones in the hybrid systems. Their prices are higher than the prices of conventional ones, butt hey are characterized by their high cycling rate and capability to stand very deep discharge. The cost figures vary in the range (290250$/kWh) [www.affordablesolar.com]. Costs of diesel generatorsDiesel generator initial costs vary with size, model and design. For the range of power (10KW : 83 KW rated power), the cost can be considered about 500 ($/kW) [www.generatorjoe.net]. The installation cost can be considered about 6% of initial capital cost. Regular maintenance includes:
o Oil change which recommended to take place every 250 hour of operation.o Oil filter replacement which recommended to take place every 500 hour of operation.o Air filter replacement which recommended to take place every 3000 hour of operation.o Fuel filter replacement which recommended to take place every750 hour of operation.o Top Overhaul maintenance is recommended to take place every 6000 hour of operation.

Small Capacity SolarPowered Desalination Units: Analysis to Inform Decision Making
DOI: 10.9790/7388060304114126 www.iosrjournals.org 12 | Page
The diesel generator lifetime is expressed as a function of the operating hours. It varies between roughly 20000 to 30000 hours of run time. The amount of CO2 produced takes values in the range 2.42.8 kg CO2/L diesel fuel.A.3.Life Cycle Periods of Different ComponentsIn this analysis a typical value of 4% is considered for general inflation rate. Typical values of fuel inflation rate is 5%[34].The life cycle period of the system is: for the PV system = 20years. The life time of the diesel generator, a typical value of 24000 hour of operation is considered. The lifetime of the battery, a typical value of 10 years is considered as a lifetime of battery where a DOD is assumed to be 80%. The life times of the other components of the hybrid system such as inverter and charge controllers generally take values greater than 20years. Because the cost of each is small comparing to other components.
References[1] NASA Surface Meteorology and Solar Energy, 2004. Available from http://eosweb.larc.nasa.gov/sse/.[2] HOMER, 2004, The MicroPower Optimization Model. Software produced by NREL. Available at www.nrel/gov/HOMER.[3] Eltawil M.A, Zhengming Z., and Yuan.L., 2009, "A review of renewable energy technologies integrated with desalination
systems", Renewable and Sustainable Energy Review, Vol13, 2245–2262.[4] Kalogirou, S.A, 2005, "Sea water desalination using renewable energy sources" Progress in Energy and Combustion Science,
vol.31, 242–281.[5] Verdier, F., 2011 "MENA Regional Water Outlook, Part II Desalination Using Renewable Energy, Task1–Desalination
Potential" Fichtener, WWW.Fichtner.de.]6[ Desalination: A National Perspective, Committee on Advancing Desalination Technology, Water Science and Technology
Board, Division on Earth and Life Studies, National Research council of the national academies, 2008.[7] Boyle G., 2004, Renewable Energy, OXFORD University Press.[8] Iakovos T zanakis. Combining Wind and Solar Energy to Meet Demands in the Built Environment (report), Energy Systems
Research Unit. University of Strathclyde. 20052006.[9] BadrulH. Chowdhury, Sadrul Ula, Kirk Stokes, 1993 "PhotovoltaicPowered Water PupmingDesign and Implementation:
Case Studies inWyoming", IEEE Transactions on Energy Conversion,Vol.8, No.4,646652.[10] Mohamad Kordab, 2007 "Priority option of photovoltaic systems for water pumping in rural areas in ESCWA member
countries" Desalination, 209, 73–77.[11] Ali A. Hamza, AzmiZ. Taha, "Performance of Submersible PV Solar Pump 1995 system sunder conditions in the Sudan
",Renewable Energy,Vol.6,No.56,491495.[12] Pande P.C., Singh A.k., Vyas S.k., DaveB.K., "Design development and testing of solar PV pump based drip system for
orchads" Renewable Energy, Vol.28,No.3, (2003), 385396.[13] Saleh H. Alawaji, 2001 "Evaluation of solar energy research and its application in Saudi Arabia–20 years of experience,
Renewable & Sustainable Energy Reviews,Vol.5,5977.[14] Shafiqur Rehman, Maher A. Bader, SaidA. AlMoallem, 2007 "Cost of energy generated usingPV panels," Renewable &
Sustainable Energy Reviews,Vol.11,18431857.[15] Imtiaz Ashraf, A. Iqbal,Md. Amanur Rehman, A. Chandra, 2008"Multiobjective optimization of renewable energy systems
for pollution mitigation– A case study of Kavaratti Island, India ”International Journal of Sustainable Energy, 27: 4,165171 (Taylor and Francis, USA).
[16] KalaMeah, SadrulUla, Steven Barrett, 2008" Solar photovoltaic water pumping opportunities and challenges" Renewable and Sustainable Energy Reviews,Volume12,Issue4,11621175.
[17] Al Abbadi, N.M., Alawaji, S.H., BinMahfoodh, M.Y, Myers, D.R, and Anderberg, M., 2002 "Saudi Arabian solar radiation network operation data collection and quality assessment "Renewable Energy 25, 219–234.
[18] Daud, A.K. and Mahmoud, M.M., 2004 "Solar powered induction motordriven water pump operating on adesert well, simulation and field tests "Renewable Energy, 30(2005)701–714.
[19] Ramos, J and Ramos, H.M, 2009 "Solar powered pumps to supply water for rural or isolated zones: Acase study "Energy for Sustainable Development, 13, 151–158.
[20] Alawaji, A.D., Kutubkhanah , I.K, Wi, J.M., 2007 "A 13.3 MGD sea water RO desalination plant for Yanbu Industrial City" Desalination, vol. 203, 176–188.
[21] Lorentz, high efficiency solar water pumps data.[22] Hamidat, A, Benyoucef, B, 2009 "Systematic procedures for sizing photovoltaic pumping system, using water tank storage"
Energy Policy 37, 1489–1501.[23] A. Al KaraghouliandL. L.Kazmerski, 2011 "Renewable Energy Opportunities in Water Desalination" National Renewable
Energy Laboratory(NREL), Golden, Colorado, 80401, USA.[24] Mohammed Rabia Ahmed, 2006 "Potential Of Application Of PV System For BWRO Desalination In GAZA "Tenth
International Water Technology Conference, IWTC10, 210 Alexandria, Egypt.[25] AlKaraghouli, A. and Kazmerski, L.L., 2010 "Economic Analysis of a Brackish Water PhotovoltaicOperated (BWROPV)
Desalination System" National Renewable Energy Laboratory Golden, Colorado80401(USA).[26] Ahmad,G. and Schmid, J., 2002 "Feasibility study of brackish water desalination in the Egyptian deserts and rural regions
using PV systems "Energy Conversion and Management, 4, 2641–2649.[27] Thomson, A.M., 2003 "ReverseOsmosis Desalination of Sea water Powered by Photovoltaics Without Batteries" A Doctoral
Thesis, Lough borough University.[28] ElDessouki, H.T. and Ettouney, H.M., 2002 "Fundamentals of Salt Water Desalination", Elsevier Science B.V.[29] Sako,K.M.,Guessan,Y.N.,Diango,A.K.,Sangare,K.M.,2011"Comparative economic analysis of photovoltaic, diesel generator
and grid extension in Cote Divoire "Asian Journal of Applied Science, 4 (8): 787793.

Small Capacity SolarPowered Desalination Units: Analysis to Inform Decision Making
DOI: 10.9790/7388060304114126 www.iosrjournals.org 13 | Page
[30] P.Poovanaesvaran, M.A. Alghoul,K. Sopian, N. Amin, M.I.F adhel, M. Yahya, 2011 "Design aspects of smallscale photovoltaic brackish water reverse osmosis (PVBWRO) system "Desalination and Water Treatment Vol.27, 210–223.
[31] Desalination Units powered by Renewable Energy Systems, Opportunities and Challenges, 2005" Organized by INRGREF, Proceedings of the International Seminar held in Hammamet, Tunisia.
[32] Solarbuzz LLC, August 2008. Solar Energy Electricity Prices Report. Available from www.solarbuzz.com.[33] Pure Aqua for water treatment and reverse osmosis company, www.pureaqua.com.[34] EPPSWRO desalination plant operation manual.[35] Khan, M.J., Iqbal, M.T, 2005 "Prefeasibility study of standalone hybrid energy systems for applications in New found land",
Renewable Energy 30, 835–854.[36] Pragya Nema, Nema, R.K., Rangnekar, S., 2010 "PVsolar/wind hybrid energy system for GSM/CDMA type mobile
telephony base station" International Journal Of Energy And Environment, Volume1, Issue2, 359366.[37] Omar M.A., 2007 "ComputerAided Design and Performance Evaluation of PVDiesel Hybrid System. Thesis report at An
Najah University.[38] Alawaji, S, Smiai, M.S, Rafique, S., 1995 "PVpowered water pumping and desalination plant for remote areas in Saudi
Arabia" Applied Energy, 52, 283289.[39] Hasnain, S.M, Alajlan, S, 1998 "Coupling of PVPowered RO brachish water desalination plant with solar stills" Reneable
Energy, vol.14, nos.14, 281286.[40] Andreas Fried, 2011, "WATER INDUSTRY SEGMENT REPORT DESALINATION" The World Trade Center San Diego,
www.wtcsd.org.[41] ALAWAJI, SH. HASNAIN, S.M, 1999, "Role of Solar Energy Research in Transferring of Technology to Saudi Arabia"
Energy Sources, 21:923934.[42] Al Ammar, E., "AlAotabi, A., 2010 "Feasibility Study of Establishing a PV Power Plant to Generate Electricity in Saudi
Arabia from Technical, Geographical, and Economical View points" Sustainable Energy Technology Innovation Program (SETIP), International Conference on Renewable Energies and Power Quality (ICREPQ’10) Granada(Spain).
[43] AQUACSP Final Report, DLR, 2007.[44] Ibrahim S. AlMutaz, Abdullah I .Alhudhiri, 2006 "Optimal Design of Hybrid MSF/RO Desalination Plant" Master of
Science in Chemical Engineering , King Saud University, College of Engineering, Kingdom of Saudi Arabia.[45] Alawaji, S.H., 2001 "Evaluation of solar energy research and its applications in Saudi Arabia—20 years of experience"
Renewable and Sustainable Energy Reviews, vol.5, 59–77.[46] ALAWAJI, SH, HASNAIN, S.M. ,1999 "Role of Solar Energy Research in Transferring of Technology to Saudi Arabia"
Energy Sources, 21: 923, 9341999.[47] Trieb, D.F., 2007 "Concentrating Solar Power for Sea water Desalination"MENAREC4, Damascus, Syria.[48] Goosen, M., Mahmoudi, H., Ghaffour, N., Sablani, S.S., 2011 "Application of Renewable Energies for Water Desalination.[49] www.conergygroup.com.[50] Ghermandi, A., Messalem, 2009 "Solardriven desalination with reverse osmosis: the state of the art " Desalination and
Water Treatment ,75–296.[51] http://www.solarbuzz.com.[52] www.pureaqua.com.[53] [email protected].[54] Ummel, K, Wheeler, D., 2008 "Desert Power: The Economics of Solar Thermal Electricity For Europe, North Africa, and the
Middle East" Center for Global Development.[55] Sharma, A., 2011 "Acomprehensive study of solar power in India and world" Renewable andSustainabl eEnergy Reviews,
voll15,17671776.[56] White, J., Agee, M., and Case, A. , 2016 "Engineering economic analysis" Third edition, McGraw Hill, 1991.[57] Murat Gökçek, Öznur Begüm Gökçek "Technical and economic evaluation of fresh water production from a windpowered
smallscale sea water reverse osmosis system(WPSWRO)" Desalination, Volume 381, 4757.