infographics on philippine higher education v1
DESCRIPTION
Education StatisticsTRANSCRIPT

INFOGRAPHICS ON
PHILIPPINE HIGHER EDUCATION
Commission on Higher Education
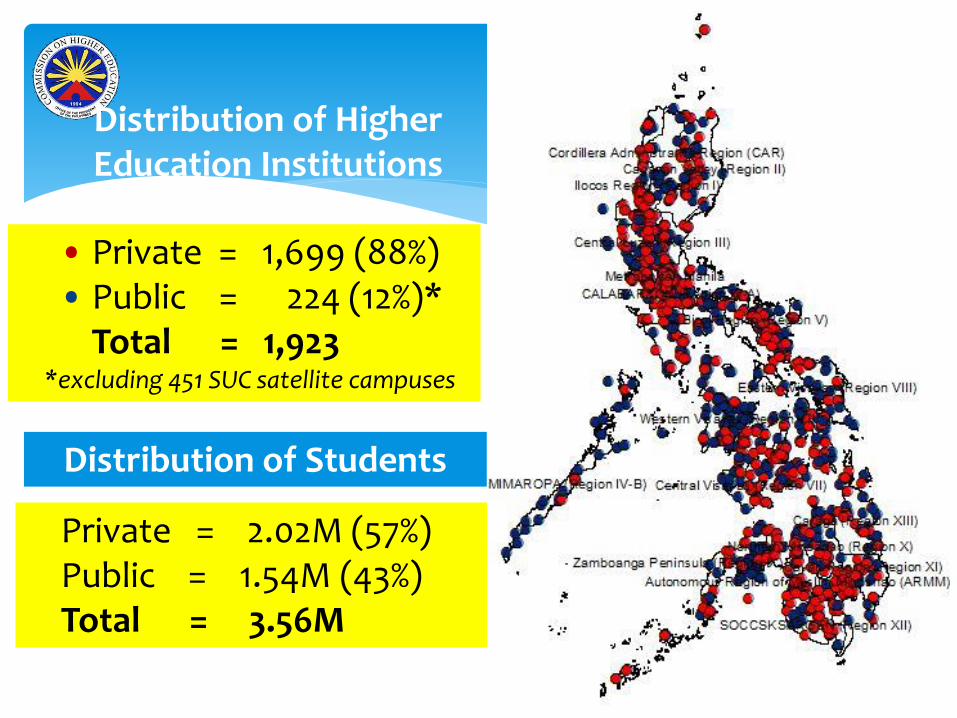
Distribution of Higher Education Institutions
Distribution of Students
• Private = 1,699 (88%)• Public = 224 (12%)*
Total = 1,923*excluding 451 SUC satellite campuses
Private = 2.02M (57%)Public = 1.54M (43%)Total = 3.56M

Regional Distribution of HEIs
80
49
172
252
39
110
78
123
54 55 6580
93
314
3658
41
10 526 19 7
25 21 15 13 7 12 9 428 7
11 5
Private Public
*Excludes Satellite Campuses of State Universities and Colleges
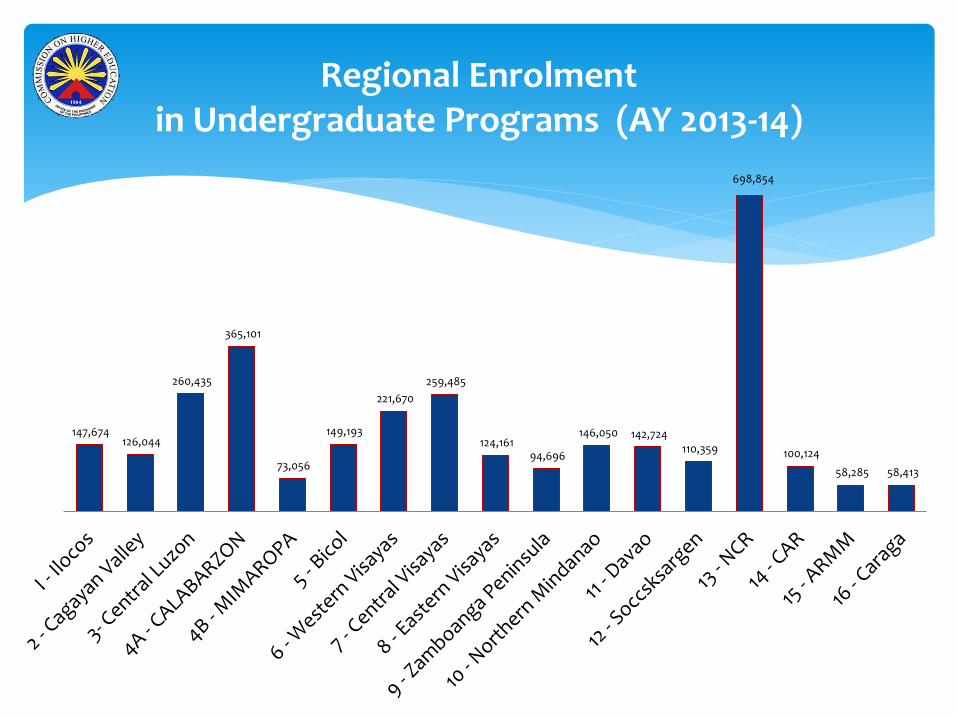
147,674 126,044
260,435
365,101
73,056
149,193
221,670
259,485
124,161 94,696
146,050 142,724 110,359
698,854
100,124
58,285 58,413
Regional Enrolment in Undergraduate Programs (AY 2013-14)
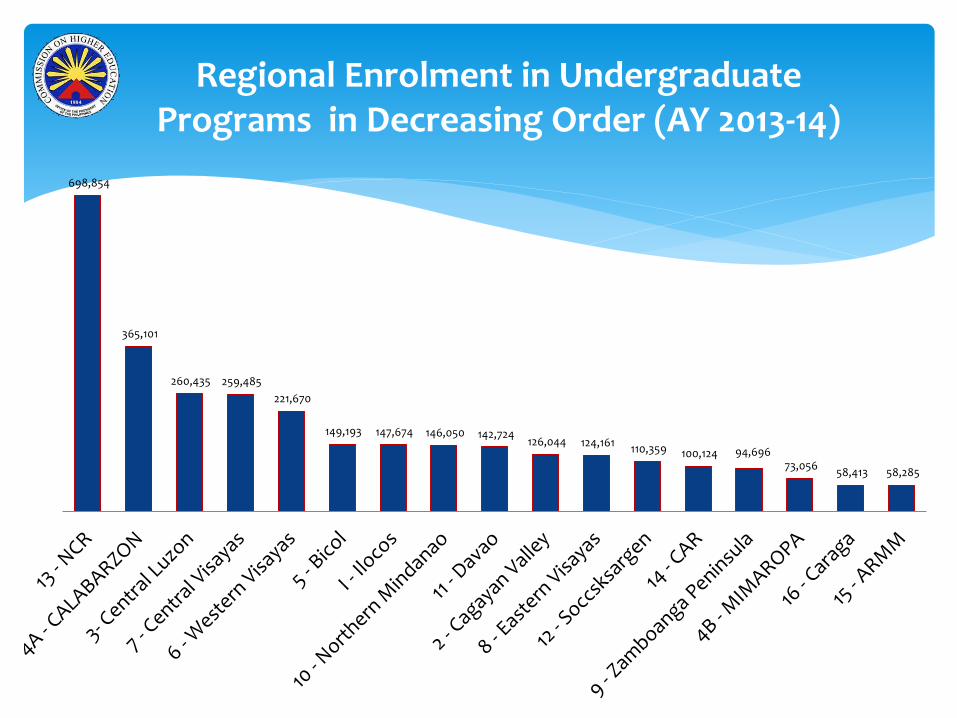
698,854
365,101
260,435 259,485
221,670
149,193 147,674 146,050 142,724 126,044 124,161
110,359 100,124 94,696 73,056
58,413 58,285
Regional Enrolment in Undergraduate Programs in Decreasing Order (AY 2013-14)
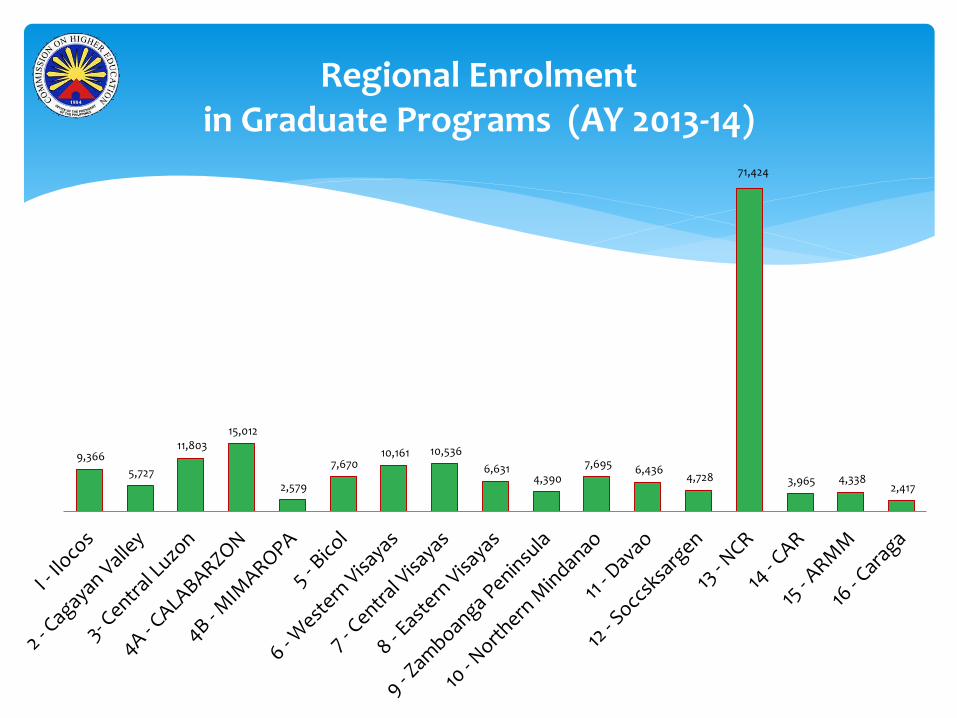
9,366
5,727
11,803 15,012
2,579
7,670 10,161 10,536
6,631 4,390
7,695 6,436 4,728
71,424
3,965 4,338 2,417
Regional Enrolment in Graduate Programs (AY 2013-14)
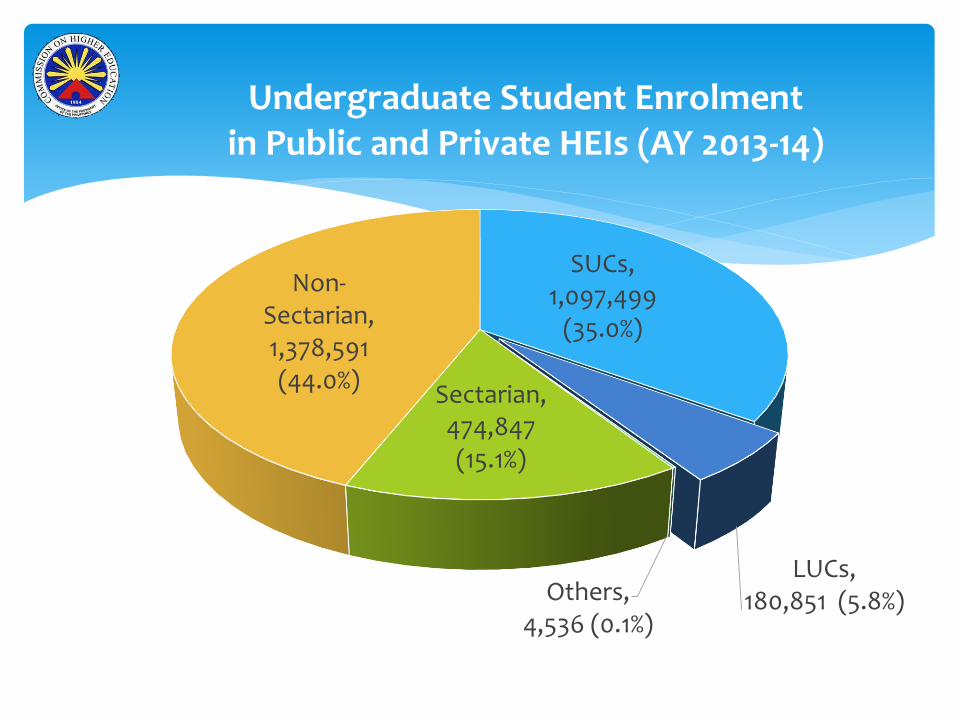
SUCs, 1,097,499
(35.0%)
LUCs, 180,851 (5.8%)Others,
4,536 (0.1%)
Sectarian, 474,847 (15.1%)
Non-Sectarian, 1,378,591 (44.0%)
Undergraduate Student Enrolment in Public and Private HEIs (AY 2013-14)
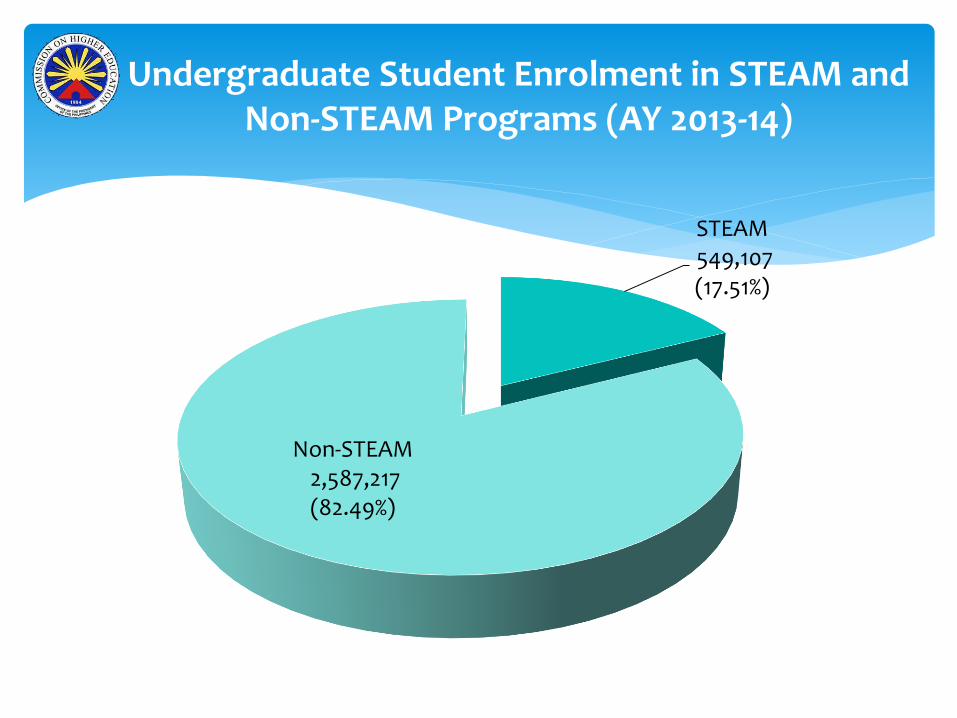
Undergraduate Student Enrolment in STEAM and Non-STEAM Programs (AY 2013-14)
STEAM549,107 (17.51%)
Non-STEAM2,587,217 (82.49%)
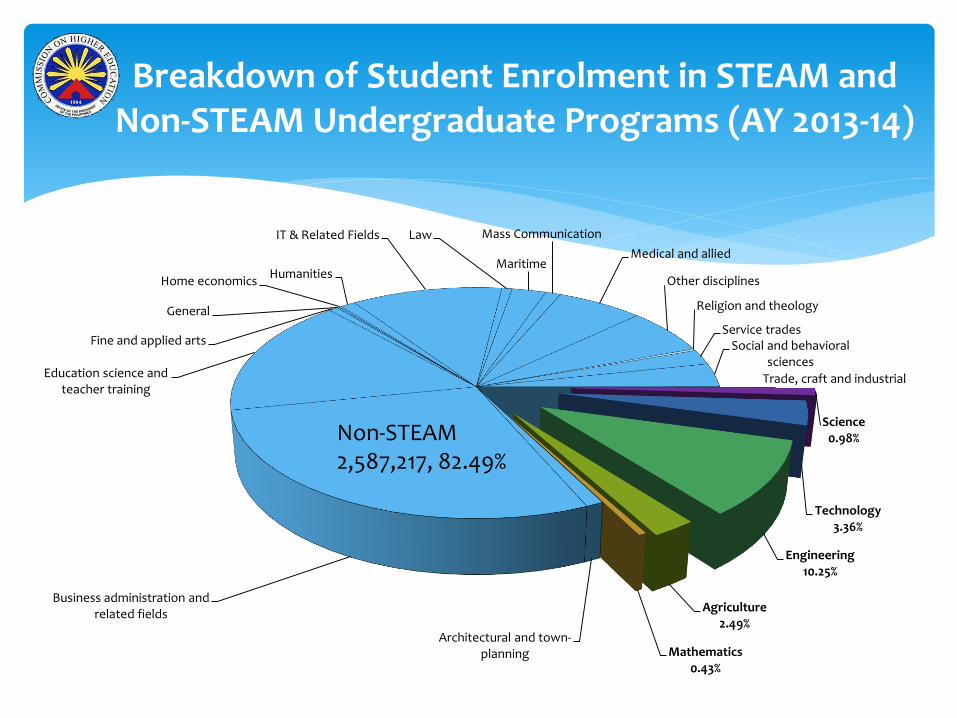
Science0.98%
Technology3.36%
Engineering10.25%
Agriculture2.49%
Mathematics0.43%
Architectural and town-planning
Business administration and related fields
Education science and teacher training
Fine and applied arts
General
Home economicsHumanities
IT & Related Fields Law
Maritime
Mass Communication
Medical and allied
Other disciplines
Religion and theology
Service tradesSocial and behavioral
sciences
Trade, craft and industrial
Breakdown of Student Enrolment in STEAM and Non-STEAM Undergraduate Programs (AY 2013-14)
Non-STEAM2,587,217, 82.49%
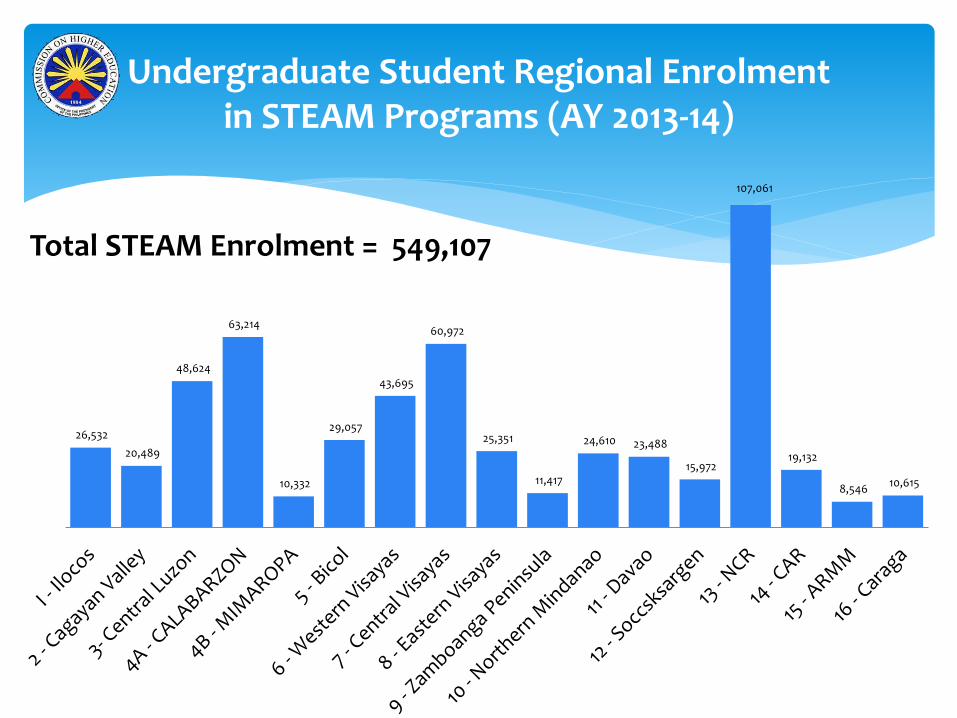
26,532
20,489
48,624
63,214
10,332
29,057
43,695
60,972
25,351
11,417
24,610 23,488
15,972
107,061
19,132
8,546 10,615
Total STEAM Enrolment = 549,107
Undergraduate Student Regional Enrolment in STEAM Programs (AY 2013-14)
ARCHITECTURAL AND TOWN-PLANNING
BUSINESS ADMINISTRATION AND RELATED
EDUCATION SCIENCE AND TEACHER TRAINING
FINE AND APPLIED ARTS
GENERAL
HOME ECONOMICS
HUMANITIES
IT-RELATED
LAW AND JURISPRUDENCE
MARITIME
MASS COMMUNICATION AND DOCUMENTATION
MEDICAL AND ALLIED
OTHER DISCIPLINES
RELIGION AND THEOLOGY
SERVICE TRADES
SOCIAL AND BEHAVIORAL SCIENCES
TRADE, CRAFT AND INDUSTRIAL
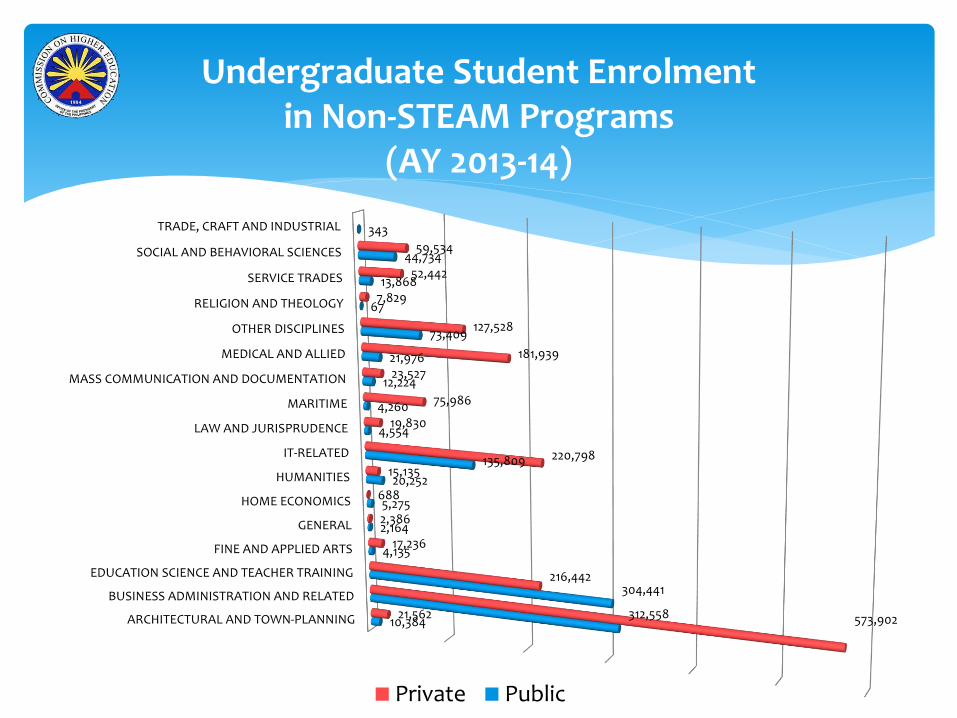
10,384 312,558
304,441
4,135
2,164
5,275
20,252
135,809
4,554
4,260
12,224
21,976
73,409
67
13,868
44,734
343
21,562 573,902
216,442
17,236
2,386
688
15,135 220,798
19,830
75,986
23,527
181,939
127,528
7,829
52,442
59,534
Private Public
Undergraduate Student Enrolment in Non-STEAM Programs
(AY 2013-14)
ARCHITECTURAL AND TOWN-PLANNING
BUSINESS ADMINISTRATION AND RELATED
EDUCATION SCIENCE AND TEACHER TRAINING
FINE AND APPLIED ARTS
GENERAL
HOME ECONOMICS
HUMANITIES
IT-RELATED
LAW AND JURISPRUDENCE
MARITIME
MASS COMMUNICATION AND DOCUMENTATION
MEDICAL AND ALLIED
OTHER DISCIPLINES
RELIGION AND THEOLOGY
SERVICE TRADES
SOCIAL AND BEHAVIORAL SCIENCES
TRADE, CRAFT AND INDUSTRIAL
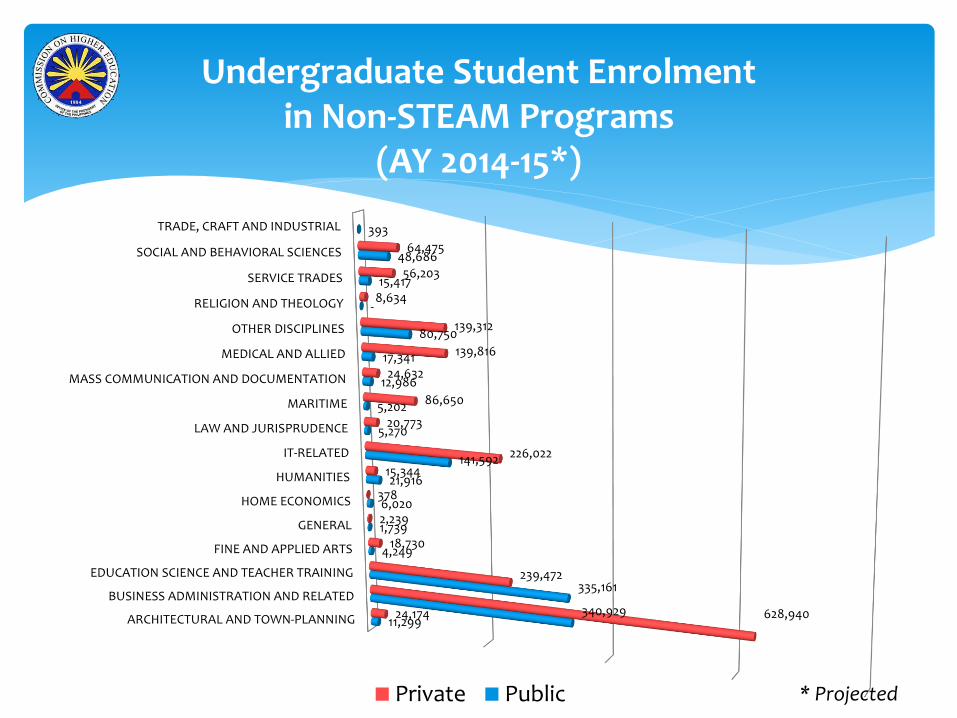
11,299 340,929
335,161
4,249
1,739
6,020
21,916
141,592
5,270
5,202
12,986
17,341
80,750
-
15,417
48,686
393
24,174 628,940
239,472
18,730
2,239
378
15,344
226,022
20,773
86,650
24,632
139,816
139,312
8,634
56,203
64,475
Private Public
Undergraduate Student Enrolment in Non-STEAM Programs
(AY 2014-15*)
* Projected

Undergraduate Student Enrolmentin STEAM Programs by Type of HEI
(AY 2013-14 and 2014-15*)
* Projected
236,674 256,224
312,433 336,326
2013-14 2014-15*
-
100,000
200,000
300,000
400,000
Private Public
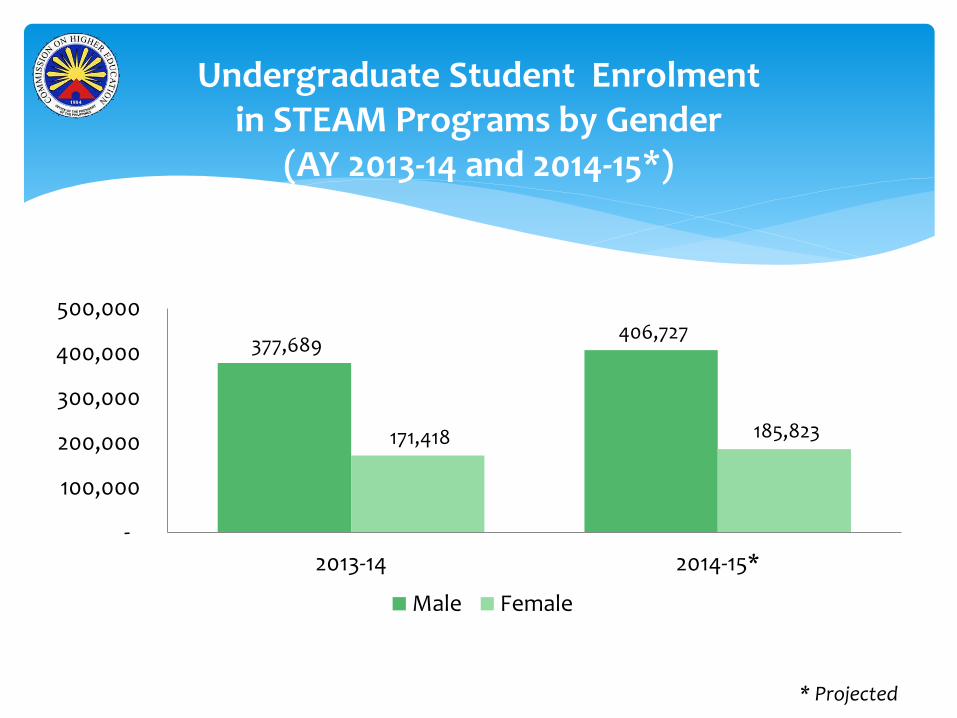
377,689 406,727
171,418 185,823
2013-14 2014-15*
-
100,000
200,000
300,000
400,000
500,000
Male Female
Undergraduate Student Enrolmentin STEAM Programs by Gender
(AY 2013-14 and 2014-15*)
* Projected
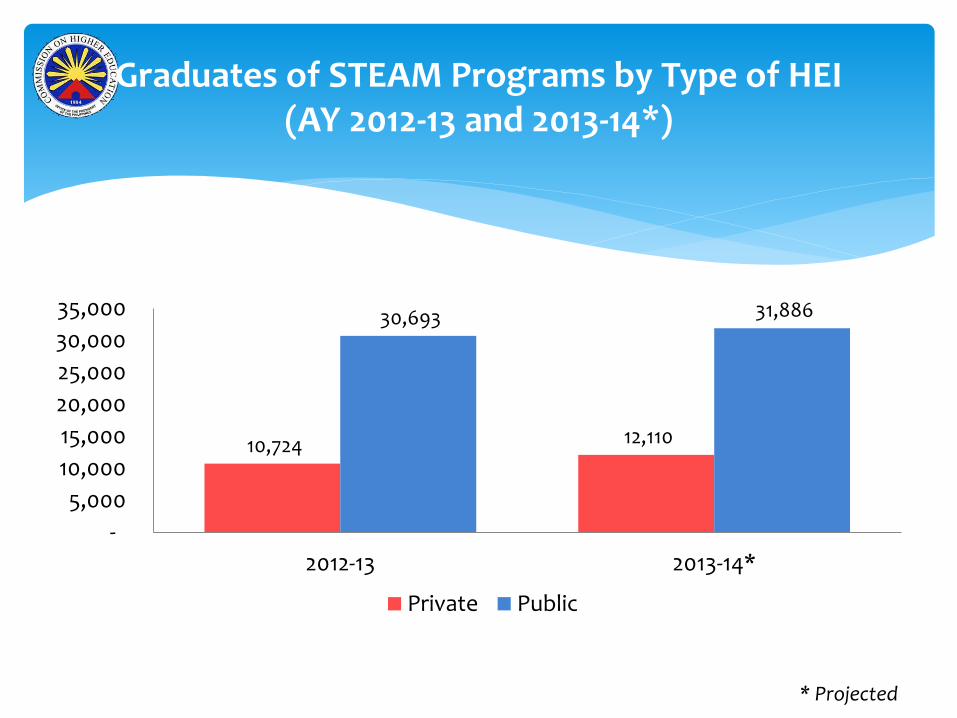
Graduates of STEAM Programs by Type of HEI(AY 2012-13 and 2013-14*)
* Projected
10,724 12,110
30,693 31,886
2012-13 2013-14*
-
5,000
10,000
15,000
20,000
25,000
30,000
35,000
Private Public
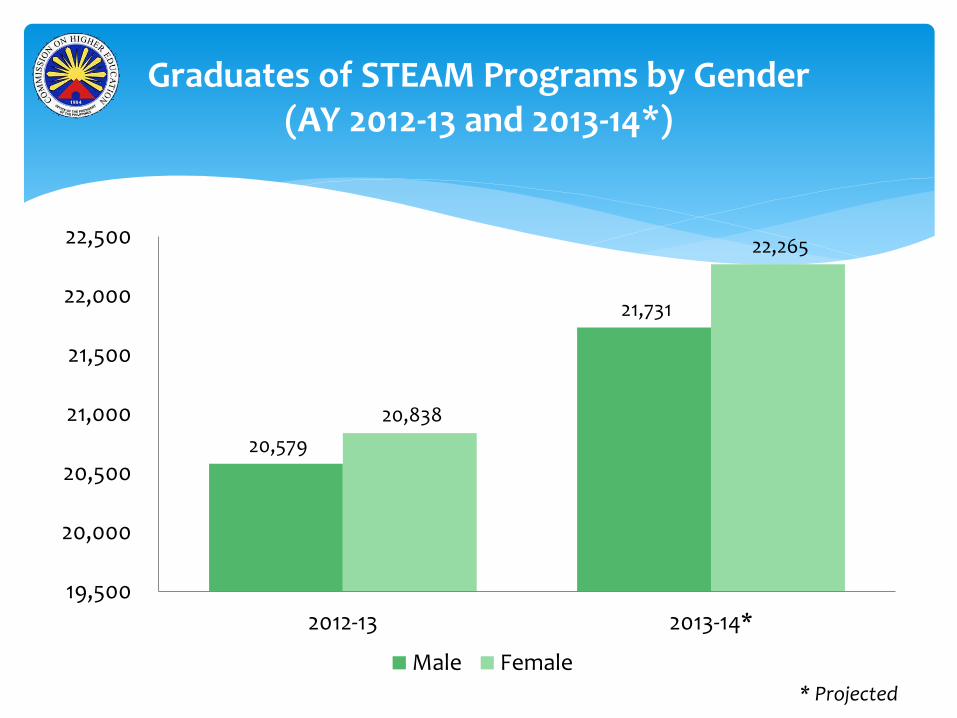
Graduates of STEAM Programs by Gender(AY 2012-13 and 2013-14*)
* Projected
20,579
21,731
20,838
22,265
2012-13 2013-14*
19,500
20,000
20,500
21,000
21,500
22,000
22,500
Male Female

Undergraduate Student Enrolmentin Science Programs by Type of HEI
(AY 2013-14 and 2014-15*)
* Projected
11,443 12,529
19,356 20,309
2013-14 2014-15*
-
5,000
10,000
15,000
20,000
25,000
Private Public
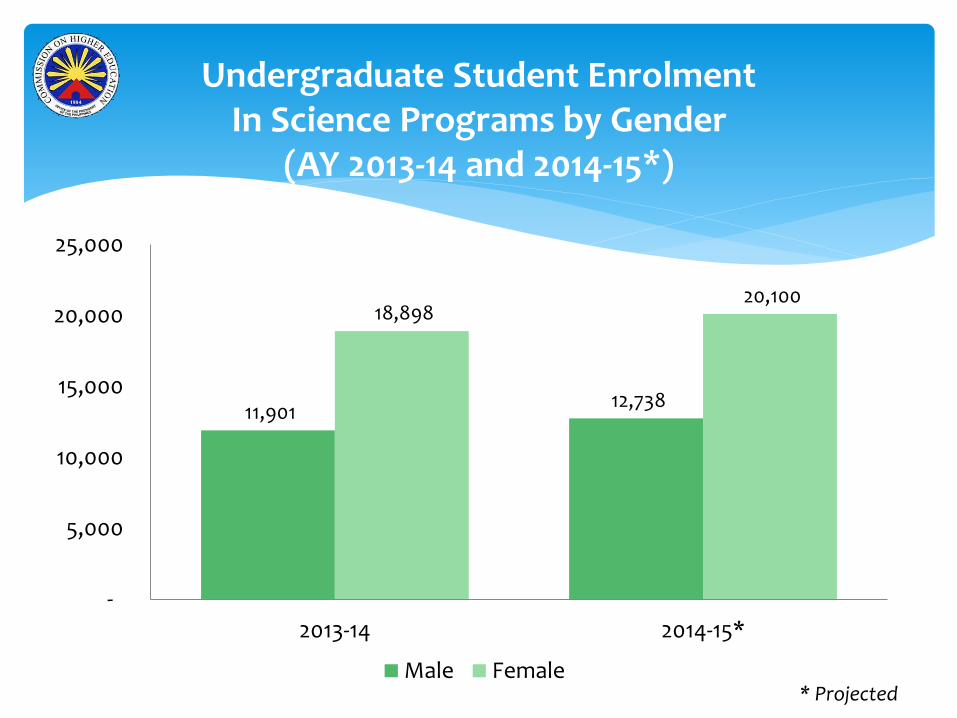
Undergraduate Student EnrolmentIn Science Programs by Gender
(AY 2013-14 and 2014-15*)
* Projected
11,901 12,738
18,898 20,100
2013-14 2014-15*
-
5,000
10,000
15,000
20,000
25,000
Male Female
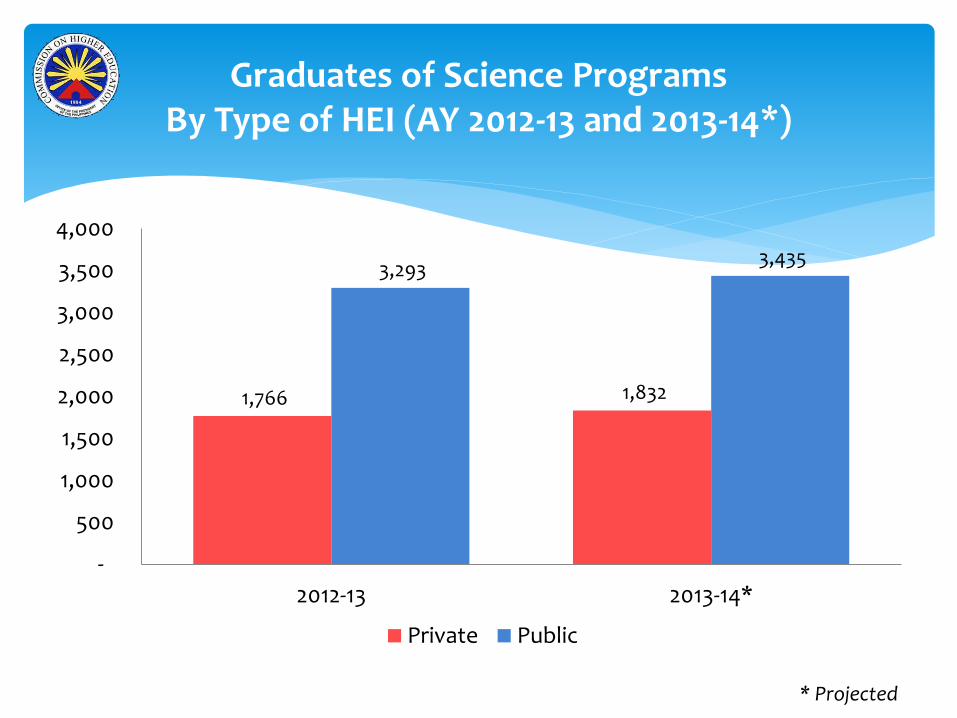
Graduates of Science Programs By Type of HEI (AY 2012-13 and 2013-14*)
* Projected
1,766 1,832
3,293 3,435
2012-13 2013-14*
-
500
1,000
1,500
2,000
2,500
3,000
3,500
4,000
Private Public
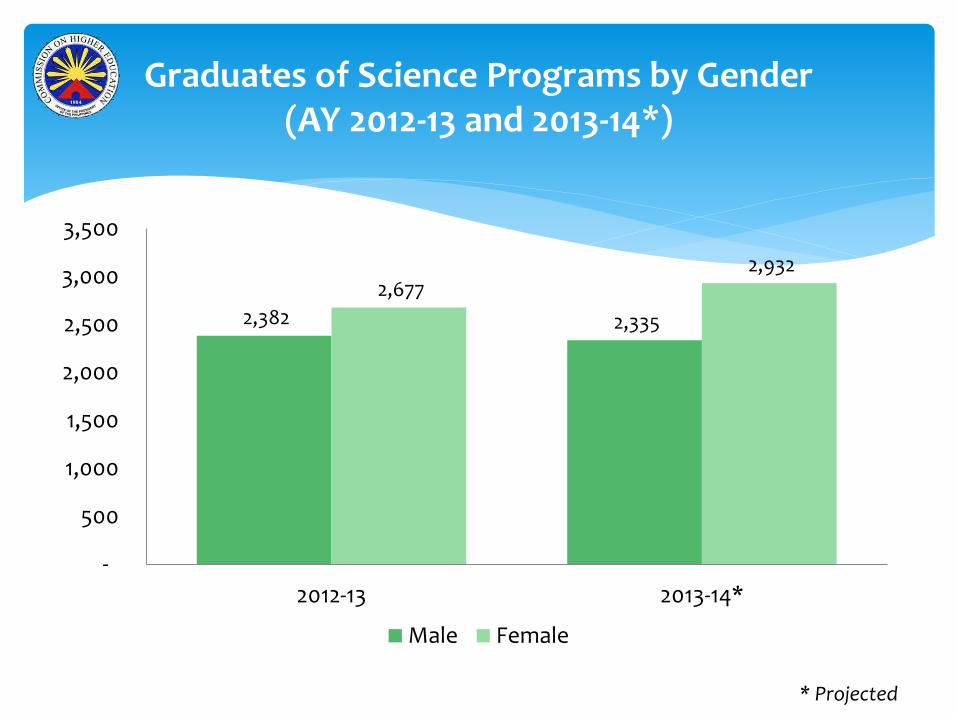
Graduates of Science Programs by Gender(AY 2012-13 and 2013-14*)
* Projected
2,382 2,335
2,677 2,932
2012-13 2013-14*
-
500
1,000
1,500
2,000
2,500
3,000
3,500
Male Female
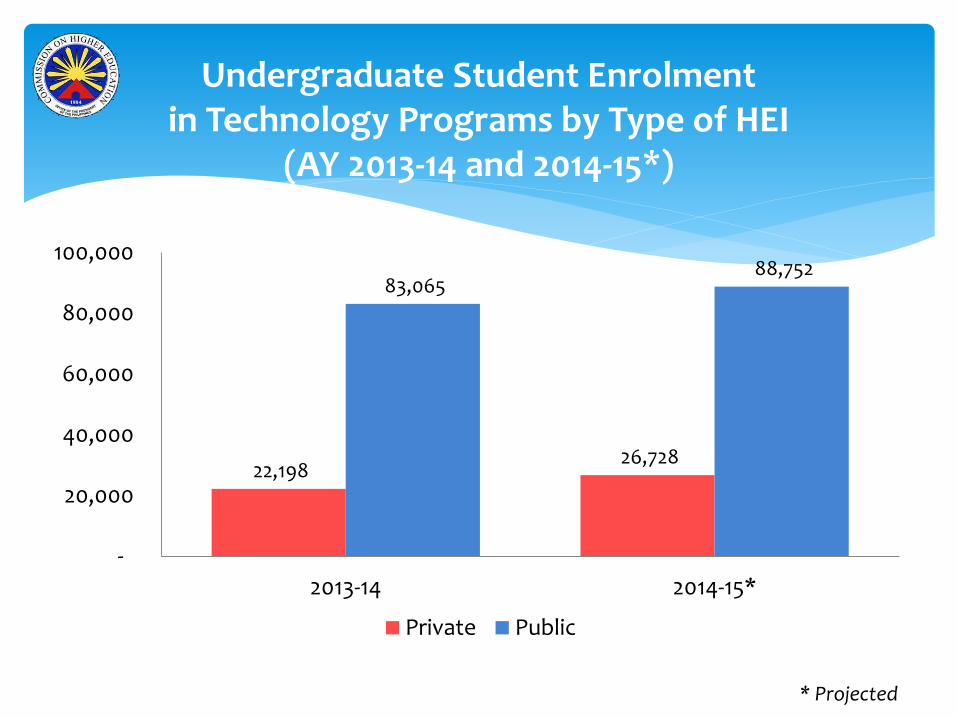
Undergraduate Student Enrolmentin Technology Programs by Type of HEI
(AY 2013-14 and 2014-15*)
* Projected
22,198 26,728
83,065 88,752
2013-14 2014-15*
-
20,000
40,000
60,000
80,000
100,000
Private Public
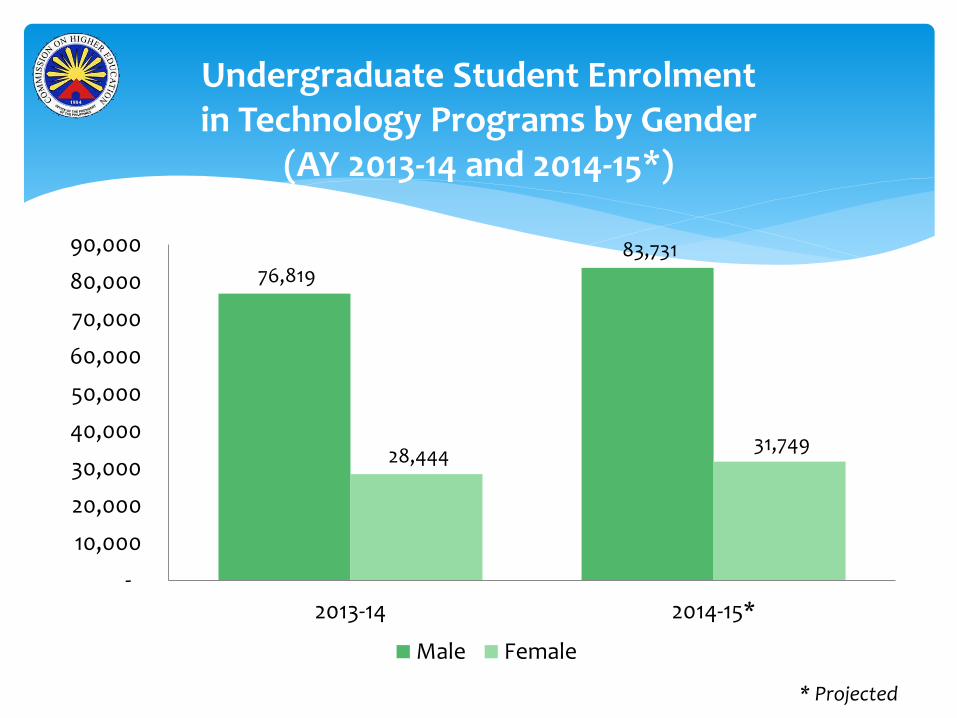
Undergraduate Student Enrolmentin Technology Programs by Gender
(AY 2013-14 and 2014-15*)
* Projected
76,819 83,731
28,444 31,749
2013-14 2014-15*
-
10,000
20,000
30,000
40,000
50,000
60,000
70,000
80,000
90,000
Male Female

Graduates of Technology Programsby Type of HEI (AY 2012-13 and 2013-14*)
* Projected
823 1,250
6,594 6,905
2012-13 2013-14*
-
1,000
2,000
3,000
4,000
5,000
6,000
7,000
8,000
Private Public
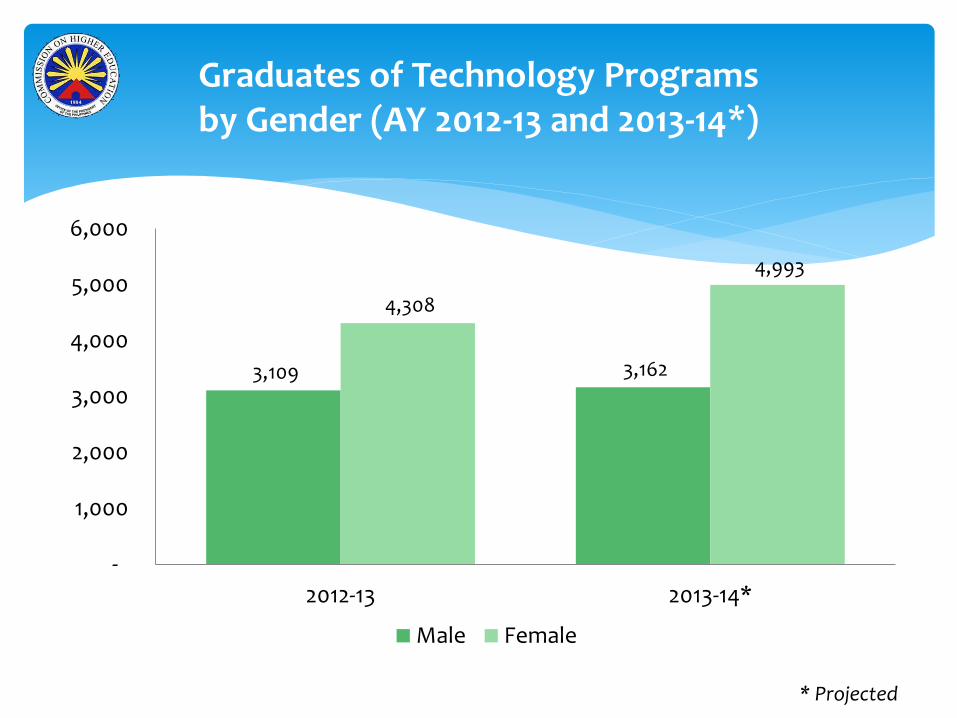
Graduates of Technology Programsby Gender (AY 2012-13 and 2013-14*)
* Projected
3,109 3,162
4,308
4,993
2012-13 2013-14*
-
1,000
2,000
3,000
4,000
5,000
6,000
Male Female
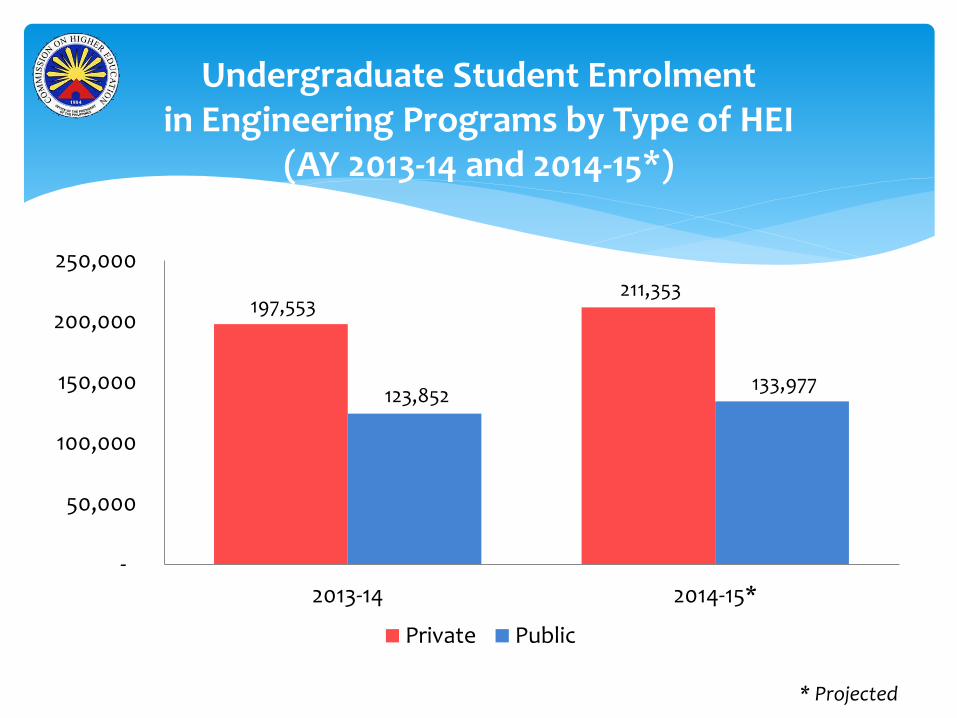
Undergraduate Student Enrolmentin Engineering Programs by Type of HEI
(AY 2013-14 and 2014-15*)
* Projected
197,553 211,353
123,852 133,977
2013-14 2014-15*
-
50,000
100,000
150,000
200,000
250,000
Private Public

Undergraduate Student Enrolmentin Engineering Programs by Gender
(AY 2013-14 and 2014-15*)
* Projected
245,240 263,554
76,165 81,776
2013-14 2014-15*
-
50,000
100,000
150,000
200,000
250,000
300,000
Male Female

Graduates of Engineering Programsby Type of HEI (AY 2012-13 and 2013-14*)
* Projected
7,440 8,268
11,086 11,947
2012-13 2013-14*
-
2,000
4,000
6,000
8,000
10,000
12,000
14,000
Private Public
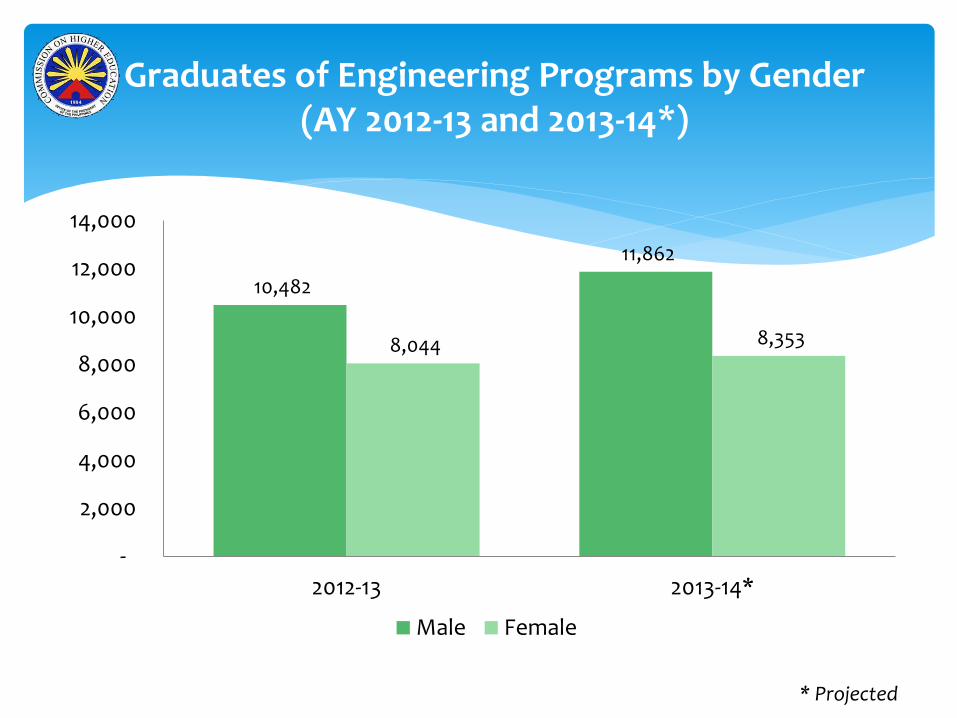
Graduates of Engineering Programs by Gender(AY 2012-13 and 2013-14*)
* Projected
10,482
11,862
8,044 8,353
2012-13 2013-14*
-
2,000
4,000
6,000
8,000
10,000
12,000
14,000
Male Female
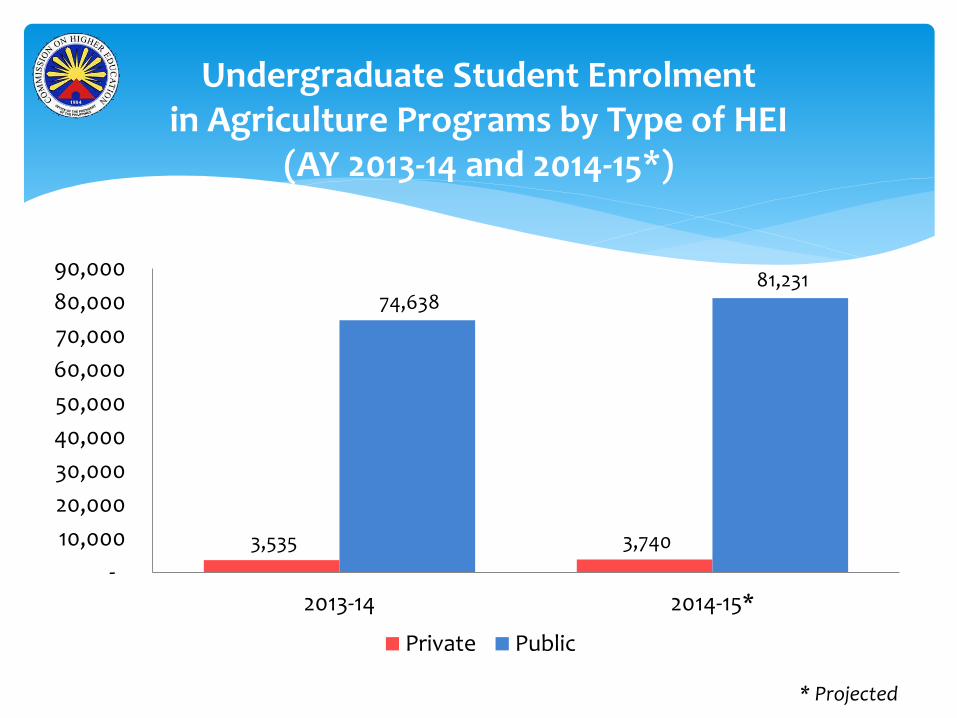
Undergraduate Student Enrolmentin Agriculture Programs by Type of HEI
(AY 2013-14 and 2014-15*)
* Projected
3,535 3,740
74,638 81,231
2013-14 2014-15*
-
10,000
20,000
30,000
40,000
50,000
60,000
70,000
80,000
90,000
Private Public
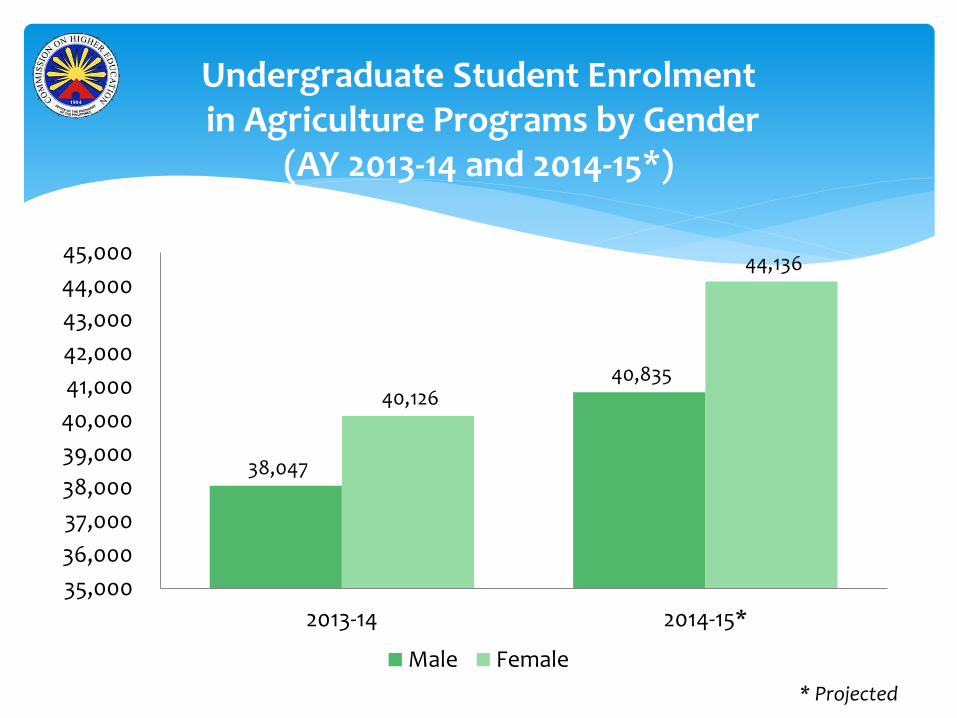
Undergraduate Student Enrolmentin Agriculture Programs by Gender
(AY 2013-14 and 2014-15*)
* Projected
38,047
40,835 40,126
44,136
2013-14 2014-15*
35,000
36,000
37,000
38,000
39,000
40,000
41,000
42,000
43,000
44,000
45,000
Male Female
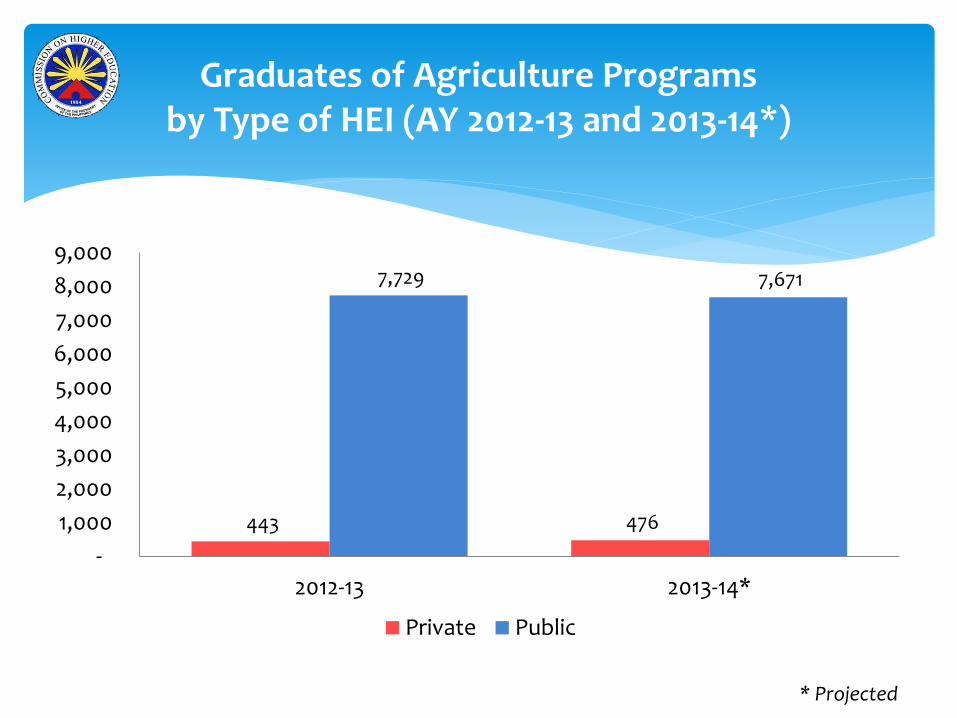
Graduates of Agriculture Programsby Type of HEI (AY 2012-13 and 2013-14*)
* Projected
443 476
7,729 7,671
2012-13 2013-14*
-
1,000
2,000
3,000
4,000
5,000
6,000
7,000
8,000
9,000
Private Public
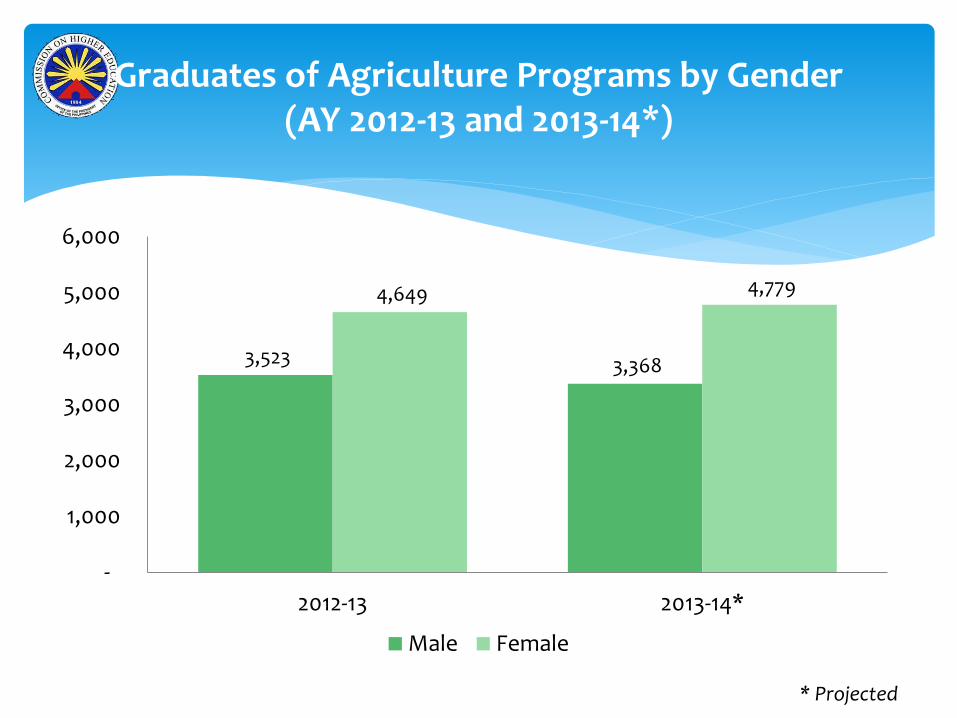
Graduates of Agriculture Programs by Gender(AY 2012-13 and 2013-14*)
* Projected
3,523 3,368
4,649 4,779
2012-13 2013-14*
-
1,000
2,000
3,000
4,000
5,000
6,000
Male Female
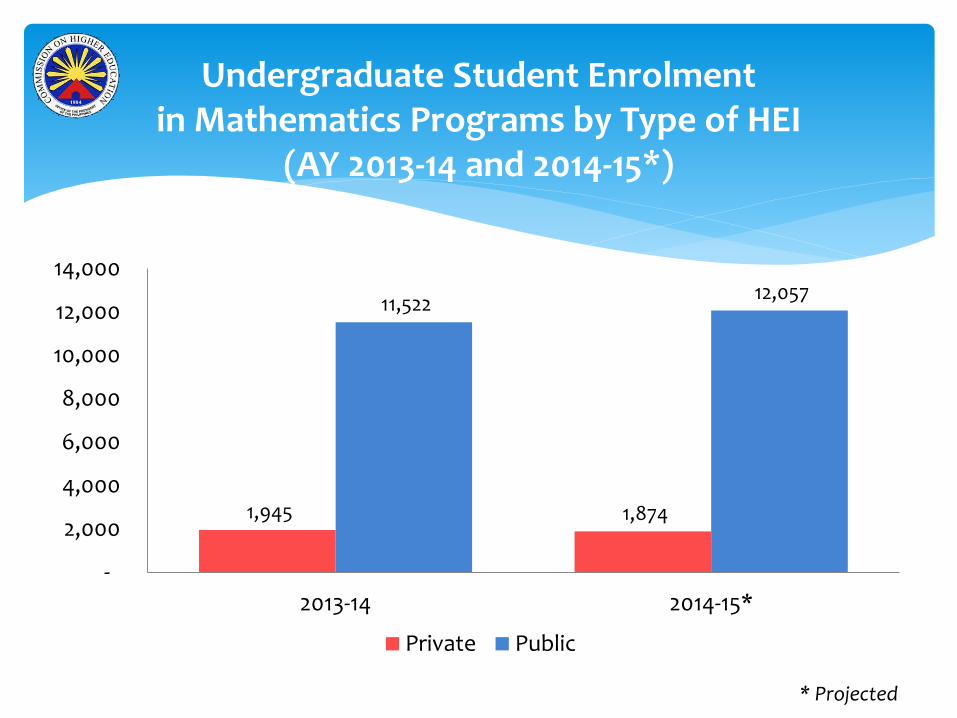
Undergraduate Student Enrolment in Mathematics Programs by Type of HEI
(AY 2013-14 and 2014-15*)
* Projected
1,945 1,874
11,522 12,057
2013-14 2014-15*
-
2,000
4,000
6,000
8,000
10,000
12,000
14,000
Private Public
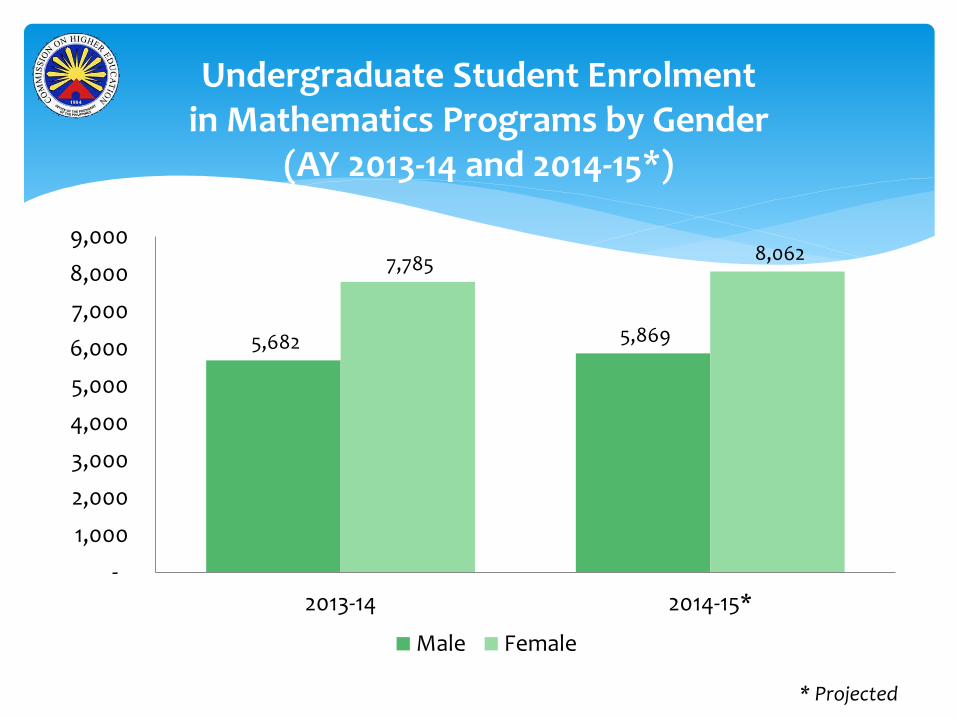
Undergraduate Student Enrolmentin Mathematics Programs by Gender
(AY 2013-14 and 2014-15*)
* Projected
5,682 5,869
7,785 8,062
2013-14 2014-15*
-
1,000
2,000
3,000
4,000
5,000
6,000
7,000
8,000
9,000
Male Female
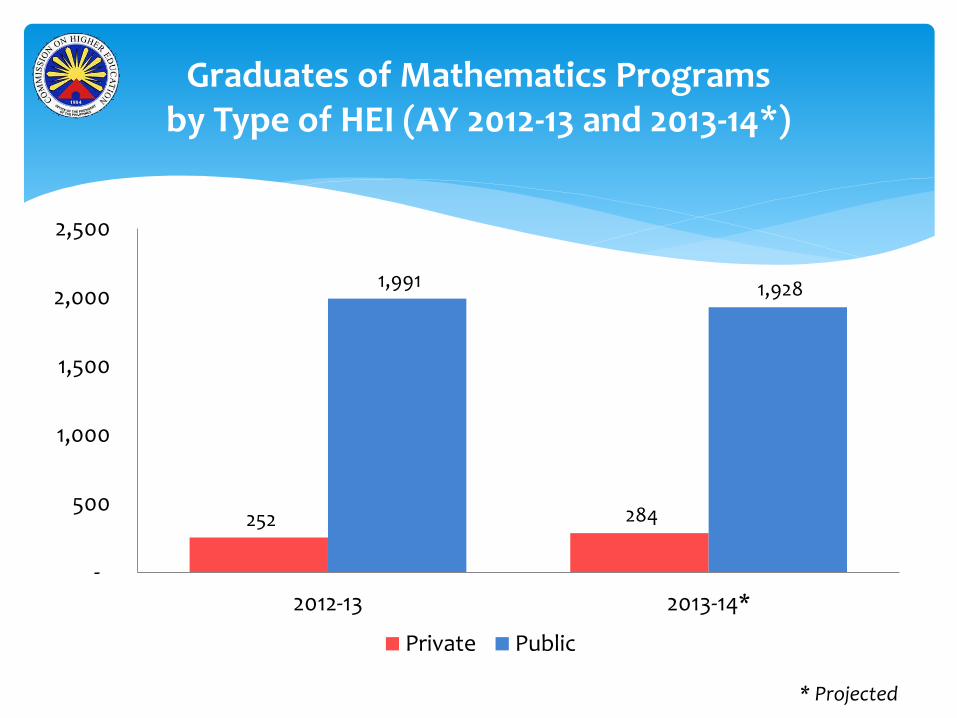
Graduates of Mathematics Programsby Type of HEI (AY 2012-13 and 2013-14*)
* Projected
252 284
1,991 1,928
2012-13 2013-14*
-
500
1,000
1,500
2,000
2,500
Private Public
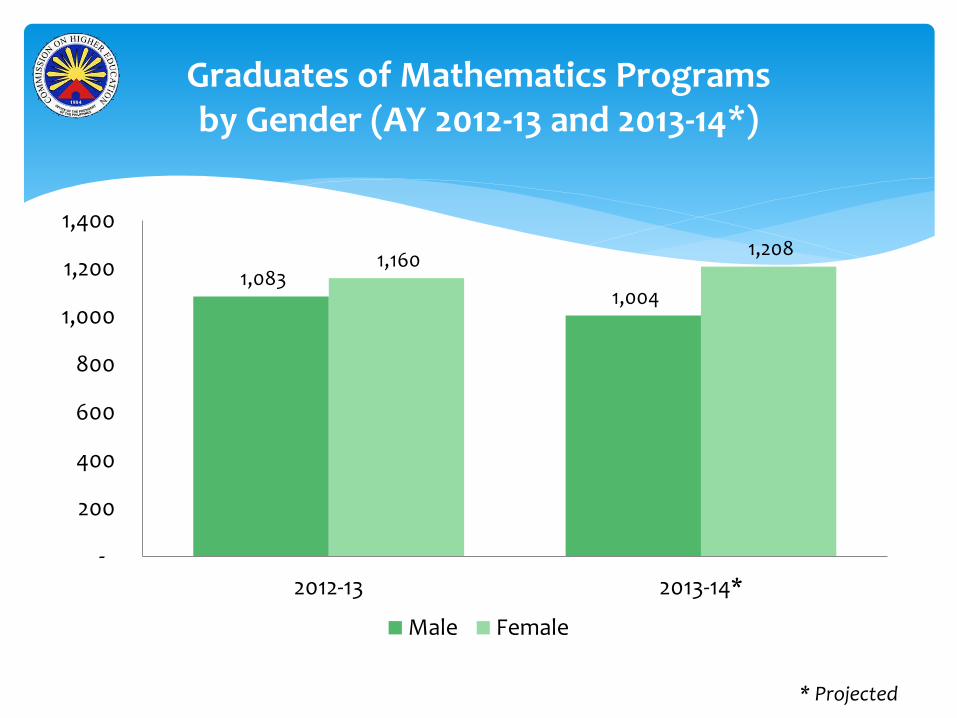
Graduates of Mathematics Programsby Gender (AY 2012-13 and 2013-14*)
* Projected
1,083 1,004
1,160 1,208
2012-13 2013-14*
-
200
400
600
800
1,000
1,200
1,400
Male Female
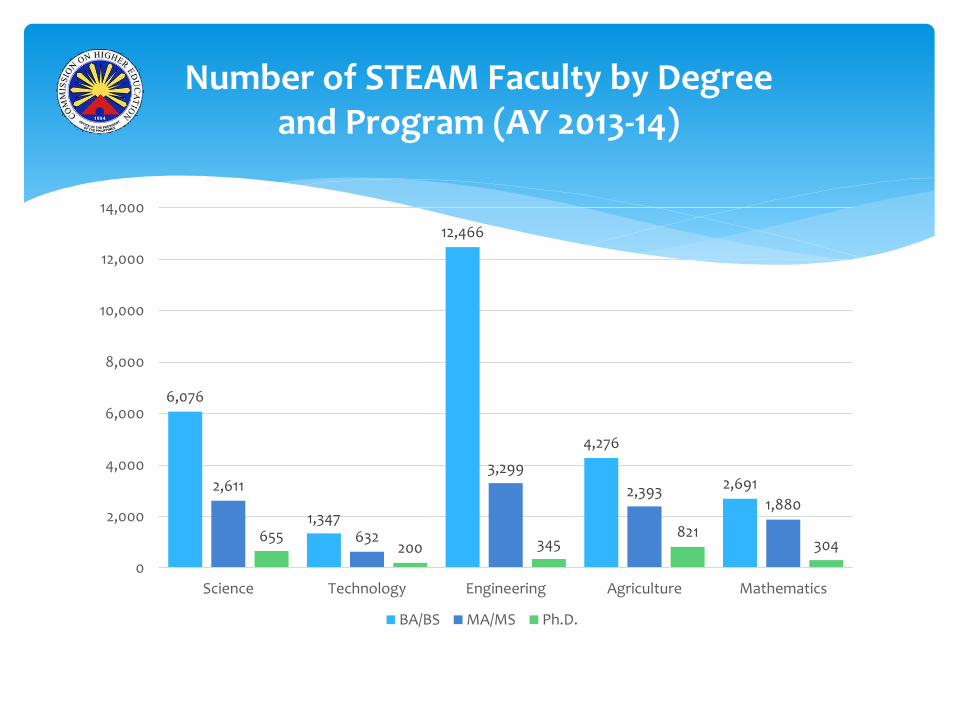
Number of STEAM Faculty by Degree and Program (AY 2013-14)
6,076
1,347
12,466
4,276
2,6912,611
632
3,299
2,3931,880
655200 345
821304
0
2,000
4,000
6,000
8,000
10,000
12,000
14,000
Science Technology Engineering Agriculture Mathematics
BA/BS MA/MS Ph.D.
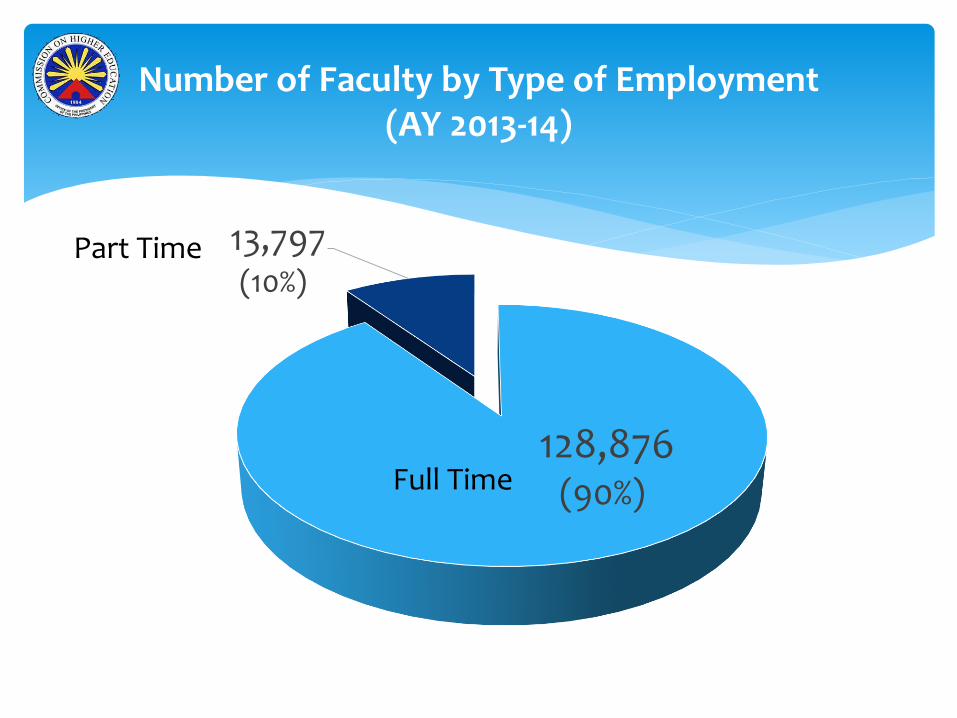
Number of Faculty by Type of Employment(AY 2013-14)
128,876 (90%)
13,797 (10%)
Full Time
Part Time
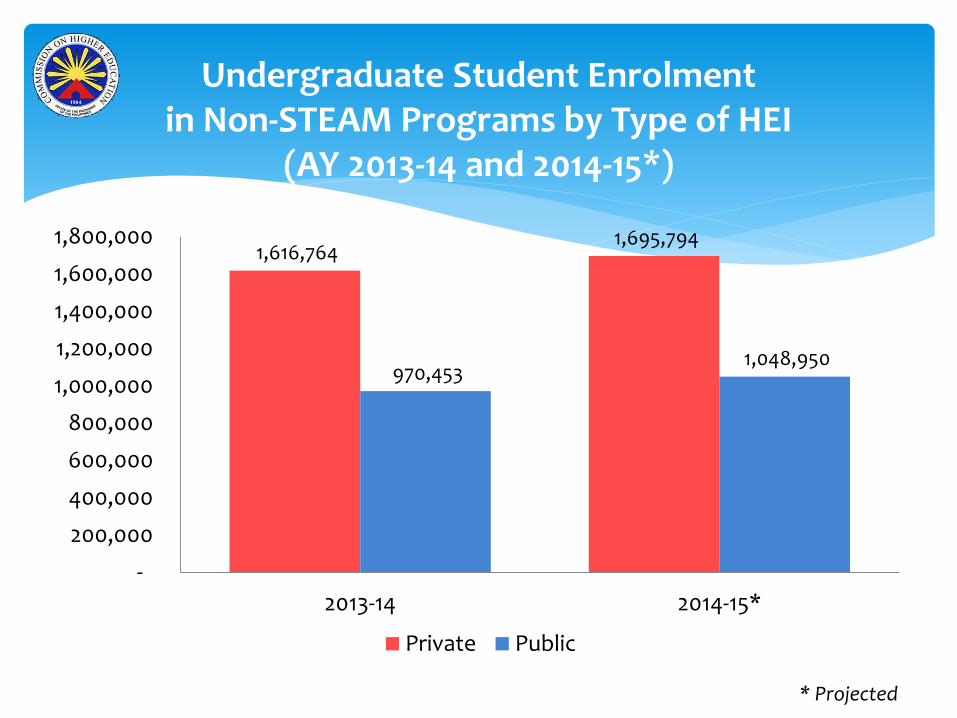
Undergraduate Student Enrolmentin Non-STEAM Programs by Type of HEI
(AY 2013-14 and 2014-15*)
* Projected
1,616,764 1,695,794
970,453 1,048,950
2013-14 2014-15*
-
200,000
400,000
600,000
800,000
1,000,000
1,200,000
1,400,000
1,600,000
1,800,000
Private Public
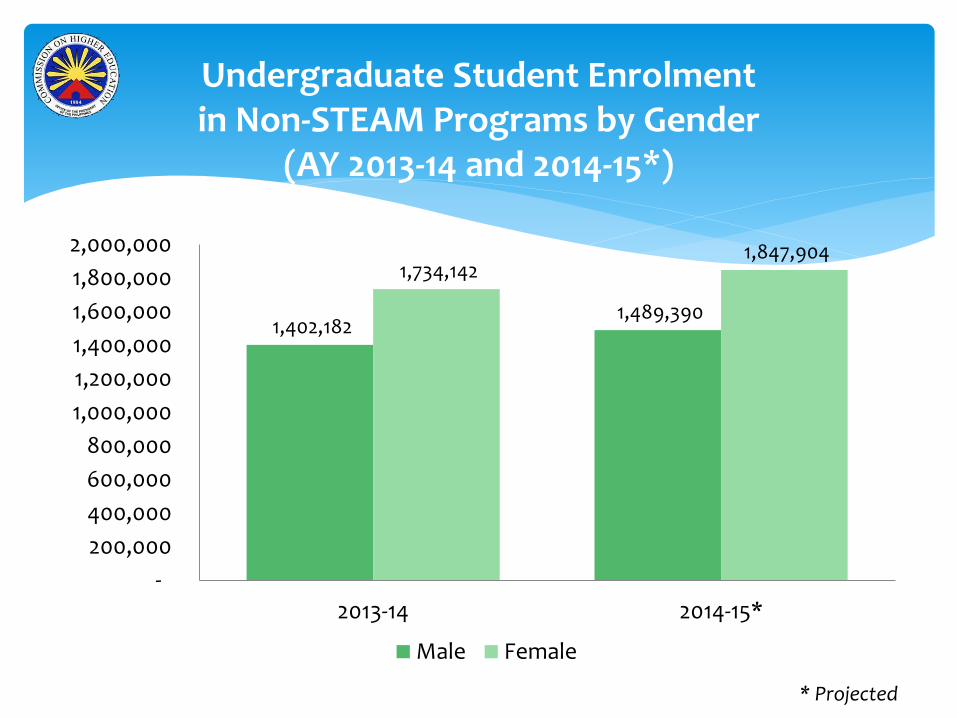
Undergraduate Student Enrolment in Non-STEAM Programs by Gender
(AY 2013-14 and 2014-15*)
* Projected
1,402,182 1,489,390
1,734,142 1,847,904
2013-14 2014-15*
-
200,000
400,000
600,000
800,000
1,000,000
1,200,000
1,400,000
1,600,000
1,800,000
2,000,000
Male Female
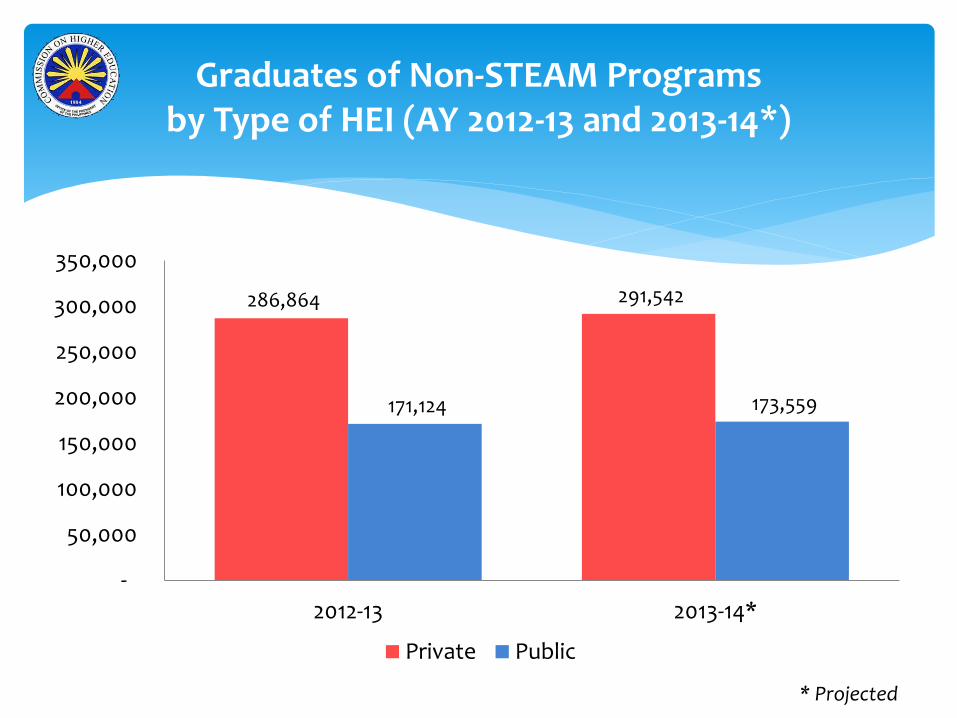
Graduates of Non-STEAM Programsby Type of HEI (AY 2012-13 and 2013-14*)
* Projected
286,864 291,542
171,124 173,559
2012-13 2013-14*
-
50,000
100,000
150,000
200,000
250,000
300,000
350,000
Private Public
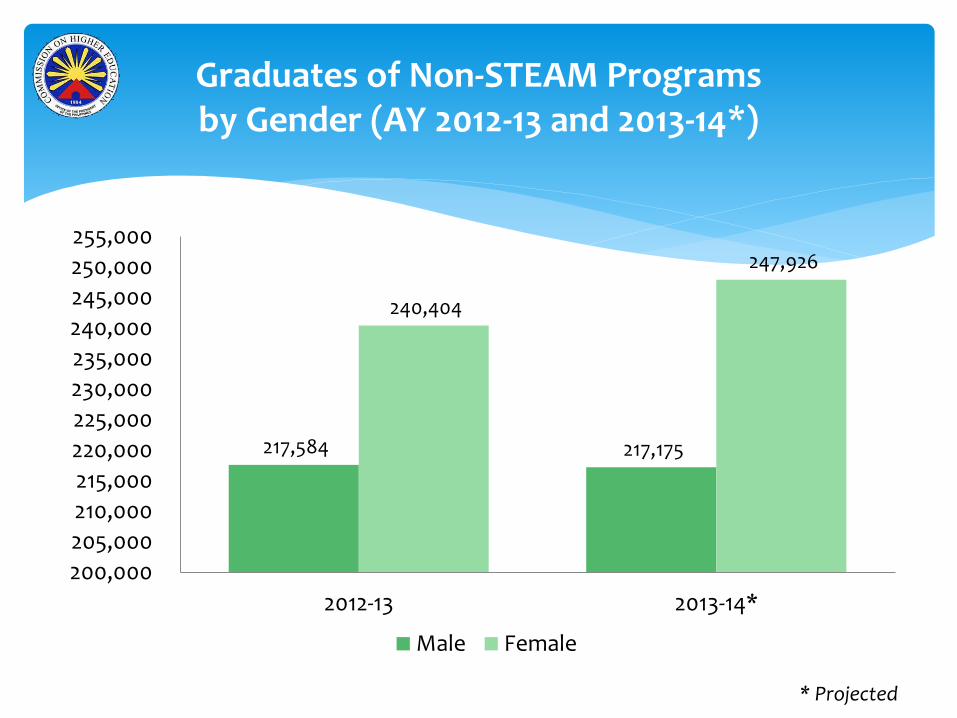
Graduates of Non-STEAM Programsby Gender (AY 2012-13 and 2013-14*)
* Projected
217,584 217,175
240,404
247,926
2012-13 2013-14*
200,000
205,000
210,000
215,000
220,000
225,000
230,000
235,000
240,000
245,000
250,000
255,000
Male Female
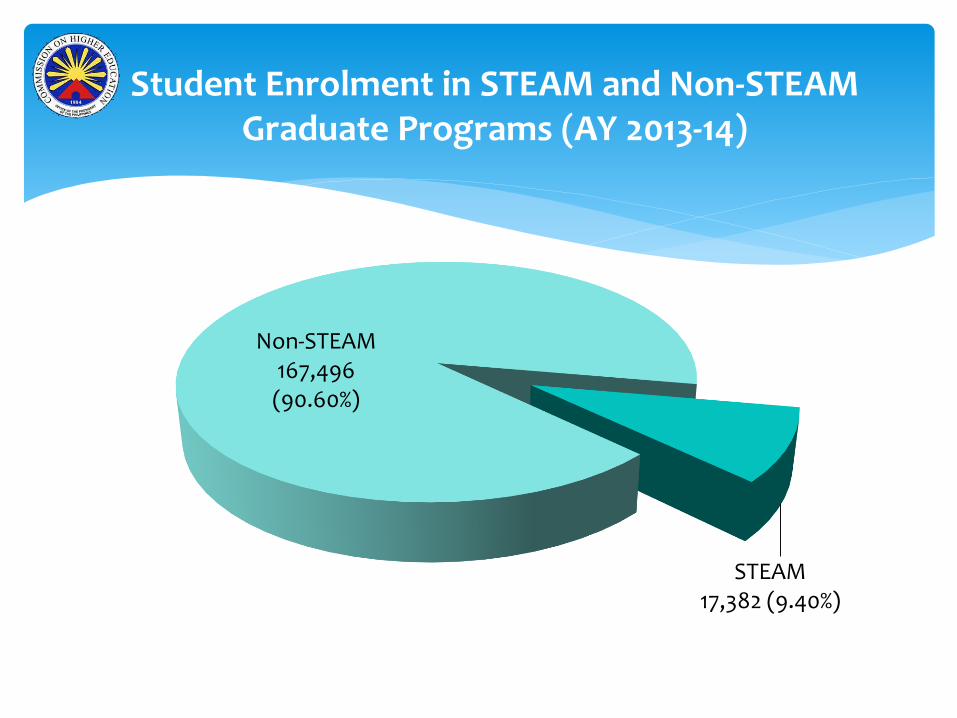
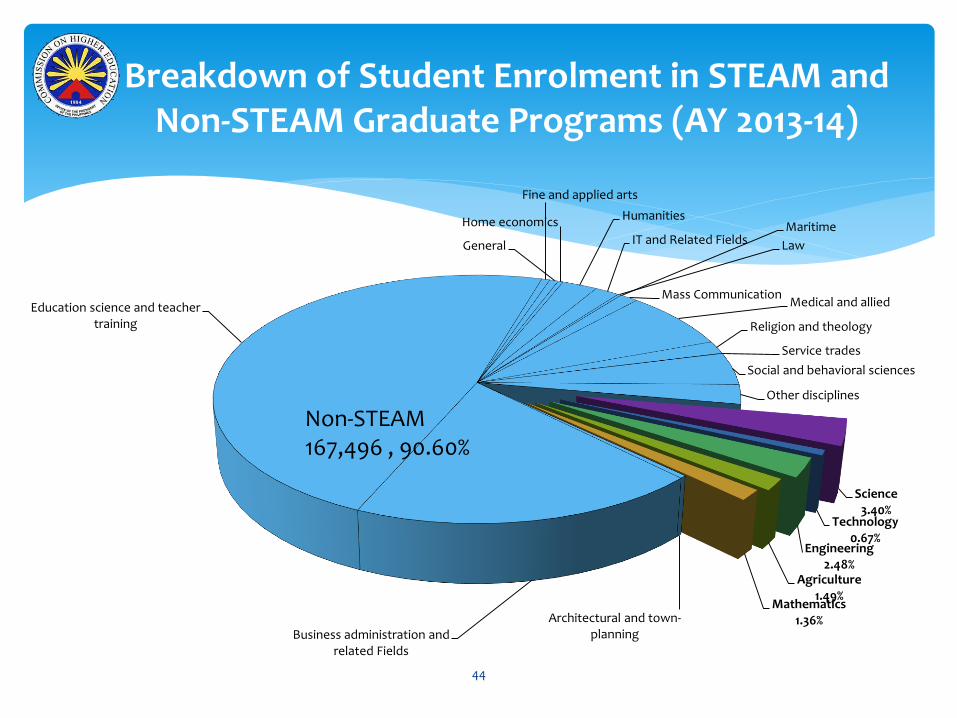
Student Enrolment in STEAM and Non-STEAM Graduate Programs (AY 2013-14)
STEAM 17,382 (9.40%)
Non-STEAM167,496 (90.60%)
44
Science3.40%
Technology0.67%
Engineering2.48%
Agriculture1.49%
Mathematics1.36%Architectural and town-
planningBusiness administration and related Fields
Education science and teacher training
Fine and applied arts
General
Home economics Humanities
IT and Related Fields Law
Maritime
Mass CommunicationMedical and allied
Religion and theology
Service trades
Social and behavioral sciences
Other disciplines
Breakdown of Student Enrolment in STEAM and Non-STEAM Graduate Programs (AY 2013-14)
Non-STEAM 167,496 , 90.60%
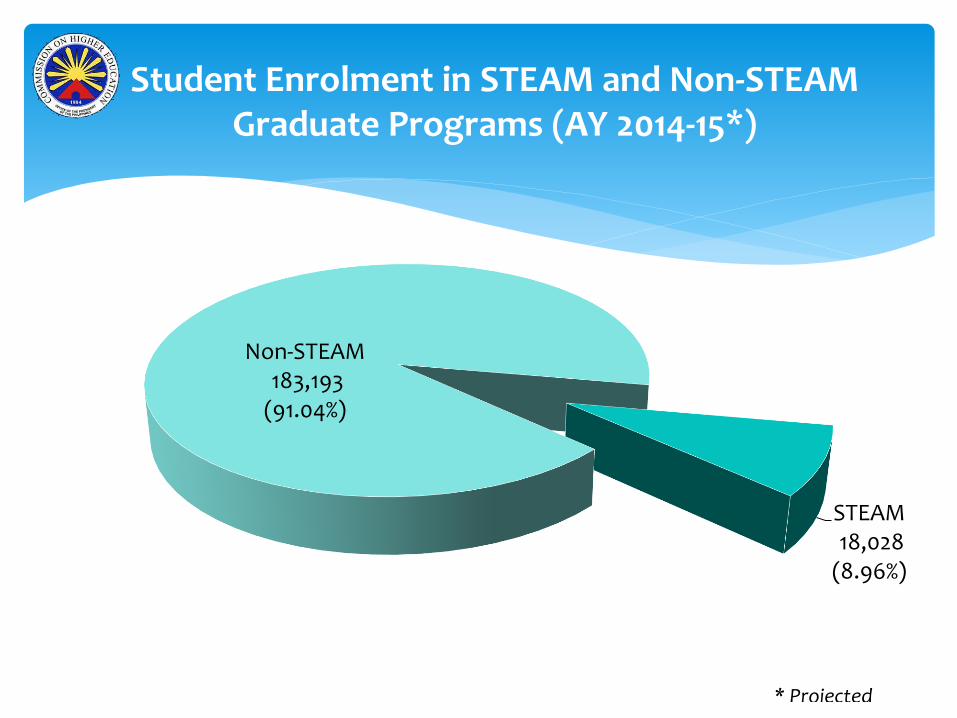
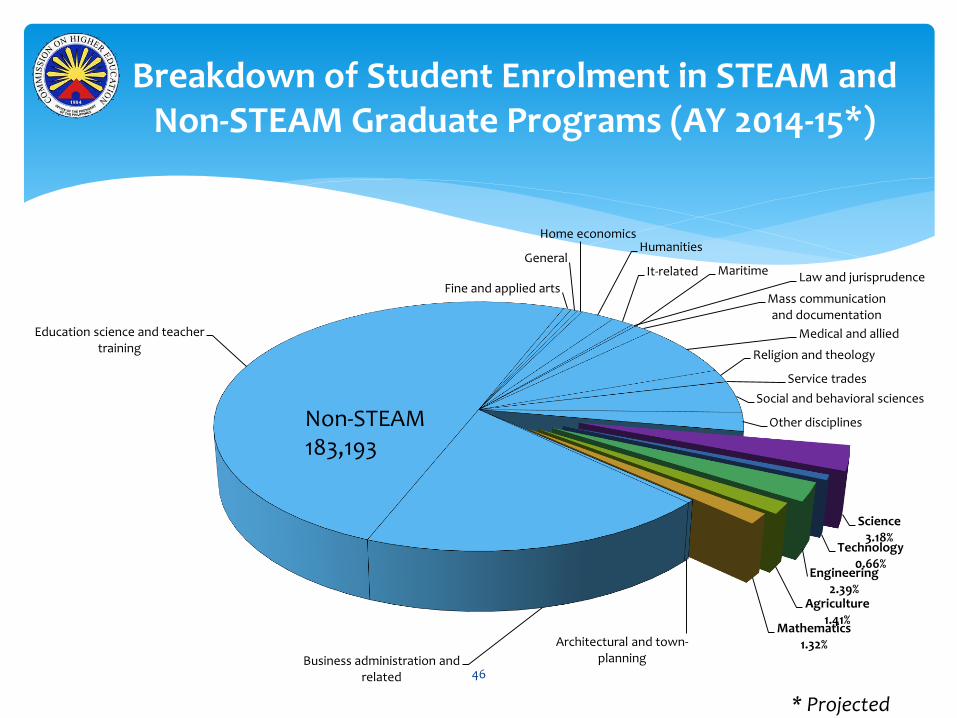
Student Enrolment in STEAM and Non-STEAM Graduate Programs (AY 2014-15*)
STEAM18,028
(8.96%)
Non-STEAM183,193
(91.04%)
* Projected
46
Science3.18%
Technology0.66%
Engineering2.39%
Agriculture1.41%
Mathematics1.32%Architectural and town-
planningBusiness administration and related
Education science and teacher training
Fine and applied arts
General
Home economicsHumanities
It-related Law and jurisprudenceMaritime
Mass communication and documentation
Medical and allied
Religion and theology
Service trades
Social and behavioral sciences
Other disciplines
* Projected
Breakdown of Student Enrolment in STEAM and Non-STEAM Graduate Programs (AY 2014-15*)
Non-STEAM 183,193
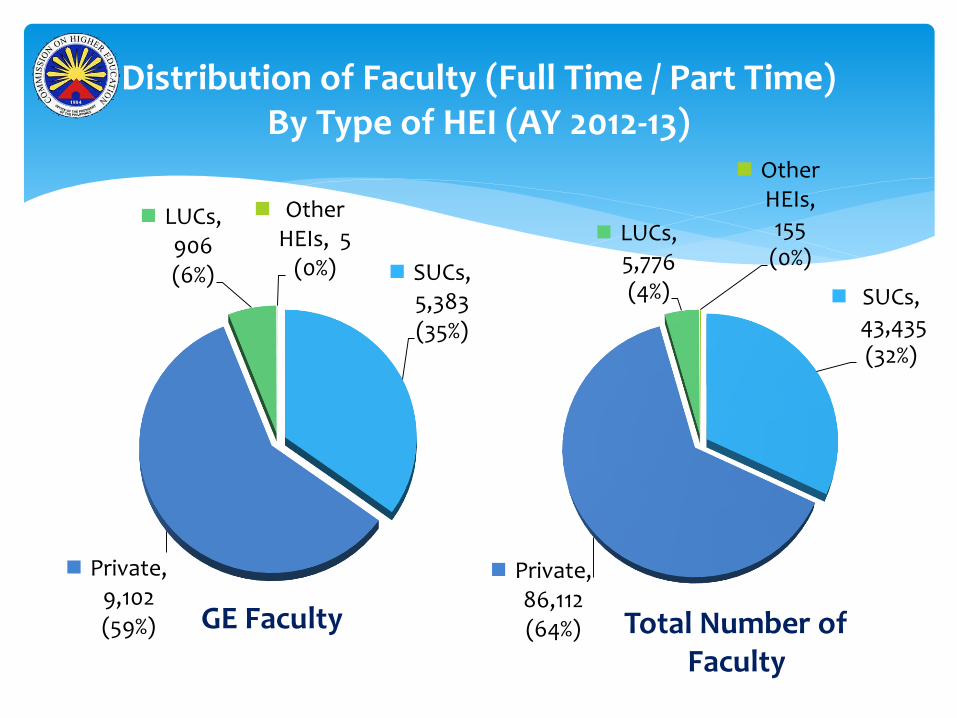
SUCs, 5,383 (35%)
Private, 9,102 (59%)
LUCs, 906 (6%)
Other HEIs, 5
(0%)
GE Faculty
SUCs, 43,435 (32%)
Private, 86,112 (64%)
LUCs, 5,776 (4%)
Other HEIs, 155 (0%)
Total Number ofFaculty
Distribution of Faculty (Full Time / Part Time)By Type of HEI (AY 2012-13)
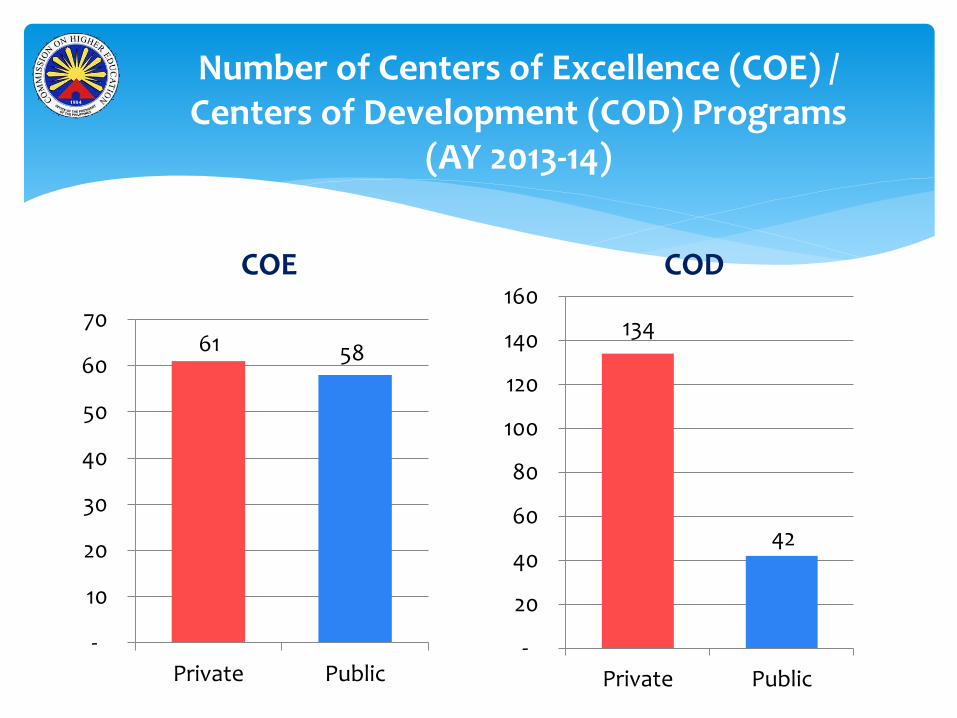
61 58
-
10
20
30
40
50
60
70
Private Public
COE
134
42
-
20
40
60
80
100
120
140
160
Private Public
COD
Number of Centers of Excellence (COE) / Centers of Development (COD) Programs
(AY 2013-14)
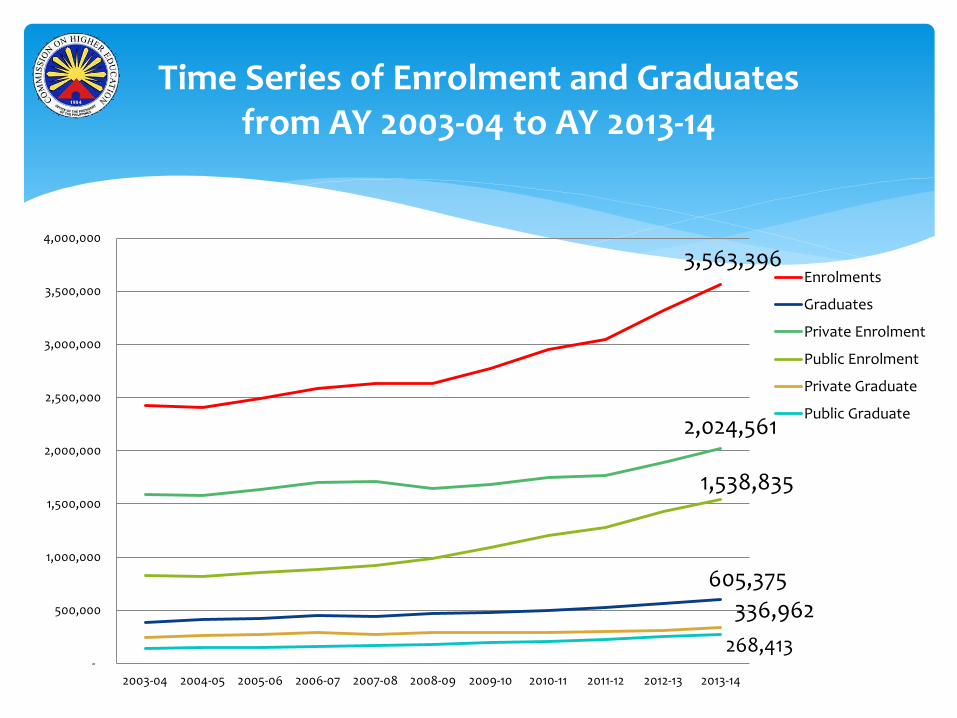
Time Series of Enrolment and Graduatesfrom AY 2003-04 to AY 2013-14
3,563,396
605,375
2,024,561
1,538,835
336,962
268,413 -
500,000
1,000,000
1,500,000
2,000,000
2,500,000
3,000,000
3,500,000
4,000,000
2003-04 2004-05 2005-06 2006-07 2007-08 2008-09 2009-10 2010-11 2011-12 2012-13 2013-14
Enrolments
Graduates
Private Enrolment
Public Enrolment
Private Graduate
Public Graduate

Trend of STEAM Programs EnrollmentAY 2010-11 to 2014-15*Baccalaureate Level
430,035
453,883
516,185 549,107
592,550
-
100,000
200,000
300,000
400,000
500,000
600,000
700,000
2010-11 2011-12 2012-13 2013-14 2014-15*
Enrollments* Projected
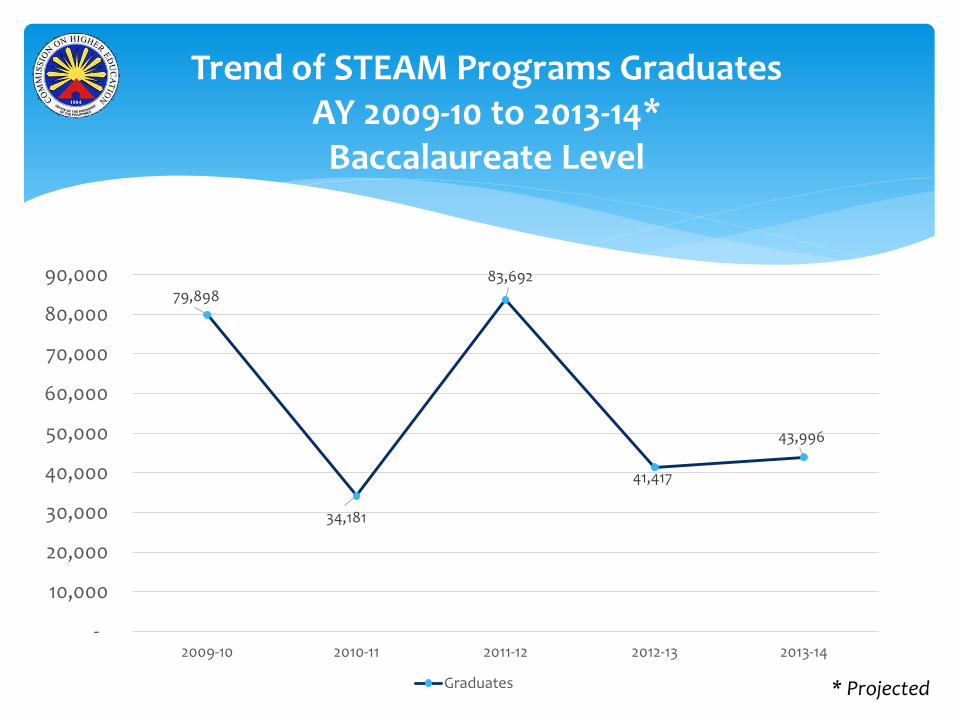
Trend of STEAM Programs GraduatesAY 2009-10 to 2013-14*
Baccalaureate Level
79,898
34,181
83,692
41,417
43,996
-
10,000
20,000
30,000
40,000
50,000
60,000
70,000
80,000
90,000
2009-10 2010-11 2011-12 2012-13 2013-14
Graduates * Projected
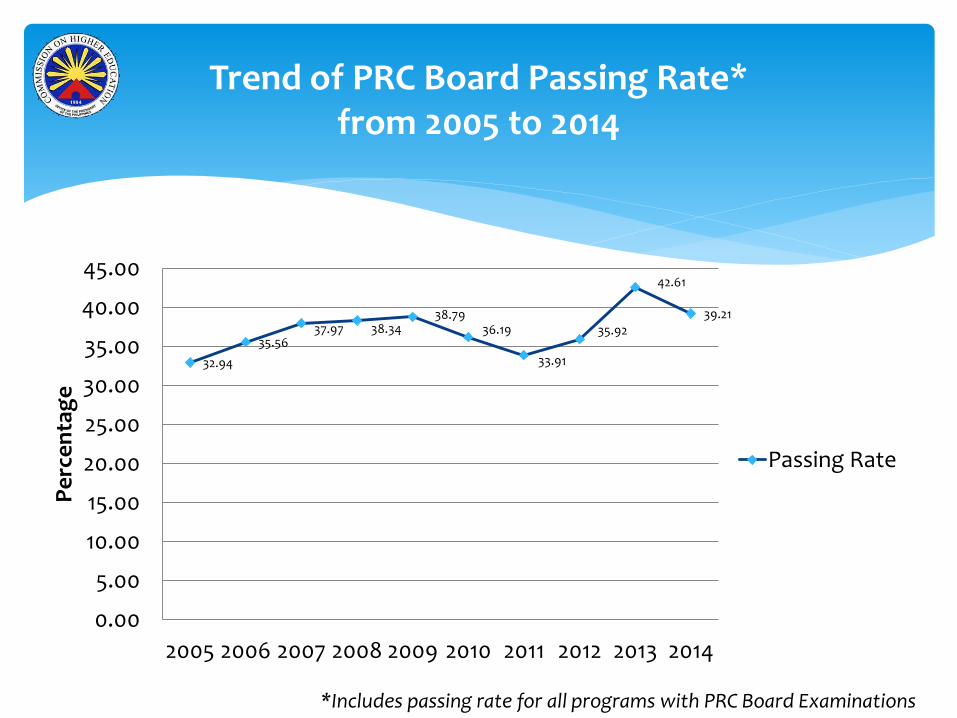
Trend of PRC Board Passing Rate*from 2005 to 2014
32.94
35.5637.97 38.34
38.7936.19
33.91
35.92
42.61
39.21
0.00
5.00
10.00
15.00
20.00
25.00
30.00
35.00
40.00
45.00
2005 2006 2007 2008 2009 2010 2011 2012 2013 2014
Pe
rce
nta
ge
Passing Rate
*Includes passing rate for all programs with PRC Board Examinations
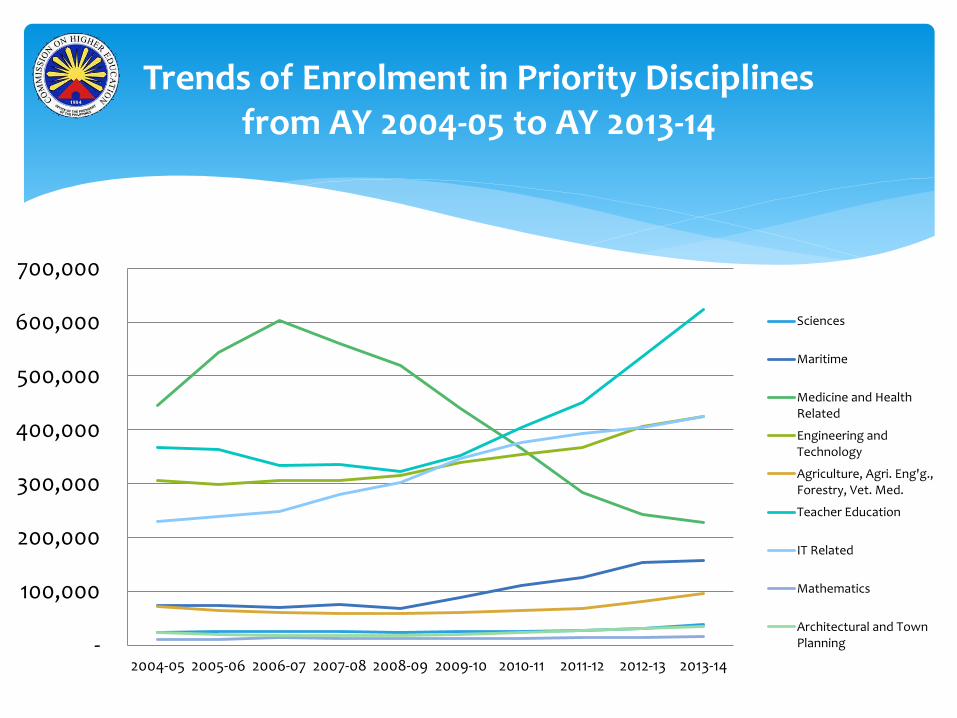
Trends of Enrolment in Priority Disciplinesfrom AY 2004-05 to AY 2013-14
-
100,000
200,000
300,000
400,000
500,000
600,000
700,000
2004-05 2005-06 2006-07 2007-08 2008-09 2009-10 2010-11 2011-12 2012-13 2013-14
Sciences
Maritime
Medicine and HealthRelated
Engineering andTechnology
Agriculture, Agri. Eng'g.,Forestry, Vet. Med.
Teacher Education
IT Related
Mathematics
Architectural and TownPlanning

Trends of Graduates in Priority Disciplinesfrom AY 2004-05 to AY 2013-14
-
20,000
40,000
60,000
80,000
100,000
120,000
140,000
2004-05 2005-06 2006-07 2007-08 2008-09 2009-10 2010-11 2011-12 2012-13 2013-14
Sciences
Maritime
Medicine and Health Related
Engineering and Technology
Agriculture, Agri. Eng'g.,Forestry, Vet. Med.
Teacher Education
IT Related
Mathematics
Architectural and TownPlanning
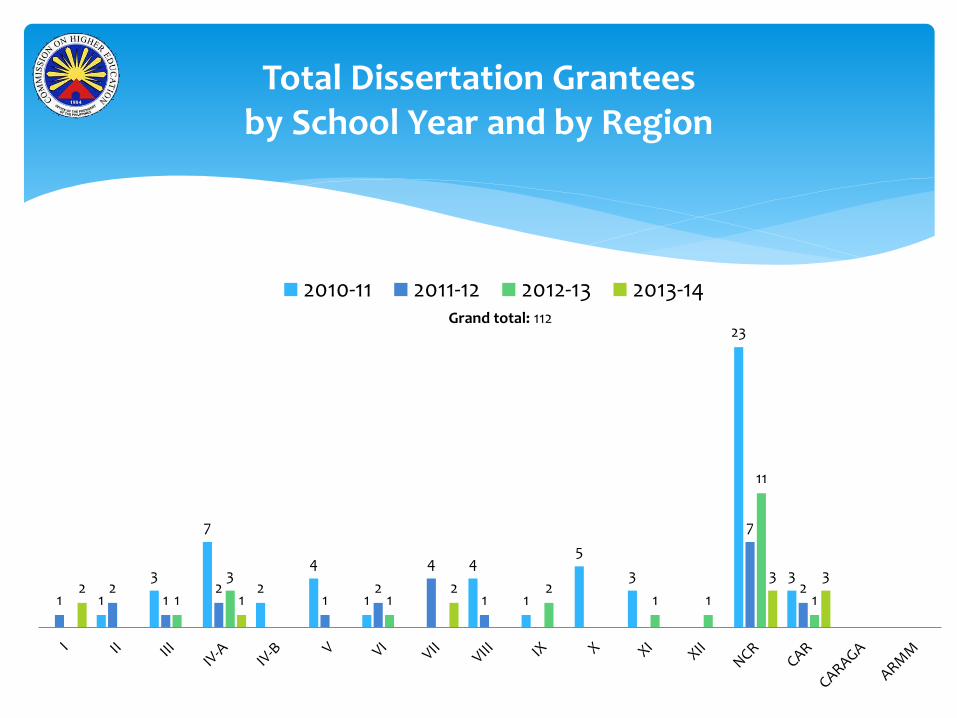
Total Dissertation Grantees by School Year and by Region
1
3
7
2
4
1
4
1
5
3
23
3
12
12
12
4
1
7
21
3
12
1 1
11
12
12
3 3
2010-11 2011-12 2012-13 2013-14Grand total: 112
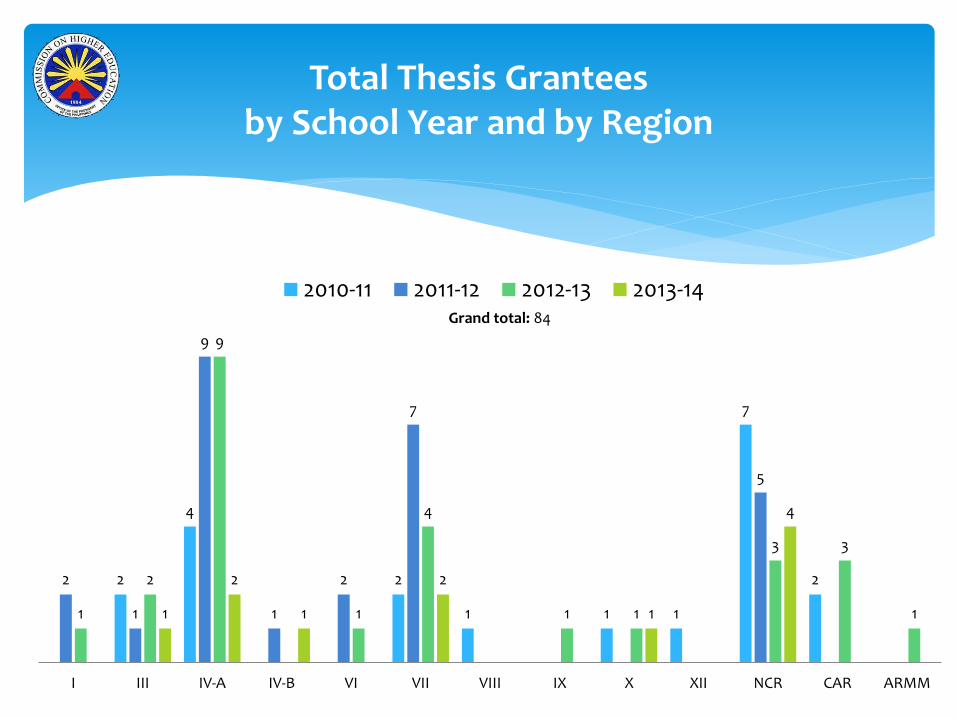
Total Thesis Grantees by School Year and by Region
2
4
2
1 1 1
7
22
1
9
1
2
7
5
1
2
9
1
4
1 1
3 3
11
2
1
2
1
4
I III IV-A IV-B VI VII VIII IX X XII NCR CAR ARMM
2010-11 2011-12 2012-13 2013-14Grand total: 84
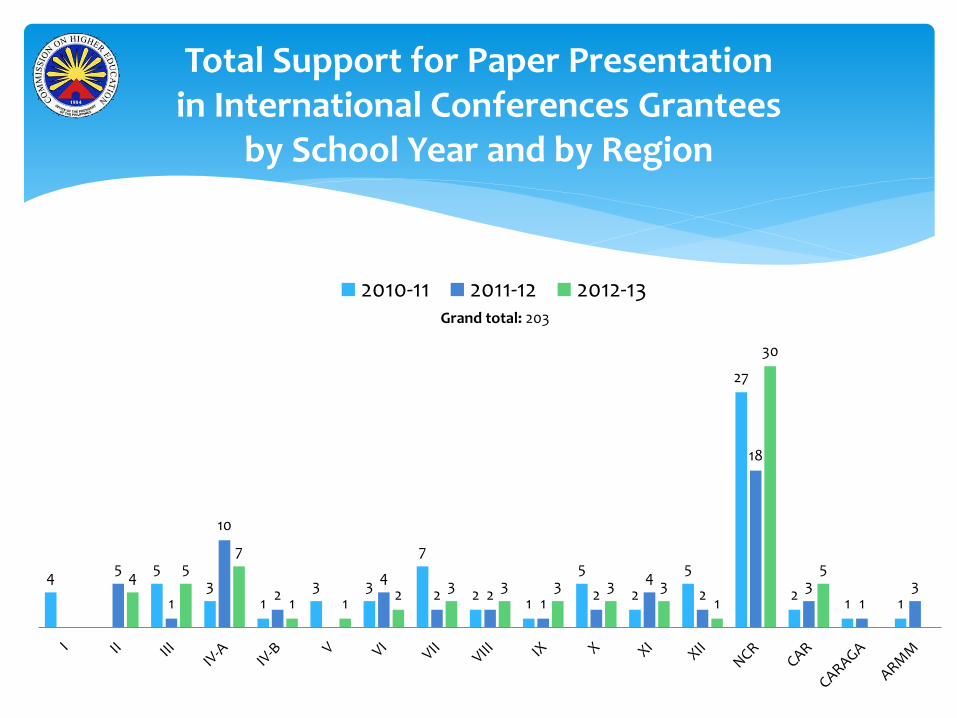
Total Support for Paper Presentation in International Conferences Grantees
by School Year and by Region
45
31
3 3
7
21
5
2
5
27
21 1
5
1
10
24
2 21
24
2
18
31
34
57
1 12
3 3 3 3 31
30
5
2010-11 2011-12 2012-13Grand total: 203
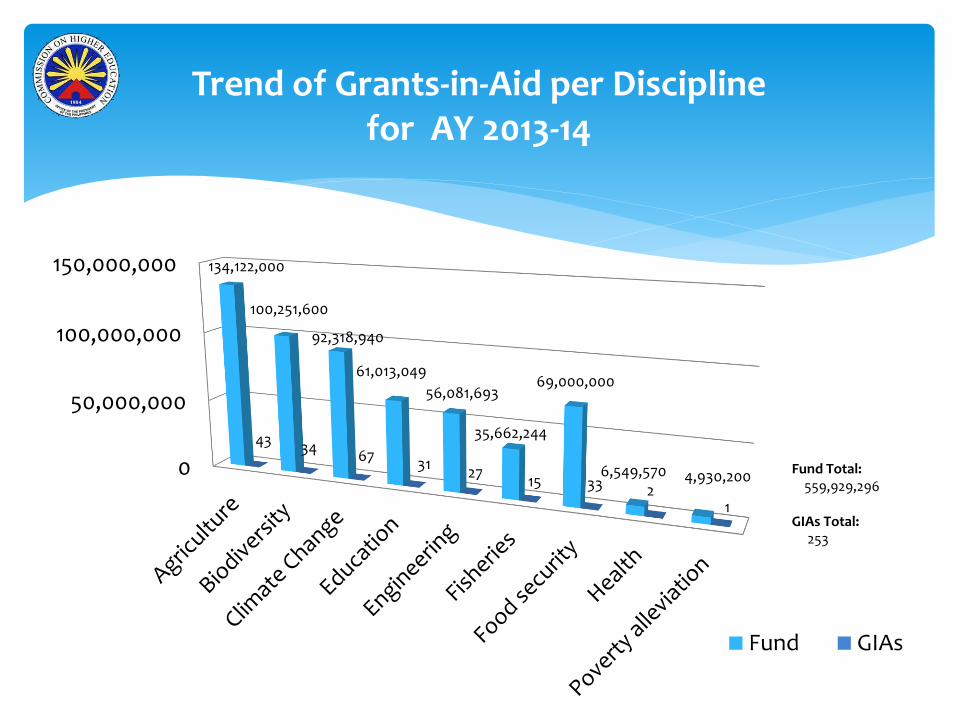
Trend of Grants-in-Aid per Disciplinefor AY 2013-14
0
50,000,000
100,000,000
150,000,000 134,122,000
100,251,600
92,318,940
61,013,049
56,081,693
35,662,244
69,000,000
6,549,570 4,930,200
43 3467
3127
15 33 21
Fund GIAs
Fund Total:559,929,296
GIAs Total:253