infographic data analytics for the first nine stages of the tour de france-2

1
38.55 km/h average speed of riders across nine stages 196.6 km average distance travelled each day 162.5 km (stage 7) shortest distance travelled in one day 237.5 km (stage 4) longest distance travelled in one day 44.35 km/h highest average speed on a stage (stage 1) 05h59’54’’ longest time on the saddle (stage 3) 5 abandons Stage 1-9: 2-10 July 2016 75 km longer than shortest distance 50% race distance covered 198 riders in 22 teams generate 42,000 geospatial points and 75 million GPS readings Rider data processed in our hybrid cloud solution, with over 100 virtual machines leveraging 300 unique cloud compute services delivered at 99.999% availability, to serve 55,000 requests per second Our cloud Instant computing power and scalability to deal with unpredictable race environment For more information Subscribe to receive the daily Analytics in Action blog Follow @letourdata for live race data Moving a data centre every day Dimension Data’s big data truck is fitted with cutting-edge technology and is the end-to-end hub for all tracking and analytics activities. It’s equipped to be a highly flexible and powerful mobile data centre. Total distance travelled so far Total hours spent on the road so far Metres of cables we’ve rolled out so far Total data processed so far (records) 2,099.5 km 30 hours 5,400 m 59.70 million First time in Tour history, stage 8 kicked-off with all the race starters. Five riders then dropped out over the weekend. The fight for the Yellow Jersey After nine stages covering 1,769.5 km, the riders have covered half the distance of this year’s Tour de France. Here’s a look at the stories we’ve collected on their journey so far. Stages 1-9 Conquering the Pyrenees Over three stages in the Pyrenees, the riders have climbed 9,000 metres – that’s higher than Mount Everest! 11 8.5% categorised climbs steepest average gradient on a climb so far on Col de Beixalis (stage 9) Steepest climbs in the Pyrenees Slowest recorded average speed 8.5% Col de Beixalis (stage 9) 8.2% Côte de la Comella (stage 9) 7.8% Col de Peyresourde (stage 8) 7.2% Andorre Arcalis (stage 9) 6.8% Col de Val Louron-Azet (stage 8) 13.6 km/h Col de Beixalis - 8.5% (stage 9) 13.8 km/h Col du Perthus - 7.9% (stage 5) 14.4 km/h Col de Peyresourde - 7.8% (stage 8) 15.5 km/h Côte de la Comella - 8.2% (stage 9) 15.8 km/h Andorre Arcalis - 7.2% (stage 9) Social media engagements top 3 shared data visualisations on @letourdata powered by Dimension Data 3. 1. 2. click to see tweet click to see tweet click to see tweet Average speed first nine stages average speed on each stage 44.35 km/h 41.51 km/h 37.21 km/h 43.19 km/h 36.96 km/h 40.20 km/h 39.84 km/h 34.08 km/h 32.41 km/h 1 4 7 2 5 8 3 6 9 Stage 1 Stage 1 Stage 2 Michael Morkov Number of riders involved 9 Speed of the riders 62 km/h Number of riders involved 3 Speed of the riders 62 km/h Number of riders involved 130 Speed of the riders 47.5 km/h Alberto Contador Alberto Contador Significant race crashes The injuries sustained from early crashes led to Michael Morkov and Alberto Contador abandoning the race in the Pyrenees. 4 total number of sprint finishes 74.27 km/h highest recorded speed on a sprint A mad dash in the sprints 74.27 km/h M. Kittel (EQS) – stage 6 69.95 km/h J. Degenkolb (TGA) – stage 1 68.8 km/h B. Coquard (DEN) – stage 4 66.6 km/h P. Sagan (TNK) – stage 2 62.14 km/h A. Greipel (LTS) – stage 3 Christopher Froome Mark Cavendish Team Dimension Data Stage 1 Stages 2, 3, 4 Stages 5, 6, 7 Stages 8, 9 Peter Sagan Tinkoff Greg Van Avermaet BMC Racing Team Christopher Froome Team Sky The four Yellow Jersey holders in the race so far: (39.67 km/h average speed over the nine stages) With 29 stages under his belt, he’s won the second most stages in Tour de France history. Mark Cavendish of Team Dimension Data for Qhubeka won stages 1, 3, and 6, and his first Yellow Jersey. Leading the Green Jersey points classification for six days. Following the Yellow Jersey Time in seconds Time difference between Yellow Jersey and runner-up by stage Stage 2 3 4 5 6 7 8 9 1 Yellow Jersey Runner-up 400 300 200 100 0 Mark Cavendish (DDD) Peter Sagan (TNK) Peter Sagan (TNK) Peter Sagan (TNK) Greg Van Avermaet (BMC) Greg Van Avermaet (BMC) Christopher Froome (SKY) Greg Van Avermaet (BMC) Christopher Froome (SKY) Marcel Kittel (EQS) Julian Alaphilippe (EQS) Julian Alaphilippe (EQS) Julian Alaphilippe (EQS) Julian Alaphilippe (EQS) Julian Alaphilippe (EQS) Adam Yates (OBE) Adam Yates (OBE) Adam Yates (OBE) Learn more about making the world’s first digital Tour de France on our microsite

Upload: fanny-vahl-kehren

Post on 17-Feb-2017

114 views

Category:

Data & Analytics


0 download

TRANSCRIPT

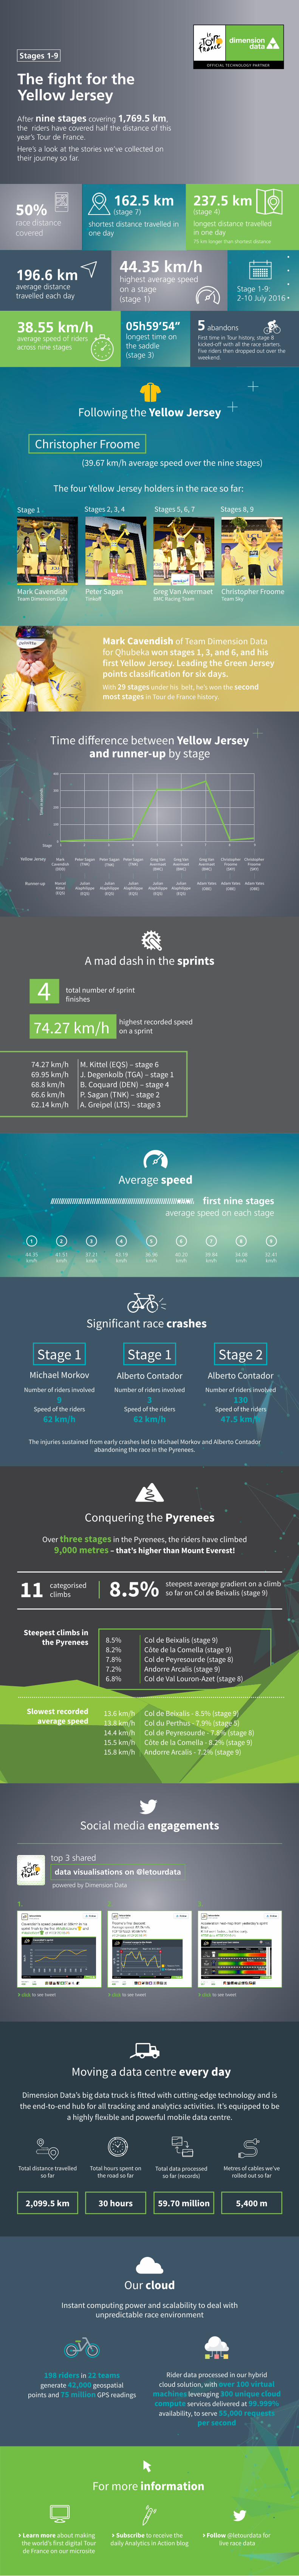
3855 kmh average speed of riders across nine stages

1966 kmaverage distance travelled each day

1625 km(stage 7)

shortest distance travelled in one day

2375 km(stage 4)

longest distance travelled in one day

4435 kmhhighest average speed on a stage(stage 1)

05h59rsquo54rsquorsquo longest time on the saddle(stage 3)

5 abandons

Stage 1-9 2-10 July 2016

75 km longer than shortest distance

50race distance covered

198 riders in 22 teams generate 42000 geospatial

points and 75 million GPS readings

Rider data processed in our hybrid cloud solution with over 100 virtual

machines leveraging 300 unique cloud compute services delivered at 99999

availability to serve 55000 requests per second

Our cloudInstant computing power and scalability to deal with

unpredictable race environment

For more information

Subscribe to receive the daily Analytics in Action blog

Follow letourdata for live race data

Moving a data centre every day

Dimension Datarsquos big data truck is fitted with cutting-edge technology and is the end-to-end hub for all tracking and analytics activities Itrsquos equipped to be

a highly flexible and powerful mobile data centre

Total distance travelled so far

Total hours spent on the road so far

Metres of cables wersquove rolled out so far

Total data processed so far (records)

20995 km 30 hours 5400 m5970 million

First time in Tour history stage 8 kicked-off with all the race starters Five riders then dropped out over the weekend

The fight for the Yellow JerseyAfter nine stages covering 17695 km the riders have covered half the distance of this yearrsquos Tour de France

Herersquos a look at the stories wersquove collected on their journey so far

Stages 1-9

Conquering the Pyrenees

Over three stages in the Pyrenees the riders have climbed 9000 metres ndash thatrsquos higher than Mount Everest

11 85categorised climbs

steepest average gradient on a climb so far on Col de Beixalis (stage 9)

Steepest climbs in the Pyrenees

Slowest recorded average speed

85 Col de Beixalis (stage 9)82 Cocircte de la Comella (stage 9)78 Col de Peyresourde (stage 8)72 Andorre Arcalis (stage 9)68 Col de Val Louron-Azet (stage 8)

136 kmh Col de Beixalis - 85 (stage 9)138 kmh Col du Perthus - 79 (stage 5)144 kmh Col de Peyresourde - 78 (stage 8)155 kmh Cocircte de la Comella - 82 (stage 9)158 kmh Andorre Arcalis - 72 (stage 9)

Social media engagements

top 3 shared

data visualisations on letourdata

powered by Dimension Data

31 2

click to see tweetclick to see tweet click to see tweet

Average speed

first nine stagesaverage speed on each stage

4435 kmh

4151kmh

3721 kmh

4319kmh

3696kmh

4020kmh

3984kmh

3408kmh

3241kmh

1 4 72 5 83 6 9

Stage 1 Stage 1 Stage 2 Michael Morkov

Number of riders involved 9

Speed of the riders 62 kmh

Number of riders involved 3

Speed of the riders 62 kmh

Number of riders involved 130

Speed of the riders 475 kmh

Alberto Contador Alberto Contador

Significant race crashes

The injuries sustained from early crashes led to Michael Morkov and Alberto Contador abandoning the race in the Pyrenees

4 total number of sprint finishes

7427 kmh highest recorded speed on a sprint

A mad dash in the sprints

7427 kmh M Kittel (EQS) ndash stage 66995 kmh J Degenkolb (TGA) ndash stage 1688 kmh B Coquard (DEN) ndash stage 4666 kmh P Sagan (TNK) ndash stage 26214 kmh A Greipel (LTS) ndash stage 3

Christopher Froome

Mark CavendishTeam Dimension Data

Stage 1 Stages 2 3 4 Stages 5 6 7 Stages 8 9

Peter SaganTinkoff

Greg Van AvermaetBMC Racing Team

Christopher FroomeTeam Sky

The four Yellow Jersey holders in the race so far

(3967 kmh average speed over the nine stages)

With 29 stages under his belt hersquos won the second most stages in Tour de France history

Mark Cavendish of Team Dimension Data for Qhubeka won stages 1 3 and 6 and his first Yellow Jersey Leading the Green Jersey points classification for six days

Following the Yellow Jersey

Tim

e in

seco

nds

Time difference between Yellow Jersey and runner-up by stage

Stage 2 3 4 5 6 7 8 91

Yellow Jersey

Runner-up

400

300

200

100

0

Mark Cavendish

(DDD)

Peter Sagan (TNK)

Peter Sagan (TNK)

Peter Sagan (TNK)

Greg Van Avermaet

(BMC)

Greg Van Avermaet

(BMC)

Christopher Froome

(SKY)

Greg Van Avermaet

(BMC)

Christopher Froome

(SKY)

Marcel Kittel(EQS)

Julian Alaphilippe

(EQS)

Julian Alaphilippe

(EQS)

Julian Alaphilippe

(EQS)

Julian Alaphilippe

(EQS)

Julian Alaphilippe

(EQS)

Adam Yates(OBE)

Adam Yates(OBE)

Adam Yates(OBE)

Learn more about making the worldrsquos first digital Tour de France on our microsite