influenza vaccine efficacy and effectiveness - otago.ac.nz · heath kelly victorian infectious...
TRANSCRIPT

Current thinking about influenza
vaccine efficacy and effectivenessUniversity of Otago, February 2012
Heath Kelly
Victorian Infectious Diseases Reference Laboratory
Australian National University

Acknowledgements
• Center for Infectious Disease Research and Policy, University of Minnesota, USA– Professor Michael Osterholm, Dr Nicholas Kelley
• Epiconcept, Paris, FranceDr Alain Moren, Dr Marta Valenciano,
Dr Esther Kissling
• Epidemiology Unit, VIDRL, Melbourne, Australia– James Fielding, Kristina Grant
Year Event
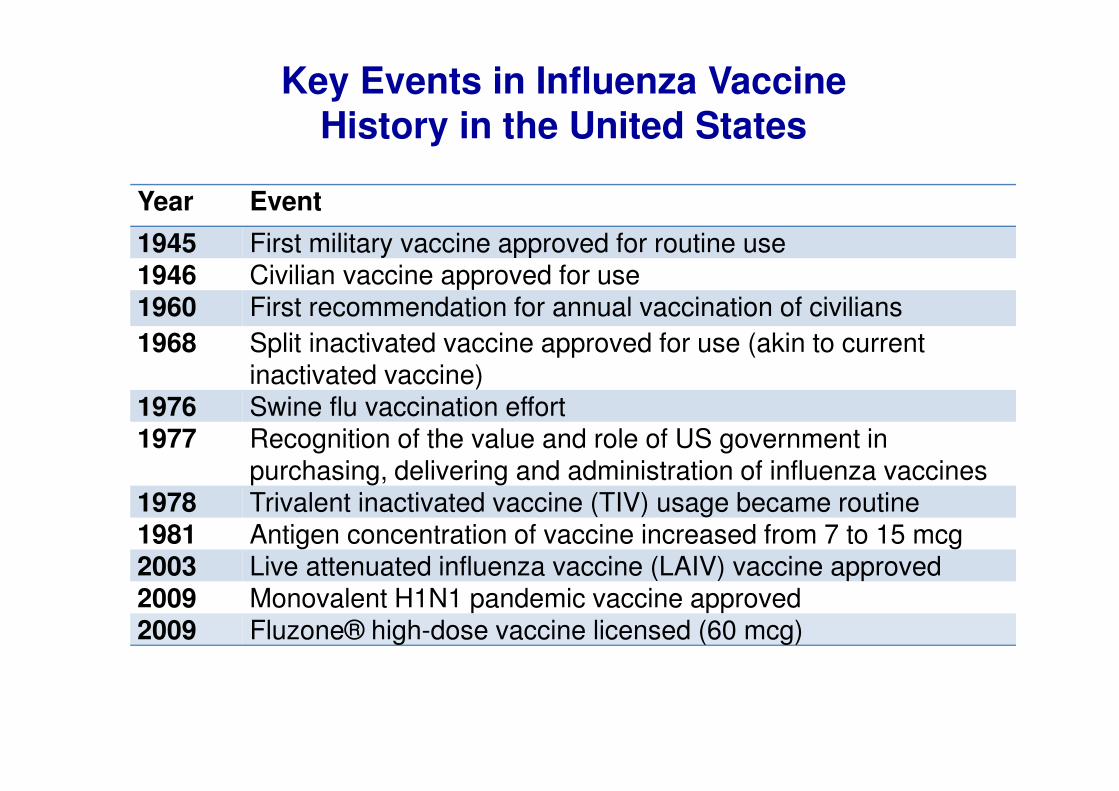
1945 First military vaccine approved for routine use 1946 Civilian vaccine approved for use1960 First recommendation for annual vaccination of civilians
1968 Split inactivated vaccine approved for use (akin to current inactivated vaccine)
1976 Swine flu vaccination effort1977 Recognition of the value and role of US government in
purchasing, delivering and administration of influenza vaccines1978 Trivalent inactivated vaccine (TIV) usage became routine1981 Antigen concentration of vaccine increased from 7 to 15 mcg2003 Live attenuated influenza vaccine (LAIV) vaccine approved2009 Monovalent H1N1 pandemic vaccine approved2009 Fluzone® high-dose vaccine licensed (60 mcg)
Key Events in Influenza Vaccine
History in the United States

Vaccine efficacy/effectiveness:(both abbreviated as VE)
Concept introduced as ‘protective efficacy’ by Greenwood and Yule, 1915
Proc Royal Soc Med 1915; 8 (part 2):113-94
Vaccine efficacy/effectiveness (VE)
• Percentage reduction in disease as a result of vaccination
• Compares disease outcome in
vaccinated and unvaccinated
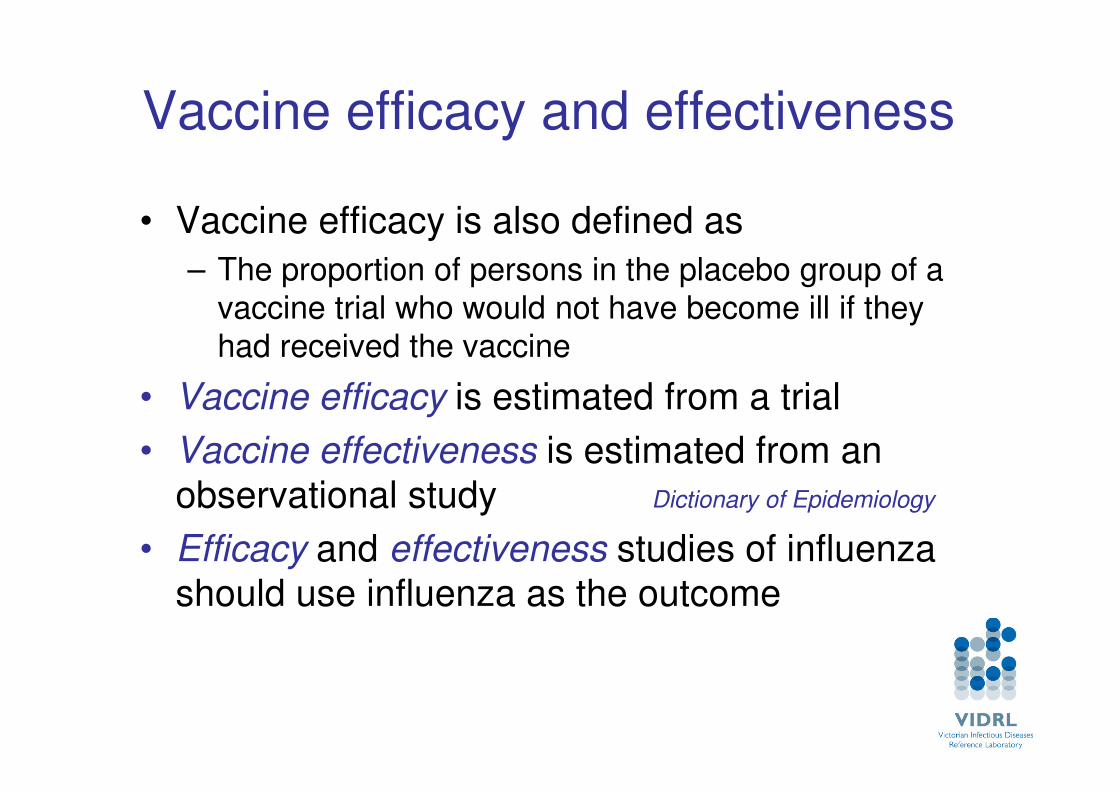
Vaccine efficacy and effectiveness
• Vaccine efficacy is also defined as
– The proportion of persons in the placebo group of a vaccine trial who would not have become ill if they had received the vaccine
• Vaccine efficacy is estimated from a trial
• Vaccine effectiveness is estimated from an
observational study Dictionary of Epidemiology
• Efficacy and effectiveness studies of influenza
should use influenza as the outcome

Hierarchy of Evidence
• Can it work? (Efficacy)
• Does it work? (Effectiveness)
• Is it worth it? (Cost effectiveness)
Professor Archie Cochrane
Pioneering Clinical Epidemiologist

Cochrane collaboration use of efficacy and effectiveness
• Cochrane review of influenza vaccine in adults aged 16-60 years
http://summaries.cochrane.org/CD001269/vaccines-to-prevent-influenza-in-healthy-adults
• Efficacy is protection against laboratory confirmed influenza
– Specific outcome– From trials or observational studies
• Effectiveness is protection against influenza-like illness (ILI)
– Non-specific outcome– From trials or observational studies
• Non-standard use of effectivenessKelly & Valenciano, Lancet ID 2011; October 26 online

Vaccine efficacy theoretical
example
RCT of participants followed for one year
• 1,000 vaccinated
– 80 with disease
• 1,000 unvaccinated
– 800 with disease
• What is VE?
– defined as the % reduction of cases among
the vaccinated group

VE theoretical calculation
• 80/1000 vaccinated cases
• 800/1000 unvaccinated cases
• Denominators are the same, so can ignore
• Reduction of cases due to vaccination = 800-80 = 720
• Percent reduction = 720/800 cases
• VE = 90%
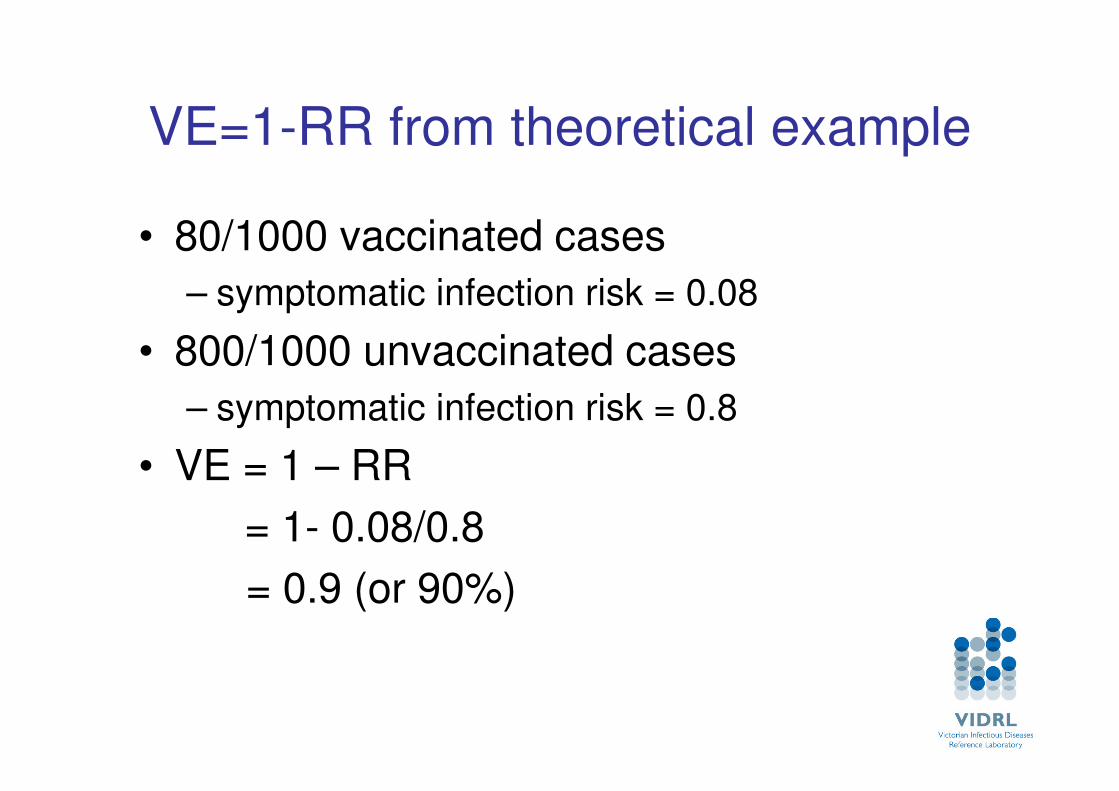
VE=1-RR from theoretical example
• 80/1000 vaccinated cases
– symptomatic infection risk = 0.08
• 800/1000 unvaccinated cases
– symptomatic infection risk = 0.8
• VE = 1 – RR
= 1- 0.08/0.8
= 0.9 (or 90%)

Study types and control selection
• Observational study designs used to estimate VE
• Control selection
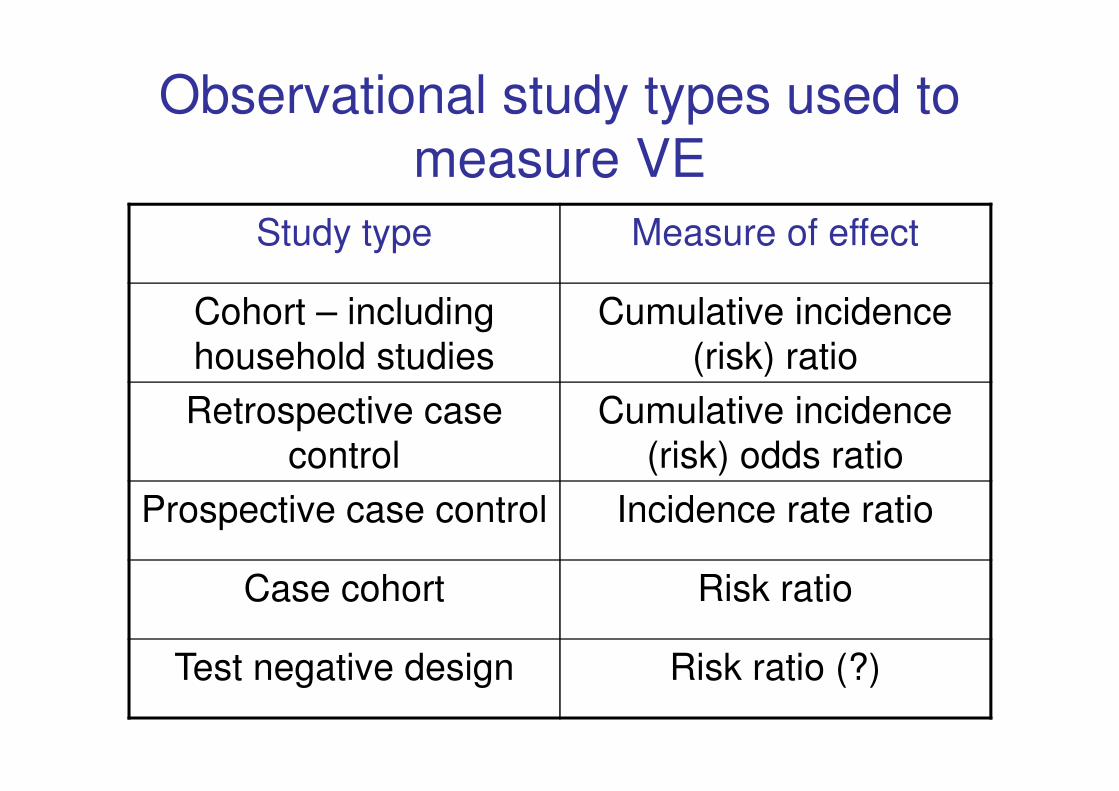
Observational study types used to
measure VE
Study type Measure of effect
Cohort – including
household studies
Cumulative incidence
(risk) ratio
Retrospective case
control
Cumulative incidence
(risk) odds ratio
Prospective case control Incidence rate ratio
Case cohort Risk ratio
Test negative design Risk ratio (?)
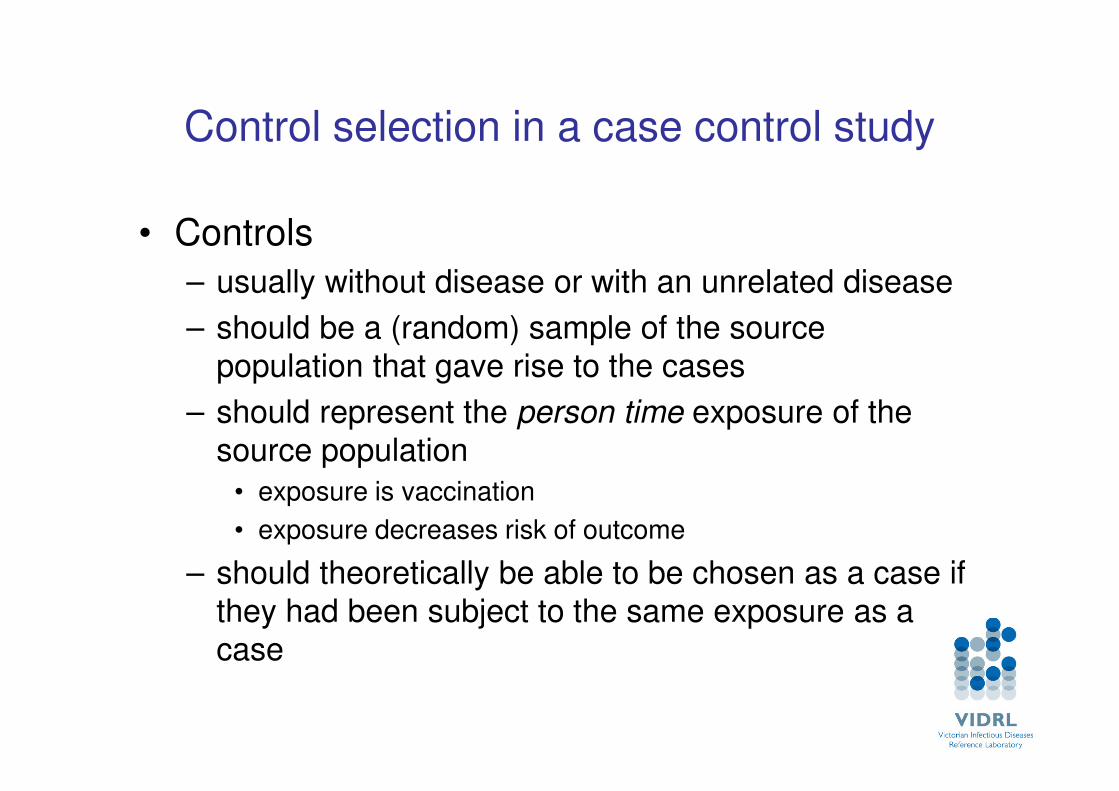
Control selection in a case control study
• Controls
– usually without disease or with an unrelated disease
– should be a (random) sample of the source population that gave rise to the cases
– should represent the person time exposure of the source population
• exposure is vaccination
• exposure decreases risk of outcome
– should theoretically be able to be chosen as a case if they had been subject to the same exposure as a case

CasesExposed
Unexposed
Source population
Controls:
Sample of the denominator
Representative with
regard to exposure
Controls
Sample

The test negative design
• Derives its name from control selection
• Based on the case control design
• Can be retrospective or prospective– as is true for a case control study
• Cases have a clinical syndrome and test positive for the disease of interest
• Controls have the same clinical syndrome but test negative for the same disease– test specificity is critical
Orenstein et al, IJE 2007; 36:623-31

Brief remarks on methodological
issues
• Immunogenicity is not VE
• Study endpoints
• Differences in vaccines by manufacturer

Immunogenicity is not effectiveness
• Immunogenicity– Quantification of immune response– For influenza vaccines, quantification is for humoral
(not cellular) immunity usually by haemagglutination inhibition (HI) assay
– Influenza vaccines are licensed annually on specific criteria
• 70% of a sample of adults achieving 4-fold rise in titre or an HI titre of >40
• HI titre of 40 shown to protect ~50% of volunteers in challenge studies from 1970s
• Immunogenicity is not effectiveness Kelly & Barr, Lancet 2010; 375:6-9
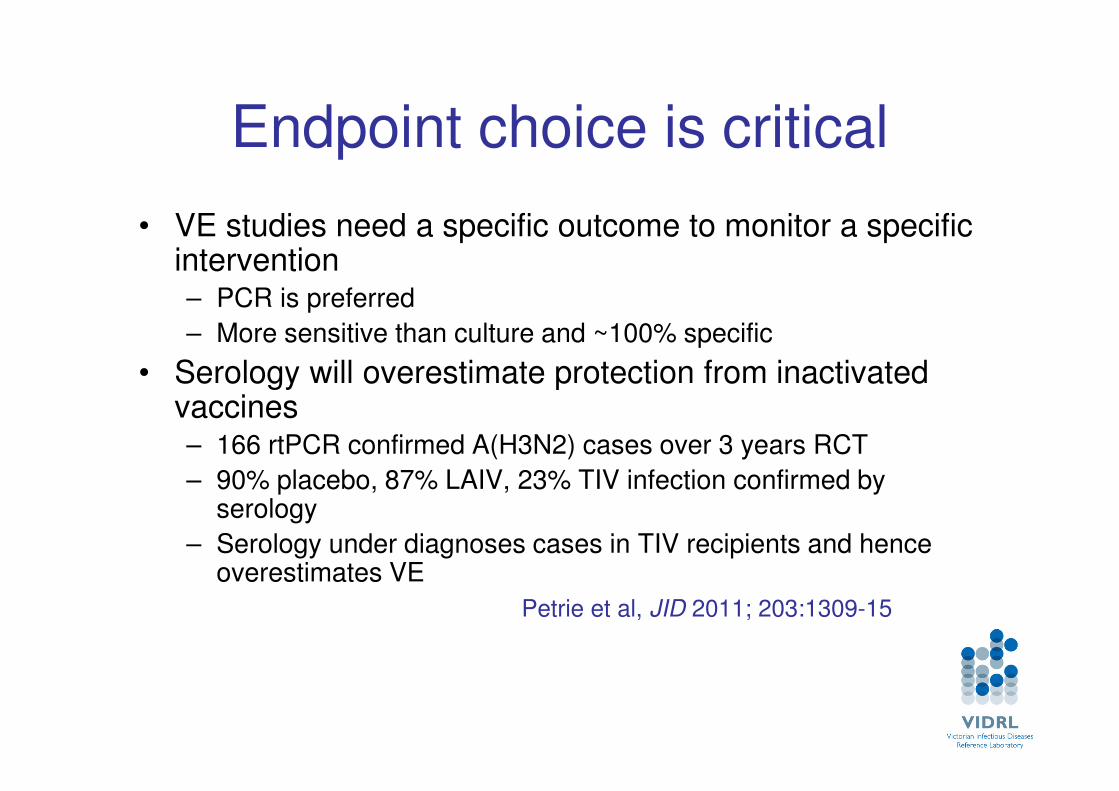
Endpoint choice is critical
• VE studies need a specific outcome to monitor a specific intervention– PCR is preferred
– More sensitive than culture and ~100% specific
• Serology will overestimate protection from inactivated vaccines– 166 rtPCR confirmed A(H3N2) cases over 3 years RCT
– 90% placebo, 87% LAIV, 23% TIV infection confirmed by serology
– Serology under diagnoses cases in TIV recipients and hence overestimates VE
Petrie et al, JID 2011; 203:1309-15

Vaccine types may not be interchangeable
• Licensed vaccine types– Trivalent or monovalent (pH1N1)– Inactivated
• With/without adjuvant• Split vaccines• Sub-unit vaccines – H and N
– Live attenuated vaccines
• Immunogenicity/effectiveness within vaccine type assumed similar for different manufacturers
• May not always be a valid assumption– Assumption proven not valid for safety
Armstrong et al, BMJ Open 2011; 1:e100006

Influenza VE studies in Australia

WAIVE
– Western Australia Influenza Vaccine Effectiveness study
– Established to estimate VE as part of evaluation of state-wide influenza vaccine program for children 6-59 months in WA
– Implemented in 2008 after 3 deaths in 0-4 year olds associated with influenza in 2007
– General Practice (GP), Emergency Department (ED) and hospital inpatient components
– Test negative design in GP/ED
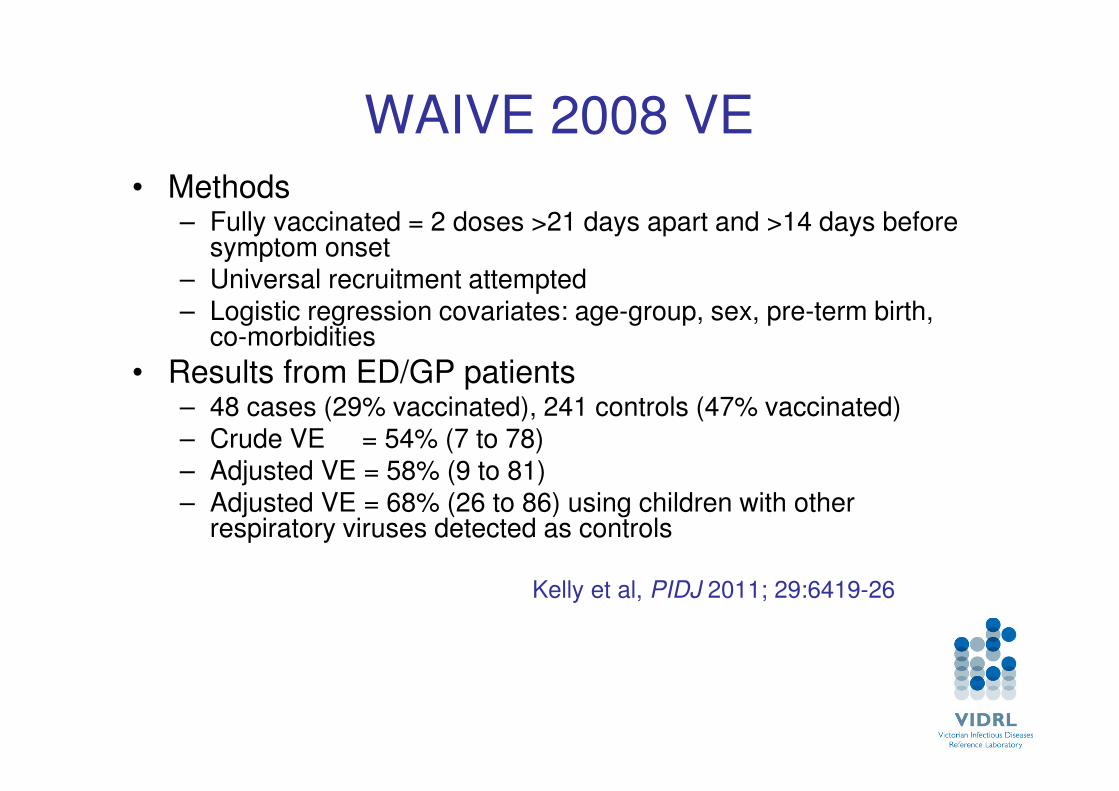
WAIVE 2008 VE
• Methods – Fully vaccinated = 2 doses >21 days apart and >14 days before
symptom onset– Universal recruitment attempted– Logistic regression covariates: age-group, sex, pre-term birth,
co-morbidities
• Results from ED/GP patients– 48 cases (29% vaccinated), 241 controls (47% vaccinated)– Crude VE = 54% (7 to 78)– Adjusted VE = 58% (9 to 81)– Adjusted VE = 68% (26 to 86) using children with other
respiratory viruses detected as controls
Kelly et al, PIDJ 2011; 29:6419-26
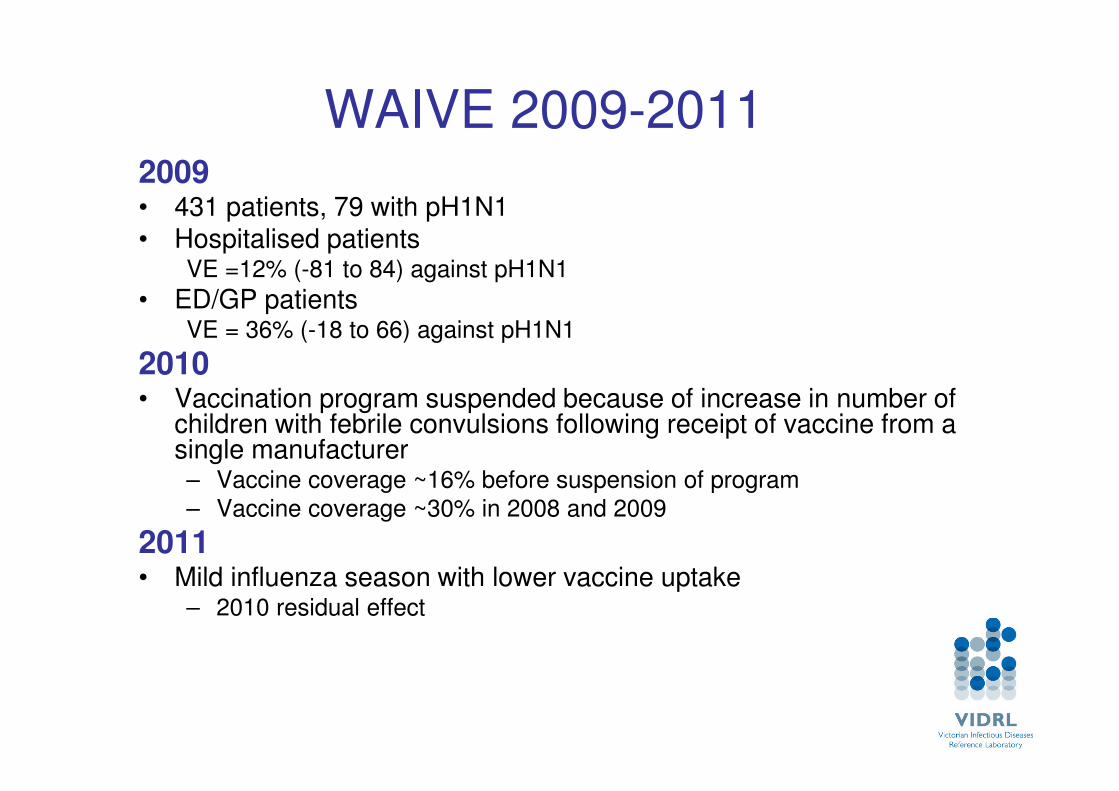
WAIVE 2009-20112009• 431 patients, 79 with pH1N1 • Hospitalised patients
VE =12% (-81 to 84) against pH1N1
• ED/GP patientsVE = 36% (-18 to 66) against pH1N1
2010• Vaccination program suspended because of increase in number of
children with febrile convulsions following receipt of vaccine from a single manufacturer– Vaccine coverage ~16% before suspension of program
– Vaccine coverage ~30% in 2008 and 2009
2011 • Mild influenza season with lower vaccine uptake
– 2010 residual effect

FluCAN VE study design
• InFluenza Complications Alert Network
• 2010 VE study: 15 hospitals, all states
– N =182 cases and controls needed to estimate VE =50% (vs VE=0% with 90% power)
• Test negative design in hospitalised patients
– Data on demographics, co-morbidities, previous seasonal influenza vaccine (5 years) and previous pneumococcal vaccine
– Testing for influenza was physician dependent
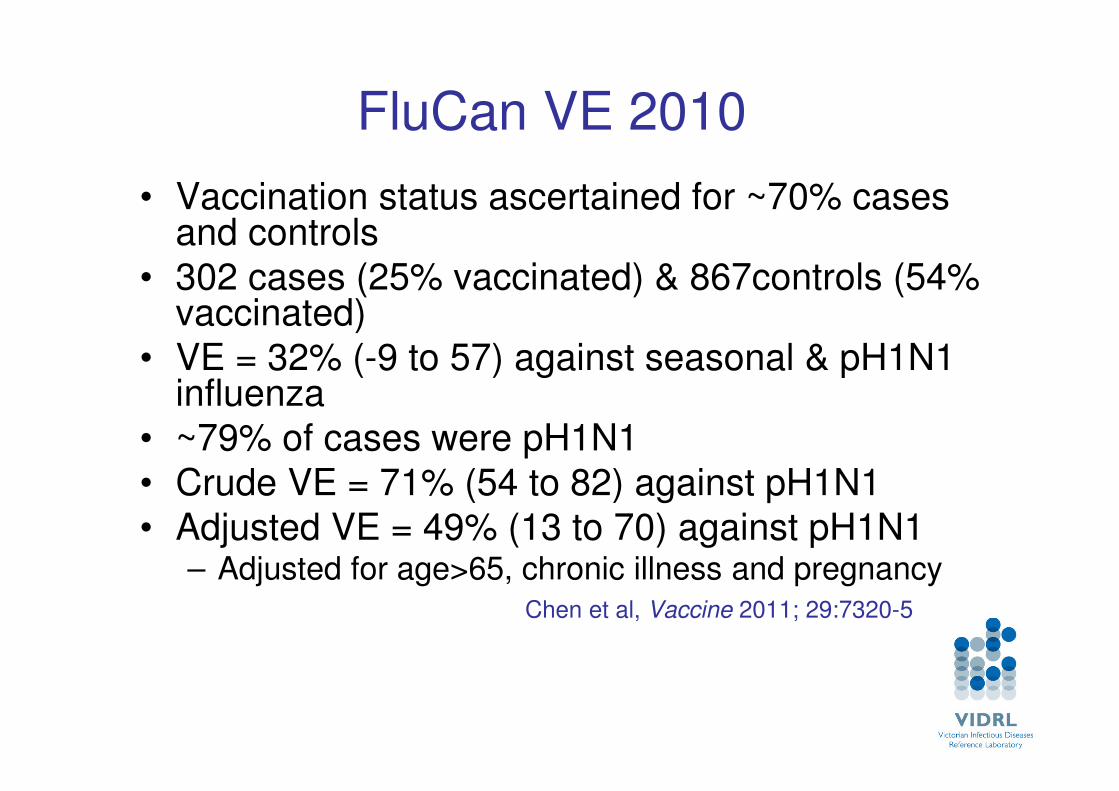
FluCan VE 2010
• Vaccination status ascertained for ~70% cases and controls
• 302 cases (25% vaccinated) & 867controls (54% vaccinated)
• VE = 32% (-9 to 57) against seasonal & pH1N1 influenza
• ~79% of cases were pH1N1
• Crude VE = 71% (54 to 82) against pH1N1
• Adjusted VE = 49% (13 to 70) against pH1N1– Adjusted for age>65, chronic illness and pregnancy
Chen et al, Vaccine 2011; 29:7320-5
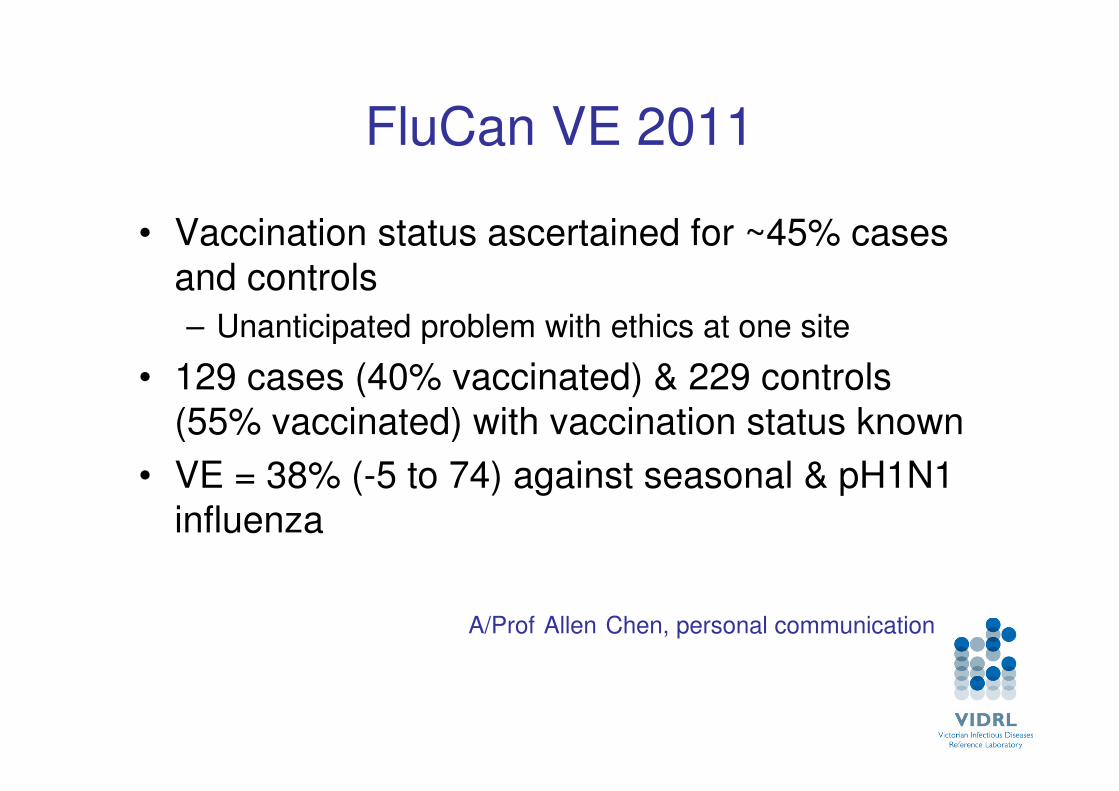
FluCan VE 2011
• Vaccination status ascertained for ~45% cases
and controls
– Unanticipated problem with ethics at one site
• 129 cases (40% vaccinated) & 229 controls
(55% vaccinated) with vaccination status known
• VE = 38% (-5 to 74) against seasonal & pH1N1
influenza
A/Prof Allen Chen, personal communication
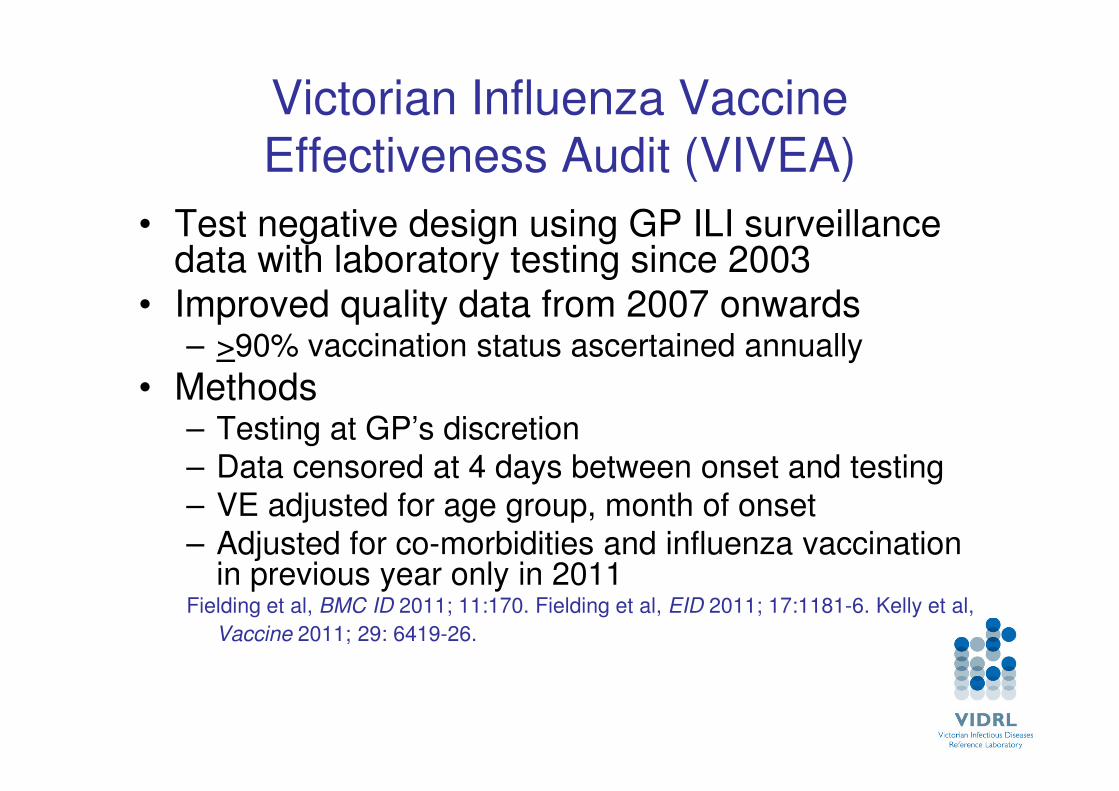
Victorian Influenza Vaccine Effectiveness Audit (VIVEA)
• Test negative design using GP ILI surveillance data with laboratory testing since 2003
• Improved quality data from 2007 onwards– >90% vaccination status ascertained annually
• Methods– Testing at GP’s discretion– Data censored at 4 days between onset and testing– VE adjusted for age group, month of onset– Adjusted for co-morbidities and influenza vaccination
in previous year only in 2011Fielding et al, BMC ID 2011; 11:170. Fielding et al, EID 2011; 17:1181-6. Kelly et al,
Vaccine 2011; 29: 6419-26.
0
20
40
60
80
100
120
140
18
19
20
21
22
23
24
25
26
27
28
29
30
31
32
33
34
35
36
37
38
39
40
18
19
20
21
22
23
24
25
26
27
28
29
30
31
32
33
34
35
36
37
38
39
40
18
19
20
21
22
23
24
25
26
27
28
29
30
31
32
33
34
35
36
37
38
39
40
18
19
20
21
22
23
24
25
26
27
28
29
30
31
32
33
34
35
36
37
38
39
40
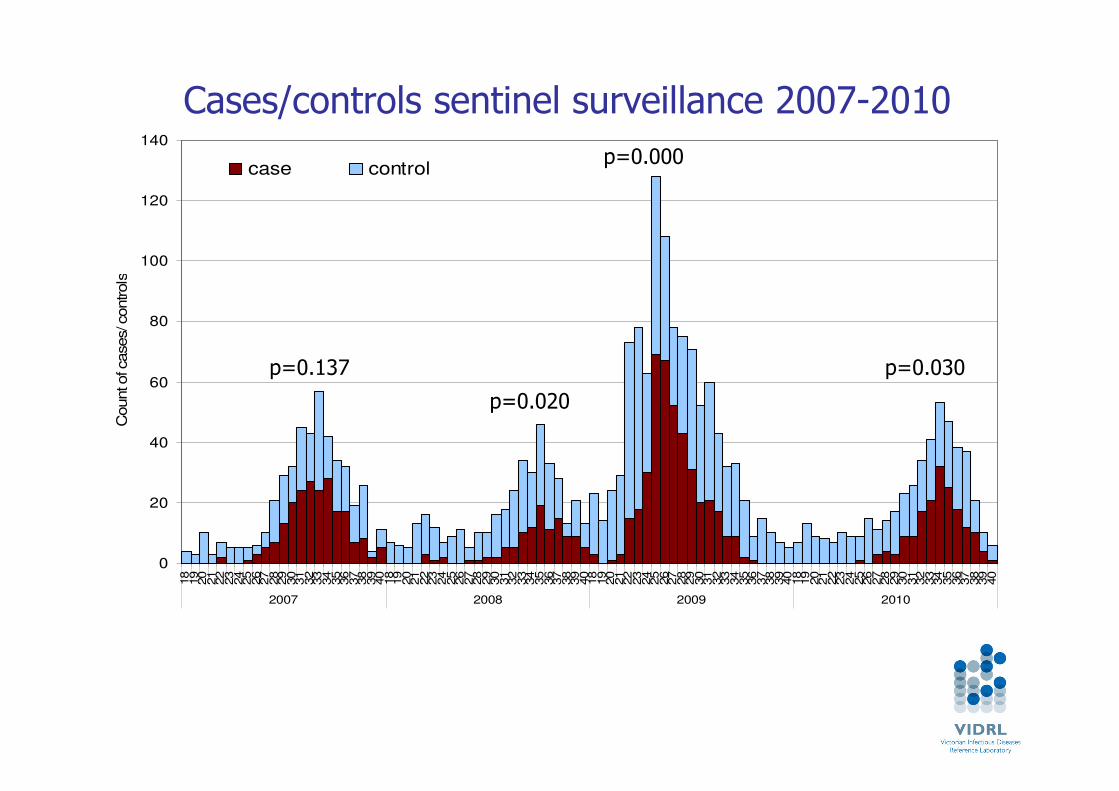
2007 2008 2009 2010
Count of cases/ controls
case control
p=0.137
p=0.020
p=0.000
p=0.030
Cases/controls sentinel surveillance 2007-2010

VIVEA results 2007-11
Year Cases Controls Crude VE Adjusted
VE
2007 194 192 57%
(27 to 75)
59% (25 to 78)
2008 106 224 26% (-40 to 61)
9% (-96 to 58)
2009 267 476 19% (-20 to 45)
3% (-48 to 37)
2010 139 180 80% (39 to 93)
79%
(33 to 93)
2011 155 374 60% (19 to 80)
57% (-11 to 83)

VIVEA summary
• >67% of sentinel patients in age range 20-64 years
• For 20-64 year age group for 2007-11 excluding 2009 (pandemic) – VE = 64% (23 to 75) with additional
adjustment for year
• Limitations of observational studies in general and TND in particular– Compare with Australian RCT

CSL vaccine trial
• RCT 2008-9, influenza vaccine vs placebo
• Multi centre trial, Australia & NZ until Nov 2009
• Healthy adults 18-64 years
• 9827 vaccine, 4907 placebo recipients
• Outcome: ILI due to lab confirmed influenza
• VE = 60% (44 to 72) when match was good
• VE = 42% (30 to 52) for both years– 2009 mostly pH1N1
http://clinicaltrials.gov/ct2/show/NCT00562484?term=CSL+influenza&rank=4
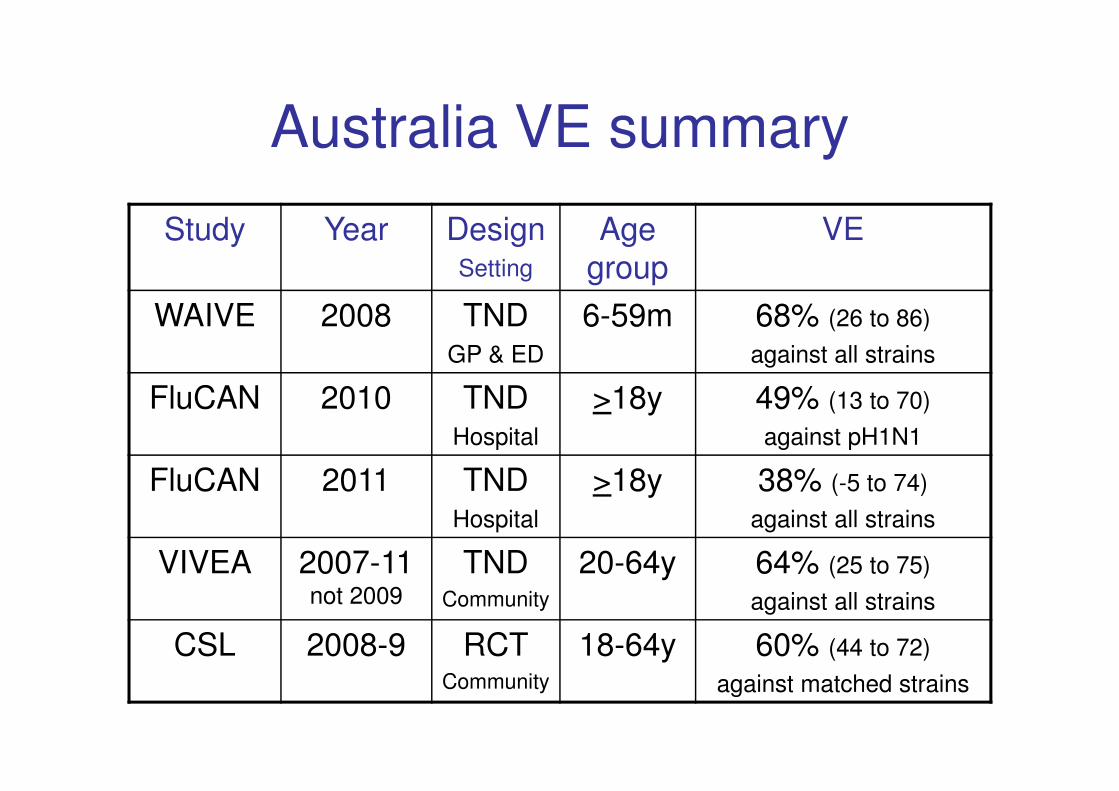
Australia VE summary
Study Year DesignSetting
Age group
VE
WAIVE 2008 TNDGP & ED
6-59m 68% (26 to 86)
against all strains
FluCAN 2010 TNDHospital
>18y 49% (13 to 70)
against pH1N1
FluCAN 2011 TNDHospital
>18y 38% (-5 to 74)
against all strains
VIVEA 2007-11 not 2009
TNDCommunity
20-64y 64% (25 to 75)
against all strains
CSL 2008-9 RCTCommunity
18-64y 60% (44 to 72)
against matched strains

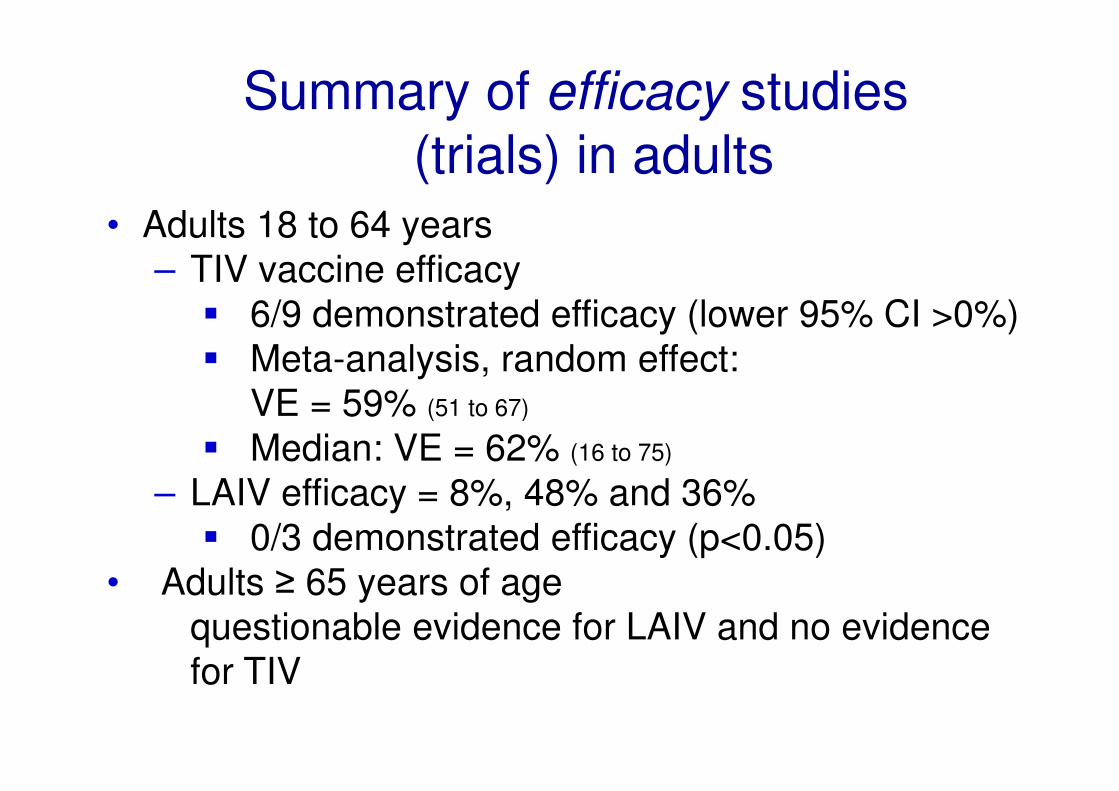
Summary of efficacy studies
(trials) in adults
• Adults 18 to 64 years
– TIV vaccine efficacy
� 6/9 demonstrated efficacy (lower 95% CI >0%)
� Meta-analysis, random effect:
VE = 59% (51 to 67)
� Median: VE = 62% (16 to 75)
– LAIV efficacy = 8%, 48% and 36%
� 0/3 demonstrated efficacy (p<0.05)
• Adults ≥ 65 years of age
questionable evidence for LAIV and no evidence
for TIV
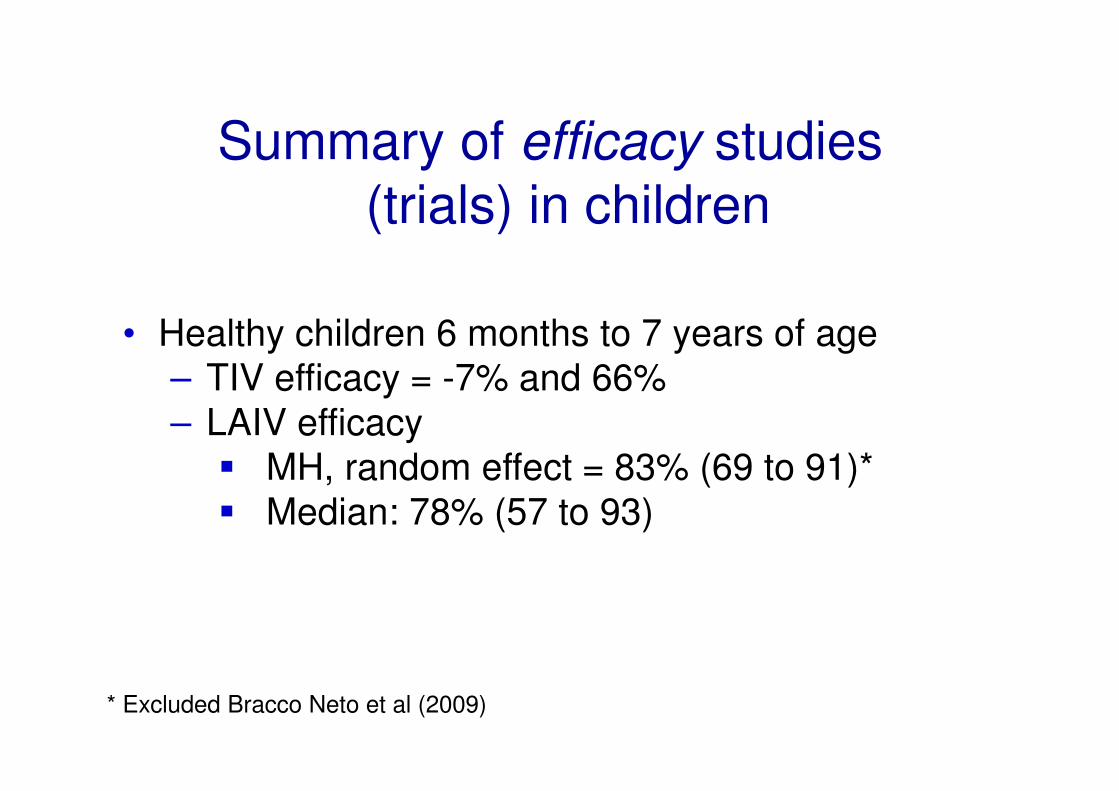
Summary of efficacy studies
(trials) in children
• Healthy children 6 months to 7 years of age
– TIV efficacy = -7% and 66%
– LAIV efficacy
� MH, random effect = 83% (69 to 91)*
� Median: 78% (57 to 93)
* Excluded Bracco Neto et al (2009)

Summary of effectiveness
studies (observational)Seasonal Influenza
• 6/17 (35%) demonstrated effectiveness
• VE for medically-attended influenza, adults
– 2003-2008: median 44% (7 to 72)
• VE for medically-attended influenza, adults ≥ 65
years
– 79% (-26 to 96) and 59% (15 to 80)
• VE for hospitalization adults ≥ 50 years of age
– 1 study over 3 years without significant protection
for any season

IMOVE
I-MOVE: Monitoring IVE in EU and EEAStudies since 2008/9
Multi-centre case control
8 flu VE case-control studiesin 2010/11 season
Very similar protocols pooled analysis
– To obtain summary, preliminary VE measures
– To enable controlling for all covariates

Sample size for complete case and imputed
datasets, multi-centre case control study, EU,
2010-11
Total records:
4410
No missing seasonal
vaccination data:
4390
No missing data for
covariates:
3254
Multiple imputation data:4410
Complete case
analysis

ILI influenza positive and negative cases,
by week of symptom onset (N=4410),
multi-centre case control study, EU, 2010-11
0
50
100
150
200
250
300
45 46 47 48 49 50 51 52 1 2 3 4 5 6 7 8 9 10 11 12 13 14 15
N
ISO week of symptom onset, 2010 and 2011
Controls
Any flu cases

VE of seasonal vaccine against all influenza, imputed
analysis, multi-centre case control study, EU, 2010-11
* Study site in model as a fixed effect
‡ adjusted for 10 year age groups, sex, week of onset, chronic diseases and related hospitalisations, smoking, pandemic and
seasonal influenza vaccination in 2009-10 and number of practitioner visits in the previous year
64
52
68
55
66
50
0
20
40
60
80
100
Crude* Adjusted‡ Crude* Adjusted‡ Crude* Adjusted‡
All influenza (N=4410) H1N1 (N=3344) B (N=2944)
VE
%
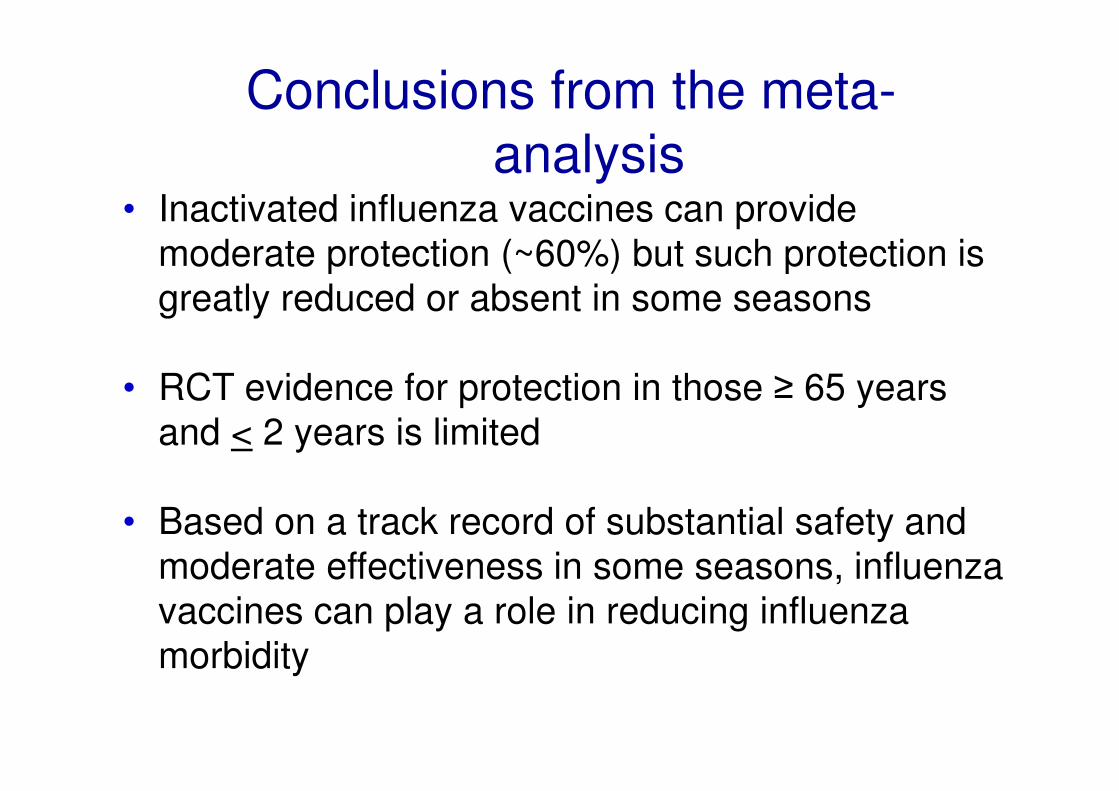
Conclusions from the meta-
analysis• Inactivated influenza vaccines can provide
moderate protection (~60%) but such protection is
greatly reduced or absent in some seasons
• RCT evidence for protection in those ≥ 65 years
and < 2 years is limited
• Based on a track record of substantial safety and
moderate effectiveness in some seasons, influenza
vaccines can play a role in reducing influenza
morbidity
Discussion
• Future influenza vaccines that use the same or
similar hemagglutinin antigen regardless of
production methods may not provide any more
protection than current vaccines
• We need a new generation of more highly effective
and cross-protective vaccines that can be
manufactured rapidly
• Observational study designs need continued
improvement in order to monitor effectiveness of
new generation vaccines when available
