influences of mesoscale anticyclonic eddies on the ... · haida eddies appear west of haida gwaii...
TRANSCRIPT

Instructions for use
Title Influences of mesoscale anticyclonic eddies on the zooplankton community south of the western Aleutian Islandsduring the summer of 2010
Author(s) Saito, Rui; Yamaguchi, Atsushi; Yasuda, Ichiro; Ueno, Hiromichi; Ishiyama, Hiromu; Onishi, Hiroji; Imai, Ichiro
Citation Journal of plankton research, 36(1), 117-128https://doi.org/10.1093/plankt/fbt087
Issue Date 2014-01
Doc URL http://hdl.handle.net/2115/57138
RightsThis is a pre-copy-editing, author-produced PDF of an article accepted for publication in Journal of Plankton Researchfollowing peer review. The definitive publisher-authenticated version J. Plankton Res. (January/February 2014) 36 (1):117-128. is available online at:http://plankt.oxfordjournals.org/cgi/content/full/fbt087?ijkey=XsssmgLRwbO2kGH&keytype=ref
Type article (author version)
File Information Saito_et_al_2014_J_Plankton_Res_2.pdf
Hokkaido University Collection of Scholarly and Academic Papers : HUSCAP

1
Influences of mesoscale anticyclonic eddies on the zooplankton community south of the 1
western Aleutian Islands during the summer of 20102
Rui Saito1*, Atsushi Yamaguchi1, Ichiro Yasuda2, Hiromichi Ueno3,4, Hiromu Ishiyama4, Hiroji 3
Onishi3, Ichiro Imai14
1Plankton Laboratory, Graduate School of Fisheries Sciences, Hokkaido University, 311 5
Minato-cho, Hakodate, Hokkaido, 0418611, Japan6
2Fisheries Environmental Oceanography Laboratory, Atmosphere and Ocean Research Institute, 7
The University of Tokyo, 511 Kashiwanoha, Kashiwa, Chiba, 2778564, Japan8
3Physical Environmental Science Laboratory, Faculty of Fisheries Sciences, Hokkaido University, 9
311 Minato-cho, Hakodate, Hokkaido, 0418611, Japan10
4Course in Marine Biogeochemistry and Physics, Graduate School of Environmental Science, 11
Hokkaido University, North 10, West 5, Kita-ku, Sapporo, Hokkaido, 0600810, Japan12
*Corresponding author: Rui Saito. E-mail address: [email protected]
Present address: Fisheries Environmental Oceanography Laboratory, Atmosphere and Ocean 14
Research Institute, The University of Tokyo, 511 Kashiwanoha, Kashiwa, Chiba, 2778564, 15
Japan16
Telephone number: 81471366244; Fax number: 8147136624717
“This is a pre-copy-editing, author-produced PDF of an article accepted for publication in Journal 18
of Plankton Research following peer review. The definitive publisher-authenticated version J. 19
Plankton Res. (January/February 2014) 36 (1): 117-128. is available online at: 20
http://plankt.oxfordjournals.org/cgi/content/full/fbt087?ijkey=XsssmgLRwbO2kGH&keytype=ref ”21

2
Abstract22
Mesoscale anticyclonic eddies have been observed south of the Aleutian Islands. Eddies 23
farther east, in the Gulf of Alaska, are known to transport coastal water and coastal zooplankton to 24
offshore open ocean. The impacts of mesoscale anticyclonic eddies formed south of the western 25
Aleutian Islands (Aleutian eddies) on the zooplankton community are not fully understood. In the 26
present study, we describe zooplankton population structures within an Aleutian eddy and outside 27
the eddy during July 2010. Based on the sea level anomaly, the Aleutian eddy was formed south 28
of Attu Island (17254E) in February 2010, and it moved southeastward in the next five months. 29
Large oceanic copepods, Neocalanus cristatus, Eucalanus bungii and Metridia pacifica were more 30
abundant inside the eddy than the outside. Inside the eddy, the life stage distribution of N. 31
cristatus was advanced than that outside, and Neocalanus spp. had accumulated more lipids. 32
These conditions probably reflect the greater primary production in the eddy, production enhanced 33
by nutrients advected into the eddy. The Aleutian eddy contained mostly oceanic copepods 34
because it was formed in the offshore water and/or eddy-eddy interaction occurred after its 35
formation. The sufficient food condition in the eddy presumably induced higher growth and 36
survival rates of these oceanic copepods, resulting in the greater abundance, advanced development37
stages and greater lipid accumulation.38
Keywords: mesoscale anticyclonic eddies; Aleutian eddies; zooplankton; calanoid copepods39

3
Introduction40
The Alaskan Stream is the northern boundary current of the North Pacific Subarctic Gyre, 41
flowing westward along the shelf break and the Aleutian Trench, south of the Alaska Peninsula and 42
the Aleutian Islands (Favorite, 1967; Ohtani et al., 1997; Reed and Stabeno, 1999). The Alaskan 43
Stream connects the Alaskan Gyre, the Bering Sea Gyre and the Western Subarctic Gyre (Onishi, 44
2001).45
Along the coasts of the Gulf of Alaska and the Aleutian Islands, several types of mesoscale 46
anticyclonic eddies are known to be formed (Fig. 1A). Haida eddies appear west of Haida Gwaii 47
(formerly called the Queen Charlotte Islands at 5300N, 13200W) and Alexander Archipelago48
(5640N, 13405W), and propagate northwestward into the central Gulf of Alaska (Crawford et al., 49
2000; Crawford, 2002, 2005). Sitka eddies form off Sitka, Alaska (5703N, 13519W), and 50
propagate northwestward (Crawford et al., 2000; Rovegno et al., 2009). Yakutat eddies appear in 51
the northern Gulf of Alaska, off Yakutat, Alaska (5945N, 14042W) and move westward along 52
the Alaskan Stream (Ladd et al., 2005, 2007; Janout et al., 2009). Kenai eddies form south of the 53
Kenai Peninsula between 143W and 160W, and propagate southwestward along the Alaskan 54
Stream (Rovegno et al., 2009; Lippiatt et al., 2011; Ueno et al., 2012). These eddies do not cross 55
the 180 meridian (Ueno et al., 2009). Anticyclonic eddies called Alaskan Stream eddies appear56
in the Alaskan Stream region between 157W and 169W, south of the Alaska Peninsula and 57
Aleutian Islands (Ueno et al., 2009). The Alaskan Stream eddies usually move westward for 15 58
years and sometimes cross the 180 meridian and reach the Western Subarctic Gyre. Mesoscale 59
anticyclonic eddies also form in the western Alaskan Stream region (Rogachev et al., 2007; 60
Rogachev and Shlyk, 2009). These eddies form in the region between the 180 meridian and 61
Near Strait (about 170E) and are called Aleutian eddies. Many of the Aleutian eddies move 62
southwestward, and reach the Western Subarctic Gyre.63
Mesoscale anticyclonic eddies observed in the Alaskan Stream and the Alaska Current64
regions (Fig. 1A) are thought transport significant mass of coastal water to the offshore open ocean. 65
4
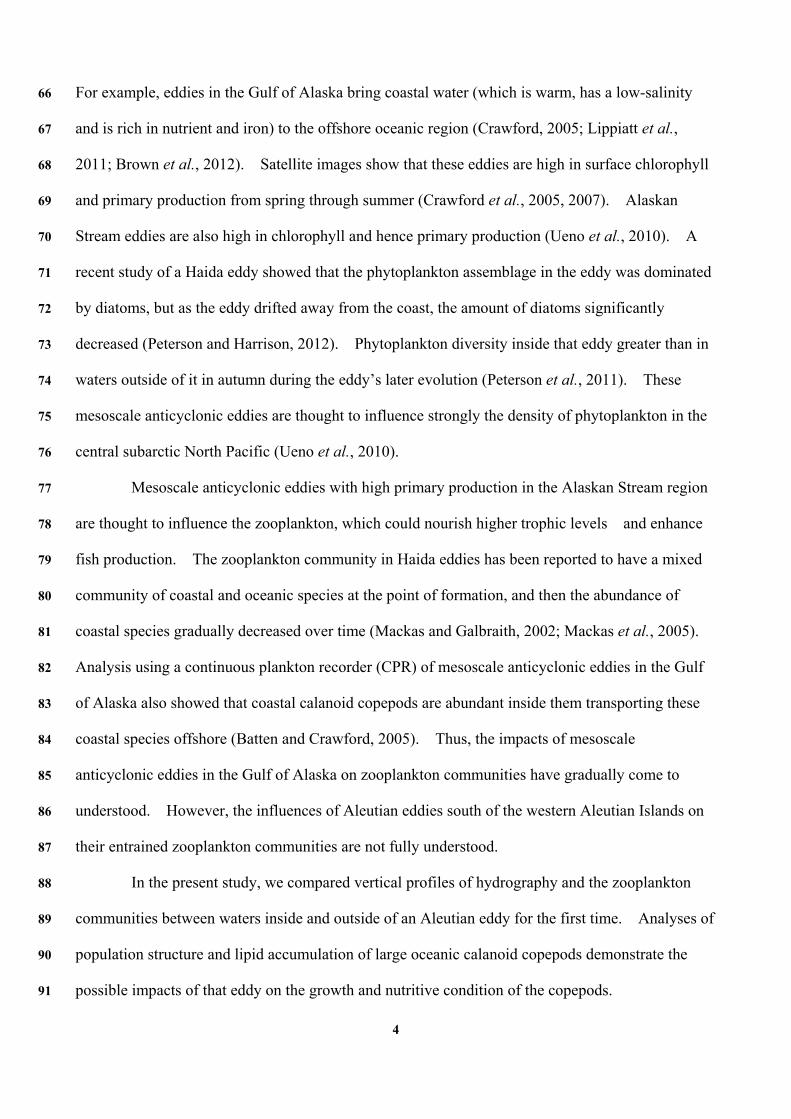
For example, eddies in the Gulf of Alaska bring coastal water (which is warm, has a low-salinity 66
and is rich in nutrient and iron) to the offshore oceanic region (Crawford, 2005; Lippiatt et al., 67
2011; Brown et al., 2012). Satellite images show that these eddies are high in surface chlorophyll 68
and primary production from spring through summer (Crawford et al., 2005, 2007). Alaskan 69
Stream eddies are also high in chlorophyll and hence primary production (Ueno et al., 2010). A 70
recent study of a Haida eddy showed that the phytoplankton assemblage in the eddy was dominated 71
by diatoms, but as the eddy drifted away from the coast, the amount of diatoms significantly 72
decreased (Peterson and Harrison, 2012). Phytoplankton diversity inside that eddy greater than in 73
waters outside of it in autumn during the eddy’s later evolution (Peterson et al., 2011). These 74
mesoscale anticyclonic eddies are thought to influence strongly the density of phytoplankton in the 75
central subarctic North Pacific (Ueno et al., 2010).76
Mesoscale anticyclonic eddies with high primary production in the Alaskan Stream region 77
are thought to influence the zooplankton, which could nourish higher trophic levels and enhance 78
fish production. The zooplankton community in Haida eddies has been reported to have a mixed 79
community of coastal and oceanic species at the point of formation, and then the abundance of 80
coastal species gradually decreased over time (Mackas and Galbraith, 2002; Mackas et al., 2005). 81
Analysis using a continuous plankton recorder (CPR) of mesoscale anticyclonic eddies in the Gulf 82
of Alaska also showed that coastal calanoid copepods are abundant inside them transporting these 83
coastal species offshore (Batten and Crawford, 2005). Thus, the impacts of mesoscale 84
anticyclonic eddies in the Gulf of Alaska on zooplankton communities have gradually come to 85
understood. However, the influences of Aleutian eddies south of the western Aleutian Islands on 86
their entrained zooplankton communities are not fully understood.87
In the present study, we compared vertical profiles of hydrography and the zooplankton 88
communities between waters inside and outside of an Aleutian eddy for the first time. Analyses of89
population structure and lipid accumulation of large oceanic calanoid copepods demonstrate the 90
possible impacts of that eddy on the growth and nutritive condition of the copepods.91

5
Method92
Field study93
Our field study was conducted at seven stations along 5115N from 17121E to 17438E 94
and at four stations along 5040N from 17624E to 17844E on board T/S Oshoro-Maru of the 95
Faculty of Fisheries, Hokkaido University, during 78 July 2010 (Fig. 1B). At each station, 96
temperature, salinity and fluorescence were measured with a CTD (Sea-Bird Electronics, Inc., U. S. 97
A., CTD-SBE 9plus). At some stations, only temperature and salinity were measured by an 98
XCTD (Tsurumi Seiki Co., Ltd., Japan). These hydrographic data have been published 99
elsewhere (Hokkaido University, 2011).100
Zooplankton samples were collected by vertical tows from 150 m to the surface using a 45 101
cm mouth diameter, 100 m mesh size NORPAC net (Motoda, 1957) equipped with a flowmeter 102
(Rigosha Co., Ltd., Japan). The net towing speed was 1 m s1. During each sampling, the wire 103
angle was measured using a protractor, and the wire length was extended until the net reached the 104
desired depth. Samples were immediately preserved in 5% formalin-seawater buffered with 105
sodium tetraborate. The volume of water filtered was calculated from the flowmeter reading.106
Data and sample analyses107
To evaluate the position of mesoscale anticyclonic eddies, delayed-time data of sea level 108
anomaly (SLA) in the period from the approximate date of eddy formation (6 January 2010) to the 109
date of field sampling (7 July 2010) were downloaded from AVISO (Collecte Localisation 110
Satellites, France; http://www.aviso.oceanobs.com; SSALTO/DUACS, 2012). The spatial 111
resolution was 1/4 1/4. The SLA data at seven-day intervals was used to track eddies. 112
During summer, seawater expands due to the increase in water temperature, thus using raw SLA 113
data, the sea-level anomalies in the whole region tend to be positive in summer and negative in 114
winter (Ueno et al., 2012). Accordingly, the weekly spatial mean state of the subarctic North 115
6
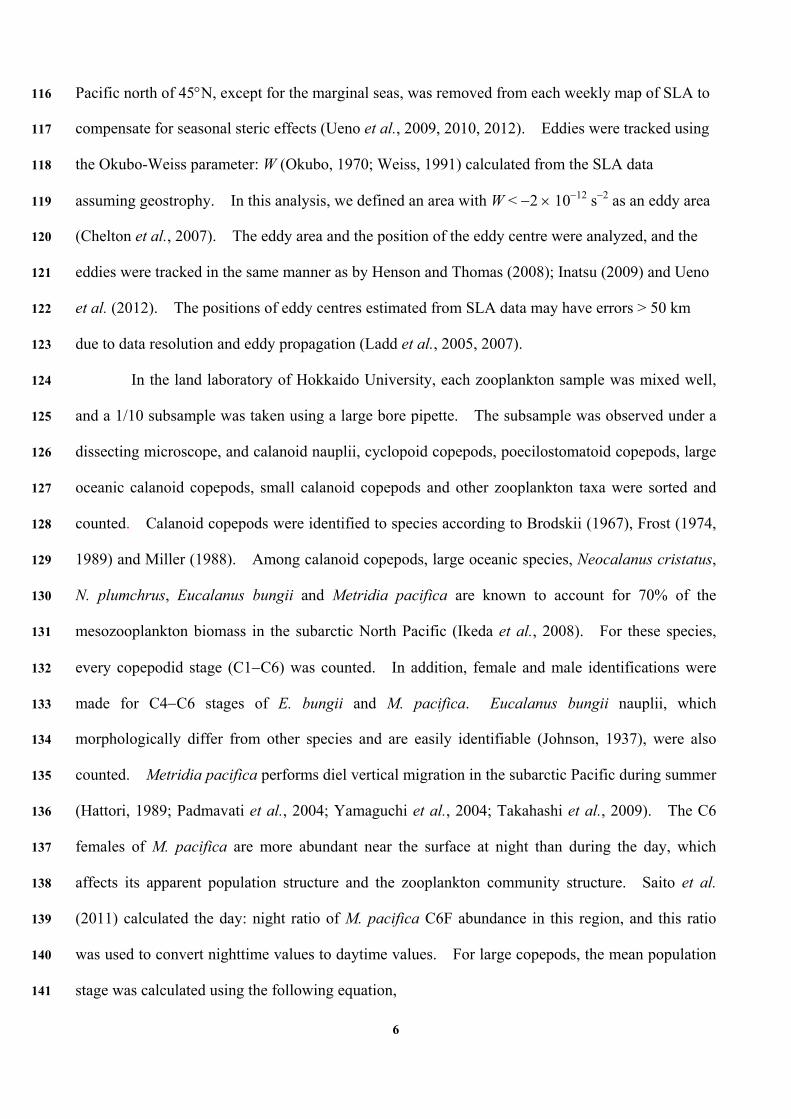
Pacific north of 45N, except for the marginal seas, was removed from each weekly map of SLA to 116
compensate for seasonal steric effects (Ueno et al., 2009, 2010, 2012). Eddies were tracked using 117
the Okubo-Weiss parameter: W (Okubo, 1970; Weiss, 1991) calculated from the SLA data118
assuming geostrophy. In this analysis, we defined an area with W < 2 1012 s2 as an eddy area 119
(Chelton et al., 2007). The eddy area and the position of the eddy centre were analyzed, and the 120
eddies were tracked in the same manner as by Henson and Thomas (2008); Inatsu (2009) and Ueno 121
et al. (2012). The positions of eddy centres estimated from SLA data may have errors > 50 km 122
due to data resolution and eddy propagation (Ladd et al., 2005, 2007).123
In the land laboratory of Hokkaido University, each zooplankton sample was mixed well, 124
and a 1/10 subsample was taken using a large bore pipette. The subsample was observed under a 125
dissecting microscope, and calanoid nauplii, cyclopoid copepods, poecilostomatoid copepods, large126
oceanic calanoid copepods, small calanoid copepods and other zooplankton taxa were sorted and127
counted. Calanoid copepods were identified to species according to Brodskii (1967), Frost (1974, 128
1989) and Miller (1988). Among calanoid copepods, large oceanic species, Neocalanus cristatus, 129
N. plumchrus, Eucalanus bungii and Metridia pacifica are known to account for 70% of the 130
mesozooplankton biomass in the subarctic North Pacific (Ikeda et al., 2008). For these species, 131
every copepodid stage (C1C6) was counted. In addition, female and male identifications were 132
made for C4C6 stages of E. bungii and M. pacifica. Eucalanus bungii nauplii, which 133
morphologically differ from other species and are easily identifiable (Johnson, 1937), were also 134
counted. Metridia pacifica performs diel vertical migration in the subarctic Pacific during summer 135
(Hattori, 1989; Padmavati et al., 2004; Yamaguchi et al., 2004; Takahashi et al., 2009). The C6 136
females of M. pacifica are more abundant near the surface at night than during the day, which 137
affects its apparent population structure and the zooplankton community structure. Saito et al.138
(2011) calculated the day: night ratio of M. pacifica C6F abundance in this region, and this ratio 139
was used to convert nighttime values to daytime values. For large copepods, the mean population140
stage was calculated using the following equation,141

7
6
1
6
1
ii
ii
N
NiMS ,142
where MS is the mean population stage, i is the copepodid stage (16), and Ni is the abundance (ind. 143
m2) of each stage (Marin, 1987). For E. bungii, whose nauplii were counted, a nauplius was 144
treated as stage 1, and MS was calculated using the value of each copepodid stage plus one, i.e. C1 145
was considered as 2. For C5 individuals of N. cristatus, N. plumchrus and E. bungii, the lipid 146
accumulation were observed and scored as three levels (1: no lipid, 2: some lipid, 3: full of lipid) 147
(Kobari and Ikeda, 1999, 2001; Tsuda et al., 1999, 2004; Shoden et al., 2005), and the mean lipid 148
score was calculated. The integrated mean temperature and phytoplankton fluorescence in the 149
0150 m profiles, total zooplankton abundance, the abundance and mean population stage of large 150
oceanic calanoid copepods and the mean lipid score of the C5 individuals were compared between 151
the sampling lines using Mann-Whitney U tests.152
Results153
Hydrography154
Based on the SLA data in the sampled area, the 5115N (western) line crossed an 155
anticyclonic eddy with an SLA of 1035 cm and a diameter of ca. 200 km (Fig. 2A). Along the 156
5040N (eastern) line, an anticyclonic eddy with an SLA of 1025 cm was observed north of the 157
westernmost station, but this line did not cross the eddy. We named the 5115N line crossing the 158
mesoscale anticylonic eddy “Eddy line” and the 5040N line “Non-eddy line”.159
The eddy observed along the Eddy line was first detected in mid-February 2010 south of 160
Attu Island (eddy centre: 5210N, 17220E) (Figs. 2B, C). This eddy gradually increased in 161
area (Fig. 2D) as it moved southeastward during the next five months and reached the sampling area 162
(near 5110N, 17250E) on 7 July 2010. The SLA near the eddy centre, representing the strength 163
of the eddy, continuously increased, and the area oscillated at one to two month periods overlain on 164

8
a general increase from ~7,000 to ~18,000 km2 (Fig. 2D). Fig. 3 (A) shows vertical profiles of 165
temperature along the Eddy line and the Non-eddy line. Between 171.35E ( solid black circles) 166
and 173.49E (open red triangles) along the Eddy line, a subsurface cold water mass (3.04.0C at 167
26.326.8) was observed at 80200 m. A somewhat warmer water mass (4.04.5C at 168
26.527.5) was also seen in this section at 200500 m depth. In contrast, this warm water mass 169
(4.04.5C) spreads from 50 m to 350 m between 174.00E and 174.64E. The 170
temperature-salinity relation also separated the water mass into cold and warm volumes between 171
26.2 and 26.6 (Fig. 3B). Unlike the Eddy line, subsurface cold or warmer water masses were 172
not observed along the Non-eddy line, and the water mass structure was mostly uniform along the 173
section (Fig. 3A, B). Fluorescence was higher along the Eddy line than the Non-eddy line, 174
particularly between 172.50E and 174.64E at 2550 m depth (Fig. 3C).175
The range of integrated mean temperature at 0150 m depth was 4.15.4C along the Eddy 176
line and 4.75.1C along the Non-eddy line (Fig. 4). There was no significant difference in the 177
integrated mean temperature (U test, p > 0.05), but the eddy centre was colder. The range of178
fluorescence at 0150 m was 57.979.4 mg m2 along the Eddy line and 45.566.5 mg m2 along 179
the Non-eddy line (Fig. 4). There was no statistically significant difference in fluorescence 180
between the lines (p > 0.05), but it was high near the eddy centre.181
Total zooplankton abundance and taxonomic accounts182
Total zooplankton abundance ranged from 1.0 105 to2.7 105 ind. m-2 (mean: 1.7 105183
ind. m2) along the Eddy line and 1.11.4 105 ind. m-2 (mean: 1.3 105 ind. m2) along the 184
Non-eddy line (Fig. 5A), not statistically different (U test, p > 0.05). Relative numerical185
abundances of some groups were different between the lines. Calanoid copepod nauplii (range: 186
3.329.3%, mean: 20.7%) and cyclopoid copepods (range: 20.560.4%, mean: 34.2%) were 187
abundant along the Eddy line, and cyclopoid copepods (range: 20.341.4%, mean: 28.1%) and large 188
oceanic calanoid copepods (Neocalanus, Eucalanus and Metridia spp.) (range: 13.338.9%, mean: 189

9
26.4%) were abundant along the Non-eddy line (Fig. 5B). The numerical abundance of calanoid 190
nauplii, cyclopoid copepods and poecilostomatoid copepods were 4.8 104, 0.7 104 and 2.9 104191
ind. m2 respectively along the Eddy line and 4.1 104, 0.8 104 and 2.3 104 ind. m2 192
respectively along the Non-eddy line, and these were not statistically different between these lines193
(U test, p > 0.05).194
Calanoid copepods195
In the zooplankton samples, 18 species of calanoid copepods belonging to 14 genera were 196
observed (Table I). Six coastal species (Acartia longiremis, Calanus marshallae and four species 197
of Pseudocalanus) and four large oceanic copepods were detected along both lines. Five 198
deep-sea species (Candacia columbiae, Microcalanus pygmaeus, Paraeuchaeta elongata, 199
Pleuromamma scutullata and Scolecithricella minor) were observed along both lines, but 200
Aetideopsis rostrata and Racovitzanus antarcticus were found only along the Eddy line, and 201
Aetideus armatus and Heterorhabdus tanneri were identified only along the Non-eddy line. 202
Comparing these calanoid copepod abundance between the lines, the abundances of A. longiremis, 203
P. minutus and R. antarcticus were significantly greater along the Eddy line than the Non-eddy line 204
(U test, p < 0.05, Table I).205
Large oceanic calanoid copepods206
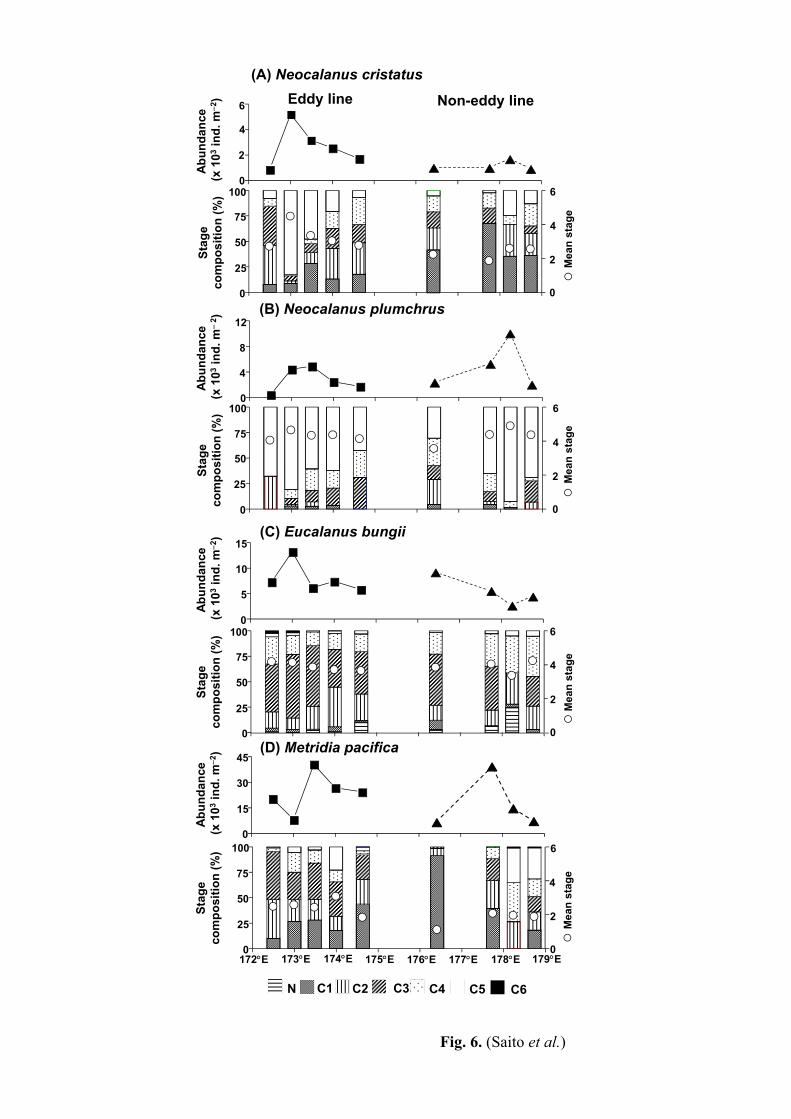
Numerical abundance of the large oceanic calanoid copepod N. cristatus was significantly 207
greater along the Eddy line (range: 0.85.2 103 ind. m2, mean: 2.7 103 ind. m2) than along the 208
Non-eddy line (range: 0.91.7 103 ind. m2, mean: 1.2 103 ind. m2) (U test, p < 0.05, Fig. 6A, 209
Table I). Its mean stage was significantly higher along the Eddy line (mean: 3.2) than along the 210
Non-eddy line (mean: 2.2) (p < 0.05, Table II), and C5 individuals were relatively more numerous 211
along the Eddy line. In contrast, N. plumchrus abundance was significantly greater along the 212
Non-eddy line (range: 2.010.0 103 ind. m2, 4.9 103 ind. m2) than along the Eddy line (range: 213
10
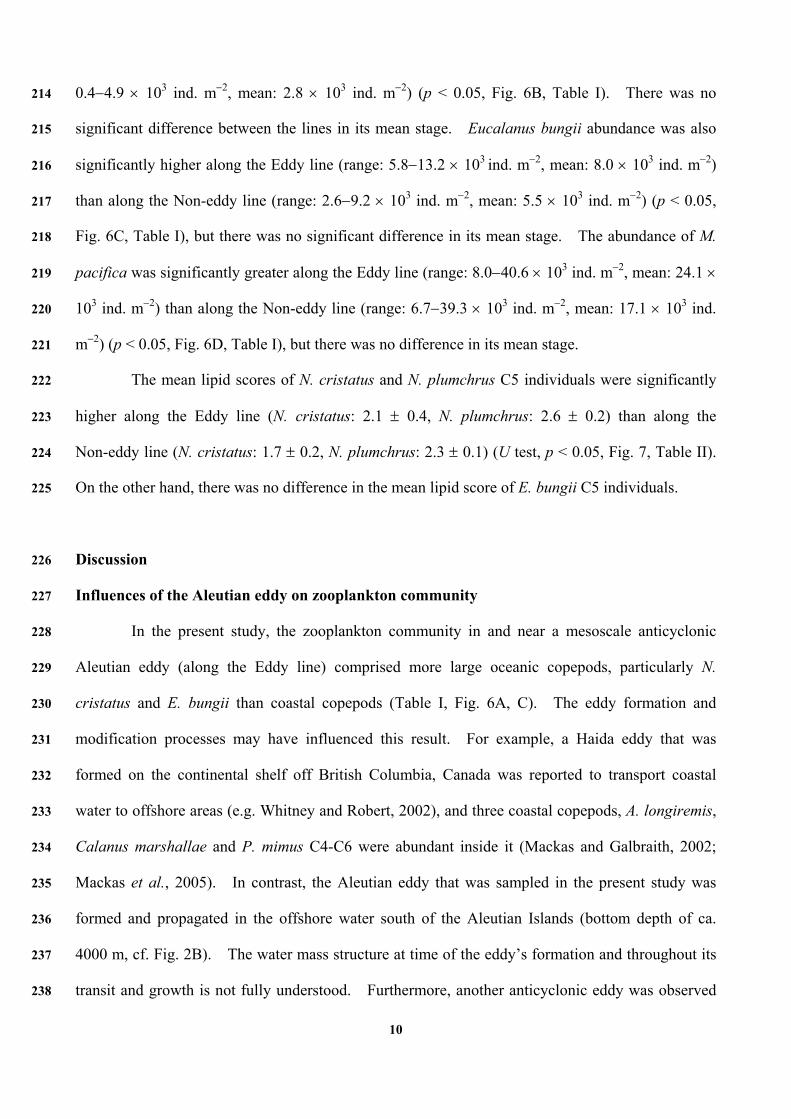
0.44.9 103 ind. m2, mean: 2.8 103 ind. m2) (p < 0.05, Fig. 6B, Table I). There was no 214
significant difference between the lines in its mean stage. Eucalanus bungii abundance was also 215
significantly higher along the Eddy line (range: 5.813.2 103 ind. m2, mean: 8.0 103 ind. m2) 216
than along the Non-eddy line (range: 2.69.2 103 ind. m2, mean: 5.5 103 ind. m2) (p < 0.05, 217
Fig. 6C, Table I), but there was no significant difference in its mean stage. The abundance of M. 218
pacifica was significantly greater along the Eddy line (range: 8.040.6 103 ind. m2, mean: 24.1 219
103 ind. m2) than along the Non-eddy line (range: 6.739.3 103 ind. m2, mean: 17.1 103 ind. 220
m2) (p < 0.05, Fig. 6D, Table I), but there was no difference in its mean stage.221
The mean lipid scores of N. cristatus and N. plumchrus C5 individuals were significantly 222
higher along the Eddy line (N. cristatus: 2.1 0.4, N. plumchrus: 2.6 0.2) than along the 223
Non-eddy line (N. cristatus: 1.7 0.2, N. plumchrus: 2.3 0.1) (U test, p < 0.05, Fig. 7, Table II). 224
On the other hand, there was no difference in the mean lipid score of E. bungii C5 individuals.225
Discussion226
Influences of the Aleutian eddy on zooplankton community227
In the present study, the zooplankton community in and near a mesoscale anticyclonic 228
Aleutian eddy (along the Eddy line) comprised more large oceanic copepods, particularly N. 229
cristatus and E. bungii than coastal copepods (Table I, Fig. 6A, C). The eddy formation and 230
modification processes may have influenced this result. For example, a Haida eddy that was 231
formed on the continental shelf off British Columbia, Canada was reported to transport coastal 232
water to offshore areas (e.g. Whitney and Robert, 2002), and three coastal copepods, A. longiremis, 233
Calanus marshallae and P. mimus C4-C6 were abundant inside it (Mackas and Galbraith, 2002; 234
Mackas et al., 2005). In contrast, the Aleutian eddy that was sampled in the present study was 235
formed and propagated in the offshore water south of the Aleutian Islands (bottom depth of ca. 236
4000 m, cf. Fig. 2B). The water mass structure at time of the eddy’s formation and throughout its 237
transit and growth is not fully understood. Furthermore, another anticyclonic eddy was observed 238

11
adjacent to this eddy, and eddy-eddy interaction between the two might have occurred. Eddy-eddy 239
interaction can cause a sudden increase in SLA, and water inside an eddy can exchange with other 240
water masses (Ueno et al., 2012). Thus, it is uncertain whether the water mass injected at the 241
formation remained in the eddy during the sampling period. We found that the large oceanic 242
copepods N. cristatus and E. bungii were abundant within the eddy, suggesting that the eddy may 243
have been composed of offshore water during the sampling period rather than coastal water. 244
Unlike in the Gulf of Alaska and the eastern Bering Sea shelf, in the western Aleutian Islands, 245
coastal area (the depth less than 200 m) is much smaller and strictly limited around the islands (Fig. 246
1B). The Aleutian eddy could draw coastal water into it; however, its mass compared with 247
offshore water is presumably much smaller. Therefore, more oceanic copepods could be drawn 248
into the Aleutian eddy rather than coastal copepods.249
Biological productivity of the Aleutian eddy250
In the present study, the abundance of most species of large calanoid copepods were 251
significantly greater inside the eddy than outside (Table I). Inside the eddy, the mean lipid score252
of N. cristatus and N. plumchurus were significantly greater, and the mean stage of N. cristatus was 253
more advanced (Table II). The high abundances, lipid accumulations and advanced life stages of 254
large oceanic copepods suggest better survival and growth conditions to for large copepods inside255
the eddy than outside.256
The eastern subarctic North Pacific around the study area is known to be a high nutrient 257
and low chlorophyll (HNLC) region (Reid, 1962; Anderson et al., 1969), and iron is thought to be a 258
major liming factor for phytoplankton growth there (Boyd et al., 2004). Nevertheless, the 259
mesoscale Aleutian anticyclonic eddy observed in the present study had higher fluorescence than 260
outside the eddy, and thus substantial phytoplankton biomasses (Fig 3C, Fig. 4). Mesoscale 261
anticyclonic eddies are reported to increase the nutrient supply supporting productivity because262
eddy/wind interactions and submesoscale processes force upwelling to the surface of nutrient-rich 263
12
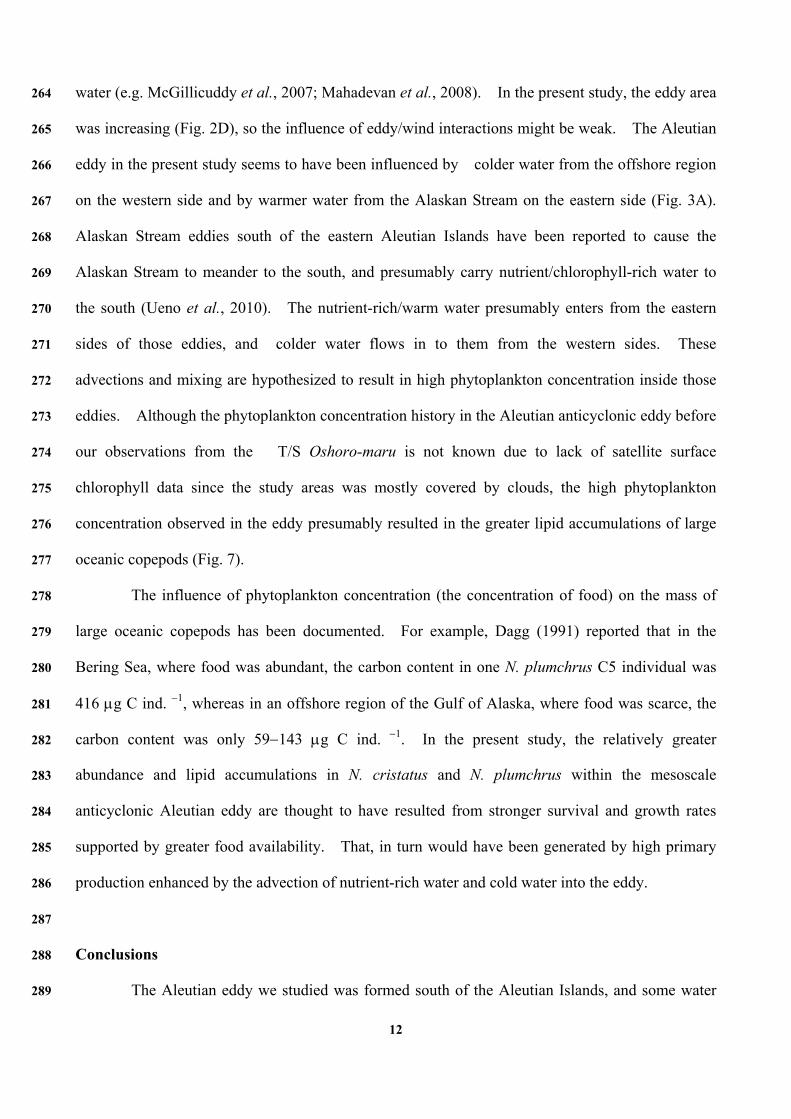
water (e.g. McGillicuddy et al., 2007; Mahadevan et al., 2008). In the present study, the eddy area 264
was increasing (Fig. 2D), so the influence of eddy/wind interactions might be weak. The Aleutian 265
eddy in the present study seems to have been influenced by colder water from the offshore region 266
on the western side and by warmer water from the Alaskan Stream on the eastern side (Fig. 3A). 267
Alaskan Stream eddies south of the eastern Aleutian Islands have been reported to cause the268
Alaskan Stream to meander to the south, and presumably carry nutrient/chlorophyll-rich water to 269
the south (Ueno et al., 2010). The nutrient-rich/warm water presumably enters from the eastern 270
sides of those eddies, and colder water flows in to them from the western sides. These 271
advections and mixing are hypothesized to result in high phytoplankton concentration inside those 272
eddies. Although the phytoplankton concentration history in the Aleutian anticyclonic eddy before 273
our observations from the T/S Oshoro-maru is not known due to lack of satellite surface 274
chlorophyll data since the study areas was mostly covered by clouds, the high phytoplankton 275
concentration observed in the eddy presumably resulted in the greater lipid accumulations of large 276
oceanic copepods (Fig. 7).277
The influence of phytoplankton concentration (the concentration of food) on the mass of 278
large oceanic copepods has been documented. For example, Dagg (1991) reported that in the 279
Bering Sea, where food was abundant, the carbon content in one N. plumchrus C5 individual was 280
416 g C ind. 1, whereas in an offshore region of the Gulf of Alaska, where food was scarce, the 281
carbon content was only 59143 g C ind. 1. In the present study, the relatively greater282
abundance and lipid accumulations in N. cristatus and N. plumchrus within the mesoscale 283
anticyclonic Aleutian eddy are thought to have resulted from stronger survival and growth rates 284
supported by greater food availability. That, in turn would have been generated by high primary 285
production enhanced by the advection of nutrient-rich water and cold water into the eddy.286
287
Conclusions288
The Aleutian eddy we studied was formed south of the Aleutian Islands, and some water 289

13
exchange due to eddyeddy interaction might have occurred after the initial formation. Since 290
large oceanic copepods were abundant during the sampling, the eddy was presumed to include a 291
substantial proportion of oceanic water. In addition, the high abundance and lipid accumulations292
of oceanic copepods and the advanced life stages in some species probably reflect high primary 293
production caused by the advective transfer into the eddy of colder nutrient-rich waters. In the 294
future, time-series analyses of the eddy modification process, primary production, phytoplankton 295
community and zooplankton community are required to more fully understand the effects of 296
Aleutian eddies on their entrained zooplankton communities.297
Acknowledgements298
We express our thanks to Associate Professor John Richard Bower, Marine Environmental 299
Science Laboratory, Faculty of Fisheries Sciences, Hokkaido University for his careful 300
proofreading of the English in a draft version of the manuscript prior to submission. We also wish 301
to acknowledge the captains, officers and crew members of T/S Oshoro-Maru, Faculty of Fisheries, 302
Hokkaido University and the members of the Plankton Laboratory, Faculty of Fisheries, Hokkaido 303
University for their help in sampling at sea. The altimeter products were produced by 304
SSALTO/DUCSCS and distributed by AVISO with support from CNES. We also thank Dr Roger 305
Harris, Editor in Chief, Dr Lulu Stader, Managing Editor, Associate Editor, two anonymous 306
reviewers of our manuscript. Their comments were helpful and greatly improved the present 307
manuscript.308
Funding309
The present study was partially supported by Grant-in-Aid for Young Scientists (B) 310
50344495 and (A) 24248032, 25257206/25121503 of the Japan Society for the Promotion of 311
Science (JSPS).312

14
References313
Anderson, G. C., Parsons, T. R. and Stephens, K. (1969) Nitrate distribution in the subarctic 314
northeast Pacific Ocean. Deep-Sea Res., 16, 329334.315
Batten, S. D. and Crawford, W. R. (2005) The influence of coastal origin eddies on oceanic 316
plankton distributions in the eastern Gulf of Alaska. Deep-Sea Res II, 52, 9911009.317
Boyd, P. W., Law, C. S., Wong, C. S. et al. (2004) The decline and fate of an iron-induced subarctic 318
phytoplankton bloom. Nature, 428, 549553.319
Brodskii, K. A. (1967) Calanoida of the Far Eastern Seas and Polar Basin of the USSR. Israel 320
Program for Scientific Translations, Jerusalem, 440 pp.321
Brown, M. T., Lippiatt, S. M., Lohan, M. C. et al. (2012) Trace metal distributions within a Sitka 322
eddy in the northern Gulf of Alaska. Limnol. Oceanogr., 57, 503518.323
Chelton, D. B., Schlax, M. G., Samelson, R. M. et al. (2007) Global observations of large oceanic 324
eddies. Geophys. Res. Lett., 34, L15606.325
Crawford, W. R., Cherniawsky, J. Y. and Foreman, M. G. G. (2000) Multi-year meanders and 326
eddies in the Alaskan Stream as observed by TOPEX/Poseidon altimeter. Geophys. Res. Lett., 327
27, 10251028.328
Crawford, W. R. (2002) Physical characteristics of Haida eddies. J. Oceanogr., 58, 703713.329
Crawford, W. R. (2005) Heat and fresh water transport by eddies into the Gulf of Alaska. 330
Deep-Sea Res II, 52, 893908.331
Crawford, W. R., Brickley, P. J., Peterson, T. D. et al. (2005) Impact of Haida eddies on 332
chlorophyll distribution in the eastern Gulf of Alaska. Deep-Sea Res. II, 52, 975989.333
Crawford, W. R., Brickley, P. J. and Thomas, A. C. (2007) Mesoscale eddies dominate surface 334
phytoplankton in northern Gulf of Alaska. Prog. Oceanogr., 75, 287303.335
Dagg, M. J. (1991) Neocalanus plumchrus (Marukawa): life in the nutritionally dilute subarctic 336
Pacific Ocean and the phytoplankton rich Bering Sea. In Uye, S.-I., Nishida, S. and Ho, J.-S. 337
(eds), Proceeding of the Fourth International Conference on Copepoda. Bull. Plankton. Soc. 338

15
Jpn. Special Edition, pp. 217225.339
Favorite, F. (1967) The Alaskan Stream. In. N. Pac. Fish. Comm. Bull., 21, 20.340
Frost, B. W. (1974) Calanus marshallae, a new species of calanoid copepod closely allied to sibling 341
species C. finmarchicus and C. glacialis. Mar. Biol., 26, 7799.342
Frost, B. W. (1989) A taxonomy of the marine calanoid copepod genus Pseudocalanus. Can. J. 343
Zool., 67, 525551.344
Hattori, H. (1989) Bimodal vertical distribution and diel migration of the copepods Metridia 345
pacifica, M. okhotensis and Pleuromamma scutullata in the western North Pacific Ocean. 346
Mar. Biol., 103, 3950.347
Henson, S. A. and Thomas, A. C. (2008) A census of oceanic anticyclonic eddies in the Gulf of 348
Alaska. Deep-Sea Res. I, 55, 163176.349
Hokkaido University (2011) In Saitoh, S.-I. (ed.), Data Record of Oceanographic Observation and 350
Exploratory Fishing No. 54. Faculty of Fisheries, Hokkaido University, Hakodate, 192 pp.351
Ikeda, T., Shiga, N. and Yamaguchi, A. (2008) Structure, biomass, distribution and trophodynamics 352
of pelagic ecosystems in the Oyashio region, western subarctic Pacific. J. Oceanogr., 66, 353
7183.354
Inatsu, M. (2009) The neighbor enclosed area tracking algorithm for extra-tropical wintertime 355
cyclones. Atmos. Sci. Lett., 10, 267272.356
Janout, M. A., Weingartner, T. J., Okkonen, S. R. et al. (2009) Some characteristics of Yakutat 357
eddies propagating along the continental slope of the northern Gulf of Alaska. Deep-Sea Res. 358
II, 56, 24442459.359
Johnson, M. W. (1937) The developmental stages of the copepod Eucalanus elongatus Dana var.360
bungii Giesbrecht. Trans. Am. Microsc. Soc., 56, 7998.361
Kobari, T. and Ikeda, T. (1999) Vertical distribution, population structure and life cycle of 362
Neocalanus cristatus (Crustacea: Copepoda) in the Oyashio region, with notes on its regional 363
variations. Mar. Biol., 134, 683696.364

16
Kobari, T. and Ikeda, T. (2001) Ontogenetic vertical migration and life cycle of Neocalanus 365
plumchrus (Crustacea: Copepoda) in the Oyashio region, with notes on regional variation in 366
body sizes. J. Plankton Res., 23, 287302.367
Ladd, C., Kachel, N. B., Mordy, C. W. et al. (2005) Observations from a Yakutat eddy in the 368
northern Gulf of Alaska. J. Geophys. Res., 110, C03003.369
Ladd, C., Mordy, C. W., Kachel, N. B. et al. (2007) Northern Gulf of Alaska eddies and associated 370
anomalies. Deep-Sea Res. I, 54, 487509.371
Lippiatt, S. M., Brown, M. T., Lohan, M. C. et al. (2011) Reactive iron delivery to the Gulf of 372
Alaska via a Kenai eddy. Deep-Sea Res. I, 58, 10911102.373
Mackas, D. L. and Galbraith, M. D. (2002) Zooplankton distribution and dynamics in a North 374
Pacific eddy of coastal origin: I. transport and loss of continental margin species. J. 375
Oceanogr., 58, 725738.376
Mackas, D. L., Tsurumi, M., Galbraith, M. D. et al. (2005) Zooplankton distribution and dynamics 377
in a North Pacific eddy of coastal origin: II. Mechanism of eddy colonization by and retention 378
of offshore species. Deep-Sea Res. II, 52, 10111035.379
Mahadevan, A., Thomas, L. N. and Tandon, A. (2008) Comment on “Eddy/wind interactions 380
stimulate extraordinary mid-ocean plankton blooms”. Science, 320, 448b.381
Marin, V. (1987) The oceanographic structure of the eastern Scotia Sea-IV. Distribution of 382
copepod species in relation to hydrography in 1981. Deep-Sea Res. I, 34, 105121.383
McGillicuddy, D. J., Anderson, L. A., Bates, N. R. et al. (2007) Eddy/wind interactions stimulate 384
extraordinary mid-ocean plankton blooms. Science, 316, 1021.385
Miller, C. B. (1988) Neocalanus flemingeri, a new species of Calanidae (Copepoda: Calanoida) 386
from the subarctic Pacific Ocean, with a comparative redescription of Neocalanus plumchrus387
(Marukawa) 1921. Prog. Oceanogr., 20, 223273.388
Motoda, S. (1957) North Pacific standard plankton net. Inf. Bull. Planktol. Jpn., 4, 1315.389

17
Ohtani, K., Onishi, H., Kobayashi, N. et al. (1997) Baroclinic flow referred to the 3000 m reference 390
level across the 180 transect in the subarctic North Pacific. Bull. Fac. Fish. Hokkaido Univ., 391
48, 5364.392
Okubo, A. (1970) Horizontal dispersion of floatable particles in the vicinity of velocity singularity 393
such as convergences. Deep-Sea Res., 17, 445454.394
Onishi, H. (2001) Spatial and temporal variability in a vertical section across the Alaskan Stream 395
and Subarctic Current. J. Ocanogr., 57, 7991.396
Padmavati, G., Ikeda, T. and Yamaguchi, A. (2004) Life structure and vertical distribution of 397
Metridia spp. (Copepoda: Calanoida) in the Oyashio region (NW Pacific Ocean). Mar. Ecol. 398
Prog. Ser., 270, 181198.399
Peterson, T. D., Crawford, D. W. and Harrison, P. J. (2011) Evolution of the phytoplankton 400
assemblage in a long-lived mesoscale eddy in the eastern Gulf of Alaska. Mar. Ecol. Prog. 401
Ser., 424, 5373.402
Peterson, T. D. and Harrison, P. J. (2012) Diatom dynamics in a long-lived mesoscale eddy in the 403
northeast subarctic Pacific Ocean. Deep-Sea Res. I, 65, 157170.404
Reed, R. K. and Stabeno, P. J. (1999) Recent full-depth survey of the Alaskan Stream. J. 405
Oceanogr., 55, 7985.406
Reid, J. L. Jr (1962) On the circulation, phosphate phosphorous content, and zooplankton volumes 407
in the upper part of the Pacific Ocean. Limno. Oceanogr., 7, 287306.408
Rogachev, K., Shlyk, N. and Carmack, E. (2007) The shedding of mesoscale eddies from the 409
Alaskan Stream and westward transport of warm water. Deep-Sea Res II, 54, 26432656.410
Rogachev, K. A. and Shlyk, N. V. (2009) The increased radius of the Aleutian eddies and their 411
long-term evolution. Russ. Meteorol. Hydrol., 35, 206210.412
Rovegno, P. S., Edwards, C. A. and Bruland, K. W. (2009) Observations of a Kenai eddy and a 413
Sitka eddy in the northern Gulf of Alaska. J. Geophys. Res., 114, C11012.414
Saito, R., Yamaguchi, A., Saitoh, S.-I. et al. (2011) Eastwest comparison of the zooplankton 415
18
community in the subarctic Pacific during summers of 2003-2006. J. Plankton Res., 33, 416
145160.417
Shoden, S., Ikeda, T. and Yamaguchi, A. (2005) Vertical distribution, population structure and life 418
cycle of Eucalanus bungii (Copepoda: Calanoida) in the Oyashio region, with notes on its 419
regional variations. Mar. Biol., 146, 497511.420
Takahashi, K., Kuwata, A., Sugisaki, H. et al. (2009) Downward carbon transport by diel vertical 421
migration of the copepods Metridia pacifica and Metridia okhotensis in the Oyashio region of 422
the western subarctic Pacific. Deep-Sea Res. I, 56, 17771791.423
Tsuda, A., Saito, H. and Kasai, H. (1999) Life histories of Neocalanus flemingeri and Neocalanus 424
plumchrus (Calanoida: Copepoda) in the western subarctic Pacific. Mar. Biol., 135, 533544.425
Tsuda, A., Saito, H. and Kasai, H. (2004) Life histories of Eucalanus bungii and Neocalanus 426
cristatus (Calanoida: Copepoda) in the western subarctic Pacific. Fish. Oceanogr., 13, 1020.427
Ueno, H., Freeland, H., Crawford, W. R. et al. (2009) Anticyclonic eddies in the Alaskan Stream. 428
J. Phys. Oceanogr., 39, 934951.429
Ueno, H., Crawford, W. R. and Onishi, H. (2010) Impact of Alaskan Stream eddies on chlorophyll 430
distribution in the North Pacific. J. Oceanogr., 66, 319328.431
Ueno, H., Yasuda, I., Itoh, S. et al. (2012) Modification of a Kenai eddy along the Alaskan Stream. 432
J. Geophys. Res., 117, C08032.433
Weiss, J. (1991) The dynamics of enstrophy transfer in two dimensional hydrodynamics. Physica. 434
D., 48, 273294.435
Whitney, F. and Robert, M. (2002) Structure of Haida eddies and their transport of nutrient from 436
coastal margins into the NE Pacific Ocean. J. Oceanogr., 58, 715723.437
Yamaguchi, A., Ikeda, T., Watanabe, Y. et al. (2004) Vertical distribution patterns of pelagic 438
copepods as view from the predation pressure hypothesis. Zool. Stud., 43, 475485.439

19
Table and Figure legends440
Table I. The list of calanoid copepod species identified along the Eddy line (EL) and the 441
Non-eddy line (NEL) during 78 July 2010. Values are mean standard deviation of 442
abundance (ind. m2). Differences between two lines were tested by Mann-Whitney U test. 443
*: p < 0.05, NS: not significant.444
Table II. Comparison of mean stage and mean lipid score of large calanoid copepods between the 445
Eddy line (EL) and the Non-eddy line (NEL) during 78 July 2010. Differences between the 446
two lines were tested by Mann-Whitney U test. *: p < 0.05, NS: not significant.447
Fig. 1. The geographical distribution of mesoscale anticyclonic eddies along the Alaska Current 448
and the Alaskan Stream in the subarctic Pacific (A). A box indicates the study area magnified 449
in (B). Sampling stations along lines of mesoscale anticyclonic eddies during 78 July 2010 450
(B). Open and filled symbols in (B) indicate stations where XCTD and CTD casts were 451
conducted, respectively.452
Fig. 2. Sea level anomaly (cm) along the sampling lines on 7 July 2010 (A). Bathymetric 453
contours are also shown every 1000 m in (A). A trajectory of mesoscale anticyclonic eddy 454
from 10 February to 7 July 2010 in 7-day intervals (B). Diamond symbols in (B) indicate the 455
centre of the eddy in each time period, and filled symbols show the eddy’s origin and its456
position on 7 July 2010. Time series of position: latitude (filled circles) and longitude (open457
circles) (C), area (filled triangles) and sea level anomaly (open triangles) (D) of the mesoscale 458
anticyclonic eddy in seven-days intervals from 10 February to 7 July 2010.459
Fig. 3. (A) Temperature distribution (C as colour scale) superimposed by the density distribution 460
(, contours) for 01000 m depth, (B) temperature-salinity relation and (C) fluorescence 461
distributions for 0150 m along the Eddy line and Non-eddy line. Symbols along at the tops462
of (A) and (C) represent the locations of profiles characterized by T-S relations in (B).463
Fig. 4. 0150 m integrated mean temperature (filled circles) and fluorescence (open circles) along 464
the Eddy line and the Non-eddy line during 78 July 2010.465
20
Fig. 5. Total zooplankton abundance (A) and its taxonomic composition (B) along the Eddy line 466
and the Non-eddy line during 78 July 2010.467
Fig. 6. Abundance, stage composition and mean population stage of Neocalanus cristatus (A), N. 468
plumchrus (B), Eucalanus bungii (C) and Metridia pacifica (D) along the Eddy line and the 469
Non-eddy line during 78 July 2010.470
Fig. 7. Mean lipid scores of C5 individuals of Neocalanus cristatus, N. plumchrus and Eucalanus 471
bungii along the Eddy line and the Non-eddy line during 78 July 2010.472

Table I: The list of calanoid copepod species identified along the Eddy line and the Non-eddy line along 7-8 July 2010.
Functional group/SpeciesAbundance (ind. m2)
U testEddy line Non-eddy line
Coastal species
Acartia longiremis 902 180 367 106 EL > NEL*
Calanus marshallae 163 248 269 185 NS
Pseudocalanus mimus 2,792 1,227 2,288 1,063 NS
Pseudocalanus minutus 3,177 590 2,412 1,571 EL > NEL*
Pseudocalanus moultoni 1,431 408 1,463 1,074 NS
Pseudocalanus newmani 625 183 936 728 NSDeep sea species
Aetideopsis rostrata 15 34 0 NS
Aetideus armatus 0 92 142 NS
Candacia columbiae 15 34 451 903 NS
Microcalanus pygmaeus 13,391 4,166 6,773 4,171 NS
Paraeuchaeta elongata 148 113 69 138 NS
Pleuromamma scutullata 30 68 94 188 NS
Racovitzanus antarcticus 89 38 0 EL > NEL*
Scolecithricella minor 733 339 794 553 NSLarge oceanic species
Eucalanus bungii 7,973 3,010 5,492 2,741 EL > NEL*
Metridia pacifica 24,076 11,747 17,068 15,296 EL > NEL*
Neocalanus cristatus 2,709 1,645 1,175 352 EL > NEL*
Neocalanus plumchrus 2,790 1,874 4,930 3,694 NEL > EL*
Values are mean standard deviation of abundance (ind. m2) along the Eddy line (EL) and the Non-eddy line (NEL). Differences between the two lines were tested by Mann-Whitney U test. *: p < 0.05, NS: not significant.

Table II: Comparison of mean stage and mean lipid score of large calanoid copepods between the Eddy line (EL) and the Non-eddy line (NEL) during 78 July 2010.
Parameter/SpeciesMean sd.
U testEddy line Non-eddy line
Mean stage
Eucalanus bungii 3.9 0.2 3.8 0.4 NS
Metridia pacifica 2.5 0.4 2.6 1.2 NS
Neocalanus cristatus 3.2 0.7 2.3 0.3 EL > NEL*
Neocalanus plumchrus 4.3 0.2 4.3 0.6 NSMean lipid score Eucalanus bungii C5 2.2 0.2 2.1 0.2 NS Neocalanus cristatus C5 2.1 0.4 1.7 0.2 EL > NEL* Neocalanus plumchrus C5 2.6 0.2 2.3 0.1 EL > NEL*
Differences between the two lines were tested by Mann-Whitney U test. *: p < 0.05, NS: not significant.

54N
52N
50N168E 172E 176E 180 176W
Subarctic Pacific
160E 170E 180 170W 160W 150W 140W 130W 120W
60N
55N
50N
45N
(A)
(B)
Bering Sea
Subarctic PacificAleutian eddy
Yakutateddy
Sitkaeddy
Haidaeddy
Kenaieddy
Fig. 1. (Saito et al.)
Attu Island Bering Sea

36
24
12
0
172.5
(C)
Fig. 2. (Saito et al.)
Latit
ude
(N
)
0
7
14
(D)2151
51.5
52
52.5
172
Are
a (
103
km2 )
173
Long
itude
(E)
Feb. Mar. Apr. May June July2010
Sea
leve
l ano
mal
y (c
m)
171E 172E 173E 174E 175E 176E
53N
52N
51N
(B)
Attu Island
7 Apr.
5 May7 Jul.
10 Feb.3 Mar.
2 Jun.
52N
51N
50N
49N
100
5
0
10
(A)
170E 172E 174E 176E 178E 180E
10

Dep
th (m
)
177E 178E
172E 173E 174E 177E 178E
Salinity (psu)
Tem
pera
ture
(C
)
(B)
(A)
Dep
th (m
)
Eddy line Non-eddy line
172E 173E 174E
No data
No data
(C)
Fig. 3. (Saito et al.)
Temperature (C)
Fluorescence (mg m3)
0
200
400
600
800
1000
8
7
6
5
4
332.5 33.0 33.5 34.0 32.5 33.0 33.5 34.0
0
50
150
100

6
5
4
3170E 172E 174E 176E 178E 180E
80
70
60
50
40
Inte
grat
ed m
ean
tem
pera
ture
(
C: 0
150
m)
Fluo
resc
ence
(mg
m2
: 01
50 m
)
Eddy line Non-eddy line
Fig. 4. (Saito et al.)

179E178E177E176E175E174E173E172E0
25
50
75
100
Calanoid naupliiCyclopoid copepods
Poecilostomatoid copepods
Large oceaniccalanoid copepods
Small calanoid copepods
Other zooplankton taxa
Zoop
lank
ton
taxo
nom
ic a
ccou
nts
(%)
Abu
ndan
ce(x
105
ind.
m2
) Eddy line Non-eddy line(A)
(B)
0
1
2
3
Fig. 5. (Saito et al.)
0(D) Metridia pacifica
172E
0
25
50
75
100 6
6
4
2
0
(A) Neocalanus cristatus
Abun
danc
e(x
103
ind.
m2
)
(B) Neocalanus plumchrus
(C) Eucalanus bungii
12
8
4
0100
75
50
25
0
15
10
5
0100
75
50
25
0
45
30
15
0100
75
50
25
0173E 174E 175E 176E 177E 178E 179E
4
2
0
6
4
2
0
6
4
2
6
4
2
0
Stag
eco
mpo
sitio
n (%
)
C6C5C4C3C2C1N
Abun
danc
e(x
103
ind.
m
2 )St
age
com
posi
tion
(%)
Abun
danc
e(x
103
ind.
m2
)St
age
com
posi
tion
(%)
Abun
danc
e(x
103
ind.
m2
)St
age
com
posi
tion
(%)
Mea
nst
age
Mea
nst
age
Mea
nst
age
Mea
nst
age
Eddy line Non-eddy line
Fig. 6. (Saito et al.)

179E178E177E175E 176E174E173E172E0
1
2
3
Eddy line Non-eddy line
Neocalanus cristatus C5Neocalanus plumchrus C5Eucalanus bungii C5
Mea
n lip
id s
core
Fig. 7. (Saito et al.)