influence ofparticle size distribution in soil...
TRANSCRIPT

• October, 1965
Influence of Particle Size Distribution.in Soil Compaction
G. B. Bodman and G. K. Constantin
THIS ENDS VOLUME 36

The theory and experimentation reported are for the purpose ofdetermining the effect of particle size proportions in soils on theirmaximum bulk densities and other properties affected by compaction. If the different size classes in a bidisperse or tridisperse mixture have very large effective diameter ratios and if certain othersimplifying requirements are followed, it is shown theoreticallythat the minimum bulk volume of the mixtures can be predictedfrom the volume proportions of the different-sized particles present. The minimum bulk volumes and hence maximum bulk densities of two prepared textural sequences, Stockton silty clay andMonterey sand mixtures, were obtained after kneading compaction at different water contents and were examined with respect tothe above theory. The relationships between water content andcompacted bulk density, between water content and suction ofcompacted soils, and the formally calculated mean effective porediameter distribution at minimum and maximum bulk densityare presented and discussed.
TIlE AUTHORS:
G. B. Bodman is Professor of Soil Physics and Soil Physicist Emeritus, in the Experiment Station, Berkeley.
G. K. Constantin is Laboratory Technician in the Department ofSoils and Plant Nutrition, Berkeley.

G. B. Bodman and
G. K. Constantin
Influence of Particle Size Distributionin Soil Compaction'
INTRODUCTIONSOIL COMPACTION is the process of bringing solid soil particles closer together.When such rearrangement occurs, thebulk volume of the soil is said to diminish and the bulk density to increase.Soil bulk density is commonly used asa measure of soil compaction.
Compaction reduces the gross porespace and may be expected to cause anew frequency distribution of effectivepore sizes. Conceivably, a quantity ofsolid particles with a suitable geometricshape might be rearranged by compaction so that all voids are destroyed, butit is highly improbable that such a condition would ever occur in nature. Thespecific bulk volume of soil, however,may conveniently be thought of as lyingsomewhere between a lower limit equalto the specific particle volume (voidratio =zero) and an upper limit that israrely more than about two and onehalf times as great (void ratio = 1.5).2Between these limits the exact volume
that a given mass of soil will occupy isgreatly influenced by its recent history.Evidently the amount of further possible change in specific bulk volume of agiven soil, and the work required to produce additional change, depend on themagnitude of this volume with respectto the stated limits; in general, thesmaller the void ratio, the more difficultis yet further reduction (Bodman andRubin, 1948).
It is reasonable to suppose that,among other soil properties, particlesize distribution will influence the minimum bulk volume obtainable undergiven conditions of compaction. Thepurpose of this paper is to present evidence concerning the influence of particle size distribution on soil compaction and on some of the properties ofcompacted soil mixtures. It includes noanalysis of the forces causing compaction.
BULK VOLUME,S OF SIMPLIFIEDPARTICULATE SYSTEMS
When two lots of water-free, monodisperse, noninteracting solid particles aremixed, each lot being of any uniform
particle shape and possessing its owncharacteristic packing pattern and effective particle size, the newly created
1 Submitted for publication February 2, 1965.2 When considering a compressible particulate body such as soil the void ratio has a distinct
advantage over the porosity as' a quantitative expression of pore space. In a given body of soilmaterial the void ratio refers the volume of pores (non-solids) to the constant, solid-particlevolume, whereas the porosity refers the pore volume to the variable bulk volume. If e =void ratioand E = porosity, E = e/ (1 +e). The desirability of using the void ratio rather than the porosityis analogous to the desirability, in most soils studies, of expressing soil water content on the dryrather than on the wet basis.
[ 567 ]
568 Bodman and Constantin: Particle Size in Soil Compaction
bidisperse (binary) mixture will possessa bulk volume that generally is less thanthe sum of the original bulk volumes ofthe two monodisperse systems. Thegreater the difference in effective particle size of the two components, thegreater will" be the reduction in bulkvolume brought about by mixing. Thereduction also will depend upon theproportions of the different size classespresent and their respective packingpeculiarities. The limiting differencefor a binary mixture in any given proportions will be obtained when the effective diameter ratio between the twosize classes is sufficiently great thatboundary effects may be neglected. Thisreasoning may be extended to tridisperse (ternary) mixtures and polydisperse mixtures of a higher order. If thepacking pattern and total volume ofsolid particles of each size class presentare clearly defined, and certain simplifying assumptions are made, it is possible to introduce an orderly understanding of the volume changes thatoccur upon mixing. Early experimentaland explanatory studies of such changeswere made by Westman and Hugill(1930), and Westman (1936) with binary and ternary mixtures of smallspheres. Furnas and others have donesimilar work on the packing of large,irregularly shaped particles (reviewedby DallaValle, 1943).
In order to simplify consideration ofthe relation between particle size distribution and bulk volume of polydisperse mixtures created from differentsized monodisperse particles, certainassumptions will be made: (1) the particles do not interact; (2) the particlesof a given size class may be consideredhomogeneous with respect to effectiveshape, whatever that shape may be; (3)
effective size, shape, and abundance areunaltered by mixing; (4) when mixed,the geometrical boundary effects at particle surfaces, both within the mixturesand at the outer borders, are negligible,"(5) the packing pattern of a single sizeclass is definable by the void ratio characteristic of the class concerned at itsminimum bulk volume and persistswithin the matrix (see p. 569) or anycontinuous assemblage of that size class,after mixing; (6) any mixing processmay be used provided it does not affectthe other requirements. Only minimumbulk volumes will be considered in theresultant mixtures. This requirement isclearly necessary since, for a given mixture, none but the minimum obtainablebulk volume and void ratio is unique.Bulk volumes other than the minimacould be made to diminish upon furthermixing or upon more careful placementof individual particles.
The notched, triangular prism represented isometrically in figure 1A indicates minimum bulk volumes and voidratios of all tridisperse systems thatmay be produced by thorough mixing,in any proportions, of three monodisperse components which possess certaindefinite packing characteristics andfulfill the six specifications stated in thepreceding paragraph. The apices of theequilateral base represent the monodisperse systems themselves and are labeled c (coarse), m (medium), and f(fine). These letters are also used asidentifying subscripts in the discussion.Triangular coordinates are used in theconventional way on the base for defining the particle volume compositionof a mixture, so that the sum of solidsvolurnes of all different particle sizeclasses present equals unity for anysingle mixture, that is,
[1]
3 This is equivalent to requiring that internal boundary effects be negligible in a system ofinfinite ext ent.

HILGARDIA • Vol. 36, No. 15 • October, 1965 569
B DlFig. 1. A. Minimum bulk volumes and void
ratios of ideal ternary mixtures. B. Matrixtransition lines of ideal ternary mixtures projected on composition base.
The minimum bulk volume for anyonemixture is shown by the vertical distance from its volume composition pointto one of the oblique plane surfacesabove. Thus the solids volumes (Vsc,
V sm, V sf ) , the void ratios (c., em, ef),
and minimum bulk volumes (1 + ec,
1 + em, 1 + ef) of the three differentmonodisperse systems are shown alongthe three vertical edges of the prism, atc, m and f. Except at the apices andsides the vertical representing the bulkvolume of a ternary mixture is V bcmf =
1 + ecmf in which ecmf = mean void ratioof a definite mixture of c, m and I, andV bcmf = minimum bulk volume of thesame mixture. The three sides of theprism graphically portray the bulk volumes and void ratios of all members ofthe three kinds of binary mixtures, (c +m), (m +1), and (I +c). The actual conformation of the notched top of theprism depends upon the particular voidratio and minimum bulk volume of anassemblage of each size class whenpacked alone (that is, each of the threepossible monodisperse assemblages) .Construction of a scale diagram forgeneral discussion, therefore, requiresthe choice of definite, arbitrary valuesfor void ratios. Those chosen for figure1A were: ec =0.5, em =0.8, ef =1.0. Otherratios of reasonable magnitude, ofwhich any two or all three could havebeen equal, would have served equallywell for illustration.
Construction of the prism generallymust be based upon linear equationswhich, in turn, depend upon requirements (1) to (6) and interrelate thesolid-volume proportions of the different size-class components with bulkvolume and void ratio of binary andternary systems. The most importantequations are introduced in the following discussion.
The term "matrix" is useful. A matrix of any uniform size class, i, will besaid to exist in a mixture of differentsize classes at the minimum bulk volume, if the volume contribution of thatparticular size class to the bulk volumeof the mixture is given by the productV si(1 + ei) in which ei and V si are,respectively, the void ratio and particlevolume of the size class i. For this condition theb-ulk volume of size class iwill form a matrix of characteristicallypacked, tangent particles of class i inwhich particles of the other size classeswill be embedded. The embedded par-
l.t
1.0
1.f
m
c---------f
A

570 Bodman and Constantin: Particle Size in Soil Compaction
ticles, on the other hand, do not touchso as to form a continuous matrix ofcharacteristic packing pattern and voidratio except when the mixture containscertain critical volume proportions ofsolids of different size classes. Abruptchanges occur in the minimum bulkvolume-composition trends as one matrix transforms to another. It is evidentthat either medium or fine particles orboth can occupy the pores in a matrixof coarse; that neither coarse nor medium particles can occupy the pores ina matrix of fine, although they may bepresent among (that is, embedded by)the fine; and that fine particles are able,but coarse particles are unable, to occupy the pores in a matrix of medium.
The notches in the prism of figure 1A
are produced by three intersecting, oblique planes that indicate decreases ineem! and V bem! toward the center. Allplanes may be seen in the plan viewbut parts of only two are visible in theelevation of figure 1A: y intersecting theedge above c at V be = (1 + ee), and </>
intersecting the edge above f at Vb! =(1 + e!). The p. plane is hidden, but itspoint of intersection with the edgeabove m is visible at V bm =(1 + em). Thethree planes are the loci of minimumbulk volumes for which matrices ofcoarse (y plane), medium (p. plane),and fine (<p plane), respectively, existin the mixtures. The equations for thematrix planes are, within the limits indicated,
[2]
[3]
¢: V bcml = V B/(l + el) + V 3 C + V Bm [4]
The void ratios of the mixtures (eem!) positions at which transition occurs. Twoat any point in each plane may be ob- coexistent matrices are present alongtained by subtracting the sum of the vol- each of the transition lines. There is aurnes of solid particles (= 1) from the "triple point" (labeled z in plan) atbulk volume of the mixture in the the particle volume composition corappropriate equation. Intersections of responding to the absolute minimumthe planes create inward-sloping bulk volume. Matrices of each of the"troughs" and the straight lines of three size classes coexist at this pointintersection at trough bottoms marksharp transitions from one matrix con- and are, of course, completely inter-condition to another. If images of the penetrating.straight lines of intersection are verti- The proportions of two componentscally projected on the base (figure 1B), of those ternary mixtures that can packvolume composition lines are traced out to give the matrix transitions yip. andthat correspond to the innumerable com- p./cp are,
/. . V B C _ (1 + em)
l' J.L transition: -V am e;[5]
[6]J.L/¢ transition:
Since the e values in [5] and [6] areconstants, the proportions of two components in each of these two transitionsalso are constant until the absolute
V 3m _ (1 + el)V BI - em
minimum bulk volume composition isreached (point z, fig. 1B)· where thethird component also forms a matrix.
For the cply transition:

HILGARDIA • Vol. 36, No. 15 • October, 1965
But at V sm = 0 and nowhere else,
1
571
[7]
[7A]
It is evident that a constant ratioVsflV s c does not exist along the eplYtransition line [7] although it, too, leadsto a single matrix of the third com-
ponent beyond the point of absoluteminimum bulk volume.
The triangular coordinates for the absolute minimum bulk volume are
in which
[8]
[9]
[10]
a = [(1 + em + ec)(1 + e!) + emec]
Recalling the void ratios (ec = 0.5, lowing values at the absolute minimumem = 0.8, ef = 1.0) assumed for figure lA, bulk volume:we obtain, for our illustration, the fol- particle volume composition (equa-
tions [8], [9], [10])
V s c = 0.72; V sm = 0.20; V s! = 0.08,
bulk volume (equations [2], [3], or [4])
V bcm! = 1.08,
mean void ratio'
Cem! = (Vb cm! - 1) = 0.08
Calculation of the mean bulk density for class. At the absolute mimmum bulkany mixture requires knowledge of volume the mean bulk density is giventhe mean particle density of each size by
[11]
in which ps represents particle density,in units consistent with pb. If, in theillustration, the solid particle volumesare expressed in cubic centimeters,V s cm f =1000 em", psc =psm =P»! =2.65g/cm8
, and V bcm f =1080 em", bulk den-
sity at absolute minimum bulk volume,pbcmf = 2.45 g/cm8
•
Intersection of the matrix surfacesof figure 1A by a horizontal plane,placed normal to the prism axis, produces contour lines giving the positions
4. It is entirely by chance that void ratios were chosen so that VB! and ec m ! turn out to benumerically equal.

572 Bodman and Constantin: Particle Size in Soil Compaction
of equal minimum bulk volumes. If projected on the base, the contours revealthe very great number of mixtures having different particle size distributionsbut the same minimum bulk volume andvoid ratio. This is also clearly shown byequations [2], [3], and [4]. In a givenset of mixtures obeying the same packing rules, each of which conforms in behavior to an ideal ternary system, thereis, therefore, no unique connection be-
tween particle size distribution andminimum bulk volume or void ratio, except for the absolute minimum bulkvolume and its void ratio which can beproduced only by a single mixture ofdefinite size-class proportions (equations [8], [9], and [10]). Further examination of equations [1], [2], [3],and [4] adds to our general informationabout the contour lines, and it is seenthat:
along the l' matrix contours, dVs c
along the ¢ matrix contours, dV s! = 0, dl'P s c
along the JJ. matrix contours, dV.", = l dV./ andem
-dVsm
The same minimum bulk volume maybe produced by only two of each of thethree kinds of binary mixtures (consider a horizontal line drawn above.notch bottom on each of the prism
dV - - (1 + em) dVsc - sf
em
faces) except for the single minimumbulk volume corresponding to the matrix transition value, for which there isonly one composition.
PACKING OF REAL PARTICLESEquations [2] to [10] and the modelin figure 1 give the packing relationships for systems that rigorously fulfillthe specified requirements. There aredifferences when the concepts involvedare carried over to soils and other systems of real particles. The basic requirements that concern boundary influencesand particle interaction then need special attention.
Regardless of particle shape, complete avoidance of boundary effects incollections of noncoherent, noninteracting particles is possible only if effective diameter ratios are indefinitelylarge-that is, if dm/dn ~ 00, in whichd-« and dn are the diameters of the largerand the smaller of any two size-adjacentclasses. Boundary effects, both at particle surfaces and container walls, maycause noticeable departure from theideal relations of figure lA when experi-
ments are made with size classes havingfinite diameter ratios. The departuresbecome more conspicuous as dm/dn diminishes. Polydisperse systems that occur naturally, such as soils and unsortedsediments, commonly have fairly continuous particle-size representation. Diameter ratios of adjacent size classeswill therefore be finite and small in mostsoils and sediments, and deviationsfrom idealized packing may be considerable.
Interaction between particles of certain different size classes will not necessarily prevent an approach to the idealized ternary relations, provided that diameter ratios are large and that interaction fails to interfere with the creation of a minimum bulk volume equalto that which would occur in the absence of interaction. An example would

HILGARDIA • Vol. 36, No. 15 • October, 1965 573
be weak and temporary bonding that,owing to its destructibility, would notprevent thorough mixing and packingas described. Uniformly sized, stronglybonded clusters of smaller particles behaving as single larger particles mightalso offer little interference. Such clusters may be thought of as comprising asingle size class in idealized binary andternary systems, provided that the clus-
ters persist, preserve their characteristic void ratios during mixing, andmeet all remaining specifications. Eachcomplex component will then, of course,contribute a quota of fine, internal porespace in addition to the usual quota ofcoarser, inter-aggregate pore space, thelatter being characteristic of the packing pattern of aggregates when in theircustomary tangent assembly, en masse.
EXPERIMENTAL
Binary Mixtures of Noncoherent Particles
Two series of binary mixtures, A andB, were prepared from monodisperse,noncoherent particles of sand and small,solid glass spheres. After mixing, minimum void ratios (eob) were measuredfor comparison with the theoretical minimum void ratios (eth) determined fromequations [7A], [1], and [2]. Resultsare given in table 1 and are plotted infigure 2.
The monodisperse systems were prepared and their void ratios measuredbefore mixing, in the same way as thedifferent binary mixtures. Mixing andcompacting consisted of vigorously jar-
ring a vessel containing the coarse orfine particles, alone or as mixtures, until no further reduction in bulk volumecould be seen. There was no floating ofone class upon the other.
The measured void ratios of the monodisperse systems, fine and coarse in eachseries, respectively, were taken as providing the packing patterns and voidratios for the corresponding componentrnatrices in the binaries. This is in accord with our required basic assumption and is implicit in calculation of alltheoretical void ratios entered in table1. It may be pointed out that when void
TABLE 1
VOID RATIOS OF SOME BINARY MIXTURES AT THEIRMINIMUM BULK VOLUMES*
A. Coarse b~ads and fine be~ds B. Coarse sand and fine beadsde/dl = 11 dc/dl = 41
Volume ratio, Relative Volume ratio, Relativee/I e'h eOb deviation e/I et la eob deviation
0/100 ......... ..... 0.632 ..... 0/100 ........ ..... 0.632 . ....37.5/62.5........ 0.395 0.404 +0.023 36.6/63.4 ....... 0.401 0.400 -0.00247.4/52.6 ........ 0.332 0.358 +0.078 46.4/53.6 ....... 0.339 0.351 +0.03557.5/42.5 ........ 0.269 0.305 +0.134 56.5/43.5 ....... 0.275 0.287 +0.04468.0/32.0 ........ 0.202 0.275 +0.361 66.9/33.1. ...... 0.209 0.242 +0.15871.9/28.1 t ....... 0.177 ..... . .... 72.2/27.8 ....... 0.176 0.225 +0.27872.0/28.0 ........ 0.179 0.277 +0.547 73.7/26. 3t ...... 0.167 ..... . ....78.3/21. 7........ 0.282 0.319 +0.131 77.8/22.2 ....... 0.232 0.275 +0.185100/0........... ..... 0.637 ..... 100/0.......... . .... 0.583 .....
Sum ........ +1.274 Sum ....... +0.700Mean ........ +0.212 Mean ....... +0.116
• Effective diameters and densities of particles:
Coarse sand (quartz) .Coarse beads (solid glass) '"Fine beads (solid glass) .
DIAMETER1<1.2mm
0.300.027
P ARTICLE DENSITY2.614 gm/crn!2.5082.261
t Critical volume ratios corresponding to absolute minimum bulk volumes.

574
0.7
0.5
o-+-o 0.3~
"'0
o>
0.1
Bodrnan and Constantin: Particle Size in Soil Compaction
I
1.0~
oI
Partie Ie
0.5
0.5~f
volumeFig. 2. Minimum void ratios of binary mixtures of sand and beads, observed and theoretical,
showing effect of diameter ratio.
ratios and/or bulk volumes are plottedin relation to volume composition of thebinary (figure 2), the graph corresponds to the vertical, coarse-plus-fineface of the figure lA prism.
The two series consisted of particleshaving the diameter ratios, deldf (seriesA)= 11 and de/df (series B) = 41. Itwas possible, therefore, to examine theeffect of the ratio differences on the relative deviation (eob - eth) I eth.
Table 1 indicates the marked increases obtained between observed andtheoretical void ratios as the absoluteminimum void ratio is approached fromeither side. Thus, at about 37 per centfine particles, relative deviations are lessthan 0.025 (2.5 per cent) in both series.At a fine-particle content of about 28per cent, a composition correspondingclosely to the absolute minimum for themixture, the relative deviation has increased, in series A, to nearly 0.55; in
B to nearly 0.28. With yet further coarsening of the mixture the deviations decrease. Note, however, that with onlyone exception the deviations are muchless in series B (deld f = 41) than inseries A (deldf = 11).
Provided that mixing and packingare complete, the differences betweenobserved and theoretical values may beattributed entirely to the magnitude ofthe ratio of the effective diameters ofthe two components. The diameter ratioin both series is too small for the boundary irregularities to be without noticeable influence on the packing pattern.As the diameter ratio increases, however, the influence of one size class uponthe packing pattern of the other decreases.
Consider the changing conditions ineither series as the absolute minimumvoid ratio for the binary is approachedthrough the fine-particle matrix: (a)

HILGARDIA • Vol. 36, No. 15 • October, 1965 575
the coarse particles increase in numberat the expense of the fine; (b) the number of contact areas, coarse/fine, becomes proportionately greater; and (c)the more noticeable becomes the interference with the packing pattern characteristic of the fine-particle matrix.The relative deviations, therefore, increase.
If dc/df were very great, a second,coarse-particle matrix would be createdat that critical binary composition(equation 7A and table 1) corresponding to the smallest possible void ratio.In nonideal binary and ternary systems it seems uncertain that the coexistence of more than one matrix will everbe completely attained. But, as thecoarse particles increase and the finedecrease, interference with the coarseparticle packing pattern diminishes, acoarse-particle matrix eventually appears, and the relative deviation of thevoid ratio diminishes.
Polydisperse Systemsof Sand and Soil
For many years soil scientists andhighway engineers have studied thebulk density of soils in relation to moisture content after compaction has beenbrought about in different ways (Bodman, 1931; Proctor, 1933; Bodman andRubin, 1948; Vallerga, 1951; Day, 19551958; Li, 1956). Referring to the roleof particle size distribution in soil compaction, Marshall (1959, p. 71) stated,"For a given method of compaction, thehighest density is reached in soil thathas a wide distribution of particles from
coarse to fine (as in the sandy loam ofFig. 18). In this case the fine particlesfill up the gaps between the coarse. Highdensity is not reached in soil made upof coarse or fine particles only." Thefigure reference in Marshall's monograph is to a bulk density-water content graph for a set of four soils of different textures compacted by the Proctor method (1933). The role of particlesize distribution in compaction has beenmore closely examined in the experiments reported here. Also, attentionhas been given to the minimum bulkdensities which commonly appear atlow-moisture contents in the compaction process, as well as to the densitymaxima.
Preparation of materials for compaction. A series of eight mixtures withprogressively higher sand content wasprepared by the incorporation of sievedsand with previously sieved, air-dry<2 mm Stockton silty clay soil ofknown particle size distribution (table2). The sand and soils were first drymixed in the dry-weight proportions,sand/silty clay: 0/100, 20/80, 40/60,60/40, 80/20, 87/13, 93/7, 100/0. Thefirst five (0/100 through 80/20), respectively, possess the same particle sizeproportions by weight as are required(Soil Survey Staff, U.S. Department ofAgriculture, 1951) of: silty clay, clayloam, sandy clay loam, sandy loam, andloamy sand. The last three, containing87 per cent or more sand, belong in the"sands" group. Where necessary, weightproportions have been converted to volume proportions from the appropriate
TABLE 2
PARTICLE SIZE DISTRIBUTION OF STOCKTON SILTY CLAY*
U. S. sand U. S. silt U. S. clay
Dispersant--~-
Total2-1 1-0.5 0.5-0.25 0.25-0.10 0.10-0.05 50-20 20-5 5-2 2>
used mm mm mm mm mm u p. p. p.
-----~--------~---~------
per cent per cent per cent per cent per cent per cent per cent per cent per cent per centNone ......... 0.08 0.33 0.67 1.64 6.90 21.2 37.6 13.7 18.9 101H202 + calgon 0.05 0.80 1. 77 3.36 7.20 13.7 22.3 5.6 47.2 102
* Carbon content: 2.06%; p H (water-saturated soil paste) : 7.7.

576 Bodman and Constantiln: Particle Size in Soil Compaction
TABLE 3
POLYNOMIAL CONSTANTS OF EMPIRICAL EQUATION [14] RELATINGCOMPACTED BULK DENSITY TO WATER CONTENT FOR
FINE SAND-SILTY CLAY MIXTURES
ConstantsSolids volume ratio,fine sand/silty clay
Ico al a2 aa
0/100 ..... ........... .. 2.40 - 18.1 X 10⁻² 8.53 X 10⁻³ - 1.20 X 10⁻⁴
20.4/79.6 ............. 1.92 - 13.4 X 10⁻² 7.85 X 10⁻³ - 1.25 X 1(,-4
40.6/59.4 ........ ........... 2.04 - 21.9 X 10⁻² 18.7 X 10⁻³ - 4.33 X 10⁻⁴
60.6/39.4 .... .............. 2.02 - 25.7 X 10⁻² 29.2 X 10⁻³ - 8.79 X 10⁻⁴
80.3/19.7 ................. 1.61 - 8.46 X 10⁻² 16.9 X 10⁻³ - 6.89 X 10⁻⁴
86.7/13.3 ................... 1.50 - 0.344 X 10⁻² 7.5 X 10- 3 - 4.38 X 10-.93.2/6.8 .................... 1.56 + 1.16 X 10⁻² 1.77 X 10⁻³ - 1.45 X 10⁻⁴
solid densities. The volume proportionsare given in table 3 and later.
Two grades of sieved "Monterey crystal amber quartz" were used separately:1 < 1.19 mm (= D.S.D.A. very coarsesand, or International coarse sand) and0.25 < 0.297 mm (= D.S.D.A. mediumsand, or International coarse sand):"Thus two particle size sequences wereprepared, the members differing onlyin the sand grain-size distribution andin the class names (Soil Survey Staff,D.S. Department of Agriculture, 1951)assigned to those mixtures having morethan 85 per cent sand. According toD.S.D.A. terminology, mixtures containing 1 < 1.19 mm sand would betermed "coarse sands" and those containing 0.25 < 0.297 mm sand would benamed "sands." The two groups will bedistinguished in this discussion by thenames "coarse sand" and "fine' sand"mixtures, respectively, to emphasize thealmost fourfold difference in grain sizeof the added sands.
The sixteen dry mixtures were nextgiven identical treatment. They werewater-saturated, drained in contact withdry sand to remove excess water, further mixed, and thoroughly puddledin a Hobart food mixer, removed, spreadas a 1/2-in . layer on a plastic sheet, slicedinto 2-in. squares for easy breakage, andallowed to dry. They were then exposed
to three additional wetting-drying cycles by gently spraying with an atomizer to about their field capacity, andair-drying three times. After breakage,the dry lumps were rubber-pestled to%,-in. size, further reduced by passagethrough a mill with widely spacedgrinding plates, sieved finer than 2 mm,and stored for use.
The 'whole procedure was designed toprepare mixtures having some resemblance to a set of natural soils in a texture sequence in which, for each member, the chemical composition and particle shape of clay, silt, and sand wereconstant.
The following procedure was adoptedto insure uniform wetting of the soilmaterial before compaction for the bulkdensity-water content measurements.About 1 kg of the given air-dry mixturewas divided into 100 gm lots and filled,layer by layer, into a glass jar, eachlayer being wetted when placed in thejar by adding one-tenth of the amount ofwater needed to bring the entire sampleto the required water content. The jarwas sealed and, at intervals of 24 hours,the contents were emptied on a plasticsheet and slowly hand-mixed, withoutpuddling, then returned to the jar andresealed. After three such treatmentsthe mixture to be compacted was placedin a covered bowl. Sufficient material
5 Both size classes of sand were examined under the microscope and found to contain angularand subangular shapes. The coarse sand was more uniformly subangular than the fine sand. Despite long continued sieving the fine sand particles possessed more size variability than the coarse.

HILGARDIA • Vol. 36, No. 15 • October, 1965 577
was removed, by random spoon sampling, to a copper compaction cylinderwhich was fitted at the top with an open,removable extension ring to avoid endeffects at top of compacted sample inthe lower cylinder.
Compaction procedure. During thefilling one-sixth of the total materialwas placed in the cylinder, with extension ring in place, and compacted. Theprocess was repeated with a secondsixth, and so on, until all had been compacted. The topmost part of the compacted column was now cut off, horizontally, below the extension ring. Trialsshowed that this excess contained anamount of water representative of themoisture content of the whole column.This percentage was used in considering the final water content-bulk densityrelationships. The cylinder proper, withcompacted contents, was then weighed,and after proper corrections the drybulk density of the compacted materialwas calculated.
Kneading compactor. A mechanicalkneading compactor, operated by compressed air and delivering pressure tothe soil surface through an aluminumtamping foot, was used as an arbitrarymeans of compacting the soil. Duringcompaction the soil was held in the copper cylinder, 77.5 mm high by 73.5 mmi.d. (inside diameter) and having wallthickness of 3 mm. The machine, designed by P. R. Day, has the essentialfunction of that described by Vallerga(1951) for higher pressures. The compacting foot, 38.1 mm diameter by 12.7mm thick, is of equilateral cross-sectionwith sides having the same curvatureas the inner wall of the cylinder and alength equal to one-sixth of the inner
wall. The tamping pressure and dwelltime of the foot on soil surface are controlled by a pressure switch and a timedelay relay. When the downward-moving foot reaches the soil surface, thebearing pressure increases from zeroto the prescribed maximum, the footdwells briefly, moves upward, and soallows a return to zero pressure. A synchronized gear then rotates the cylinderso that the next downward stroke bringsthe foot to bear on an adjacent area ofsoil, and the process is repeated. Thereis slight overlap at the rear convex edgeof the foot. Six such processes correspond to one revolution of the cylinder.Day (1955-1958), using a hand kneading compactor, has shown for severalsoils that a maximum pressure of 20psi (pounds per square inch) deliveredin this way, 30 strokes per layer of soil,creates a maximum bulk density similarto that in compacted zones in cultivatedfield soils. Preliminary experiments ofonr own with the experimental soils andthe machine kneading compactor indicated that, on a bulk density-numberof-strokes plot « 96 strokes) , 48strokes per layer, increasing to a maximum of 20 psi, produced bulk densitieslying within 10 per cent of the apparentmaximum for the silty clay soil andwithin 1 per cent of this maximum fora sandy soil containing 80 per centadded fine sand. Accordingly, duringthe cylinder-filling process describedearlier, the soils were compacted by atotal of 48 strokes per layer, each strokeincreasing to a maximum of 20 psi. Replicate specimens, when prepared andcompacted with this machine in the described manner, give closely agreeingbulk densities.
RESULTS AND DISCUSSIONIn real polydisperse systems of soils
having very many size classes, boundary effects presumably are pronounced,owing to the number and proportionsof classes commonly involved, and to
forces of adsorption and mutual attraction displayed by the clay and organicmatter.
These complexities may be simplifiedto some extent by thinking of the poly-

578 Bodman and Constantin: Particle Size in Soil Compaction
1.3
1.9
1.7
roEu<,O'l
U>CQ)
-0 I.5
~ 0::J
CD
0.300.06 0.14Gm water
o 0.22per gm solids
Fig. 3. Compaction curves of fine sand-silty clay mixtures. Labels on curves show percentagesof added sand.
disperse system as having a greatly reduced number of size classes, each classbeing polydisperse but, insofar as packing is concerned, acting as a single sizeclass in accordance with the basic assumptions described earlier. This pointof view was adopted in the present experiments for the purpose of comparing observed and "theoretical" values:the added sand in the sand-silty claymixtures was thought of as the coarsecomponent, and the Stockton silty clayas the fine component. From this pointof view, therefore, in order to examinethe effect of variation in particle-sizedistribution upon compacted bulk densities, the compacted density and voidratio of the silty clay loam alone arerequired, in addition to those of theadded sand. The mixtures of intermediate composition are then compactedand, with the end members, are re-
garded as a series of binary mixtures.Compaction curves. The bulk den
sity-water content functions for eachcomposition parameter appear in figure3. Each curve, except that for 100per cent fine sand, shows that withincrease in water content during standard compaction there is first a decreasein bulk density to a minimum, then anincrease to a maximum and finally, nearsaturation, a second decrease. The minimum and maximum densities increasedas sand content increased to 80 per centwhereas, with yet further sand increases,the minima increased and the maximadiminished. Similar curves representing higher densities were obtained forthe coarse sand and soil mixtures.
For the fine sand mixtures having amatrix of silty clay, the dry bulk den-
. gm watersity (y) -water content (x= rds)
gmso 1
relations are approximately represented

HILGARDIA • Vol. 36, No. 15 • October, 1965
by equations of the following types:for maximum bulk densities,
1-=ax+by
for minimum bulk densities,
579
[12]
y = ke cx [13]The particle densities of the sand and bulk density of a completely water-satusilty clay in our mixtures were unequal, rated soil. As shown later (table 4),so the numerical value of b in equation none of the mixtures were completely[12] and of k and c in [13] vary slightly saturated at their maximum density.from one mixture to another. They are For bulk densities and water contentstrue constants only if the mean soil lying between the maximum and miniparticle density is the same for both mum densities, the experimental datacomponents. Equation [12] gives the fit closely to cubic polynomials,
[14]
The remaining symbols in the equationshave the meanings:
a = specific volume of waterb =specific particle volume of solidse =base of natural logarithmsao, al,a2,a-; are constants.
Table 3 summarizes the equation [14]constants obtained for the fine sandmixtures.
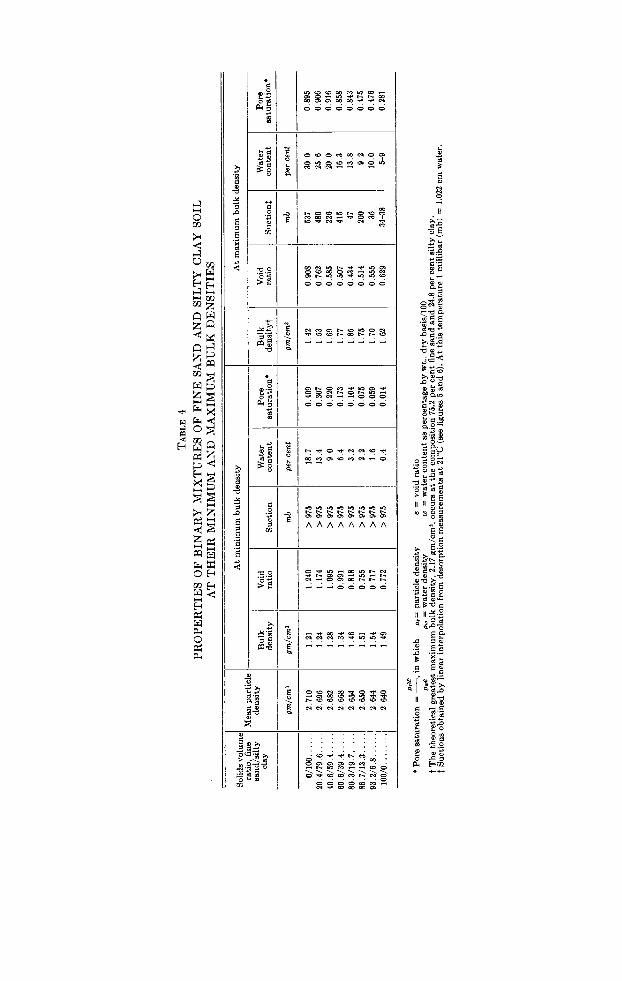
For a given soil, the existence of asoil bulk-density maximum in the compaction curve relating its bulk densityand water content, as demonstratedhere, is well known, These experimentsfurther establish the existence of a minimum bulk density throughout a seriesof textures. Also, it now seems that forsoils of different particle size distribution the arrangement of the curves follows a definite texture sequence andthat, as more clearly seen in figure 4,the position of each bulk density maximum (bulk volume minimum) occupiesa rational place on a binary compositiondiagram based on certain gross but definable packing rules. The greatest bulkdensity maxima were obtained withmixtures having loamy sand textures,regardless of the particle size of thesand component.
Bulk density minima are pronouncedin figure 3, and also fall into a texture sequence. Since they correspond tobulk volume maxima, however, they donot follow the same packing rules and
are not amenable to the same treatmentas the density maxima. Table 4 givesthe critical bulk densities obtained forthe fine sand-silty clay mixtures, together with certain other associatedproperties.
Influence of the diameter ratio oncloseness of particle packing has beenshown in figure 4 by plotting the bulkvolume minima obtained by separatecompaction of both coarse sand-siltyclay mixtures and the fine sand-siltyclay mixtures. The added coarse sand,as stated earlier, has an effective diameter some four times as great as that ofthe fine sand. Deviations of the observedminimum bulk volumes from the corresponding theoretical minima may beseen by comparing the curves and thestraight lines. To avoid confusion infigure 4, the intersecting straight lines(loci of theoretical values) for only thefine sand-silty clay mixtures have beendrawn since, in the silty clay matrix,the theoretical values for the coarsesand mixtures would have been superimposed on those for the fine sand mixtures and would have been very closeto the latter in the sand matrix region.The plot of the bulk volume minima ofthe coarse sand-silty clay mixtures liesnoticeably closer to the theoreticalvalues than do those of the fine sandmixtures. This is attributed mainly tothe increased diameter ratio in the
TA
BL
E4
PR
OP
ER
TIE
SO
FB
INA
RY
MIX
TU
RE
SO
FF
INE
SAN
DA
ND
SIL
TY
CL
AY
SO
ILA
TT
HE
IRM
INIM
UM
AN
DM
AX
IMU
MB
UL
KD
EN
SIT
IES
Sol
ids
vo
lum
eA
tm
inim
um
bu
lkd
ensi
tyA
tm
axim
um
bu
lkd
ensi
tyra
tio,
fine
Mea
np
arti
cle
san
d/s
ilty
den
sity
Bu
lkV
oid
Wat
erP
ore
Bu
lkV
oid
Wat
erP
ore
clay
den
sity
rati
oS
uct
ion
con
ten
tsa
tura
tio
n*
den
sity
jra
tio
Suc
tion
'[co
nte
nt
satu
rati
on*
gm
/cm
3g
m/c
m3
mb
per
cent
gm
/cm
3m
bpe
rce
nt
0/10
0..
....
2.71
01.
211.
240
>97
518
.70.
409
1.42
0.90
853
730
.00.
895
W.4
/79.
6..
...
2.69
61.
241.
174
>97
513
.40.
307
1.53
0.76
248
025
.60.
906
10.6
/59.
4..
...
2.68
21.
281.
095
>97
59.
00.
220
1.69
0.58
522
620
.00.
916
50.6
/39.
4..
...
2.66
81.
340.
991
>97
56.
40.
173
1.77
0.50
741
516
.30.
858
~O.3/19.7..
...
2.65
41.
460.
818
>97
53.
20.
104
1.85
0.43
447
13.8
0.84
3~6.7/13.3..
...
2.65
01.
510.
755
>97
52.
20.
075
1.75
0.51
420
09.
20.
475
}3.2
/6.8
....
..2.
644
1.54
0.71
7>
975
1.6
0.05
91.
700.
555
3610
.00.
476
100/
0..
....
..2.
640
1.49
0.77
2>
975
0.4
0.01
41.
620.
629
34-3
85-
90.
281
Ipa
W*P
ore
satu
rati
on
=-,
inw
hic
hp
,=p
arti
cle
den
sity
e=
vo
idra
tio
pwe
pw=
wat
erd
ensi
tyW
=w
ater
con
ten
tas
per
cen
tag
eb
yw
t.,
dry
basi
s/10
0tT
he
theo
reti
cal
gre
ates
tm
axim
um
bu
lkd
ensi
ty,
2.17
gm
/cm
-,oc
curs
at
the
com
po
siti
on
75.2
per
cen
tfi
nesa
nd
and
24.8
per
cen
tsi
lty
clay
.tS
uct
ion
so
bta
ined
by
lin
ear
inte
rpo
lati
on
from
des
orp
tio
nm
easu
rem
ents
at
21°C
(see
figu
res
5an
d6)
.A
tth
iste
mp
erat
ure
1m
illi
bar
(mb
)=
1.02
2em
wat
er.

HILGARDIA • Vol. 36, No. 15 • October, 1965 581
0.7
0.9
o 0.5
o fine sand» silty cloye coarse sand
+ silty cloy
0.3
+-o'-
'"0
o>
0.1
0.5
0.5I
1.0~ Vs (sa.IoI
ParticleVs (st. ct.)
volume
6I~O.J
Fig. 4. Minimum void ratios of binary mixtures of sand and silty clay in relation to composition, observed and theoretical, showing effect of diameter ratio.
coarse sand mixtures as well as to frictional resistance to bulk volume reduction in the fine sand mixtures, to someslight interaction at fine sand particlesurfaces, and possibly to entrapped air.Mechanical interference is inevitable inany practical method of packing realsoil particles more closely and in fieldcompaction. Departures from theoretical behavior, however, generally mustbe attributed also to nonideal particleproperties.
The theoretical minimum void ratiosfor the fine sand mixtures of figure 4,including the smallest minimum, andthe theoretical minimum bulk volumes,together with their binary compositionvalues may, of course, be obtaineddirectly by carefully reading the graph.
They may also be obtained by use of theequations for the fine sand and siltyclay matrices, respectively. The addedfine sand is much coarser than the siltyclay so that, for the present purpose,the subscript c may be used for the finesand and the subscript f for the siltyclay. For the fine sand matrix, V bc! =V sc (1 + ec); for silty clay matrix,V bc!=V s! (1 + e!) + V sc. At the lowestminimum the two straight lines corresponding to these equations intersect sothat V sc (1 + c.) = V s! (1 +e!) + V sc, andwe obtain Vs!/Vsc=ec/ (l+ef). (Thisis equation [7A] .) From the appropriate measured void ratios (table 4, lines1 and 8 under column 9, ef = 0.908, ande; = 0.629) and from equations [1] and[7A], we obtain V sf =0.248 and V sc =

582 Bodman and Constantin: Particle Size in Soil Compaction
0.752 at the smallest minimum bulk volume. The mean particle density for theseproportions is 2.658 gm/cm" (table 4, byinterpolation in column 2). From thesmallest minimum hulk volume of themixture (either sand matrix or claymatrix equation above) and the meanparticle density, we obtain: theoreticalsmallest minimum void ratio = 0.225,corresponding minimum bulk volume =(1 + 0.225) =1.225 units, and greatestmaximum bulk density =2.658/1.225 =2.17 gm/cm", It is seen that the lowestexperimental void ratio greatly exceeds0.225 (table 4), but occurs at a volumecomposition ratio (table 4 and figure 4)VS(fLsa.) / VS(SLCI.) that is very close tothe theoretical composition for suchminimum.
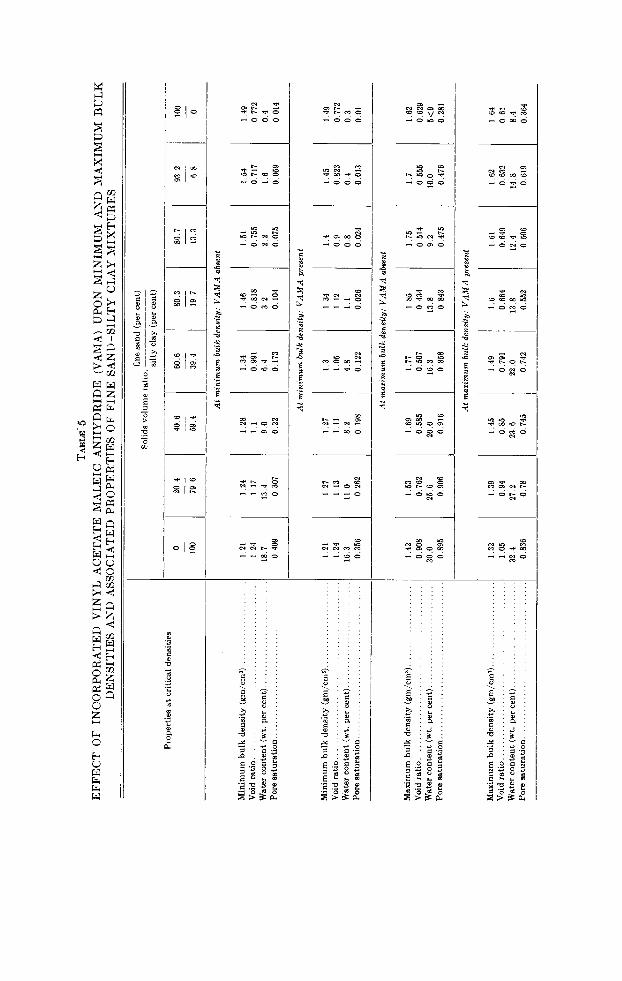
Effect of incorporated polymer oncompaction. An additional set of finesand-silty clay mixtures was compactedafter prior incorporation, in the drystate, of 0.4 per cent by weight of vinylacetate maleic anhydride (VAMA). Inall other respects the precompactiontreatments of these soils were identicalwith the previously described treatments given the same soils for whichVAMA was absent. The results for maximum and minimum bulk densities, withVAMA, are contained in table 5.
The compaction curves were similarto those obtained earlier. The bulk density minima, as before, were found atthe lower moisture contents, and themagnitudes of the minima diminishedwith increasing abundance of fine particles. Compared to soils lacking VAMA,the minima appeared to be only slightlylowered by the added VAMA, and thisonly with soil mixtures containing 80per cent 'or more added fine sand. Theminima occurred, however, at lowerwater contents and at lower pore saturations. The maximum densities, on theother hand, were significantly diminished by VAMA additions to all but thepure fine sand, which was unaffected.An average decrease of 0.18 gm/cu, cmin maximum bulk density was obtainedwith the silty clay and the six mixtures,
the most pronounced decreases (about0.25 gm/cu. cm) occurring in and nearthe middle part of the binary sequence.For all mixtures except that having thegreatest maximum bulk density, the reduction produced by VAMA was accompanied by an increased water content atwhich the maximum was produced.Within the silty clay matrix group,there was also a decrease in pore saturation. Mixtures in the sand matrix showedan increase in degree of saturation.
Desorption. Desorption curves wereobtained for three lots of compactedfine sand-silty clay mixtures by measuring suction and water-content values atsuctions of from 10 to 1000 cm of water,and also the water content at zero suction, toward which complete saturationwas aimed and which was assumed toexist. The mixtures were first broughtto water contents previously found necessary to produce the maximum andminimum densities for each mixture.Two of the three lots were compacted totheir minimum and maximum densitiesbefore desorption. The third lot was firstmixed with 0.4 per cent by weight ofVAMA, followed by compaction of eachmixture to the maximum density beforedesorption. Precompaction procedurefor all materials was exactly the same asthat adopted and prescribed for theother experimental runs.
Attempts were made, first, to transfer sections of the compacted soils fromcopper cylinder to desorption plate.Owing to difficulty in avoiding irregular breakage and loss with the noncoherent, low-density members duringtransfer, however, these efforts wereabandoned. A special small cylinderand porous plate were constructed, asa unit, in which a shallow column ofsoil could be placed for retention during standard kneading compaction directly against the plate. Transfer wasthus avoided and desorption could begin as soon as suitable connections enabled pressure differences to be established across the plate.
Pro
per
ties
at
crit
ical
dens
itie
s
TA
BL
E-5
EF
FE
CT
OF
INC
OR
PO
RA
TE
DV
INY
"LA
CE
TA
TE
MA
LE
ICA
NH
YD
RID
E(V
Al\1
A)
UP
ON
MIN
IMU
MA
ND
MA
XIM
UM
BU
LK
DE
NS
ITIE
SA
ND
AS
SO
CIA
TE
DP
RO
PE
RT
IES
OF
FIN
ES
AN
L/-
SIL
TY
CL
AY
MIX
TU
RE
S
fine
san
d(p
erce
nt)
Sol
ids
vo
lum
era
tio,------
silt
ycl
ay(p
erce
nt)
--~f
a--r
~:::-
1::~--I--:::
-1-::~--I--
:::--I-~l-~:-
------------------
At
min
imu
mbu
lkde
nsit
y:V
AM
Aab
sent
Min
imu
mb
ulk
den
sity
(gm
/cm
-)."
.V
oid
rati
o"
.W
ater
con
ten
t(w
t.p
erce
nt)
.P
ore
satu
rati
on
....
....
....
....
....
....
....
..
.
1.21
1.24
18.7
0.40
9
1.24
1.17
13.4
0.30
7
1.28
1.1
9.0
0.22
1.34
0.99
16.
40.
173
1.46
0.81
83.
20.
104
1.51
0.75
52.
20.
075
1.54
0.71
71.
60.
059
1.49
0.77
20.
40.
014
At
min
imu
mbu
lkde
nsit
y:V
AM
'Apr
esen
t
Min
imu
mb
ulk
den
sity
(gm
/cm
e)..
....
....
....
....
....
1.21
1.27
1.27
1.3
1.34
1.4
1.45
1.49
Voi
dra
tio..
....
....
....
....
....
....
....
....
....
....
...
1.24
1.13
1.11
1.05
1.12
0.9
0.82
30.
772
Wat
erco
nte
nt
(wt.
per
cent
)...
....
....
....
....
....
....
16.3
11.0
8.2
4.8
1.1
0.8
0.4
0.3
Po
resa
tura
tio
n..
....
....
....
....
."
....
....
....
....
.0.
356
0.26
20.
198
0.12
20.
026
0.02
40.
013
0.01
At
mo
aim
um
bulk
dens
ity:
VA
_MA
abse
nt
Max
imu
mb
ulk
den
sity
(gm
/cm
-)..
....
....
....
....
...
1.42
1.53
1.69
1.77
1.85
1.75
1.7
1.62
Voi
dra
tio..
....
....
....
....
....
....
....
....
....
....
.0.
908
0.76
20.
585
0.50
70.
434
0.51
40.
555
0.62
9W
ater
con
ten
t(w
t.p
erce
nt)..
....
....
....
....
....
....
.30
.025
.620
.016
.313
.89.
210
.05
<9
Po
resa
tura
tio
n..
....
....
....
....
....
....
....
....
....
..0.
895
0.90
60.
916
0.85
80.
843
0.47
50.
476
0.28
1
At
ma
xim
um
bulk
dens
ity:
VA
MA
pres
ent
Max
imu
mb
ulk
den
sity
(gm
/cm
")..
....
....
....
....
....
1.32
1.39
1.45
1.49
1.6
1.61
,1.
62
I
1.64
Voi
dra
tio..
....
....
....
....
....
....
....
....
....
....
.1.
050.
940.
850.
791
0.66
40.
649
0.63
20.
61W
ater
con
ten
t(w
t.pe
rce
nt).
....
....
....
....
....
....
..32
.427
.223
.622
.013
.812
.414
.88.
4P
ore
satu
rati
on..
....
....
....
....
....
....
....
....
....
.0.
836
0.78
0.74
50.
742
0.55
20.
506
0.61
90.
364
-

584 Bodanam and Constarntiln: Particle Size in Soil Compaction
applied to the moist soil so as to produce a total of nine known suctions,from 10 to 1000 ern water. Equilibriumwas assumed to have been reached, under any given suction, if water outflowceased for 2 hours. The mean laboratorytemperature during desorption wasabout 21°C with only small fluctuations.
The volume of water removed in relation to applied suction forces wasmeasured by inspection of the meniscuslevel in the burette. This level was always maintained equal, within 1 mm,to that of the soil sample by an electricrelay and motor geared to the burettesupport. With progressive desorptionthe rising meniscus was made to closean electric circuit, causing the motorto lower the burette 1 mm. The instantof each lowering was punched on recording tape, which provided the criterion for equilibrium.
After equilibration with a suction of1000 em of water (979 millibars at 210
C) the burette stopcock was closed toprevent water re-entry, the pressure released, and the pressure cylinderopened. The soil cylinder was movedsideways off the porous plate andweighed immediately. The water remaining in the soil against this suctionwas determined by drying to 105°C.Amounts of water released and retainedwere calculated in terms of volume-perunit volume of solids and their sum wasassumed equal to the initial void ratioof the saturated, compacted soil.
Desorption curves for the fine sandsilty clay mixtures are shown in figures5, 6, and 7 which refer, respectively, tosoil mixtures first compacted to theirminimum bulk densities. (5), the samemixtures first compacted to their maximum bulk densities (6), and to mixtures with which VAMA had been incorporated before compaction to maximum densities (7). The water contentis expressed in these figures as em" waterycm" solids. It may be converted toa weight ratio, dry basis, by dividingby the specific gravity of the corres-
The cylinder consisted of two concentric rings of epoxy plastic, each 15mm high by 80 mm i.d., and resteddirectly upon a cylindrical bottomsection of equal o.d. (outside diameter) .A porous alundum plate," having aribbed and grooved lower surface, wasfitted into a countersunk recess in theupper part of the bottom s-ection, forming the bottom for the two upper rings.A chamber 2 to 3 mm deep accommodated, and its bottom surface supported,the lower part of the plate, allowing theescape of water through an externalnipple. A small vent, fitted with a plugfor sealing, was provided to remove anyair entrapped in the chamber.
Before kneading compaction the tworings and the bottom porous-plate section were clamped together. Sufficientsoil was added from the moistened stocksupply to fill the lower ring and wascompacted, in position, with 48 strokesat 20 psi. A second soil layer was thenadded to fill the remaining space in thecylinder and similarly compacted. Theclamps were next removed and the upper ring separated from the lower, Thesoil column was cut so as to leave a lower15 mm-high segment of compacted soilsurrounded by the lower ring and incontact with the alundum plate. To minimize volume changes in the upper fewmillimeters of the mixtures during water uptake, a surface-bearing pressureof about 1 psi was applied by placinga fine metal wire screen and weightedplate on top of the column. A plastictube, % in. o.d., was attached to thenipple, the soil and the porous platewere saturated under vacuum with airfree water, and the entire assembly wasthen placed in a gas pressure chamberwithout loss of water. Connection wasmade from the plate chamber to the bottom of a vertical burette. Care was takenduring the transfer and connection process to keep the connecting tube openingat the soil level to avoid subjecting soilwater to pressure changes.
A series of pressure increases was now-----
6 Alumina powder, A.D. 85 (Coors), was fired for 1 hour at 1750°F to make the plate.

HILGARDIA • Vol. 36, No. 15 • October, 1965 585
per cent fine sand1.2
sn 1.0-0
0(,/)
rt> 0.8Eu 0<,~
Q) 0.6+-0 203:
rt> 0.4 40Eu 60
0.2 808793
01
1010 20 40 80 175 350 1000
Suction,cm water
Fig. 5. Suction desorption curves of fine sand-silty clay mixtures after compaction to minimumbulk density.
I I I
per cent fine sand
lo
175 35080402010
U> 1.0"D
0U>
rr> 0.8Eu<,
L 0.620~
rr> 0.4Eu
0.2
01
Suction, cm waterFig. 6. Suction desorption curves of fine sand-silty clay mixtures after compaction to maximum
bulk density.

o
20
40
6093
~--.o;;;;;;;:~~ 8087100
per cent fine
Bodman and Constantin: Particle Size in Soil Compaction
10 20 40 80 175 350 1000
Suction,cm water
586
1.2
en 1.0~
0en
rt') 0.8Eu<,~ 0.6Q)+-0~
rr> 0.4Eu
0.2
0
Fig. 7. Suction desorption curves of fine sand-silty clay mixtures after VAMA incorporationand compaction to maximum bulk density.
ponding mixture (see table 4 for meanparticle densities). Since the specificgravities of all mixtures are similar,the mean specific gravity of all may beused, and a close approximation to thepercentage of water by weight, drybasis, is then obtainable for any mixtureby multiplying the volume ratio by37.5 (= 100/2.668).
Table 4 presents properties of the binary mixtures at their critical densities.All entries are equilibrium values, thesuctions having been measured, as described, by compaction of separatesamples on a porous plate after firstbeing brought to the moisture contentspreviously established for their criticaldensities. Except for very small evaporation loss around the tamper, no waterwas lost from samples during compaction, and V w I V s remained substantially constant. Compaction, however,reduces the size and total volume ofpores, so that equilibrium suctions aftercompaction are not the same as before.
The desorption curves for the mix-
tures at their minimum densities (figure5), beginning at saturation, are characterized by sharp breaks at low suctions: 10 cm for the two mixtures withthe most sand, and about 20 cm for theremainder. A texture influence seemsclear over the measured range of suctions; the 86.7 sand/13.3 silty clay mixture is an exception. At suctions lessthan 20 em this mixture holds amountsof water equal to those of the 60.6 sandy39.4 silty clay mixture. At higher suctions, however, the curve for the formermixture shifts and assumes a consistentposition in the texture sequence. Desorption at a suction of 979 millibars(1000 cm water suction) reduced thewater content of all mixtures at theirminimum bulk densities below that towhich the corresponding mixtures werereduced at this suction after compactionto their maximum densities (cf. figure6) .
The void ratios of the mixtures attheir maximum bulk densities lie between 50 and 80 per cent of those at the

HILGARDIA • Vol. 36, No. 15 • October, 1965 587
Pore size, micronsFig. 8. Frequency distributions of mean
effective pore diameter after compaction ofmixtures to their minimum and maximumbulk densities.
its maximum bulk density, even morewater per unit volume of solids thanit retains after compaction to its minimum density in the absence of VAMA.Similar effects are observed over muchof the suction range for the 93.2/6.8cm, and 86.7/13.3 mixtures. The effectof VAMA on water retained at 1000cm of water suction is relatively small,except for the soils having a sandmatrix packing.
Mean effective pore size. The capillary rise equation was used for formalcalculation of the mean effective porediameter corresponding to each equilibrium suction applied to the soil.Upon this basis the volumes of poreshaving different mean effective diameter limits were calculated for each compacted sample by assuming no soilshrinkage and a water density, beforewithdrawal, of 1 gm/cu. em for all suctions up to 979 millibars (table 6). Figure 8 includes curves indicating poresize frequency for all of the compacted
c:'.".---- ...... ,>
'~~E 2'8 7~ IT ~ ~/ I
o ----------=/~O per centfine sand100[
5~l_-=-----~ 20
100 [5~r /--'-- /- 40
100[ minimum density
5~l __~---~ ~ 60
100l maximum density50 _----_. ;/0~~80
I~~[ ~;---_Ol~-=--87
100l50 ~_o / ~_93
I~[[~I 1100o 298 74 17
cQ)o"Q)
a.>.ocQ):::JxrQ)
Lot
minimum densities. At full saturation,therefore, and at zero tension, the volume of water retained per unit volumeof solids at maximum density is proportionately less. The desorption curvesindicate this difference (figure 6) .Moreover, no sharp breaks appear in thecurves for any of the mixtures containing 80 per cent or less of added finesand, although the rate of loss with increasing suction is slightly greater atsuctions exceeding 40 to 80 cm than itis at the very low suctions. The curvesfor mixtures having 87 per cent andmore of added fine sand break sharplyat suctions of 20 cm. Evidently thesetwo categories of desorption curves forthe maximum densities belong, respectively, to the silty clay and sand matrices. The curve for the 80 per centfine sand: 20 per cent silty clay mixtureis of intermediate form. This mixturehas a sand matrix but contains onlyslightly more sand than is necessary tocause transformation from the matrixof silty clay. The entire set of desorption curves thus appears to reflectclearly the differences in particle sizecomposition as these differences are associated with the alterations in packinginduced by compaction.
The incorporation of 0.4 per centVAMA before compaction to the maximum bulk density does much to preserve an open packing of the soil particles. The desorption curves of figure7 indicate that, although the mixtureswere previously brought to the watercontents necessary for compaction totheir maximum bulk densities and thencompacted, the effective particle arrangement-as shown by water releaseunder suction-is as though compactionhad been brought about at much drierconditions. The curves are generallyvery similar in position and shape tothe desorption curves obtained for theminimum bulk densities. At suctionsgreater than 20 cm water, however, thefine sand alone with which VAMA hasbeen mixed retains, after compaction to

TA
BL
E6
DIS
TR
IBU
TIO
NO
FC
AL
CU
LA
TE
DM
EA
NE
FF
EC
TIV
EP
OR
ED
IAM
ET
ER
SA
TM
INIM
UM
AN
DM
AX
IMU
MB
UL
KD
EN
SIT
IES
OF
FIN
ES
AN
D-S
ILT
YC
LA
YM
IXT
UR
ES
Mea
nef
fect
ive
pore
dia
met
er(m
icro
ns)
Sol
ids
vo
lum
eW
ater
II
II
II
II
Iof
add
edsa
nd
Bu
lkco
nte
nt
at>
298
298-
149
149-
74.5
74.5
-37.
337
.3-1
717
-8.5
8.5
-5.4
5.4
-4.3
4.3
-3.0
3.0
>(p
erce
nt)
den
sity
satu
rati
on
(wt.
per
cent
)D
istr
ibu
tio
nas
perc
enta
geof
tota
lpo
rev
olu
me
0.0
min
.41
.30
.80
.011
.211
.68.
05.
63.
51.
03.
45
4.9
·m
ax.
31.2
0.0
0.0
0.0
0.6
0.6
2.0
0.5
2.5
3.6
90.2
20.4
min
.39
.82
.43.
70.
821
.210
.74.
53.
01.
82.
049
.9m
ax.
30.0
1.0
0.6
0.4
1.0
1.5
1.2
3.6
1.0
9.0
80.7
40.6
min
.36
.20
.80
.04.
225
.713
.16.
63.
21.
62.
042
.8m
ax.
20.7
0.5
0.7
0.5
0.2
0.2
3.1
4.9
0.7
5.4
83.8
60.6
min
.32
.34.
10
.618
.116
.010
.15.
13.
10.
65.
736
.6m
ax.
18.6
1.4
0.2
1.0
2.6
3.0
2.6
3.2
1.8
4.6
79.6
80.3
min
27
61.
93.
120
.123
.519
.76.
70.
50.
40.
523
.6m
ax.
15.4
1.5
1.0
5.9
9.8
4.2
4.9
4.4
2.9
5.4
60.0
86.7
min
.33
.13
.84.
150
.214
.86.
22.
52.
20.
12.
213
.9m
ax.
19.8
5.5
2.5
29.3
9.3
5.7
5.5
4.6
2.3
3.6
31.7
93.2
min
.28
.01.
52.
769
.96.
33.
42.
61.
90.
30.
610
.8m
ax.
21.5
1.2
1.8
60.6
9.7
3.5
3.3
1.1
0.4
1.1
17.3
100
min
.16
.92.
928
.555
.63.
12.
00
.01.
41.
10.
45.
0m
ax.
26.6
2.7
2.7
79.7
3.4
3.1
1.3
1.9
0.1
0.0
5.1
"Per
cen
tag
eof
pore
s3~
m.e
.d,
>o
bta
ined
by
diff
eren
ce.

HILGARDIA • Vol. 36, No. 15 • October, 1965 589
mixtures, VAMA absent. Frequencycurves for the VAMA-treated, maximally compacted mixtures are omittedso as to avoid confusion with those forthe untreated minima to which theyapproximate and which they would, inlarge part, overlap.
To smooth the experimental data forplotting and aid comparison of poresize frequency in the mixtures at bothcritical densities, the eight pore-sizeclasses between 298 J1. and 3 J1. were reduced to four by combining the twovolumes for each pair of adjacent sizeclasses into one volume for a single sizeclass of increased range. All size classesare represented by an equal distancealong the abscissa for the same reason,and a smooth curve has been drawnthrough the appropriate points of the
, classes for each degree of soil compaction. Points for the minimum and maximum densities, respectively, have beenshown by broken and continuous lines.
The mean effective pore diameter(m.e.d.), if calculated from an energyexpression for soil water at very lowenergy levels, generally is meaningless,even though any necessary correctionsare made for dissolved substances. Whencalculated, as in the present instance,from relatively low suctions « 1000millibars) the m.e.d. is less subject tocriticism. The purpose here is simplyto indicate something of the interiorpore organization so that comparisonsmay be made between the two extremestates of compaction of a given mixture.
It is noticeable that, within the rangeof measured suctions, different frequency distributions of pore m.e.d. existbetween mixtures that have been compacted to their minimum and maximumbulk densities, respectively. Pure finesand possesses practically no fine pores,but, for minimally compacted mixturesand for pure silty clay, there is a bimodal frequency distribution. Compaction to maximum bulk density nearlydestroys those pore size groups greaterthan 5 11- m.e.d. for the silty clay and for
the two mixtures containing 20.4 and40.6 per cent added fine sand. This category of pore size is also greatly reducedby compaction to the maximum densityof the mixture containing 60.6 per centadded sand. Maximum compaction ofnone of the mixtures reduces the abundance of < 3 j-t pores. Although the proportion of coarse pores is greater for themore sandy mixtures at their minimumdensities, the amount of destruction ofall pore size classes greater than 3 p
m.e.d. by compaction to density maximaprogressively decreases as the sand content increases beyond 60 to 80 per cent.The frequency distribution curves forpores in the pure fine sand at minimumand maximum compaction are almostidentical.
As defined earlier, an ideal coarseparticle matrix is one in which all monodisperse coarse particles present touchto form a continuous "matrix" havinga characteristic proportion of voidsafter the mixture assumes its minimumbulk volume. In this state all finer particles are to be found within the voidsof the coarser particles, but in no waydo they affect the packing of the coarser-that is, ec remains unaffected. Ideally,the t\VO components in our mixtureswould form coexistent coarse and finematrices at 75.2 per cent fine sand/24.8per cent silty clay (see fine sand-siltyclay curve, figure 4). An amount ofsand in the mixture greater than 75.2per cent by volume results in the production of a sand matrix alone at theminimum bulk volume. Note that destruction of coarse pores first appearsto show marked diminution in thosemixtures containing more than 80 percent of fine sand, an amount of fine sandsomewhat above the critical quantity,and that destruction has practicallyceased on maximum compaction of thepure fine sand. At maximum compaction over the range 0 to 60.6 per centfine sand, a silty clay matrix is dominant and the average loss-decrease inpercentage of pores 3 p. m.e.d. > / de-

590 Bodman and Constantin: Particle Size in Soil Compaction
crease in percentage of silty clay-is0.18. This rate of loss is much smallerthan can be attributed to the reducedamount of silty clay present. A possibleexplanation is that new pores, finerthan 3 p. m.e.d. and resistant to maximum compaction, are formed duringcompaction in greater numbers as moresand is added, at or near the sand grainboundaries, and the original pores finerthan 3 J1- are preserved, particularly in
the protected regions where there islocal "bridging" of sand grains.
Increase in content of fine sand from80.3 to 100 per cent, with a corresponding decrease in silty clay, is accompanied by a loss of 2.8 per cent of pores3 p. m.e.d. and finer per unit percentagedecrease in silty clay. This amount isconsiderably less than can be ascribedto the decreased content of silty clay,and no explanation is offered.
CONCLUSIONS AND SUMMARYConsideration of homogeneous, tridisperse systems, whose different particlesize classes possess certain definite properties but any homogeneous particleshape and a packing behavior definableby their void ratios, leads to the development of relationships between particle size distribution and minimumbulk volume. Knowledge of the properties and void ratios of the componentclasses thus permits prediction of theminimum bulk volume of a homogeneous mixture that may be prepared fromthem.
It was anticipated that an ideal system of this kind might be used as aguide to the composition-bulk densityproperties of compacted soils. Trials accordingly were made with a series ofsand and silty clay soil mixtures inwhich the sand and silty clay soil, respectively, were regarded as the coarseand fine components. These were mixedin different, known volume proportionscovering a wide range of soil texturesand were prepared so as to simulate realsoils.
Measurements established that aftercompaction with a kneading compactor,maximum and minimum bulk volumesare created, at different moisture contents, for each member of the textureseries except pure sand, and minimumbulk volumes are, in fact, related to anideal pattern resulting from the proportions of different size classes present.Deviations from theoretical bulk-volume minima are explained by the narrow diameter ratios between the two
components, by interactions betweenparticles including frictional resistanceduring packing, and possibly bytrapped air in the compacted specimens. These interferences are all excluded in developing the ideal relationships. Deviations are measurably diminished by increasing the particle diameter ratio.
A marked change in suction-desorption curves is brought about by compaction to minimum bulk volume. Theexistence of fine and coarse particle"matrices" over two different particlesize distribution ranges explains thepositions, with respect to particle sizecomposition, of the change in shape ofthe desorption curves. Changes in thefrequency distribution of calculatedmean effective diameter of pores are explained similarly. Maximum compaction by kneading compactor greatly increases the proportion of pores ofm.e.d. < 3 p. at the expense of coarsepores, but the proportion of < 3 J1- poresis associated primarily with the presence of the silty clay component. Poresof the limiting upper size of 3 J-t are practically absent in both the minimally andmaximally compacted fine sand, exceptafter the addition of 0.4 per centVAMA. The presence of this quantityof VAMA in the mixtures had a veryslight effect on their maximum bulk volumes after compaction but, under maximum compaction, caused significantincreases of minimum bulk volume andso lowered the maximum bulk density.

HILGARDIA • Vol. 36, No. 15 • October, 1965
LITERATURE CITEDAMERICAN GEOLOGICAL INSTITUTE
1957. Glossary of geology and related sciences. Amer. Geol. lnst., NAS-NRC, Publ. 501.Washington, D.C.: Williams and Heinz Litho. Corp.
AMERICAN SOCIETY OF AGRICULTURAL ENGINEERS (Subcommittee of the Soil Compaction Committee, with the Soil Science Society of America)
n. d. Annotated bibliography on soil compaction. Amer. Soc. Agr. Engin., St. Joseph, Mich.BODMAN, G.B.
1931. Observations on soilconsistency and structure. Report of the Eleventh Annual Meeting,American Soil Survey Assoc. Bul. 12: 93-96.
BODMAN, G. B., and J. RUBIN1948. Soil puddling. Soil Sci. Amer, Proc. 13:27-36.
DALI.JAVALLE, J. M.1943. Micromeritics. New York: Pitman Publ. Corp. First ed., chap. 6.
DAY,PAULR.1955-1958. The susceptibility of soils to changes in bulk specific volume and pore size, and
the effect of these changes upon related physical properties. Ann. Rept. CaliforniaContributing Project to U.S. Dept. Agr. Tech. Comm. W-30 (duplicated).
LI,C. Y.1956. Basic concepts on the compaction of soil. Proc. Amer, Soc. Civil Engin., Jour. Soil
Mech. and Found. Div. Paper 862:1-20.MARSHALL, T. J.
1959. Relations between water and soil. Commonwealth Bur. Soils, Commonwealth Agr. Bur.,Farnham Royal, Tech. Commun. 50:70-74.
PROCTOR, R. R.1933. Fundamental principles of soil compaction: Description of field and laboratory methods.
Engin. News Rec. 3:286-89.SOILSURVEY STAFF, U. S. Department of Agriculture, Bureau of Plant Industry and Agricultural
Engineering1951. Soil survey manual. U.S. Dept. Agr. Handbook 18 :207-11, Washington, D.C.
VALLERGA, B. A.1951. Recent laboratory compaction studies of bituminous paving mixtures. Proc. Assoc.
Asph. Pave Technologists 20: 117-53.WESTMAN, A. E. R., and H. R. HUGILL
1930. The packing of particles. Jour. Amer, Ceramic Soc. 13:767-79.WESTMAN, A. E. R.
1936. The packing of particles: Empirical equations for intermediate diameter ratios. Jour.Amer. Ceramic Soc. 19:127-29.
4m-l0,'65 (F5680)P.F. ~141


The journal HILGARDIA is published at irregular intervals,in volumes of about 650 to 700 pages. The number of issuesper volume varies.
Single copies of any issue may be obtained free, as long asthe supply lasts; please request by volume and issue numberfrom:
Agricultural PublicationsUniversity HallUniversity of CaliforniaBerkeley, California 94720
The limit to nonresidents of California is 10 separate titles.The limit to California residents is 20 separate titles.
The journal will be sent regularly to libraries, schools, orinstitutions in one of the following ways:
l. In exchange for similar published material on research.
2. As a gift to qualified repository libraries only.
3. On a subscription basis-$7.50 a year paid in advance.All subscriptions will be started with the first numberissued during a calendar year. Subscribers starting during any given year will be sent back numbers to the firstof that year and will be billed for the ensuing year thefollowing January. Make checks or money orders payable to The Regents of The University of California;send payment with order to Agricultural Publicationsat above address.