influence of titanium and lutetium on the persistent ... · influence of titanium and lutetium on...
TRANSCRIPT
Influence of titanium and lutetium on the persistent luminescence of ZrO2
José M. Carvalho,1,* Lucas C. V. Rodrigues,1,2 Jorma Hölsä,1,2,3 Mika Lastusaari,2,3 Luiz A. O. Nunes,4 Maria C. F. C. Felinto,5 Oscar L. Malta,6 and Hermi F. Brito1
1Universidade de São Paulo, Instituto de Química, Departamento de Química Fundamental, São Paulo-SP, Brazil 2University of Turku, Department of Chemistry, FI-20014 Turku, Finland
3Turku University Centre for Materials and Surfaces (MatSurf), Turku, Finland 4Universidade de São Paulo, Instituto de Física de São Carlos, São Carlos-SP, Brazil
5Instituto de Pesquisas Energéticas e Nucleares, IPEN, São Paulo-SP, Brazil 6Universidade Federal de Pernambuco, Departamento de Química Fundamental - CCEN, Recife-PE, Brazil
Abstract: Non-doped as well as titanium and lutetium doped zirconia (ZrO2) materials were synthesized via the sol-gel method and structurally characterized with X-ray powder diffraction. The addition of Ti in the zirconia lattice does not change the crystalline structure whilst the Lu doping introduces a small fraction of the tetragonal phase. The UV excitation results in a bright white-blue luminescence at ca. 500 nm for all the materials which emission could be assigned to the Ti3+ eg t2g transition. The persistent luminescence originates from the same Ti3+ center. The thermoluminescence data shows a well-defined though rather similar defect structures for all the zirconia materials. The kinetics of persistent luminescence was probed with the isothermal decay curve analyses which indicated significant retrapping. The short duration of persistent luminescence was attributed to the quasi-continuum distribution of the traps and to the possibility of shallow traps even below the room temperature.
©2012 Optical Society of America
OCIS codes: (160.2540) Fluorescent and luminescent materials; (160.2900) Optical storage materials; (260.3800) Luminescence; (300.2140) Emission.
References and links
1. J. de Wild, A. Meijerink, J. K. Rath, W. G. J. H. M. van Sark, and R. E. I. Schropp, “Towards upconversion for amorphous silicon solar cells,” Sol. Energy Mater. Sol. Cells 94(11), 1919–1922 (2010).
2. C. G. Granqvist and V. Wittwer, “Materials for solar energy conversion: An overview,” Sol. Energy Mater. Sol. Cells 54(1-4), 39–48 (1998).
3. P. C. Dokko, J. A. Pask, and K. S. Mazdiyasni, “High-temperature mechanical properties of mullite under compression,” J. Am. Ceram. Soc. 60(3-4), 150–155 (1977).
4. T. S. Jeon, J. M. White, and D. L. Kwong, “Thermal stability of ultrathin ZrO2 films prepared by chemical vapor deposition on Si(100),” Appl. Phys. Lett. 78(3), 368–370 (2001).
5. L. C. V. Rodrigues, R. Stefani, H. F. Brito, M. C. F. C. Felinto, J. Hölsä, M. Lastusaari, T. Laamanen, and M. Malkamäki, “Thermoluminescence and synchrotron radiation studies on the persistent luminescence of BaAl2O4:Eu2+,Dy3+,” J. Solid State Chem. 183(10), 2365–2371 (2010).
6. Y. J. Xing, Z. H. Xi, Z. Q. Xue, X. D. Zhang, J. H. Song, R. M. Wang, J. Xu, Y. Song, S. L. Zhang, and D. P. Yu, “Optical properties of the ZnO nanotubes synthesized via vapor phase growth,” Appl. Phys. Lett. 83(9), 1689–1691 (2003).
7. T. Aitasalo, P. Dereń, J. Hölsä, H. Jungner, J.-C. Krupa, M. Lastusaari, J. Legendziewicz, J. Niittykoski, and W. Stręk, “Persistent luminescence phenomena in materials doped with rare earth ions,” J. Solid State Chem. 171(1-2), 114–122 (2003).
8. P. Escribano, B. Julián-López, J. Planelles-Aragó, E. Cordoncillo, B. Viana, and C. Sanchez, “Photonic and nanobiophotonic properties of luminescent lanthanide-doped hybrid organic–inorganic materials,” J. Mater. Chem. 18(1), 23–40 (2007).
9. J.-C. G. Bunzli, S. Comby, A.-S. Chauvin, and C. D. B. Vandevyver, “New opportunities for lanthanide luminescence,” J. Rare Earths 25(3), 257–274 (2007).
10. F. C. Palilla, A. K. Levine, and M. R. Tomkus, “Fluorescent properties of alkaline earth aluminates of the type MAl2O4 activated by divalent europium,” J. Electrochem. Soc. 115(6), 642–644 (1968).
#160819 - $15.00 USD Received 3 Jan 2012; revised 20 Feb 2012; accepted 20 Feb 2012; published 24 Feb 2012(C) 2012 OSA 1 March 2012 / Vol. 2, No. 3 / OPTICAL MATERIALS EXPRESS 331
11. M. Yamaga, Y. Ohsumi, T. Nakayama, N. Kashiwagura, N. Kodama, and T. P. J. Han, “Long-lasting phosphorescence in Ce-doped oxides,” J. Mater. Sci. Mater. Electron. 20(S1), 471–475 (2009).
12. N. Kodama, Y. Tanii, and M. Yamaga, “Optical properties of long-lasting phosphorescent crystals Ce3+-doped Ca2Al2SiO7 and CaYAl3O7,” J. Lumin. 87-89, 1076–1078 (2000).
13. R. C. Garvie, R. H. Hannink, and R. T. Pascoe, “Ceramics steel,” Nature 258(5537), 703–704 (1975). 14. P. K. Wright and A. G. Evans, “Mechanisms governing the performance of thermal barrier coatings,” Curr. Opin.
Solid State Mater. Sci. 4(3), 255–265 (1999). 15. W. C. Li, M. M. McKerns, and B. Fultz, “A Raman spectrometry study of phonon anharmonicity of zirconia at
elevated temperatures,” J. Am. Ceram. Soc. 94(1), 224–229 (2011). 16. F. Gallino, C. Di Valentin, and G. Pacchioni, “Band gap engineering of bulk ZrO2 by Ti doping,” Phys. Chem.
Chem. Phys. 13(39), 17667–17675 (2011). 17. S. Shukla, S. Seal, R. Vij, and S. Bandyopadhyay, “Reduced activation energy for grain growth in
nanocrystalline yttria-stabilized zirconia,” Nano Lett. 3(3), 397–401 (2003). 18. S. Shukla and S. Seal, “Thermodynamic tetragonal phase stability in sol-gel derived nanodomains of pure
zirconia,” J. Phys. Chem. B 108(11), 3395–3399 (2004). 19. A. S. Foster, V. B. Sulimov, F. L. Gejo, A. L. Shluger, and R. M. Nieminen, “Structure and electrical levels of
point defects in monoclinic zirconia,” Phys. Rev. B 64(22), 224108 (2001). 20. J. F. Sarver, “Preparation and luminescent properties of Ti-activated zirconia,” J. Electrochem. Soc. 113(2), 124–
128 (1966). 21. G. M. Phatak, K. Gangadharan, H. Pal, and J. P. Mittal, “Luminescence properties of Ti-doped gem-grade
zirconia powders,” Bull. Mater. Sci. 17(2), 163–169 (1994). 22. Y. Cong, B. Li, B. Lei, and W. Li, “Long lasting phosphorescent properties of Ti doped ZrO2,” J. Lumin. 126(2),
822–826 (2007). 23. L. L. Hench and J. K. West, “The sol-gel process,” Chem. Rev. 90(1), 33–72 (1990). 24. C. J. Howard, R. J. Hill, and B. E. Reichert, “Structures of ZrO2 polymorphs at room temperature by high-
resolution neutron powder diffraction,” Acta Crystallogr. B 44(2), 116–120 (1988). 25. JCPDS, ICDD, 1997, entries 36–0460 (monoclinic ZrO2) and 42–1164 (tetragonal ZrO2). 26. L. Li, H. K. Yang, B. K. Moon, B. C. Choi, J. H. Jeong, K.-W. Jang, H. S. Lee, and S. S. Yi, “Structure, charge
transfer bands and photoluminescence of nanocrystals tetragonal and monoclinic ZrO2:Eu,” J. Nanosci. Nanotechnol. 11(1), 350–357 (2011).
27. R. Srinivasan, C. R. Hubbard, B. Cavin, and B. H. Davis, “Factors determining the crystal phases of zirconia powders: A new outlook,” Chem. Mater. 5(1), 27–31 (1993).
28. L. H. C. Andrade, S. M. Lima, A. Novatski, A. M. Neto, A. C. Bento, M. L. Baesso, F. C. G. Gandra, Y. Guyot, and G. Boulon, “Spectroscopic assignments of Ti3+ and Ti4+ in titanium-doped OH free low-silica calcium aluminosilicate glass and role of structural defects on the observed long lifetime and high fluorescence of Ti3+ ions,” Phys. Rev. B 78(22), 224202 (2008).
29. L. H. C. Andrade, S. M. Lima, A. Novatski, P. T. Udo, N. G. C. Astrath, A. N. Medina, A. C. Bento, M. L. Baesso, Y. Guyot, and G. Boulon, “Long fluorescence lifetime of Ti3+-doped low silica calcium aluminosilicate glass,” Phys. Rev. Lett. 100(2), 027402 (2008).
30. K. S. Chung, H. S. Choe, J. I. Lee, J. L. Kim, and S. Y. Chang, “A computer program for the deconvolution of thermoluminescence glow curves,” Radiat. Prot. Dosimetry 115(1-4), 343–349 (2005).
31. K. S. Chung, TL Glow Curve Analyzer v.1.0.3. (Korea Atomic Energy Research Institute and Gyeongsang National University, Korea, 2008).
32. P. Iacconi, D. Lapraz, and R. Caruba, “Traps and emission centres in thermoluminescent ZrO2,” Phys. Status Solidi A 50(1), 275–283 (1978).
33. S. W. S. McKeever, Thermoluminescence of Solids (Cambridge University Press, England, 1985), Chap. 3.3. 34. T. Aitasalo, J. Hölsä, H. Jungner, M. Lastusaari, and J. Niittykoski, “Thermoluminescence study of persistent
luminescence materials: Eu2+- and R3+-doped calcium aluminates, CaAl2O4:Eu2+,R3+.,” J. Phys. Chem. B 110(10), 4589–4598 (2006).
1. Introduction
The urgency on the development of new photonic materials has increased in the last three decades due to the need of efficient light converting and energy storage, and to their respective applications in solar cells and sustainable energy [1,2]. Thus, the luminescence arising from refractive materials is of particularly interest due to the unique mechanical properties [3] and good chemical and thermal stability of these materials [4]. This kind of materials have been widely studied since their optical properties are strongly correlated to the structural effects and could be related to a variety of different types of photophysical phenomena [5,6]. The persistent luminescence materials are inserted in this context with a wide variety of applications, such as emergency lighting [7] and even medical diagnostics [8,9]. The most studied persistent luminescence materials are doped with rare earth ions [10–
#160819 - $15.00 USD Received 3 Jan 2012; revised 20 Feb 2012; accepted 20 Feb 2012; published 24 Feb 2012(C) 2012 OSA 1 March 2012 / Vol. 2, No. 3 / OPTICAL MATERIALS EXPRESS 332

12], but the rare earth precursors are now suffering from high prices and new alternatives are needed to comply with this problem.
In this context, zirconia (ZrO2), is an extensively studied material due to its unique mechanical properties [13], high refractive index [14], as well as thermal and chemical stabilities [4]. Zirconia is suitable for application as a photonic material since the low phonon energy (480 cm1) [15] and wide band gap (5.0 – 5.8 eV) [16] thwarts the non-radiative losses by multi-phonon de-excitation.
ZrO2 shows versatile polymorphism with three different crystal structures: cubic (c-ZrO2), tetragonal (t-ZrO2) and monoclinic (m-ZrO2) [17,18]. The point symmetry of the Zr site is C2h and D4h for the monoclinic and tetragonal form, respectively, indicating that the local monoclinic structure is less symmetric than tetragonal as well. Although m-ZrO2 is stable at room temperature it is transformed to the tetragonal phase at 1250 °C, and then to cubic at 2370 °C [19]. Similar phase transitions are obtained by doping zirconia with e.g. rare earths (R3+); a few per cent of the R3+ dopant yields the tetragonal phase whilst with ca. 10 per cent, the cubic one is obtained.
Regarding the luminescence arising from the non-doped zirconia, several explanations have been offered in the literature, such as: emission from defects [20], self-activated emission [21,22] and metal impurities [23]. With a more profound investigation, the titanium present as an impurity in zirconia provides an unambiguous explanation for the serendipitous spectroscopic behaviour.
In this work, the non-doped, Ti and Lu doped zirconia nanomaterials were synthesized using a simple one-step sol-gel method and their structural characterization was carried out with the X-ray powder diffraction technique. The persistent luminescence was studied with conventional UV excited spectroscopy, as well as with thermoluminescence measurements and isothermal luminescence decay curves. These complementary techniques allowed developing a conceivable mechanism for the persistent luminescence of Ti doped zirconia nanomaterials.
2. Experimental section
The precursors, 1-butanol (99.5%), isopropanol (99.7%), zirconium tetrabutoxide (ZTB, 70% w/v, 1-butanol solution) and titanium isopropoxide (99.7%) were used as purchased from Sigma-Aldrich. The lutetium oxide (Lu2O3, 99.99%) was purchased from Cstark. The non-doped, Ti, and Lu doped ZrO2 nanomaterials were prepared with a conventional sol-gel method [24] where the solution of ZTB containing the dopants was hydrolyzed with a controlled amount of water (W = [H2O]/[ZTB] = 3). In a typical synthesis, 4 cm3 of ZTB was added in a round bottomed flask containing 25 cm3 of 1-butanol. The homogeneous solution was capped and stirred for 15 minutes prior to adding dropwise 25 cm3 of water-isopropanol solution. The gel-like solution was allowed to react for 24 h, with stirring at room temperature and then the crude gel was dried at 110 °C for 12 h. Finally, after the dried gel was ground in a mortar a finely-divided white powder was obtained. These as-prepared materials were further thermally treated at 1000 °C for 5 h.
The X-ray powder diffraction measurements were carried out on a Rigaku-Miniflex II diffractometer with CuKα1 radiation (1.5406 Å) in the 2θ range of 20-70 degrees.
The excitation and emission spectra, as well as the isothermal decay curves, of the zirconia nanomaterials were recorded with a SPEX FL212 Fluorolog-2 spectrofluorometer using a 450 W Xenon lamp as the excitation source and two 0.22 m double grating SPEX 1680 monochromators for dispersing the radiation. The entire luminescence setup was fully controlled by a DM3000F spectroscopic computer program and the spectral intensities were automatically corrected for the photomultiplier (PMT) response.
The TL measurements were carried out in a Daybreak TL Reader, model 1100, equipped with a bialkali EMI 9235QA PMT for light detection. A set of Corning 7-59 and Schott BG-39 filters were used in front of the PMT tube. The heating rate applied was 5 °Cs1 in a
#160819 - $15.00 USD Received 3 Jan 2012; revised 20 Feb 2012; accepted 20 Feb 2012; published 24 Feb 2012(C) 2012 OSA 1 March 2012 / Vol. 2, No. 3 / OPTICAL MATERIALS EXPRESS 333

flowing (flow rate: 50 cm3min1) nitrogen atmosphere. Prior to the TL measurements, the samples were irradiated with a 6 W Cole Parmer UV lamp (emission maximum at 254 nm) for 2 min. A delay of 3 min was used between the irradiation and measurement.
3. Results and discussion
3.1 Phase formation
Whilst the sol-gel method could lead to different products, due to the complexity of the process, the ZrO2 nanomaterials were promptly formed when the crude gel was annealed above 500 °C. The phase formation of zirconia sol-gel derived materials depends on the initial parameters of the synthesis, such as the W ratio, solvent polarity, relative concentrations of the species in the reactional medium, etc [24]. The same synthetic conditions were applied to the preparation of the non-doped, Ti and Lu doped materials and the XRD diffraction patterns show great similarity for all the products (Fig. 1). Since the monoclinic phase is the thermodynamically stable one at room temperature, it is the major component of all crystalline phases, as indicated by the 28.2 and 31.5 ° (in 2θ) diffraction lines related to the reflections ( 111 ) and (111) [25,26], respectively (Fig. 1). The patterns of the non-doped and Ti doped material correspond exclusively to the monoclinic phase only (space group P21/c; Z: 4) whereas the Lu doped material presented an additional weak line at 30.2 °, attributed to the (101) reflection [25,26] of the tetragonal zirconia phase (space group P42/nmc; Z: 2).
Fig. 1. The X-ray power diffraction (XPD) patterns of the non-doped, Ti and Lu doped ZrO2 materials annealed at 1000 °C. Vertical bars indicate the standard JCPDS data [25] for the monoclinic and tetragonal phases.
The tetragonal phase is not thermodynamically stable at room temperature, though it can be stabilized when doping ZrO2 with some trivalent ions, such as the rare earths [27]. The non-doped tetragonal zirconia phase has also been reported, occurring as a metastable product formed from organized Zr(OH)4(H2O)2 sheets present as an intermediate in the synthesis [28]. The crystallite size seems to play a key role in the stabilization of this metastable tetragonal phase due to the excess of surface energy of the nanosized crystals.
#160819 - $15.00 USD Received 3 Jan 2012; revised 20 Feb 2012; accepted 20 Feb 2012; published 24 Feb 2012(C) 2012 OSA 1 March 2012 / Vol. 2, No. 3 / OPTICAL MATERIALS EXPRESS 334

Fig. 2. A schematic presentation of the m-ZrO2 structure with two M3+ sites ( 'ZrM ) and an
oxygen vacancy ( OV
) created by charge compensation.
Regarding the defect formation when introducing trivalent metal ions into the zirconia lattice, the R3+ ion replaces ZrIV and an oxygen vacancy (Kröger-Vink notation: OV ) is created as a result of charge compensation (Fig. 2). These defects influence directly the optical properties of the materials, acting as traps for electrons ( OV ) or holes ( '
ZrM ) in the lattice and thus create new paths for light harvesting. The presence of defects in the materials’ structure has also a fundamental role to play in the persistent luminescence phenomenon, as will be discussed below.
3.2 Persistent luminescence of non-doped, Ti and Lu doped ZrO2 materials
The photoluminescence (PL) of non-doped zirconia has been reported widely in the literature but it is still basically an open question. Diverse explanations for the luminescence arising from non-doped zirconia materials have been given; however, the most recurrent one is the defects acting as luminescence centers [20]. Other works have suggested that titanium, present as an impurity, could activate the zirconia luminescence due to an asymmetrical coordination of oxygens [21,22].
Among the known different impurities in zirconia, Ti is the best and natural candidate to show luminescence since the Ti3+ (3d1) ion can be easily photoexcited and, with radiative relaxation to the ground level, emits light. This behaviour has been reported for the Ti doped aluminosilicate glasses [28,29] where the presence of both the Ti3+ and TiIV species was observed.
The non-negligible persistent luminescence of non-doped ZrO2 has been reported previously in a rather qualitative manner, however. There exist no works in the literature reporting the mechanism of persistent luminescence considering the energetics in the system (e.g. band gap, defect structure, etc.) and thus the knowledge of the mechanism becomes important when designing new zirconia materials.
In order to probe unambiguously the origin of the non-doped as well as the Lu and Ti doped ZrO2 luminescence, the UV excited emission (Fig. 3, top) and the persistent luminescence spectra (Fig. 3, bottom) were studied in detail. The non-doped zirconia shows a broad band emission centered at 496 nm, upon excitation at 300 nm, exactly similar to the Ti and Lu doped materials. The normalized emission spectra for the different materials showed a serendipitous resemblance, indicating that the emission center is the same in all cases (Fig. 3, top).
Regarding the non-doped and Lu doped ZrO2 nanomaterials, the emission intensities are almost the same, within the experimental error, indicating that the Lu doping does not affect significantly the intensity of emission though increasing considerably the defect concentration in the material. Quite the reverse, for the Ti doped material, the emission intensity undertakes
#160819 - $15.00 USD Received 3 Jan 2012; revised 20 Feb 2012; accepted 20 Feb 2012; published 24 Feb 2012(C) 2012 OSA 1 March 2012 / Vol. 2, No. 3 / OPTICAL MATERIALS EXPRESS 335

a 10 fold increase (Fig. 3, top, inset) indicating that the emission center is indeed the Ti ion. As to the Ti valence, little is known so far due to the difficulties encountered in the experiments aimed to reveal the valences of elements, such as a very complicated K pre-edge absorption of titanium in the XANES measurements.
Fig. 3. Normalized UV excited emission (top) and persistent emission (bottom) spectra for the non-doped, Ti and Lu doped ZrO2 nanomaterials. The figure insets show the absolute emission intensities.
The normalized persistent emission spectra show the same profile as the UV excited emission indicating that the persistent luminescence of the materials arises from the same (titanium) emitting center (Fig. 3, bottom). One minute after ceasing the excitation, the non-doped zirconia presents the highest emission intensity of the three materials (Fig. 3, bottom inset). The increase in titanium doping leads to higher defect (oxygen vacancies, TiIV) concentrations, caused by the substitution of Zr by Ti3+/TiIV. The originally isolated defects start then to communicate and the trapped energy is lost to the TiIV energy levels leading to the weaker persistent luminescence than for the non-doped material (Fig. 3, bottom, inset).
The effect of the defects was also studied by comparing the thermoluminescence glow curves of the non-doped, Ti and Lu doped materials (Fig. 4). All the materials present basically similar glow curves with three peaks at 90, 180 and 250 °C, which events are probably related to the non-negligible persistent luminescence observed. For a more detailed analysis, the glow curves were deconvoluted [30,31] with the deconvolution parameters
#160819 - $15.00 USD Received 3 Jan 2012; revised 20 Feb 2012; accepted 20 Feb 2012; published 24 Feb 2012(C) 2012 OSA 1 March 2012 / Vol. 2, No. 3 / OPTICAL MATERIALS EXPRESS 336
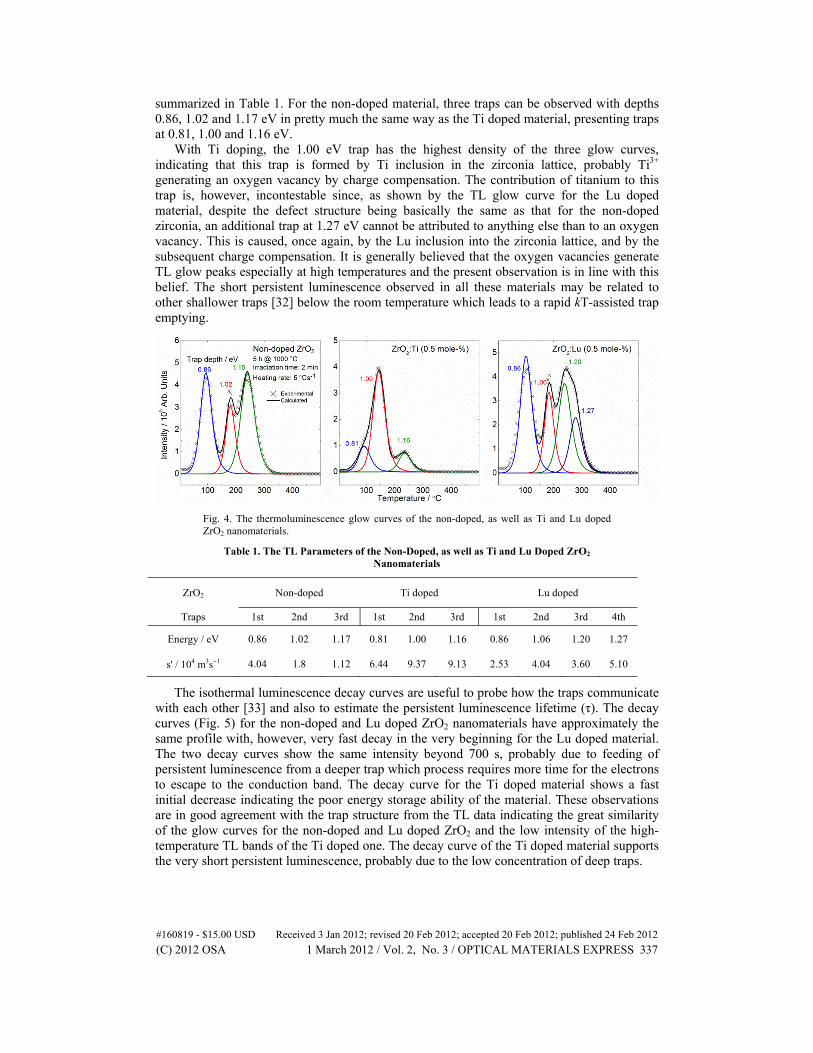
summarized in Table 1. For the non-doped material, three traps can be observed with depths 0.86, 1.02 and 1.17 eV in pretty much the same way as the Ti doped material, presenting traps at 0.81, 1.00 and 1.16 eV.
With Ti doping, the 1.00 eV trap has the highest density of the three glow curves, indicating that this trap is formed by Ti inclusion in the zirconia lattice, probably Ti3+ generating an oxygen vacancy by charge compensation. The contribution of titanium to this trap is, however, incontestable since, as shown by the TL glow curve for the Lu doped material, despite the defect structure being basically the same as that for the non-doped zirconia, an additional trap at 1.27 eV cannot be attributed to anything else than to an oxygen vacancy. This is caused, once again, by the Lu inclusion into the zirconia lattice, and by the subsequent charge compensation. It is generally believed that the oxygen vacancies generate TL glow peaks especially at high temperatures and the present observation is in line with this belief. The short persistent luminescence observed in all these materials may be related to other shallower traps [32] below the room temperature which leads to a rapid kT-assisted trap emptying.
Fig. 4. The thermoluminescence glow curves of the non-doped, as well as Ti and Lu doped ZrO2 nanomaterials.
Table 1. The TL Parameters of the Non-Doped, as well as Ti and Lu Doped ZrO2 Nanomaterials
ZrO2 Non-doped Ti doped Lu doped
Traps 1st 2nd 3rd 1st 2nd 3rd 1st 2nd 3rd 4th
Energy / eV 0.86 1.02 1.17 0.81 1.00 1.16 0.86 1.06 1.20 1.27
s' / 104 m3s1 4.04 1.8 1.12 6.44 9.37 9.13 2.53 4.04 3.60 5.10
The isothermal luminescence decay curves are useful to probe how the traps communicate with each other [33] and also to estimate the persistent luminescence lifetime (τ). The decay curves (Fig. 5) for the non-doped and Lu doped ZrO2 nanomaterials have approximately the same profile with, however, very fast decay in the very beginning for the Lu doped material. The two decay curves show the same intensity beyond 700 s, probably due to feeding of persistent luminescence from a deeper trap which process requires more time for the electrons to escape to the conduction band. The decay curve for the Ti doped material shows a fast initial decrease indicating the poor energy storage ability of the material. These observations are in good agreement with the trap structure from the TL data indicating the great similarity of the glow curves for the non-doped and Lu doped ZrO2 and the low intensity of the high-temperature TL bands of the Ti doped one. The decay curve of the Ti doped material supports the very short persistent luminescence, probably due to the low concentration of deep traps.
#160819 - $15.00 USD Received 3 Jan 2012; revised 20 Feb 2012; accepted 20 Feb 2012; published 24 Feb 2012(C) 2012 OSA 1 March 2012 / Vol. 2, No. 3 / OPTICAL MATERIALS EXPRESS 337

Fig. 5. The photoluminescence isothermal decay curves of the non-doped as well as Ti and Lu doped ZrO2 materials.
In order to estimate the persistent luminescence lifetime, the isothermal decay curves were fitted (Fig. 6) with the 2nd order kinetics [33] as suggested by the symmetric shape of the TL bands. The Eq. (1) is the general order kinetics expression for luminescence decay. In this equation, the b parameter defines the order of the kinetic approximation. With b: 2 the Eq. (1) represents the 2nd order (Eq. (2)) [33] whilst the Eq. (3) [33] gives the relationship between the parameter α and the lifetime τ. In Eq. (2), α is the linearization parameter for the exponential component, E is the associated trap energy of the material and n0 is the relative concentration of traps.
(1- )/ -10 0( / ) 1 ( -1) ' exp(- ) .b b b E
kTI I n b s t (1)
2
0 0/ ( 1) .I I n t (2)
1' exp( ) .EkTs (3)
The decay curve for the non-doped ZrO2 (Fig. 6) shows a good agreement with the 2nd order kinetics, within the time interval of the experiments, indicating significant retrapping of electrons in the defects. The fit of the data for the Ti doped material does not exhibit quite the same degree of agreement with the 2nd order kinetics whilst the fit for the Lu doped material is by far the worst. This visual observation is supported by the evolution of the reliability values. This trend can be related to the similarity in the defect structure for the former two cases, differing only in the relative concentration of the traps (n0) and also to the more complicated trap structure for the Lu doped material. Evidently the additional trap with the deepest energy hinders the electron to escape to the conduction band.
Since the n0 parameter plays a key role in the kinetic decay for higher than the 1st order kinetics, a shorter lifetime (4.00 s) was obtained from the decay curve for the Ti doped material than for the non-doped (8.55 s) one. Despite the trap structure, an intermediate luminescence lifetime (6.67 s) was found for the Lu doped material. The non-doped material is thus the most persistent which fact is in complete agreement with the persistent luminescence emission spectra (Fig. 3, bottom).
#160819 - $15.00 USD Received 3 Jan 2012; revised 20 Feb 2012; accepted 20 Feb 2012; published 24 Feb 2012(C) 2012 OSA 1 March 2012 / Vol. 2, No. 3 / OPTICAL MATERIALS EXPRESS 338

Fig. 6. The 2nd order kinetics fits for the isothermal decay curves of the non-doped as well as Ti and Lu doped ZrO2.
3.3 Persistent Luminescence Mechanism
The study of the PL spectra and TL glow curves, as well as the luminescence decay curves, allows the construction of a plausible mechanism for the persistent luminescence of the Ti doped zirconia materials (Fig. 7). In fact, the mechanism is similar to and based on the first detailed persistent luminescence mechanism, i.e. that for the Eu2+ doped materials, CaAl2O4:Eu2+,R3+ [34].
Fig. 7. The persistent luminescence mechanism of the Ti doped ZrO2 nanomaterial.
The band gap value (5.25 eV) used in the mechanism was easily found in the literature, as well as was the charge (electron) transfer transition e[O(2p)] + TiIV Ti3+, used to estimate the Ti3+ t2g ground state position. The excitation and emission energies were obtained from the present PL studies. Finally, the trap energies were acquired from the deconvolution of the TL glow curves. The resulting mechanism involves the excitation of an electron from the t2g ground state of Ti3+ to the excited TiIV + e- state, or with lower Ti concentrations and thus with higher relative Ti3+ concentration, alternatively to e2g of Ti3+. The energy difference is rather small between these two levels. Due to the low band gap energy, the excited levels of Ti3+ and TiIV situate close to or even within the conduction band. The electrons can easily be promoted from the excited Ti levels by thermal energy (kT) to the conduction band of ZrO2 and then move further quite freely to a defect and be trapped. The reverse process is initiated by absorption of thermal energy allowing the electrons to escape back to the conduction band and populate the eg emitting level of Ti3+ (partially overlapping CB of ZrO2). The radiative relaxation of the system takes care of producing light as persistent luminescence. Alternatively, retrapping of the electrons can occur as shown by the analysis of both the TL glow and the luminescence decay curves. Although the mechanism is convincing, one should
#160819 - $15.00 USD Received 3 Jan 2012; revised 20 Feb 2012; accepted 20 Feb 2012; published 24 Feb 2012(C) 2012 OSA 1 March 2012 / Vol. 2, No. 3 / OPTICAL MATERIALS EXPRESS 339

note that the energies of the processes are only estimates since these values are based on data consisting of broad band emission, excitation and absorption. The estimated accuracy is of the order of 0.5 eV.
4. Conclusions
High quality zirconia nanomaterials were successfully prepared with a simple one-step sol-gel synthesis. When the effect of the Ti and Lu inclusion in the zirconia lattice was investigated, single phase monoclinic zirconia was obtained for the non-doped and Ti doped ZrO2 materials whilst the Lu doping leads to a partial stabilization of the tetragonal phase.
The optical properties of the non-doped as well as Ti and Lu doped ZrO2 materials are very similar, thus Ti3+ was assumed to be the ubiquitous luminescence center, present as an impurity also in the non-doped and Lu doped materials. The bright white-blue broad band emission at ca. 500 nm was assigned to the Ti3+ 3d1(eg) 3d1(t2g) transition. The difficulties in probing the titanium valence are related to the complicated K pre-edge absorption in the XANES measurements. Further investigations are needed to probe the titanium valence, e.g. using EPR.
Despite the fact of the persistent luminescence arising from the ZrO2 materials being strong, it is of too short duration due to the quasi-continuum distribution of traps hindering thus the efficient energy storage. To unravel this problem, the addition of dopants, such as rare earths ions, must be considered in trying to change the defect structure of the ZrO2 material.
A plausible and consistent persistent luminescence mechanism was developed based on the experimental data. The mechanism can be useful in the design of new zirconia luminescence materials or materials based on titanium doping. The complete control of the intensity and duration of persistent luminescence from Ti doped ZrO2 requires, however, the mastering of the delicate interplay between not only the relative amounts of Ti3+ and TiIV but also the co-dopant nature and concentration. Taken into account the ever-rising prices of rare earths required for the conventional persistent luminescence materials, the efforts are worth taking.
Acknowledgments
Financial support is gratefully acknowledged from the Conselho Nacional de Desenvolvimento Científico e Tecnológico (CNPq, Brazil) and the Academy of Finland through the Brazil-Finland Bilateral Project in the Photonics Program, the Coordenação de Aperfeiçoamento de Pessoal de Nível Superior (CAPES, Brazil), the Fundação de Amparo à Pesquisa do Estado de São Paulo (FAPESP, Brazil), Nanobiotec-Brasil - RH-INAMI and inct-INAMI, Brazil. The synchrotron study was supported by the European Community – Research Infrastructure Action under the FP6 Structuring the European Research Area Programme, RII3-CT- 2004-506008 (IA-SFS). Dr. Aleksei Kotlov (HASYLAB) is gratefully acknowledged for the assistance in the synchrotron measurements. Prof. S. Watanabe (Universidade de São Paulo, Instituto de Física, São Paulo-SP) is thanked for the use of the thermoluminescence setup.
#160819 - $15.00 USD Received 3 Jan 2012; revised 20 Feb 2012; accepted 20 Feb 2012; published 24 Feb 2012(C) 2012 OSA 1 March 2012 / Vol. 2, No. 3 / OPTICAL MATERIALS EXPRESS 340