influence of thermo-mechanical properties of polymer ... · pdf filethermal conductivity of...
TRANSCRIPT

Materials Science-Poland, Vol. 25, No. 1, 2007
Influence of thermo-mechanical properties of
polymer matrices on the thermal conductivity of
adhesives for microelectronic packaging*
J. FELBA, T. FAŁAT**, A. WYMYSŁOWSKI
Faculty of Microsystem Electronics and Photonics, Wrocław University of Technology,
ul. Janiszewskiego 11/17, 50-372 Wroclaw, Poland
Thermally conductive adhesives are among major concerns of contemporary microelectronics. The
main goal of ongoing research is to improve the thermal conductivity of these composites by using
a proper filler material and the best shape and size of filler particles. In this work, it has been proven by
numerical simulation that the polymer matrix may also play a crucial role, as the contact area between
filler particles depends on the stresses that occur due to the shrinkage of the resin during curing. It has
been observed that the resins relax with time. The time until the fully relaxed state is reached strongly
depends on the temperature at which the system operates. In the considered case, the contact pressure is
fully relaxed when it decreases from the initial value of 0.73 GPa to 0.03 GPa. When the temperature is
70 °C, the contact pressure becomes fully relaxed after 10 seconds, but when it is lower than 40 °C, the
relaxation is completed after about 109 seconds (more than 30 years!). After the relaxation of contact
pressure, the thermal conductivity drops by approximately 50% of the initial thermal conductivity of the
non-relaxed structure.
Key words: thermal conductivity; thermally conductive adhesives; polymer matrix; microelectronic packaging
1. Introduction
The continuous miniaturization of electronic devices and components depends on
ever higher packaging densities. This introduces problems with heat transport and
heat dissipation, which at present are becoming crucial issues and require the applica-
tion of materials with high thermal conductivity and novel packaging methods. Ther-
mally conductive adhesives (TCA) seem to be among the most attractive materials for
this purpose.
_________
*Presented at the joint events 1st Workshop “Synthesis and Analysis of Nanomaterials and Nanostruc-
tures” and 3rd Czech-Silesian-Saxony Mechanics Colloquium, Wrocław, Poland, 21–22 November, 2005. **Corresponding author, e-mail: [email protected]
J. FELBA et al. 46
Conductive adhesives consist of a polymer base material matrix and a metal filler
dispersed randomly. Conduction is provided by metal additives, and high conductivity
requires high metallic content, considerably above the percolation threshold. It is be-
lieved that at this concentration all conductive particles contact each other and form
a three-dimensional network. The expected conductivity is obtained after the curing
process due to a better contact between filler particles, resulting from the shrinkage of
the polymer matrix. Thermal conductivity is limited by the so-called thermal contact
resistance between filler particles. The contact thermal resistance depends on both the
material properties and geometric parameters of the contact areas between particles.
The geometric parameters are related to the contact pressure within the contact area.
TCAs are typically formulated analogously to electrically conductive adhesives with
conductive particles (usually silver flakes with average particle dimensions of several
micrometers) and a polymer matrix (usually a thermosetting epoxy resin). The thermal
conductivity of such composites reaches values lower than 3 W/(m·K) [1]. The con-
ductive particles in adhesives are responsible for thermal contacts, while the polymer
matrix mainly provides the mechanical interconnections.
2. The role of the adhesive filler material
The filler material is responsible for heat transport. Thermal conductivity of
the bulk material is given by the equation
( )1
3e e e ph ph ph e phc L c Lλ ν ν λ λ= + = + (1)
where ce and cph are the heat capacities per unit volume [J/(m3·K)] of electrons and
phonons, respectively, νe and νph are their root-mean-square velocities, and Le and Lph
are their mean free paths. Since λe is the dominant part of the thermal conductivity of
metals, one can roughly assume that
λ = λe (2)
In the case of copper at room temperature, λe = 380 W/(m·K) and λph = 21 W/(m·K).
Generally, because of their relatively low cost, pure metals such as copper or sil-
ver are the best candidates for TCA fillers. There are also materials with much higher
thermal conductivities reching 2000 W/(m·K) for synthetic diamond and up to 3000
W/(m·K) for carbon nanotubes. Carbon nanotubes consist of graphite sheets wrapped
into hollow cylinders with the diameters as small as 1 nm and lengths in the microme-
ter range. Their unique mechanical and thermal properties make them ideal fillers in
the development of a new generation of composite materials for, among others, mi-
croelectronic packaging. For certain applications, high thermal conductivity and elec-
trical insulating properties are needed. Aluminium nitride particles (7 µm) and whisk-
Thermal conductivity of adhesives for microelectronic packaging
47
ers (250 µm) or silicon carbide whiskers could be used as fillers in TCAs for such
purposes. [2]
Generally, the filler particles used in thermally conductive adhesives occur in
many different shapes, such as spheres, flakes, whiskers, tubes, fibres, etc., and their
dimensions vary from micro- to nanometers.
3. The role of contacts between filler particles
Tests with TCAs containing different filler materials show that there is no simple
relationship between the conductivities of the bulk material and composite. For exam-
ple, synthetic diamond powder as the filler reveals a low value of TCA thermal con-
ductivity compared to silver flakes [3]. This is believed to be due to the presence of
nitrogen and other impurities in the synthetic diamond, but generally small contact
areas between filler particles significantly reduce the thermal conductivity of the ad-
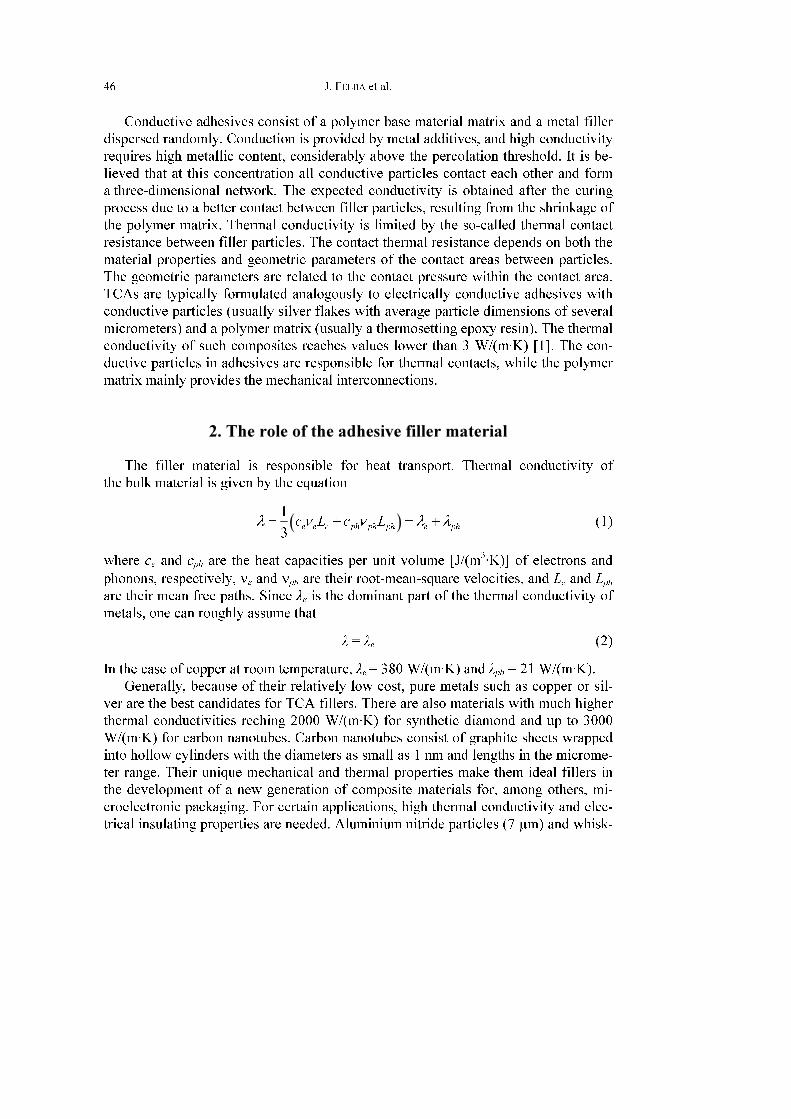
hesive. If contact members are in the form of perfect hard balls, they touch each other
at one point (the contact point A in Fig. 1). In fact, this point turns into a small area,
since the contact materials are deformable.
Fig. 1. 2D axis-symmetric model
of silver-filled TCA
The thermal contact resistance between particles can be lowered by using mixed
filler materials that differ in particle sizes. Composites containing silver particles and
nanoparticles improve thermal conductivity even by the factor of 2.55 [4]. Further-
more, the thermal conductivity of TCAs can be improved by using fillers with differ-
ent particle shapes (e.g., spheres + whiskers) [2, 5]. Both of these techniques are
J. FELBA et al. 48
costly and require a lot of experiments to be performed with various material contents
and configurations in order to obtain optimal results.
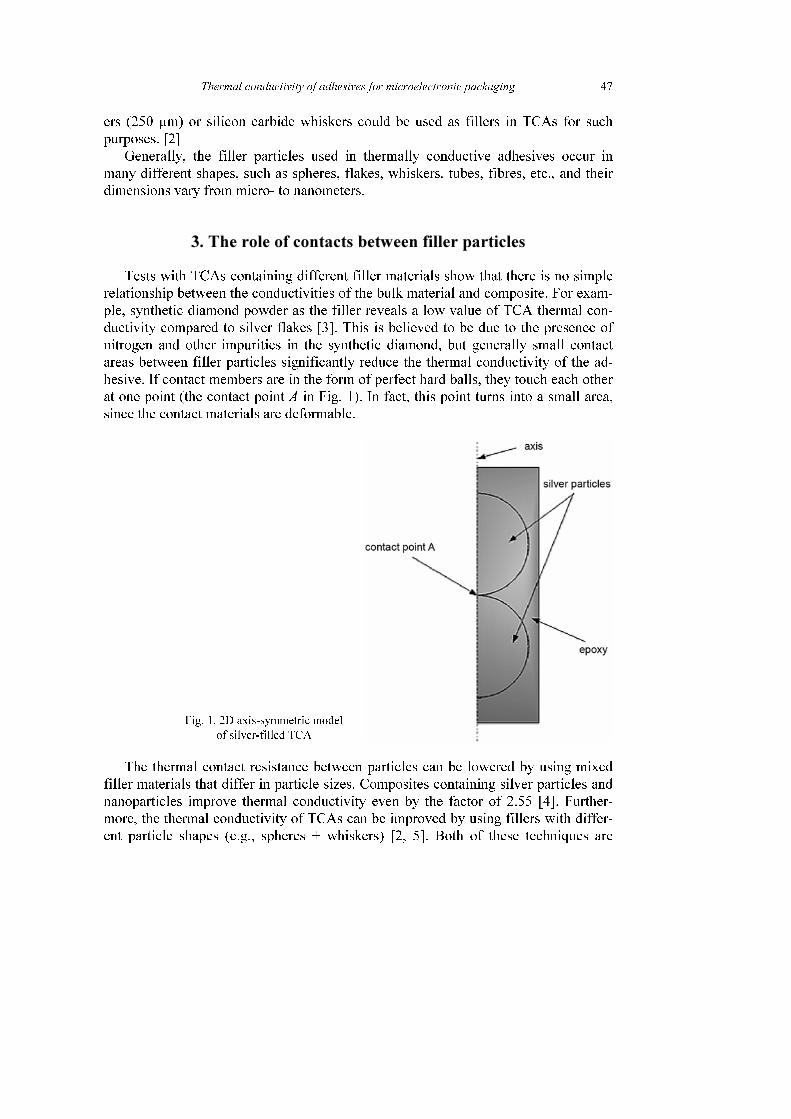
Therefore, it is worth asking: how does the contact state between particles affect
the thermal conductivity of TCA? In order to test this, a numerical modelling of sil-
ver-filled TCA was performed. The numerical model was simplified by some assump-
tions: identical, spherical silver particles were used as the filler, a closely packed
(HCP or FCC crystal equivalent) 3D structure was analysed as the unit cell (see
Fig. 2), the particles touch each other, and the contact properties were described by
contact areas (impurities and roughness were neglected). The closely packed structure
was assumed as a consequence of the maximal possible packing efficiency (Vfiller/Vtotal
= 74.05%) for the 3D spherical particles.
Fig. 2. Closely packed structure (left) and the analysed unit cell (right)
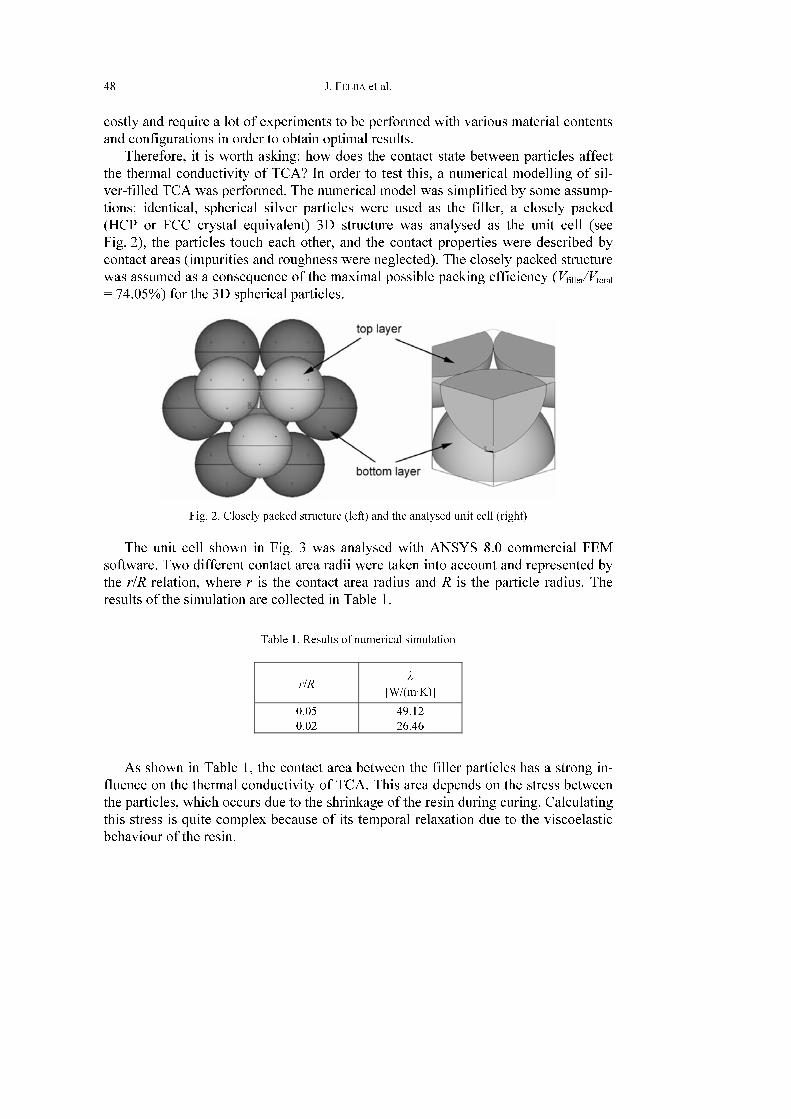
The unit cell shown in Fig. 3 was analysed with ANSYS 8.0 commercial FEM
software. Two different contact area radii were taken into account and represented by
the r/R relation, where r is the contact area radius and R is the particle radius. The
results of the simulation are collected in Table 1.
Table 1. Results of numerical simulation
r/R λ
[W/(m·K)]
0.05 49.12
0.02 26.46
As shown in Table 1, the contact area between the filler particles has a strong in-
fluence on the thermal conductivity of TCA. This area depends on the stress between
the particles, which occurs due to the shrinkage of the resin during curing. Calculating
this stress is quite complex because of its temporal relaxation due to the viscoelastic
behaviour of the resin.

Thermal conductivity of adhesives for microelectronic packaging
49
Fig. 3. The unit cell analysed by ANSYS 8.0
4. The role of the polymer matrix
An adhesive matrix is used to form mechanical bonds at interconnections. Poly-
meric materials have thermal conductivities about 2000 times lower than silver or
copper. Thermal conductivities of all polymeric materials, epoxy or other types, ther-
moset or thermoplastic, range from 0.2 to 0.3 W/(m·K). Nevertheless, the thermo-
mechanical properties of polymer matrices may strongly influence the thermal con-
ductivity of adhesives for microelectronic packaging.
4.1. Viscoelasticity
The general linear viscoelastic equation is the basic equation for modelling the de-
velopment of viscoelastic stresses (σij) as a function of temperature and loading time
in fully cured polymer materials:
( ) ( ) ( ){ }eff, 2 , ,
t
d
ij ij Vt T G t s T K t s T dsσ ε ε
−∞
= − + −∫ � � (3)

J. FELBA et al. 50
where G and K denote the shear and bulk relaxation moduli, respectively (they are time-
(t) and temperature- (T) dependent), and eff
Vε� is the effective strain contribution.
Shear and bulk moduli also depend on the conversion level (degree of cure, α).
Therefore, the viscoelastic stress described by Eq. (3) can be written as:
( ) ( ) ( ){ }eff, , 2 , , , ,
t
d
ij ij Vt T G t s T K t s T dsσ α α ε α ε
−∞
= − + −∫ � � (4)
and eff
Vε� consists of mechanical, thermal, and cure shrinkage parts [6, 7]:
eff mech cure T
V V V Vε ε ε ε= − − , ( ),
ref3T g r
V L T Tε β= − ( )cure
ref3
V Lε γ α α= − − (5)
where g
Lβ
and r
Lβ
are the linear coefficients of thermal expansion (CTE) measured
below the glass transition temperature Tg (glassy region) and above Tg (rubbery re-
gion), respectively, and γL is the linear cure shrinkage. The change of the modulus
during curing can be explained by the change in the molecular structure of the matrix.
Since cure-dependent viscoelasticity is not implemented in commercial FEM software
such as ANSYS 8.0 or ABAQUS 6.5, only the results of measurements for fully cured
materials were used and the cure dependence of the relaxation modulus was ne-
glected.
If the time is relatively short (t → 0), shear and bulk relaxation moduli are treated
as instantaneous shear and bulk moduli G0 and K0, respectively, and they can be de-
termined from the values of the instantaneous (obtained from the high-rate tests) elas-
tic (Young) modulus E0 and Poisson’s ratio ν0:
( )
0
0
02 1
EG
ν
=
+
and ( )
0
0
03 1 2
EK
ν
=
−
(6)
Poisson’s ratio is often assumed to be time-independent in viscoelastic materials,
therefore Eq. (6) can be used for the whole time scale of the shear, bulk, and elastic
relaxations up to the point when strains are small. The advantage of such an approach
is that when modelling the behaviour of viscoelastic materials only one modulus
needs to be measured (e.g., the shear relaxation modulus) and the other can be calcu-
lated from Eq. (6).
The effect of temperature in Eq. (3) is usually not included as G(t,T), but as
G(tred(T)), where tred is the so-called reduced time scale and G(tred) is referred to as the
master curve. The reduced time scale is defined as
red
0
t
Tt a dt≡ ∫ (7)
where aT is the temperature-dependent shift factor, which can be described by the
WLF (Williams, Landel, Ferry) equation
Thermal conductivity of adhesives for microelectronic packaging
51
( )1 ref
2 ref
expT
C T Ta
C T T
⎧ ⎫−= −⎨ ⎬
+ −⎩ ⎭ (8)
Tref is the reference temperature, and C1 and C2 are material parameters. The reduced
time scale tred can be replaced by the reduced frequency scale fred = aT f.
4.2. Experimental procedures
The standard way of measuring dynamic changes of the mechanical parameters of
shear modulus (for polymeric materials in particular) is a continuous monitoring of
the thermo-mechanical properties from the liquid to the fully cured state by applying
the liquid compound (e.g. resin + hardener) in small gaps between parallel plates of
the shear clamps of a dynamic mechanical analyzer (DMA). The samples are subject
to a series of sinusoidal strains or stresses at different frequencies (a frequency
sweep). The temperature is then increased by 5–10 °C and another frequency sweep is
applied. This procedure is repeated from about 80 °C below the glass transition tem-
perature (Tg) to about 80 °C above it. Far below the glass transition temperature the
modulus data (stress amplitude divided by strain amplitude) is frequency independent.
This modulus is called the glassy modulus. Far above the glass transition temperature,
the material either melts, as is typical of thermoplasts, or displays a nonzero, fre-
quency-independent rubbery modulus of thermosets. In between, in the so-called vis-
coelastic region, the modulus is frequency-dependent and lies between the glassy and
the rubbery values. It is customary to shift the individual modulus vs. frequency
curves along the logarithmic frequency axis until they overlap and form a master
curve. The shift (aT) is different for each temperature. The master curve, together with
this shift factor, completely describe the temperature and frequency-dependent
modulus data and can even be used to predict the mechanical behaviour at time scales
and temperatures different from those of the test conditions [8].
4.3. Numerical approach
To study the contact pressure occurring between the filler particles due to the cure
shrinkage of the polymer matrix and its influence on thermal conductivity, the model
shown in Fig. 1 was implemented by ABAQUS v.6.5 FEM software [9]. It is the 2D
axis-symmetric model, which consists of two identical spherical silver particles sur-
rounded by cylindrically shaped epoxy resin. The volume fraction of filler was about
23%. The particles touch each other at one point at the beginning of the simulation.
The contact pressure and its change in time after curing at different temperatures were
monitored at the contact point A.
Silver (as the filler) is considered to be a linear elastic material with the elastic
modulus E = 76 GPa and the Poisson’s ratio ν = 0.37. The thermal conductivity of
silver is 423 W/(m·K).
J. FELBA et al. 52
The tested epoxy resin was delivered by Amepox Microelectronics, Poland. The
linear reaction cure shrinkage was assumed at the level of 1×10⁻² (volume shrinkage
≈ 3×10⁻²). To determine the viscoelastic properties of the fully cured epoxy sample,
dynamical mechanical thermal analysis (DMTA) was performed. The DMTA meas-
urements were conducted using a TA Instruments ARES rheometer (the tool: torsion
pendular; geometry: rectangle). The dynamic mechanical shear tests were performed
to obtain the storage and loss relaxation moduli. The tests were performed in the
Fraunhofer Institut für Fertigungstechnik und Angewandte Materialforschung, Bre-
men, Germany.
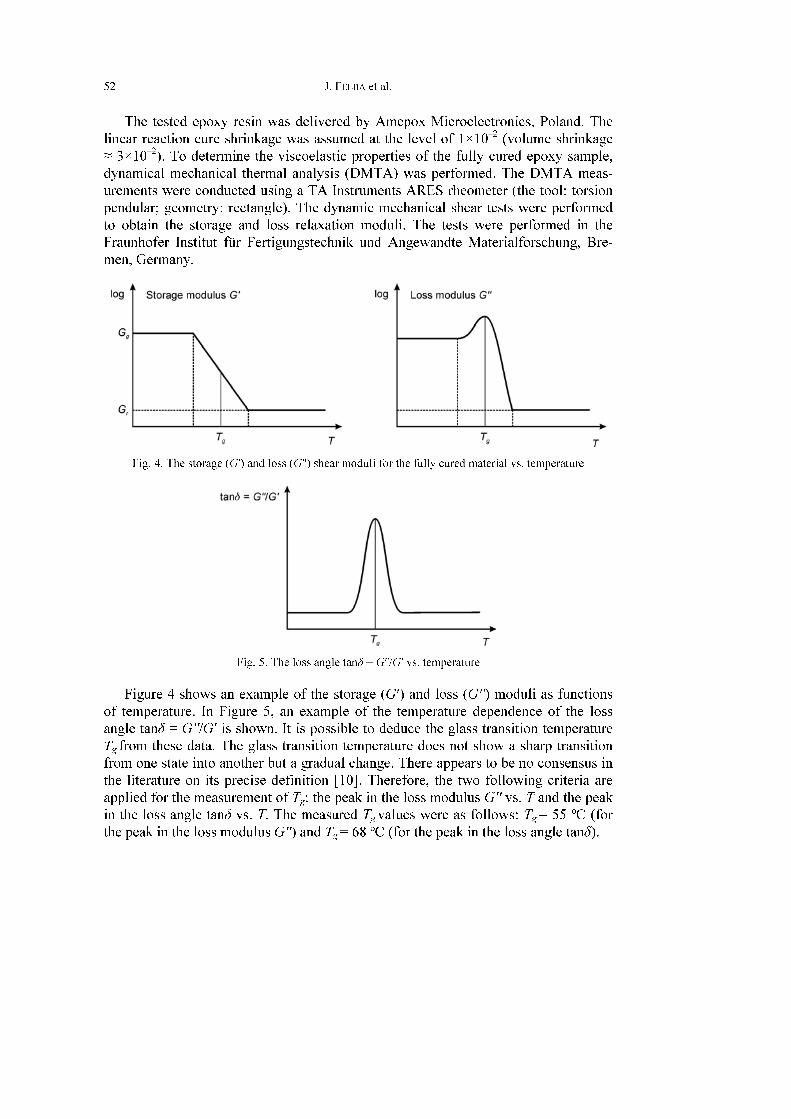
Fig. 4. The storage (G′) and loss (G′′) shear moduli for the fully cured material vs. temperature
Fig. 5. The loss angle tanδ = G′′/G′ vs. temperature
Figure 4 shows an example of the storage (G′) and loss (G′′) moduli as functions
of temperature. In Figure 5, an example of the temperature dependence of the loss
angle tanδ = G′′/G′ is shown. It is possible to deduce the glass transition temperature
Tg from these data. The glass transition temperature does not show a sharp transition
from one state into another but a gradual change. There appears to be no consensus in
the literature on its precise definition [10]. Therefore, the two following criteria are
applied for the measurement of Tg: the peak in the loss modulus G′′ vs. T and the peak
in the loss angle tanδ vs. T. The measured Tg values were as follows: Tg = 55 ºC (for
the peak in the loss modulus G′′) and Tg = 68 ºC (for the peak in the loss angle tanδ).
Thermal conductivity of adhesives for microelectronic packaging
53
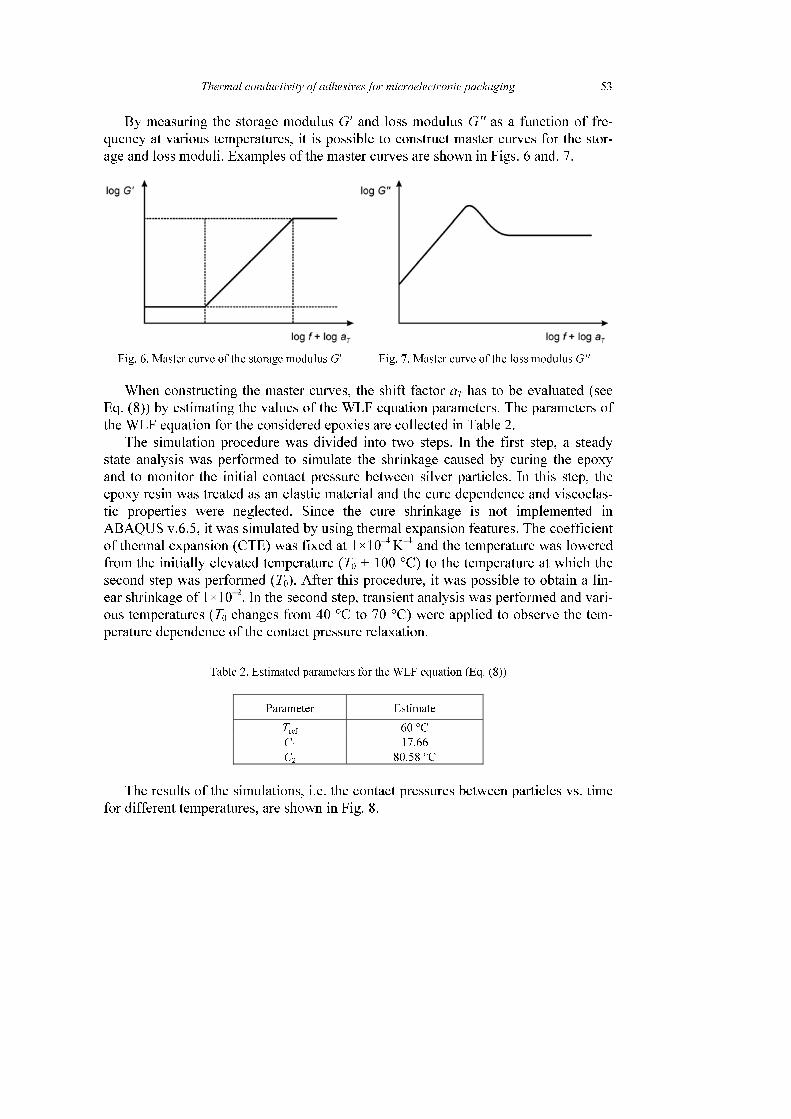
By measuring the storage modulus G′ and loss modulus G′′ as a function of fre-
quency at various temperatures, it is possible to construct master curves for the stor-
age and loss moduli. Examples of the master curves are shown in Figs. 6 and. 7.
Fig. 6. Master curve of the storage modulus G′ Fig. 7. Master curve of the loss modulus G′′
When constructing the master curves, the shift factor aT has to be evaluated (see
Eq. (8)) by estimating the values of the WLF equation parameters. The parameters of
the WLF equation for the considered epoxies are collected in Table 2.
The simulation procedure was divided into two steps. In the first step, a steady
state analysis was performed to simulate the shrinkage caused by curing the epoxy
and to monitor the initial contact pressure between silver particles. In this step, the
epoxy resin was treated as an elastic material and the cure dependence and viscoelas-
tic properties were neglected. Since the cure shrinkage is not implemented in
ABAQUS v.6.5, it was simulated by using thermal expansion features. The coefficient
of thermal expansion (CTE) was fixed at 1×10⁻⁴ K–1 and the temperature was lowered
from the initially elevated temperature (T0 + 100 °C) to the temperature at which the
second step was performed (T0). After this procedure, it was possible to obtain a lin-
ear shrinkage of 1×10⁻². In the second step, transient analysis was performed and vari-
ous temperatures (T0 changes from 40 °C to 70 °C) were applied to observe the tem-
perature dependence of the contact pressure relaxation.
Table 2. Estimated parameters for the WLF equation (Eq. (8))
Parameter Estimate
Tref 60 °C
C1 17.66
C2 80.58 °C
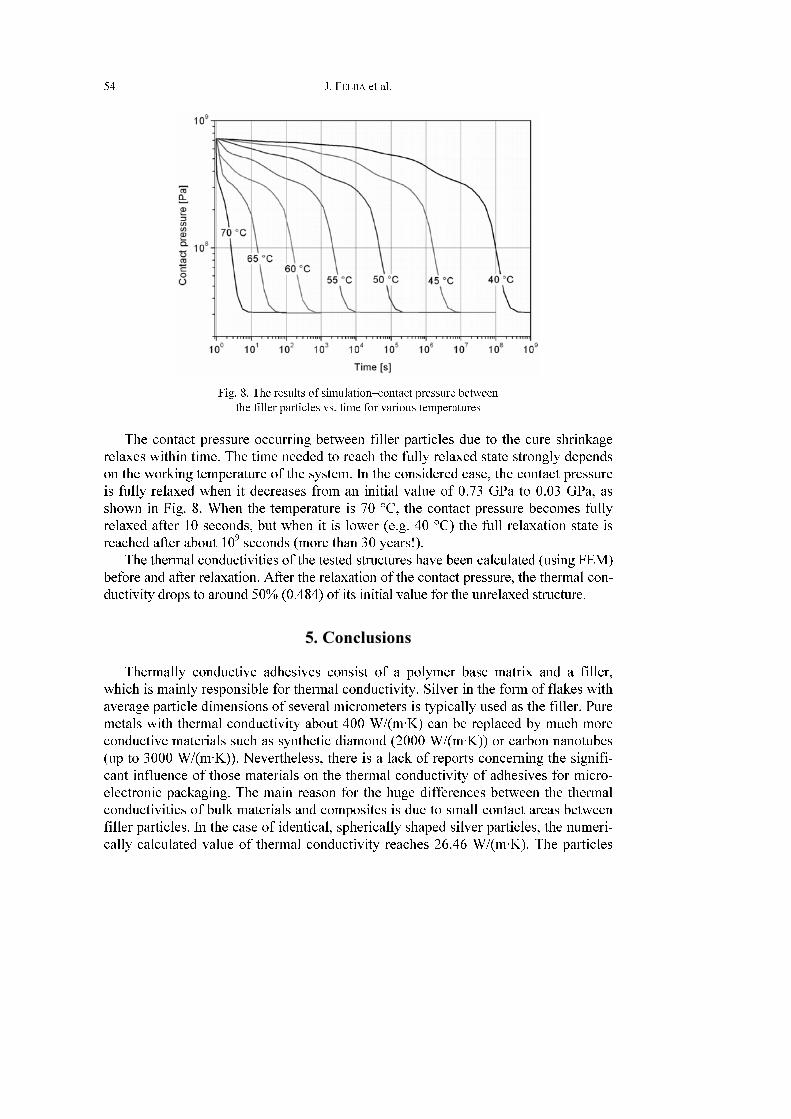
The results of the simulations, i.e. the contact pressures between particles vs. time
for different temperatures, are shown in Fig. 8.
J. FELBA et al. 54
Fig. 8. The results of simulation–contact pressure between
the filler particles vs. time for various temperatures
The contact pressure occurring between filler particles due to the cure shrinkage
relaxes within time. The time needed to reach the fully relaxed state strongly depends
on the working temperature of the system. In the considered case, the contact pressure
is fully relaxed when it decreases from an initial value of 0.73 GPa to 0.03 GPa, as
shown in Fig. 8. When the temperature is 70 °C, the contact pressure becomes fully
relaxed after 10 seconds, but when it is lower (e.g. 40 °C) the full relaxation state is
reached after about 109 seconds (more than 30 years!).
The thermal conductivities of the tested structures have been calculated (using FEM)
before and after relaxation. After the relaxation of the contact pressure, the thermal con-
ductivity drops to around 50% (0.484) of its initial value for the unrelaxed structure.
5. Conclusions
Thermally conductive adhesives consist of a polymer base matrix and a filler,
which is mainly responsible for thermal conductivity. Silver in the form of flakes with
average particle dimensions of several micrometers is typically used as the filler. Pure
metals with thermal conductivity about 400 W/(m·K) can be replaced by much more
conductive materials such as synthetic diamond (2000 W/(m·K)) or carbon nanotubes
(up to 3000 W/(m·K)). Nevertheless, there is a lack of reports concerning the signifi-
cant influence of those materials on the thermal conductivity of adhesives for micro-
electronic packaging. The main reason for the huge differences between the thermal
conductivities of bulk materials and composites is due to small contact areas between
filler particles. In the case of identical, spherically shaped silver particles, the numeri-
cally calculated value of thermal conductivity reaches 26.46 W/(m·K). The particles
Thermal conductivity of adhesives for microelectronic packaging
55
are closely packed (HCP or FCC crystal equivalent) with the ratio of particles radius
to contact area radius being 0.02. Certainly, such an ideally shaped and closely packed
filler is an oversimplification, but it does indicate theoretical limits.
As calculated using the model presented above, the contact area between filler par-
ticles has a strong influence on the thermal conductivity of the adhesive. This area
depends on the stress between particles, which occurs due to resin shrinkage during
curing, indicating that the role of the polymer matrix is more important than only
forming mechanical bonds at interconnections. Calculating such a stress is quite com-
plex because of its temporal relaxation due to the viscoelastic behaviour of the resin.
In the simulation procedure, transient analysis was performed in order to observe
the temperature dependence of contact pressure relaxation between filler particles.
The time needed for it to reach the fully relaxed state strongly depends on the tem-
perature at which the system operates. The contact pressure relaxation time changes
from 10 seconds at 70 °C to about 109 seconds (more than 30 years) at 40 °C. After
relaxation of the contact pressure, the thermal conductivity drops to around 50%
(0.484) of its initial value for the unrelaxed structure.
Acknowledgements
Authors would like to thank Mr. Andrzej Moscicki from AMEPOX Microelectronics, Poland for
supplying the epoxy resin and Ms. Jana Kolbe from IFAM Fraunhofer Institut fuer Fertigungstechnik und
Angewandte Materialforschung, Klebetechnik und Oberflaechen, Germany for the measurements.
References
[1] FAŁAT T., FELBA J., WYMYSŁOWSKI A., Proc. of 28th International Conference of IMAPS Poland
Chapter, Wrocław, 2004, p. 219.
[2] XU Y., CHUNG D.D.L., MROZ C., Composites A: Appl. Sci. Manufacturing, 32 (2001), 1749.
[3] BOLGER J.C., Prediction and measurement of thermal conductivity of diamond filled adhesives,
IEEE Publ. No 0569-5503/92/000-0219, 1992.
[4] UKITA Y., TATEYAMA K., SEGAWA M., TOJO Y., GOTOH H., OOSAKO K., Proc. of IMAPS2004, Long
Beach, USA, 2004, WA71.
[5] LI H., JACOB K.I., WONG C.P., IEEE Trans. Adv. Packaging, 26 (2003), 25.
[6] JANSEN K.M.B., WANG L., YANG D.G., VAN ’T HOF C., ERNST L.J., BRESSERS H.J.L., ZHANG G.Q., Proc.
of IEEE 2004 Electronic Components and Technology Conference, Las Vegas, Nevada, 2004, p. 890.
[7] JANSEN K.M.B., WANG L., VAN ‘T HOF C., ERNST L.J., BRESSERS H.J.L., ZHANG G.Q., Proc. 5th Int.
Conf. on Thermal and Mechanical Simulation and Experiments in Micro-electronics and Micro-
Systems EuroSimE, Brussels, 2004, p. 581.
[8] MILOSHEVA B.V., JANSEN K.M.B., JANSSEN J.H.J., BRESSERS H.J.L., ERNST L.J., 6th. Int. Conf. on
Thermal, Mechanical and Multiphysics Simulation and Experiments in Micro-Electronics and Mi-
cro-Systems, EuroSimE, Berlin, 2005, p. 462.
[9] FAŁAT T., WYMYSŁOWSKI K., KOLBE J., Proc. of 5th International IEEE Conference on Polymers and
Adhesives in Microelectronics and Photonics Polytronic2005, Wrocław, Poland, 2005, p. 180.
[10] MEUWISSEN M.H.H., DE BOER H.A., STEIJVERS H.L.A.H., SCHREURS P.J.G., GEERS M.G.D., Microe-
lectronics Reliability, 44 (2004), 1985.
Received 21 February 2006
Revised 28 May 2006

J. FELBA et al. 56