influence of teaching and learning resources on … d final.pdf · data was analyzed using...
TRANSCRIPT
i
INFLUENCE OF TEACHING AND LEARNING RESOURCES ON STUDENTS’ PERFORMANCE IN KENYA CERTIFICATE OF SECONDARY EDUCATION IN FREE DAY SECONDARY EDUCATION IN EMBAKASI DISTRICT, KENYA
Akungu Joyce Atieno
A Research Project Submitted for Examination in Partial
Fulfillment of the Requirements for the Award of the Degree of
Master of Education in Educational Planning
University of Nairobi
2014

ii
DECLARATION
This project is my original work and has not been presented for a degree in any
other university
_________________________________
Akungu Joyce Atieno
E55/72710/2008
This project has been submitted for examination with my approval as university
supervisor
_________________________________
Dr. Rose M. Obae
Lecturer
Department of Educational Administration and Planning
University of Nairobi

iii
DEDICATION
This research work is dedicated to my loving daughters; Tumi, Lynn and Dana.

iv
ACKNOWLEDGEMENT I would like to extend my sincere gratitude to The University of Nairobi
Department of Educational Administration and Planning for providing me with an
opportunity to complete an exciting and enriching course. My deepest sense of
gratitude also goes to my project supervisor Dr. Rose Obae for her expert advice.
I am also grateful to the District Education Officer Embakasi for her unwavering
support. All the heads, teachers and students of public day secondary schools in
the district, who filled in my questionnaires.
I would also like to acknowledge the valuable contributions of my brother Byron,
colleague Basil and other members of my educational planning class. I am also
grateful to NACOSTI for authorizing the project to take off. My special gratitude
to my family who showed a lot of patience and support, throughout my study
period. I cannot individually thank all those who supported in writing this project
but to you all, I say thank you.
v
TABLE OF CONTENTS
Content Page
Title page ………………………………….…………....…….……………………i
Declaration................................................................................................................ ii
Dedication ............................................................................................................... iii
Acknowledgement ................................................................................................... iv
Table of contents ...................................................................................................... v
List of tables ............................................................................................................. x
List of figures............................................................................................................ x
List of abbreviations and acronyms ........................................................................ xii
Abstract ................................................................................................................. xiii
CHAPTER ONE
INTRODUCTION
1.1 Background to the study ..................................................................................... 1
1.2 Statement of the problem .................................................................................... 5
1.3 Purpose of the study ........................................................................................... 7
1.4 Objectives of the study ....................................................................................... 8
1.5 Research questions ............................................................................................. 8
1.6 Significance of the study .................................................................................... 9
1.7 Limitations of the study ...................................................................................... 9
1.8 Delimitation of the study .................................................................................. 10
1.9 Assumptions of the study ................................................................................. 10
1.10 Definitions of significant terms ...................................................................... 10
1.11 Organization of the study ............................................................................... 12

vi
CHAPTER TWO
LITERATURE REVIEW
2.1 Introduction ...................................................................................................... 13
2.2 Concept of teaching and learning resources ..................................................... 13
2.3 Teaching and learning resources and performance .......................................... 14
2.3.1 Influence of availability of Teaching and learning materials on students’ performance in KCSE ............................................................................................. 15
2.3.2 Influence of adequacy of physical facilities on students’ performance in KCSE ...................................................................................................................... 16
2.3.3 Influence of adequacy of human resources on students’ performance in KCSE ...................................................................................................................... 17
2.3.4 Extent of utilization of TLR in FDSE ........................................................... 18
2.4 Summary of literature review ........................................................................... 19
2.5 Theoretical framework of the study .................................................................. 19
2.6 Conceptual framework of the study .................................................................. 20
CHAPTER THREE
RESEARCH METHODOLOGY
3.1 Introduction ...................................................................................................... 22
3.2 Research design ................................................................................................ 22
3.3 Target population .............................................................................................. 23
3.4 Sampling techniques and sample size .............................................................. 23
3.5 Research instruments ........................................................................................ 24
3.5.1 Validity of the instrument .............................................................................. 25
3.5.2 Reliability of the instrument .......................................................................... 26
3.6 Data collection procedures ............................................................................... 27
3.7 Data analysis techniques ................................................................................... 28
vii
CHAPTER FOUR
DATA ANALYSIS, PRESENTATION, INTERPRETATION AND DISCUSSION
4.1 Introduction ...................................................................................................... 29
4.2 Questionnaire return rate .................................................................................. 29
4.3 Demographic information of the respondents and schools .............................. 30
4.3.1 Head teachers’ and teachers’ gender ............................................................. 31
4.3.2 Head teachers’ and teachers’ academic qualifications .................................. 32
4.3.3 Head teachers’ length of service in current school ........................................ 34
4.3.4 Teachers’ length of service ............................................................................ 35
4.3.5 Teachers’ teaching subjects ........................................................................... 36
4.3.6 Teachers’ number of lessons per week .......................................................... 37
4.3.7 Students’ age distribution .............................................................................. 38
4.3.8 Students’ duration in the current school ........................................................ 39
4.3.9 Number of streams in schools ....................................................................... 40
4.3.10 Average number of students per class ........................................................ 41
4.3.11 Schools’ enrolment ..................................................................................... 42
4.3.12 Schools’ KCSE mean scores (2009-2013) .................................................. 43
4.4 Influence of availability of TLM on students’ performance in KCSE ............. 44
4.5 Influence of adequacy of physical facilities on students’ performance in KCSE ................................................................................................................................ 50
4.6 Influence of adequacy of human resources on students’ performance in KCSE ................................................................................................................................ 61
4.7 Extent of utilization of TLR in FDSE .............................................................. 64

viii
CHAPTER FIVE
SUMMARY OF THE STUDY, CONCLUSION AND RECOMMENDATIONS
5.1 Introduction ...................................................................................................... 70
5.2 Summary of the study ....................................................................................... 70
5.3 Conclusion ........................................................................................................ 74
5.4 Recommendations ............................................................................................ 75
5.5 Areas for further research ................................................................................. 77
REFERENCES ....................................................................................................... 78

ix
APPENDICES
Appendix I: Letter of introduction to respondents ................................................. 81
Appendix II: Questionnaire for head teachers ........................................................ 82
Appendix III: Questionnaire for teachers ............................................................... 86
Appendix IV: Questionnaire for students ............................................................... 89
Appendix V: Letter of authorization ...................................................................... 91
Appendix VI: Research permit ............................................................................... 92

x
LIST OF TABLES Table Page
Table 1.1: Embakasi district performance index for the last five years
2009-2013 ………………………………………………….. 7
Table 3.1: Sample size …………………………………….. ……….. 24
Table 4.1: Questionnaire return rate ………………………………… 30
Table 4.2: Head teachers’ and teachers’ gender ………………………. 31
Table 4.3: Distribution of head teachers’ and teachers’ responses on academic
Qualifications …………………………………… ………….. 32
Table 4.4: Head teachers’ duration in the current school ……………. 34
Table 4.5: Students’ duration in the current school ………………… 39
Table 4.6: Schools’ enrolment (2009-2013) …………………………. 42
Table 4.7: KCSE mean scores for the years 2009-2013 …………….. 43
Table 4.8: Head teachers’ responses on adequacy of TLM …………. 44
Table 4.9: Teachers’ responses on adequacy of TLM ………………. 46
Table 4.10: Textbook: pupil ratio …………………………………… 48
Table 4.11: Head teachers’ responses on the adequacy of
physical facilities…………………………………………… 51
Table 4.12: Teachers’ responses on the adequacy of physical facilities 54
Table 4.13: Presence of school facilities ………………………….. 57
Table 4.14: Condition and size of school facilities ……………….. 58
Table 4.15: Average number of teachers per school ………………… 62
Table 4.16: Teachers’ responses on extent of resource utilization …… 65

xi
LIST OF FIGURES Figure Page
Figure 2.1: Representation of interaction between variables of the study ……… 20
Figure 4.1: Teachers’ length of service………… ………………..………….…35
Figure 4.2: Distribution of teachers teaching subjects ……………………...……36
Figure 4.3: Teachers’ number of lessons per week ………………………......….37
Figure 4.4: Students’ age distribution ……………………………………………38
Figure 4.5: Number of streams ……………………………….………………… 40
Figure 4.6: Average number of students per class ……………..………………...41
Figure 4.7: Teachers responses on enrolment for in service training …...……… 63

xii
LIST OF ABBREVIATIONS AND ACRONYMS
B.O.G Board of Governors
DPs Development Partners
E.F.A Education for All
F.D.S.E Free Day Secondary Education
K.C.S.E Kenya Certificate for Secondary Education
MoE Ministry of Education
NGO Non-governmental organization
PTA Parents Teachers Association
SPSS Statistical Package for Social scientists
STR Students-Teacher Ratio
TLR Teaching and Learning Resources
UNESCO United Nations Educational, Scientific and Cultural
Organization
xiii
ABSTRACT
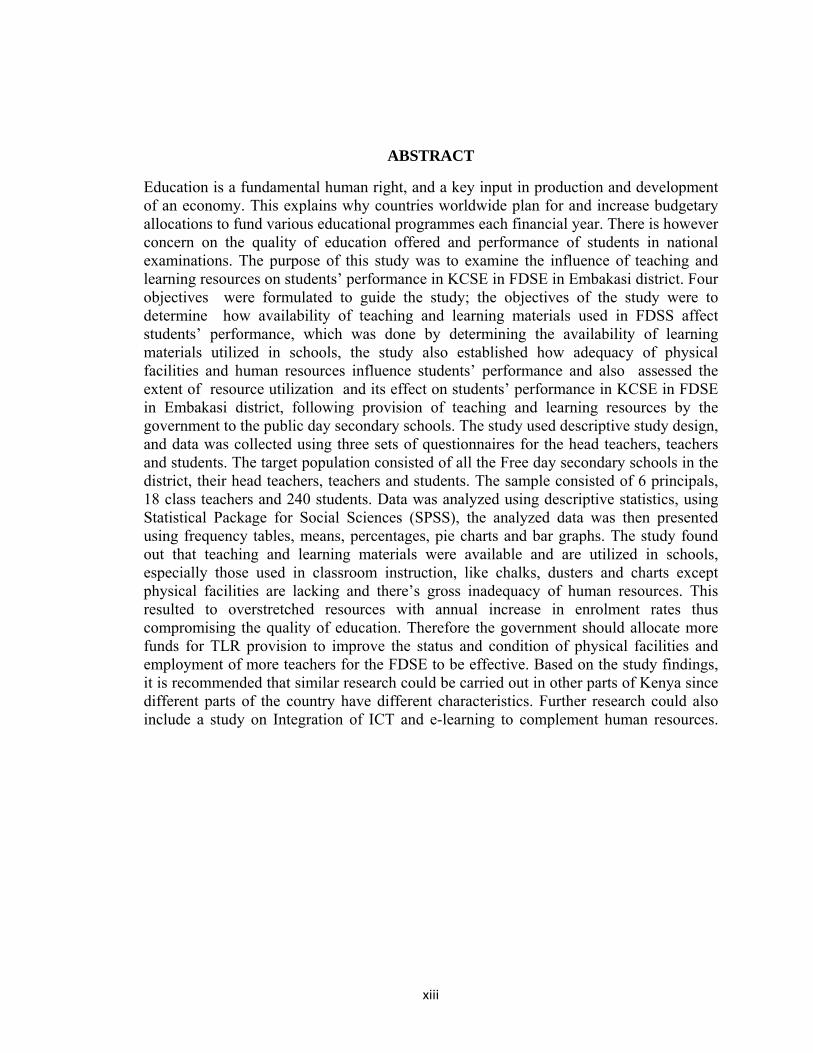
Education is a fundamental human right, and a key input in production and development of an economy. This explains why countries worldwide plan for and increase budgetary allocations to fund various educational programmes each financial year. There is however concern on the quality of education offered and performance of students in national examinations. The purpose of this study was to examine the influence of teaching and learning resources on students’ performance in KCSE in FDSE in Embakasi district. Four objectives were formulated to guide the study; the objectives of the study were to determine how availability of teaching and learning materials used in FDSS affect students’ performance, which was done by determining the availability of learning materials utilized in schools, the study also established how adequacy of physical facilities and human resources influence students’ performance and also assessed the extent of resource utilization and its effect on students’ performance in KCSE in FDSE in Embakasi district, following provision of teaching and learning resources by the government to the public day secondary schools. The study used descriptive study design, and data was collected using three sets of questionnaires for the head teachers, teachers and students. The target population consisted of all the Free day secondary schools in the district, their head teachers, teachers and students. The sample consisted of 6 principals, 18 class teachers and 240 students. Data was analyzed using descriptive statistics, using Statistical Package for Social Sciences (SPSS), the analyzed data was then presented using frequency tables, means, percentages, pie charts and bar graphs. The study found out that teaching and learning materials were available and are utilized in schools, especially those used in classroom instruction, like chalks, dusters and charts except physical facilities are lacking and there’s gross inadequacy of human resources. This resulted to overstretched resources with annual increase in enrolment rates thus compromising the quality of education. Therefore the government should allocate more funds for TLR provision to improve the status and condition of physical facilities and employment of more teachers for the FDSE to be effective. Based on the study findings, it is recommended that similar research could be carried out in other parts of Kenya since different parts of the country have different characteristics. Further research could also include a study on Integration of ICT and e-learning to complement human resources.
1
CHAPTER ONE
INTRODUCTION
1.1 Background to the study
Education, according to Coombs (1970), consists of two components, inputs and
outputs. Inputs consist of human and material resources and outputs are the goals
and outcomes of the educational process. Both the input and output form a
dynamic organic whole and if one wants to investigate and assess the educational
system in order to improve its performance, effects of one component on the other
must be examined.
Availability of teaching and learning resources (TLR) enhances the effectiveness
of schools as these are basic things that can bring about good academic
performance in the students. Maicibi (2003) opined that all institutions or
organization are made up of human beings (workers) and other non-human
resources. He further asserts that when the right quantity and quality of human
resources is brought together, it can manipulate other resources towards realizing
institutional goals and objectives. Consequently, every institution should strive to
attract and retain the best of human resource. The economic austerity in recent
times, coupled with the need for expansion of access to education, have combined
to present educational planners worldwide with increasingly difficult choices in
the allocation of available resources.
2
According to Department for International Development (DFID) in (Guidance
note, a DFID practice paper, 2007) research evidence confirms that the most
consistent characteristics in improving student performance are the availability of
(a) textbooks and supplementary Teaching and Learning Materials (TLM), (b)
well trained, prepared, supervised and motivated teachers (human resources and
(c) Adequate physical facilities. DFID further asserts that most African countries
like Malawi and Zimbabwe continues with monopolistic state primary textbook
provision for TLM via the Malawi Institute of Education, with the active support
of the donor community. Tanzania on the other hand is on the verge of re-
introducing sole source textbook supply from the private sector and perhaps re-
creating a new state textbook provision system. In Kenya, the government is
considering a proposal from the Kenya Institute of Curriculum Development
(KICD) formerly Kenya Institute of Education (KIE) to form itself into an
educational publishing parastatal. Development Partners (DPs) have recently
supported sole source textbook supply monopolies from the private sector in
Ethiopia and at secondary level in Uganda. Sole source supply is often justified on
the basis of lower costs and has on the other hand strongly contributed to
complaints by schools with regard to poor quality textbooks and irregular,
inaccurate and ineffective book distribution (DFID, 2007).
In recent years, access to computers and the internet has generated interest in the
provision of e-materials. Where the internet is unavailable, unreliable or
unaffordable, the development of local school networks and the provision of

3
e-materials to schools on compact disks (CDs/ flash disks can support e-learning
via school servers and networks. But e-based learning in many developing
countries and transitional economies have proved to be very expensive. TLM are
often seriously underfunded alongside physical facilities and human resources. It
is not surprising; therefore, that literacy has become a major problem in many
countries when students and teachers have so little to read (The World Bank,
2001). The physical, material, human and financial resources invested in schools
influence not only the education provided to students but also aspects of teachers
and student motivation and consequently the educational outcomes.
The Organization for Economic Co-operation and Development (OECD)
Programme for International Student Assessment (PISA) shows that resource
shortages hinder instruction and lower student performance (OECD, 2007). In
addition, inequalities in student’s educational performance often reflect disparities
in the resources invested in schools (OECD, 2008). Johan (2004) states that
educational outcomes in schools are closely linked to utilization and adequacy of
teaching and learning resources in different ways; poor utilization,
underutilization, unqualified educators brings forth low educational achievement.
The inadequacy of physical and material resources in schools is a major factor
responsible for learning outcome of students. Schools that do not have adequate
facilities such as workshops, laboratories, classrooms, teaching learning materials
are unlikely to post good results.

4
Studies done in the past on the relationship between TLR and performance
include, Likoko, Mutsotso & Nasongo (2013) in the study on adequacy of
instructional materials and physical facilities and their effect on quality of teacher
preparation in colleges in Bungoma county and a study done by Mbaria (2006) on
the relationship between learning resources and performance in secondary schools
in Ndaragwa district. All the above studies indicate that TLR were higher in higher
performing schools than in low performing schools and that there is a significant
difference in resource availability in the higher performing schools and low
performing schools. Also indicate that most institutions are faced with challenges
such as lack of adequate facilities like libraries and inadequate instructional
materials and these factors tend to have a negative effect on the quality of
graduates produced. Adan (2011) in the study on challenges faced by head
teachers in implementing FDSE program in Wajir also posits that there is a major
challenge on adequacy of physical facilities in most schools in the district, the only
adequate materials available are textbooks, but the schools are in dire need of
facilities like classrooms, toilets, desks. Chairs, laboratories as well teaching aids,
and recommended that a larger percentage of FDSE funds be diverted to cater for
TLR.
Provision and utilization of facilities is the responsibility of stake holders in
education. (National Policy on Education, 2012). The Kenyan government ensures
the implementation of the national policy on education by providing an enabling
environment. Parents are also involved in purchase of resources in schools and

5
more so in putting up physical facilities through what is popularly referred to as
Parents Teachers Association (PTA) projects. With the introduction of FDSE, the
government has experienced challenges with provision of TLR in schools. The
Kamunge report (1988) recommended the establishment of public day secondary
schools as a way of expanding quality day secondary education, despite all these,
planning and provision for TLR has remained a challenge in today’s FDSE with
low learning outcomes over the years.
1.2 Statement of the problem
Teaching and learning resources (TLR) are the most visible components of
government educational provision and their absence is often noted by
stakeholders. The Kenyan government has taken a number of measures in the
previous years to improve and promote FDSE, this is evident in the increased
expenditure channeled to this program. One of the policy statements is that a
great proportion of education expenditure should be channeled to TLR.
(National Policy of Education (NPE), 2012). If this policy were properly
planned for and implemented, there should be enough TLR in most if not all
secondary schools.
TLR play a paramount role in the teaching and learning process and inevitably
the student’s academic performance. This calls for provision of adequate TLR
in FDSS. The FDSS are faced with a mirage of problems which include
inadequate provision of TLR as a result of poor planning and also FDSE

6
program embarked on existing TLR in schools with increased enrolment since
inception in 2008. The impact of FDSE resulted into the intended increase on
enrollment on its first year of implementation and this immediately led to
constrain on existing TLR such as teachers, classrooms, teaching and learning
materials (Gatende, 2010).There has been a public outcry about poor
performance in FDSE, especially in Nairobi County which has a total of 81
public secondary schools of which 59 are FDSS. In a world of international
competition, academic performance in Embakasi has been on the decline
characterized by poor performance in the Kenya Certificate of Secondary
Education.
Embakasi district in Nairobi county has six out of seven schools being FDSS and
according to K.C.S.E performance rating index, performance of the district in the
past five years has been at a mean grade of D (plain) as shown in table 1.1

7
Table 1.1 Embakasi District performance index for the last five years (2009-
2013)
Year Performance Index (%)
2009 37.0
2010 33.4
2011 36.3
2012 27.73
2013 24.79
Mean 31.84
Source: DEO’s office, Embakasi district (April 2014)
Table 1.1 shows the performance of Embakasi district with an average mean
standard grade of D (plain) over the past five years. It is in reference to this
performance that this research aims to find out the influence of TLR on students’
KCSE performance in FDSE in Embakasi district in Nairobi County with a view
to improving adequacy of TLR in schools and addressing the disparity in academic
performance in Nairobi County.
1.3 Purpose of the study
The purpose of the study is to examine the influence of teaching and learning
resources on students’ performance in K.C.S.E in Free Day Secondary Education
in Embakasi District, Nairobi County, Kenya.

8
1.4 Objectives of the study
i. To determine how availability of teaching and learning materials used in
teaching and learning in FDSS in Embakasi district affect students’
performance in KCSE.
ii. To establish how adequacy of physical facilities influence students’
performance in KCSE in Embakasi district.
iii. To establish how adequacy of human resource influence students’
performance in KCSE in FDSE in Embakasi district.
iv. To assess extent of resource utilization and its effect on students’
performance in KCSE in FDSE in Embakasi district.
1.5 Research questions
The research questions of the study are:
i. In what ways does availability of TLM used in FDSE in Embakasi district
affect students’ performance in KCSE?
ii. How does adequacy of physical facilities influence students’ performance in
KCSE in FDSE in Embakasi district?
iii. How does adequacy of human resource influence students’ performance in
KCSE in FDSE in Embakasi district?
iv. What is the extent of resource utilization in FDSE in Embakasi district?

9
1.6 Significance of the study
The research aimed at assessing the influence of TLR on students’ performance in
KCSE in FDSE whose results may be useful to various institutions and education
authorities involved in policy formulation, development, implementation and more
so personnel in the MoEST in formulating policies to improve adequacy of TLR in
schools. It is also hoped that the study will consequently increase literature on
availability of TLR to assist education evaluators establish ongoing education
quality monitoring networks and improvement processes, to guide teachers to
improve use of TLM by using instructional strategies for appropriate delivery of
curriculum; hence inform policies in teacher education. The research findings may
also be used to form a basis for further research involved in planning for TLR used
in schools
1.7 Limitations of the study
Limitations are factors which may affect the study (Nachmias & Nachmias, 2009).
Since the study aims at finding out the influence of TLR on students’ performance
in KCSE in FDSS, respondents had reservations to share information with regard
to adequacy of resources in their schools in relation to performance since they
mistook the researcher to be on a fault finding mission. But the researcher
physically visited the schools and explained that the study’s aim was only for
academic purposes.
10
1.8 Delimitation of the study
The study covered all FDSS in Embakasi District, Nairobi County in Kenya.
Secondly the study was only carried out in FDSS leaving out boarding schools.
This was based on the fact that FDSS have been performing poorly in national
examinations compared to public boarding secondary schools. Though there may
have been other factors that influence performance in the FDSS, the study
concentrated only on availability of TLM, adequacy of physical facilities and
human resources and the extent of utilization of all TLR.
1.9 Assumptions of the study
The following assumptions were made in this study; that FDSS met the required
standards by the Ministry of Education to offer secondary education; that students
admitted in these schools had met the minimum entry requirements and; that the
schools have qualified teachers as per the requirements of the Ministry of
Education.
1.10 Definitions of significant terms
This section gives definition of all significant terms as were used in the study.
Academic performance refers to school mean score in KCSE performance
Academic qualification refers to the highest level of schooling attained by a
teacher
Access refers to making education affordable or available to the targeted groups

11
Adequacy refers to sufficiency of TLR for teaching and learning process
Assess refers to making judgment of TLR or evaluate the nature and quality of
school resources.
Effectiveness refers to maximizing utilization of resources provided
Finance refers to management of revenues used to pay for TLR in schools
Free Day Secondary Education refers to the education provided by the
government in the second cycle of a school system, the parent does not incur
tuition and boarding expenses since the former is paid by the government and the
student goes back home after school.
Human resources refers to personnel or a workforce of an institution that
implements a school program so as to meet set goals
Influence refers to the power to affect or have an effect on something
In-service training refers to training of teachers once employed
Physical facilities refers to plants and equipment that schools use to meet goals
Resource utilization refers to use of teaching and learning items, physical
facilities and human resources to meet goals.
Students performance tests/ examinations refers to educational achievements of
students

12
Teaching and learning resources (TLR) refers to all human and non human
resources that aid the teaching and learning process and include TLM (material
resources) physical facilities and human resources (teachers)
Teaching materials refers to equipment and facilities used in the teaching and
learning process like charts, chemicals and equipment
1.11 Organization of the study
The study has five chapters. Chapter one is an introduction of the whole study and
includes the background to the study, statement of the problem, the objectives,
research questions, purpose of the study, limitations and delimitations of the study,
significance and assumptions of the study and definition of significant terms.
Chapter two consists of literature review of previous publications relevant to the
study; it contains the concept of TLR, to include TLM, physical facilities, human
resources, extent of TLR utilization and the influence of utilization of TLR on
students’ performance in KCSE, theoretical framework, conceptual framework and
summary of literature review, while chapter three covers a detailed description of
research methodology, design, target population, sampling techniques and sample
size, research instruments, validity and reliability, data collection procedures and
analysis techniques. Chapter four involves data analysis, interpretation and
discussion of research findings. Chapter five provides summary of findings,
conclusion, recommendations and areas for further research.
13
CHAPTER TWO
LITERATURE REVIEW
2.1 Introduction
This chapter focuses on the study variables, hence deals with the concept of
teaching and learning resources, their availability and adequacy in FDSS and
extent of utilization and the influence of utilization of TLR on students’ KCSE
performance. The literature review gives an evaluation of the TLR in use in the
current FDSE and makes references to studies that have been done in the past in
the study area.
2.2 Concept of teaching and learning resources
Adequacy of TLR refers to satisfactory or acceptable quality and quantities of
material resources, physical facilities and human resources. According to DFID
(2007), adequacy of instructional materials such as textbooks which is the main
instruction material is the most cost effective input affecting student performance.
In this context adequate supply is usually assumed to be a minimum of one
textbook per three students, and at primary level enough reading books so that
every child has the opportunity to read at least one new book every week.
Adequacy of TLR determines an educational system’s efficiency, according to
Padmanabhan (2001). For effective teaching and learning, textbook and resource
materials are basic tools, their absence or inadequacy makes teachers handle
subjects in an abstract manner, portraying it a dry and non exciting. It is also

14
important to have appropriate personnel plan for adequate instructional materials
and physical facilities to support educational effort. Therefore Scarcity of
textbooks, libraries and physical facilities according to Coombs (1970), will
constraint educational system from responding more fully to new demands. In
order to raise the quality of education, its efficiency and productivity, better
learning materials (TLM), physical facilities and human resources are needed. This
research will look into the adequacy of TLR in FDSS since the implementation of
FDSE in public education.
2.3 Teaching and learning resources and performance
TLR comprises basically three components: material resources, physical facilities
and human resources (DFID, 2007) Studies done in the past with regard to
availability of TLR in education reveal that TLR are not always available in
schools. This inadequacy of TLR has been of serious concern to educators.
According to Lyons (2012) learning is a complex activity that involves interplay of
students’ motivation, physical facilities, teaching resources, and skills of teaching
and curriculum demands. Availability of TLR therefore enhances the effectiveness
of schools as they are the basic resources that bring about good academic
performance in the students. The necessary resources that should be available for
teaching and learning include material resources, human resource such as teachers
and support staff and, physical facilities such as laboratories, libraries and
classrooms.
15
TLR help improve access and educational outcomes since students are less likely
to be absent from schools that provide interesting, meaningful and relevant
experiences to them. These resources should be provided in quality and quantity in
schools for effective teaching-learning process. Several studies have been
conducted on the impact of instructional materials on education. Momoh (2010)
conducted a research on the effects of instructional resources on students’
performance in West Africa School Certificate Examinations (WASCE). The
achievements of students in WASCE were related to the resources available for
teaching. He concluded that material resources have a significant effect on
student’s achievement since they facilitate the learning of abstract concepts and
ideas and discourage rote-learning. When TLR are inadequate education is
compromised and this inevitably is reflected in low academic achievement, high
dropout rates, problem behaviors, poor teacher motivation and unmet educational
goals. The study focuses on the influence of TLR on students’ KCSE performance
since the introduction of FDSE in Embakasi District.
2.3.1 Influence of availability of Teaching and learning materials on students’
performance in KCSE
Material resources include textbooks, charts, maps, audiovisual and electronic
instructional materials such as radio, tape recorder, television and video tape
recorder. Other category of material resources consist of paper supplies and
writing materials such as pens, eraser, exercise books, crayon, chalk, drawing
books, notebooks, pencil, ruler, slate, workbooks and so on (Atkinson, 2000).

16
Adeogun (2001) discovered a very strong positive significant relationship between
instructional resources and academic performance. According to Adeogun, schools
endowed with more materials performed better than schools that are less endowed.
This corroborated the study by Babayomi (1999) that private schools performed
better than public schools because of the availability and adequacy of teaching and
learning materials. Mwiria (1985) also supports that students performance is
affected by the quality and quantity of teaching and learning materials. The author
noted that institutions with adequate facilities such as textbooks stand a better
chance of performing well in examination than poorly equipped ones. Therefore,
poor performance could be attributed to inadequate teaching and learning materials
and equipment. The study will look into the adequacy of TLM in FDSE in
Embakasi district.
2.3.2 Influence of adequacy of physical facilities on students’ performance in
KCSE
The development and maintenance of physical facilities in educational institutions
by communities, parents, and sponsors should continue to be encouraged. This is
because lack of such facilities interferes with learning process (Republic of Kenya,
1988a). DFID (2007) indicates the importance of school facilities in relation to
quality education. Difference in school facilities would be seen to account for
difference in achievement. Physical facilities include classrooms, lecture theatres,
auditoriums, administrative block, libraries, laboratories, workshops, play grounds,

17
assembly halls, and special rooms like clinics, staff quarters, students’ hostels,
kitchen, cafeteria, and toilet amongst others.
He further asserts that learning experiences are fruitful when there are adequate
quantity and quality of physical resources; and that unattractive school buildings,
crowded classrooms, non availability of playing ground and surroundings that
have no aesthetic beauty can contribute to poor academic performance. Fonseca
and Conboy (2006) posit that the physical conditions and organization of schools
facilitate or inhibit construction of a culture of success.
Ministry of Education Science and Technology, MOEST (2005) explains the
importance of ensuring that there are adequate and appropriate facilities for
teaching and learning so that educational programmes could be implemented
effectively. The research focuses on availability of TLR. The study will look into
the adequacy of physical facilities in FDSE in Embakasi District.
2.3.3 Influence of adequacy of human resources on students’ performance in
KCSE
The adequacy of TLR determines the success or failure of the educational system.
A method of determining the extent of teacher’s adequacy is through Students-
Teacher ratio (STR) which is the number of students assigned to teachers for
teaching. STR is used to determine the number of students that are to be allocated
to a teacher in a given educational level. The STR shows a teacher’s workload at a
particular level of education. It also helps in determining the number of teaching

18
manpower needed for a projected student’s enrolment. Thus, it could be used to
determine either teachers are over-utilized or underutilized (Afolabi, 2005).
An educational institution’s human resources consist of teachers and other support
staff who engage in the process of teaching and learning. They include, laboratory
assistants, cooks amongst others. There should be optimum use of the available
human resource especially teachers if good performance is to be achieved.
Republic of Kenya (RoK, 2005) where teacher shortage exists, the head teacher
and Board of Management (BOM) should hire on temporary basis, as there are
very many trained but unemployed teachers. The study will find out the adequacy
of human resources in FDSE in Embakasi district.
2.3.4 Extent of utilization of TLR in FDSE
The utilization of resources in education brings about fruitful learning outcomes
since resources stimulate students learning as well as motivating them. A common
way to examine the utilization of education resources is to analyze school
expenditure. This is because school expenditures constitute the bulk of all
resources devoted to schooling and they are tractable instruments of education
policy (Meghir, 2002). Since the inception of FDSE policy, access to secondary
education has gone up with the number of students enrolling in secondary
education rising from 1.3 million in 2009 and 2.1 million students this year, raising
the transition rate from 64% to 77% over the period.(“FDSE’, 2014) led to
overcrowded classrooms and overutilization on existing TLR. (KESSP, 2010)

19
According to SACMEQ (2003) Survey revealed that few schools provided
libraries or reading corner to enable literate environment UNESCO (2007).
A school should adequately utilize the available facilities to advance learning
opportunities offered to pupils. It is the responsibility of the head teacher to ensure
that there is adequate classroom space to enable teaching learning process to take
place and should ensure that all facilities are efficiently and effectively utilized so
as to achieve educational goals and improve learning outcomes..
2.4 Summary of literature review
In conclusion, the provision of FDSE in public schools has created the need for an
evaluation of the adequacy of TLR which seems to be over stretched, hence has an
effect on the performance of the schools in Embakasi district. World bank (2013)
indicates that resource availability in schools is inadequate in terms of student text
book distribution, infrastructure availability and pupil teacher ratio. This study
therefore aims at putting measures in place to check on the availability of teaching
and learning materials, physical facilities and human resources necessary so as to
improve the performance of FDSS in the district.
2.5 Theoretical framework of the study
The study employs Education Production Theory (EPT). There is little consensus
in the definition of and measurements of inputs and outputs of education.
However, the issue seems to arise from lack of agreed goal of education that can
be translated to operational and measurable objectives, hence there is no

20
standardized unit of outputs and inputs. Thus inputs are all TLR to include TLM,
qualified teachers and the school physical facilities. The end result, the output is
the students’ performance and achievement. In this study measures such as head
teachers’ and teachers’ experience and qualifications, physical facilities, and all
material resources used in teaching and learning are used as inputs while specific
measures of outputs are grades attained by the students at examinations. The
problem with the input measures are the qualitative dimensions which are hard to
define and difficult to measure. However, after all the inputs have been used, their
success is then measured by the result of the KCSE examination of given
standards.
2.6 Conceptual framework of the study
Figure 2.1 Representation of interaction between variables of the study
Material resources
Physical facilities Performance in KCSE
Teaching and learning process
Human resources
21
The conceptual framework illustrates the influence of TLR on students’ KCSE
performance. The independent variables are the adequate TLM, physical facilities
and qualified teachers being able to influence learning outcomes (dependent
variable).
The TLM include textbooks, teachers’ guides, reference books, models,
excursions/field trips, charts, calculators, computers and internet. Their availability
enables learners to complete assignments, cover the syllabus adequately and
consequently improved academic results. Physical facilities include desks and
chairs, dormitories, dining halls, offices, laboratories, library, agriculture rooms,
home science rooms, computer rooms, play grounds, stores, toilets/latrines
recreational facilities which help in creating a conducive learning environment
while others directly affect curriculum implementation. A school that is well
endowed with adequate physical facilities is likely to attain better educational
outcomes than one that is deprived of these facilities. The teachers and other
human resources are therefore expected to utilize the TLM and available physical
facilities to achieve set goals and improve learning outcomes.

22
CHAPTER THREE
RESEARCH METHODOLOGY
3.1 Introduction
This chapter deals with the methodology used in carrying out the research. It
highlights the research design, target population, sampling techniques and sample
size, research instruments, reliability and validity of the research instrument, data
collection procedures and data analysis techniques.
3.2 Research design
The study was carried out using a descriptive research survey design. Orodho
(2005) notes that a descriptive research survey design is an appropriate way of
evaluating educational programmes as educational activities operate in a social
context. According to Krishnaswami (2001), this design is a fact finding study
which involves collecting data directly from a population thereof at a particular
time. This design is ideal for this study because the study was conducted in a
setting that requires direct responses from the respondents while investigating
existing phenomenon without manipulating the variables. The design also allows
the participants to describe and provide their opinions regarding the variables
being studied in detail.

23
3.3 Target population
Nachmias and Nachmias (2009) define the target population as the entire set of
relevant units of analysis or data. The target population of this study comprised of
all the 6 FDSS in Embakasi district, their principals and teachers. There are about
2400 students and a total of 90 class teachers in the district and the study targeted
all of them. (DEO, Embakasi district) The principals are the supervisors of TLR
and implementers of F.D.S.E in their specific schools and were able to supply
accurate information with regard to availability of TLR in their schools. The class
teachers on the other hand, are the implementers of the FDSE hence directly
utilized the available TLR and were therefore in the best position to provide
reliable information on TLR availability, utilization and adequacy. The students
also indicated their interaction with the available TLR in their schools.
3.4 Sampling techniques and sample size
Sampling refers to selecting a given number of subjects from a target population
so as to represent that population (Kombo & Tromp, 2005). In this study, a census
was used as all FDSS in the district were studied. While simple random sampling
was used in selecting the students and teachers in each school. Kombo & Tromp
further state that in simple random sampling all the individuals in the defined
population have an equal and independent chance of being selected as a member
of the sample size. The two methods were used in this study. According to Gay
(1992) 20% is adequate enough to represent a small population while 10% to
represent a large population. Random sampling was used to ensure a fair

24
representation of all the groups. The researcher chose form three students since
they have stayed long enough in the school compared to form one students and
two students and form four students were left out so as to allow them prepare for
their K.C.S.E exams.
Table 3.1 Sample size
Target population N Sample size (n) %
Principals 6 6 100
Class teachers 90 18 20
Students 2400 240 10
Total 2496 264 10
Source: DEO’s office, Embakasi district
3.5 Research instruments
Mugenda and Mugenda (2003) observe that the use of questionnaires is a popular
method of data collection in education because of the relative ease of cost
effectiveness with which they are constructed and administered to the large
samples. Observations, questionnaires and content analysis were the methods of
data collection; observations were done on physical facilities for teaching and
learning. A questionnaire was generated with both open and close ended questions
to the head teachers, class teachers and students.

25
The research had three categories of questionnaires; the principals’ questionnaire
included basic demographic data on their gender, length of service and
qualification; school demographic characteristics like, school enrolment and
K.C.S.E performance for the last five years, information on availability, adequacy
and frequency of use of TLR. The teachers’ questionnaire as well included basic
demographic data on teachers’ gender, length of service and qualification and
teaching subject; availability of TLR in their schools and extent of resource
utilization while the students’ questionnaires also included basic demographic data
on age, also evaluated the presence, condition and size of physical facilities in
their schools, availability and adequacy of TLM, in their school and availability of
human resources and expected grade at the end of the programme. Document
analysis involved sourcing secondary data on results of K.C.S.E for the period
2009- 2013 which was obtained from the DEO’s office and analyzed with regard
to performance.
3.5.1 Validity of the instrument
Mugenda and Mugenda (2003) says validity has to do with how accurately the
data obtained in the study represent the variables of the study. Construct validity is
the degree to which a test measures what it claims to measure, that is giving a
legitimate operationalization in a study in relation to the theoretical constructs. To
ensure validity, expert judgment was sought where the researcher availed the
instruments to experts to analyze. The advice given was used to improve the
instruments. This was conducted prior to the actual research where two schools

26
were involved; these two schools were not included in the sample study and were
randomly selected from the neighboring Kamukunji district which has similar
characteristic of schools as those in Embakasi. Based on the analysis of the
piloting, modification and removal of ambiguous or unclean items such as
questions, inaccurate responses or indicated weaknesses was done to attract
appropriate responses from the respondents.
3.5.2 Reliability of the instrument
Reliability concerns the degree to which a particular procedure gives similar
results over a number of repeated trials (Orodho, 2009). The instruments in this
category were the same for piloting and actual study. Test retest was conducted in
the piloting schools in a span of two weeks apart, a correlation coefficient between
the first and second results were computed using the Pearson product correlation
coefficient which was generated using the statistical package for social scientist
(SPSS) software to determine reliability. According to Nachmias and Nachmias
(2009) positive coefficient of over 0.7 is considered to be reliable, and the higher
the coefficient the more reliable the instruments. The computation showed the
correlation coefficient ( r) to be 0.86, 0.89 and 0.87 for the head teachers’,
teachers’ and students’ questionnaires respectively, hence showing all the
instruments were reliable tools.
27
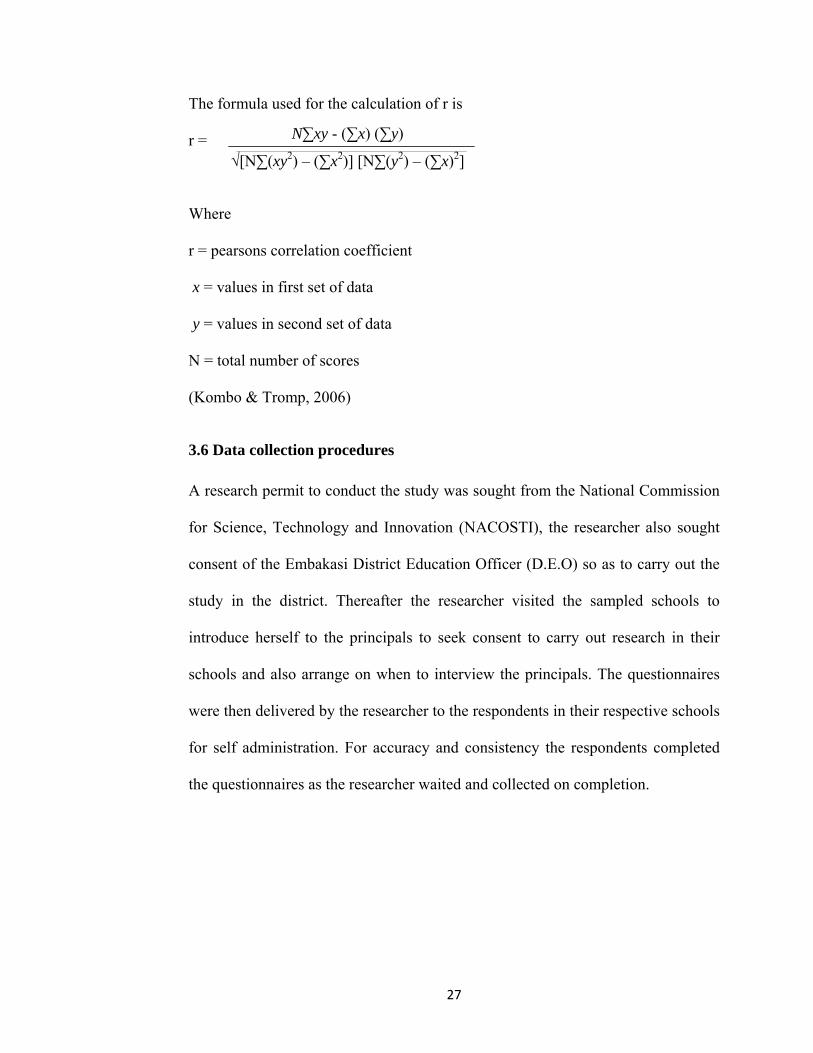
The formula used for the calculation of r is
r =
Where
r = pearsons correlation coefficient
x = values in first set of data
y = values in second set of data
N = total number of scores
(Kombo & Tromp, 2006)
3.6 Data collection procedures
A research permit to conduct the study was sought from the National Commission
for Science, Technology and Innovation (NACOSTI), the researcher also sought
consent of the Embakasi District Education Officer (D.E.O) so as to carry out the
study in the district. Thereafter the researcher visited the sampled schools to
introduce herself to the principals to seek consent to carry out research in their
schools and also arrange on when to interview the principals. The questionnaires
were then delivered by the researcher to the respondents in their respective schools
for self administration. For accuracy and consistency the respondents completed
the questionnaires as the researcher waited and collected on completion.
N∑xy - (∑x) (∑y)
√[N∑(xy2) – (∑x2)] [N∑(y2) – (∑x)2]

28
3.7 Data analysis techniques
Data analysis refers to the process of evaluating data analytically and logically so
as to examine each component of the data that is collected using the research
instruments. After data collection, the instruments were checked for completeness
and errors, the questionnaires were then be arranged, coded and entered into the
computer using Statistical Package for Social Science (SPSS) where it was
analyzed. Descriptive statistics was used to analyze quantitative data by filling
frequencies and percentages presented in table, charts, and graphs. Open ended
questions and observations were analyzed qualitatively in narrative form and also
presented in form of tables.

29
CHAPTER FOUR
DATA ANALYSIS, PRESENTATION, INTERPRETATION AND
DISCUSSION
4.1 Introduction
This chapter contains the findings of the data analysis of the study together with
their interpretations. All themes discussing the same research questions were
presented and analyzed together. The chapter begins with the demographic
information of the respondents and schools followed by analysis, presentations,
interpretation and discussions of research findings based on the respondents’ and
schools’ demographic characteristics, followed by research questions. Tables, bar
graphs and pie charts are used to present the findings while frequencies, means and
percentages are used to discuss the findings.
4.2 Questionnaire return rate
Completion rate is the proportion of the sample that participated as intended in all
the research procedures. All the 6 head teachers, 18 class teachers and 240
students sampled, filled out and returned the questionnaires, which was a 100%
return rate respectively. It is usually assumed that the higher the response rate, the
more likely the results are representative of the population provided the sampling
is appropriate, hence 100% return rate is deemed as an accurate representation of

30
the population responses (Mulusa, 1988). A summary of the questionnaire return
rate is shown in the Table 4.1.
Table 4.1: Questionnaire completion rate
Respondents Expected responses Actual responses Percent
Head teachers 6 6 100.0
Class teachers 18 18 100.0
Students 240 240 100.0
Total 264 264 100.0
4.3 Demographic information of the respondents and schools
The demographic information of the head teachers and teachers was based on their
gender, academic qualification and length of service in the current school and
duration of teaching for the teachers. The demographic characteristics of students
covered in this section include their age and duration in current school, while the
demographics of the school include the schools’ enrolment trends, KCSE
performance for the last five years, number of streams and number of students per
class. Demographic characteristics give a clear understanding of the respondents
and institutions included in the study.

31
4.3.1 Head teachers’ and teachers’ gender
The head teachers and class teachers were asked to indicate their gender. The data
is presented in Table 4.2
Table 4.2: Head teachers’ and class teachers’ gender
Gender Head teachers Class teachers
F Percent F Percent
Male 0 0 6 33.3
Female 6 100 12 66.7
Total 6 100 18 100
Data on the gender of the head teachers indicated that 6(100%) were female while
0% was male. Data on class teachers shows that 12(66.7%) were female while
6(33.3%) were male. This shows there is an appropriate gender distribution among
class teachers but there were no males among the head teachers. Their gender
distribution was deemed appropriate and would not have in any way affected the
researcher in gathering information about adequacy of TLR and FDSE policy in
their schools.

32
4.3.2 Head teachers’ and teachers’ academic qualifications
The head teachers and class teachers were asked to indicate their highest academic
qualifications. The data is presented in Table 4.3.
Table 4.3: Distribution of head teachers’ and class teachers’ responses on
academic qualifications
Qualification Head teachers Class teachers
F Percent F Percent
Phd. - - - -
Master of Education 2 33.3 - -
Bachelor of Education 4 66.7 16 88.9
Diploma of Education - - 2 11.1
Total 6 100 18 100
Findings indicated that the majority of the head teachers, 4(66.7%), had a bachelor
of education degree while 2(33.3%) had master of education. Although most
teachers, 16(88.9%), had a bachelor of education, 2(11.1%) had diploma of
education. These findings indicate that the head teachers and class teachers in the
district were professionally qualified hence they had the best skills to implement
FDSE and also cope with their teaching tasks. Also the high number of teachers
who had B. Ed level of qualifications was probably due to the fact that most
universities have opened up opportunities for further learning such as school based
33
programmes at an affordable cost. This has provided the diploma teachers with an
opportunity to join the ranks of the B.Ed teachers. Again most of the diploma
teachers training colleges have been upgraded to university campuses and
therefore very few diploma teachers are annually employed by the TSC. None of
the teacher respondents had a master of education degree, probably because a
substantial number of teachers were comfortable with the B.Ed level of
qualification hence do not find the need to pursue masters degrees. This was
perhaps due to the fact that they perceived masters programme to be quite
expensive and time consuming and after all not accompanied by a substantial pay
hike.
34
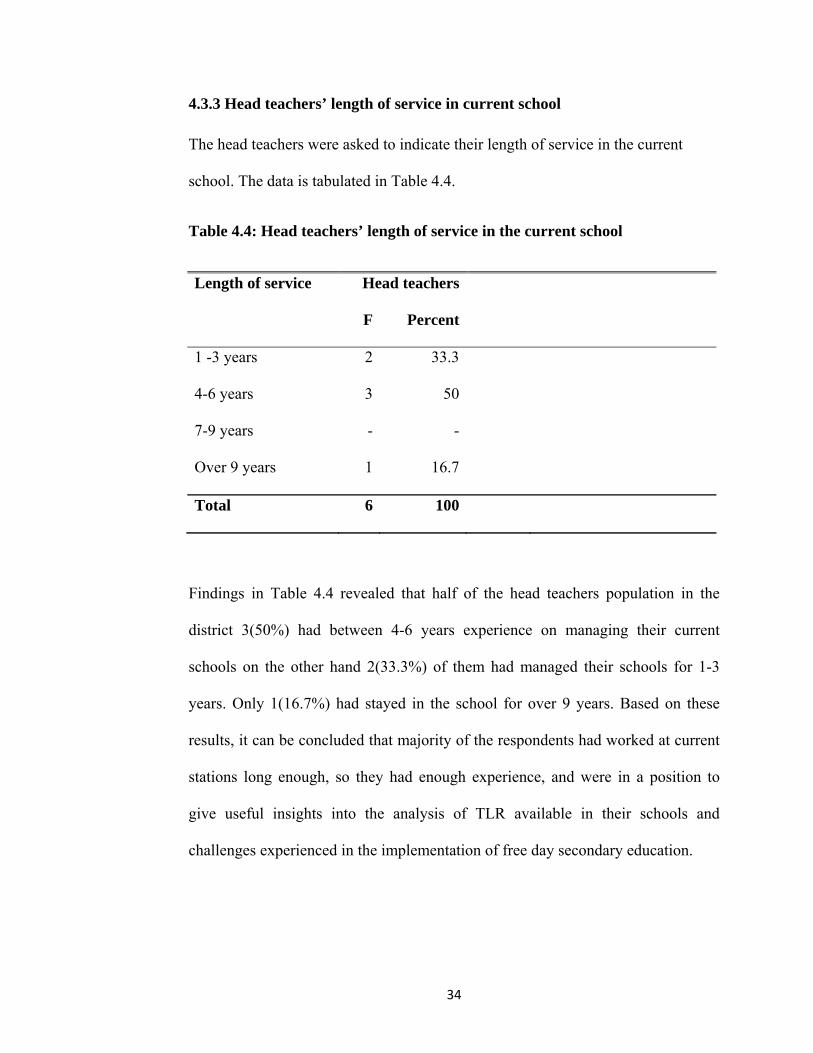
4.3.3 Head teachers’ length of service in current school
The head teachers were asked to indicate their length of service in the current
school. The data is tabulated in Table 4.4.
Table 4.4: Head teachers’ length of service in the current school
Length of service Head teachers
F Percent
1 -3 years 2 33.3
4-6 years 3 50
7-9 years - -
Over 9 years 1 16.7
Total 6 100
Findings in Table 4.4 revealed that half of the head teachers population in the
district 3(50%) had between 4-6 years experience on managing their current
schools on the other hand 2(33.3%) of them had managed their schools for 1-3
years. Only 1(16.7%) had stayed in the school for over 9 years. Based on these
results, it can be concluded that majority of the respondents had worked at current
stations long enough, so they had enough experience, and were in a position to
give useful insights into the analysis of TLR available in their schools and
challenges experienced in the implementation of free day secondary education.

35
4.3.4 Teachers’ length of service
Teachers were asked to indicate their length of service. The findings are shown in
figure figure 4.1
Figure 4.1: Teachers’ length of service
Figure 4.1 indicates that the majority of teachers 10(55.6%) had a teaching
experience of 0-5 years; this was followed by 4(22.2%) who had over 15 years,
3(16.7%) had 11-15 years and only 1(5. 6%) had 6-10 years teaching experience.
This indicates that the teachers had ample work experience to handle their teaching
tasks effectively.

36
4.3.5 Teachers’ teaching subjects
The teachers were asked to indicate their teaching subjects. The findings are
shown in figure 4.2.
Figure 4.2: Distribution of teachers’ teaching subjects
Figure 4.2 indicated that there were more science teacher respondents 8(44.4%),
followed by languages 4(22.2%). Humanities and technicals accounted for
3(16.7%) each. This trend depicts the current status of most schools putting more
emphasis in science subjects as compared to humanities; hence a probable
contributory factor to low mean scores since high grades are obtained by an
aggregate of all grades obtained across all the subjects.
37
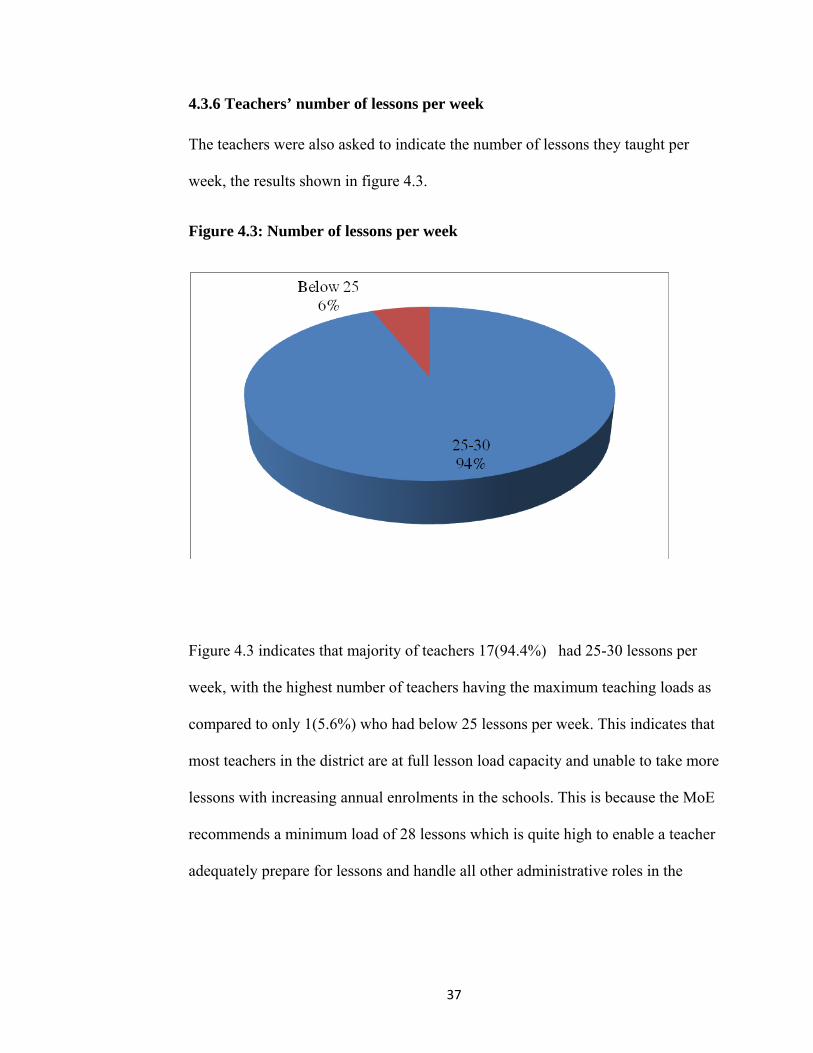
4.3.6 Teachers’ number of lessons per week
The teachers were also asked to indicate the number of lessons they taught per
week, the results shown in figure 4.3.
Figure 4.3: Number of lessons per week
Figure 4.3 indicates that majority of teachers 17(94.4%) had 25-30 lessons per
week, with the highest number of teachers having the maximum teaching loads as
compared to only 1(5.6%) who had below 25 lessons per week. This indicates that
most teachers in the district are at full lesson load capacity and unable to take more
lessons with increasing annual enrolments in the schools. This is because the MoE
recommends a minimum load of 28 lessons which is quite high to enable a teacher
adequately prepare for lessons and handle all other administrative roles in the

38
school, this may explain why head teachers have decided to employ teachers under
BOM, so that teachers workload is reduced to a maximum of 30.
4.3.7 Students’ age distribution
The students were asked to indicate their ages, their age distribution shown in
figure 4.4.
Figure 4.4: Students’ age distribution
The findings in figure 4.4 revealed that, 208(86.6%) of the students were aged
between 17-20 years, which is the appropriate average age of form three students.
The study targeted form three students since their age and duration was deemed
appropriate for the study since form three students had stayed long enough in the
schools hence were able to provide accurate information necessary for the study.
Other students, 26(10.8%) were aged between 13-16 years could have probably

39
started schooling at an earlier age than recommended and 6(2.6%) were aged
between 21-24 years, who probably repeated classes, started schooling late or
dropped out of school at a certain level of education before resuming hence
variation in their ages.
4.3.8 Students’ duration in the current school
The students were asked to indicate their duration in the current school, the
findings are shown in Table 4.5.
Table 4.5: Students’ duration in the current school
Number of years F Percent
3 years 234 97.5
4 years 6 2.5
Total 240 100
The study sought to establish the duration the students had spent in their current
schools, from the findings in Table 4.5. Majority of the form three students
234(97.5%) had spent 3 years in their current school, only 6(2.5%) of the rest of
the respondents had spent four years in their current school, the latter could be
attributed to students who might have repeated classes due to poor performance or
dropped out of school and rejoined hence stayed for four years hence taking
longer period in school.

40
4.3.9 Number of streams in schools
The head teachers were asked to indicate the number of streams of their schools,
the data is as shown in figure 4.5
Figure 4.5: Number of streams
Figure 4.5 indicates that majority 4(66.6%) of FDSS have three and above
streams, one and two streamed schools account for 16.7% each. These findings
depict rapid expansion as a result of increased enrolment; thereby schools have
large number of streams. The one and two streamed schools are new and were just
established.

41
4.3.10 Average number of students per class
The head teachers were asked to indicate the average number of students per class,
the findings shown in figure 4.6
Figure 4.6: Average number of students per class
Figure 4.6 indicates that majority of the schools 4(66.7%) have above 50 students
per class. The MoE recommends 35-40 students per class, this implies classrooms
in the district are overpopulated with up to above 50 students per class. This
depicted the rapid expansion of FDSE as a result of annual increase of enrolment
rates due to increased transition rates from primary schools as a result of FPE.
None of the schools meet the policy directive of 35-40 students per class since the
rest of the schools 2(33.35) accommodate 41-50 students per class.
42
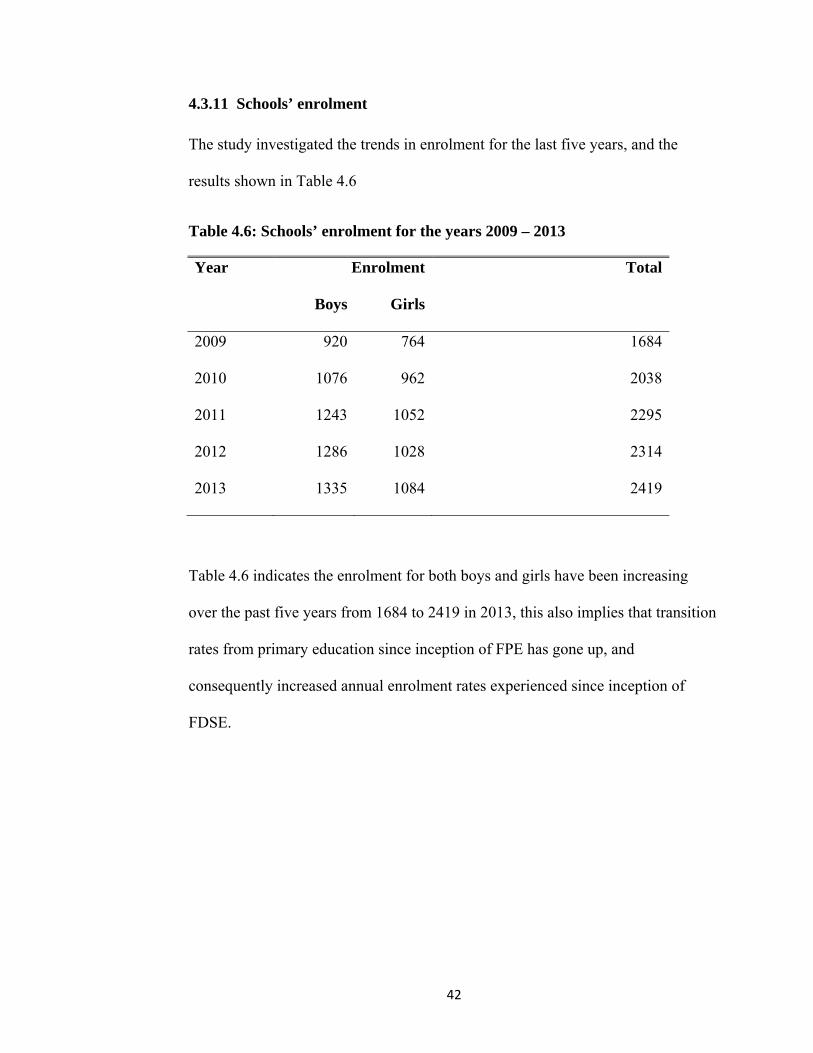
4.3.11 Schools’ enrolment
The study investigated the trends in enrolment for the last five years, and the
results shown in Table 4.6
Table 4.6: Schools’ enrolment for the years 2009 – 2013
Year Enrolment Total
Boys Girls
2009 920 764 1684
2010 1076 962 2038
2011 1243 1052 2295
2012 1286 1028 2314
2013 1335 1084 2419
Table 4.6 indicates the enrolment for both boys and girls have been increasing
over the past five years from 1684 to 2419 in 2013, this also implies that transition
rates from primary education since inception of FPE has gone up, and
consequently increased annual enrolment rates experienced since inception of
FDSE.

43
4.3.12 Schools’ KCSE mean scores (2009-2013)
The head teachers were asked to indicate their school’s mean scores for the last
five years 2009-2013, the data is tabulated in Table 4.7.
Table 4.7: KCSE mean scores for the years 2009 – 2013
KCSE mean
score Rating 2009 2010 2011 2012 2013
Percent Percent Percent Percent Percent
0 to 4.0 Poor 66.7 50 66.7 66.7 66.7
4.1 to 6.0 Fair 33.3 50 33.3 33.3 33.3
6.1 to 9.0 Good - - - - -
9.1 and above Very good - - - - -
Total 100 100 100 100 100
Table 4.7 shows a standard mean grade D+ performance from 2009 to 2013;
however means of 6.1 and above has not been registered by any FDSS in the past
five years. The performance in the district is rated as poor hence the need to look
into the adequacy of TLR in the district and examine the probable influence of the
TLR on students’ KCSE performance.

44
4.4 Influence of availability of TLM on students’ performance in KCSE
To establish the influence of availability of TLM on performance in KCSE in
FDSE, the respondents were asked to respond to statements that sought to answer
the same. This section discusses the responses of the respondents from data
gathered. For example the head teachers and teachers were asked to indicate the
availability of TLM in their schools. Data is presented in Tables 4.8 and 4.9.
Table 4.8: Head teachers’ responses on adequacy of TLM
Availability of TLR Responses (percent)
TLM 5 4 3 2 1
1. Number of reference books 1(16.7) 4(66.6) - 1(16.7) -
2. Number of teachers guide 1(16.7) - 4(66.6) 0(16.7) 1(16.7)
3. Teaching resources such as manilas,
dusters, chalk, models charts, 1(16.7) 3(50) 1(16.7) - 1(16.7)
4. Usage of resource persons 1(16.7) 1(16.7) 3(50) - 1(16.7)
5. Usage of field trips/excursions - - 2(33.3) 3(50) 1(16.7)
6. Usage of computers in teaching - 1(16.7) 2(33.3) 1(16.7) 2(33.3)
7. Number of calculators - 1(16.7) 3(50) 1(16.7) 1(16.7)
8. Books and equipment storage facilities - 1(16.7) 3(50) 2(33.3) -
Legend: 5- strongly agree, 4-agree, 3-neutral, 2-disagree, 1-agree

45
The findings in Table 4.8 show that when the head teachers were asked about the
adequacy of reference books the responses of the head teachers 4(66.6%) indicated
they agreed on their adequacy, this implies the reference books were adequate.
These results indicated that majority of schools in the district have allocated
enough funds towards the purchase of reference books. The head teachers were
neutral on adequacy of teachers’ guides cited by 4(66.6%).This indicated that the
number of teachers’ guides were fairly adequate. The responses on use of
computers by the head teachers indicated that none of the head teachers strongly
agreed on their adequacy. This implied that most schools in the district had not
embraced the use of ICT in teaching, learning and management of schools. This
was probably due to inadequate funds to purchase computers, employ computer
instructors and train teachers. Computers are important instructional aids in the
teaching/learning process. Appropriate use of instructional aids helps keep learners
interested and improves academic performance.
Again when the respondents were asked about the use of calculators in their
schools, 3(50%) of the head teachers were neutral about use of calculators by
students. On the adequacy of books and equipment stores the none of the head
teachers’ strongly agreed on its adequacy, implying there was a gross lack of
books and equipment stores. This was probably brought about by limitations of
funds necessary for construction and the challenge of having trained personnel to
run the stores.

46
Table 4.9: Teachers’ responses on adequacy of TLM
Availability of TLR Responses (percent)
Physical facilities 5 4 3 2 1
1. Number of reference books 2(11.1) 1(5.6) 7(38.9) 7(38.9) 1(5.6)
2. Number of teachers guide 1(5.6) 3(16.7) 7(38.9) 5(27.8) 2(11.1)
3. Teaching resources such as manilas, dusters,
chalk, models, charts, - 7(38.9) 4(22.2) 3(16.7) 4(22.2)
4. Usage of resource persons - 4(22.2) 5(27.8) 6(33.3) 3(16.7)
5. Usage of field trips/excursions 1(5.6) 2(11.1) 1(5.6) 10(55.6) 4(22.2)
6. Usage of computers in teaching 1(5.6) 2(11.1) 5(27.8) 3(16.7) 7(38.9)
7. Number of calculators - 3(16.7) 7(38.9) 2(11.1) 6(33.3)
8. Books and equipment storage facilities 1(5.6) 2(11.1) 4(22.2) 4(22.2) 7(38.9)
Legend: 5- strongly agree, 4-agree, 3-neutral, 2-disagree, 1-agree
The findings in Table 4.9 show that when the teachers were asked about the
adequacy of reference books the responses of the teachers 7(38.9%) were neutral
on adequacy of reference books, this implies the reference books may be fairly
adequate. Reference books are important resources in teaching and learning
because they help in enhancing clarity of content and they give the learners and the
teachers a wider scope. Again the teachers were neutral on adequacy of teachers’
guides cited by 7(38.9%).This indicated that the number of teachers’ guides were
fairly adequate. It is possible that teachers also overlook the importance of the
47
guides, they perhaps rely more on textbooks and reference books in preparation of
their teaching. Lyons (2012) asserts on the importance of instructional materials
in the teaching learning process as facilitates learning of abstract concepts and
ideas and discourage rote learning and helps to stimulate and motivate learners.
The responses on use of computers by the teachers indicated that only 1(5.6%) of
teachers strongly agreed on their adequacy. This implied that most schools in the
district had not embraced the use of ICT in teaching, Appropriate use of
instructional aids helps keep learners interested and improves academic
performance. According to (Nicholls, 2000) exclusively oral teaching cannot be
the key to successful pedagogy. To make the teaching learning process interesting
the teacher has to use instructional aids.
Again when the respondents were asked about the use of calculators in their
schools, 7(38.9%) of teachers were neutral but also 6(33.3%) of teachers strongly
disagreed on their use, this may have indicated that the students who don’t have
calculators may borrow from one another during specific lessons. Therefore it is
apparent that the shortage of this facility may not necessarily be evident in during
lesson time. Calculators are a mandatory requirement in teaching/learning and are
allowed during internal and national examinations since it makes computations
easier, accurate and faster. On the adequacy of books and equipment stores, only
1(5.6%) of the teachers strongly agreed on its adequacy, implying there was a
gross lack of books and equipment stores. Most schools issued books to the

48
learners and collected at the end of the year; consequently, putting up of book
stores was not a priority in most schools.
Textbook : pupil ratio
Further the head teachers were asked to indicate the pupil/ text book ratio in three
compulsory subjects and the results provided in Table 4.10
Table 4.10: Textbook: pupil ratio
Subject Ratio Frequency Percent
Maths 1:01 1 16.7
1:03 5 83.3
English 1:01 1 16.7
1:02 1 16.7
1:03 4 66.7
Kiswahili 1:02 1 16.7
1:03 5 83.3
Table 4.10 indicates that the extent of sharing textbooks is quite minimal in the
three compulsory subjects, with the highest number of students sharing books are
3 at 83.3% in mathematics, 66.7% in English and 83.3% in Kiswahili. A few
schools (2) allocated one book per student in mathematicss and English only.
The findings of the study indicate that the schools investment on text books was
adequate, this probably was due to the fact that the government funding through

49
FDSE policy was channeled to provision of TLM. Also most schools gave priority
to the core subjects, mathematics, English and Kiswahili, maybe because in the
core subjects assignments are given after every lesson. When instructional material
are lacking or inadequate the teaching/ learning process is compromised and this
inevitably is reflected in low academic achievement, high drop out rates, problem
behaviours, poor teacher motivation and unmet educational goals (Hassan, 2000).
Textbooks, set books, teachers’ guides and models are essential in implementation
of the curriculum. Textbooks and set books ensure that students can do their
private reading, complete assignments in time and conduct group discussions.
Textbooks and set books can also be used as reference materials to supplement the
teachers’ instruction. Teachers’ guides give the teachers direction on how to
introduce and deliver content in various subject areas. Models make the lessons
meaningful and enhance students’ understanding of concepts. Existence of
discussion groups means that the students are provided with opportunities to learn
from one another, peer instruction and express themselves and may improve their
academic performance. Inadequacy in use of calculators means that the learners
borrow from one another thus they are slow in completing assignments and some
may end up copying from their classmates. Inadequacy of resources in the library
and agriculture room means that learning gaps may occur in these subject areas
resulting in low mean grades in national examinations. Reference books enhances
the students reading material hence not restricted to a few classroom textbooks

50
thus broaden their knowledge and improve performance. Findings from the study
revealed that TLM are fairly adequate.
4.5 Influence of adequacy of physical facilities on students’ performance in
KCSE
The study investigated several factors that indicate the adequacy of physical
facilities in schools. Some of these factors are: chairs and desks, labs, library,
home science rooms, latrines, dining halls, departmental offices, recreational
facilities, water and power, amongst others. Head teachers and teachers were
served with statements on a scale of 1-5, where 1 represented strongly disagree, 2
disagree, 3 neutral, 4 agree and 5 strongly agree. The statements were meant to
determine the extent of availability of these physical facilities in schools. The head
teachers’ and teachers’ responses are shown in Tables 4.11 and 4.12.
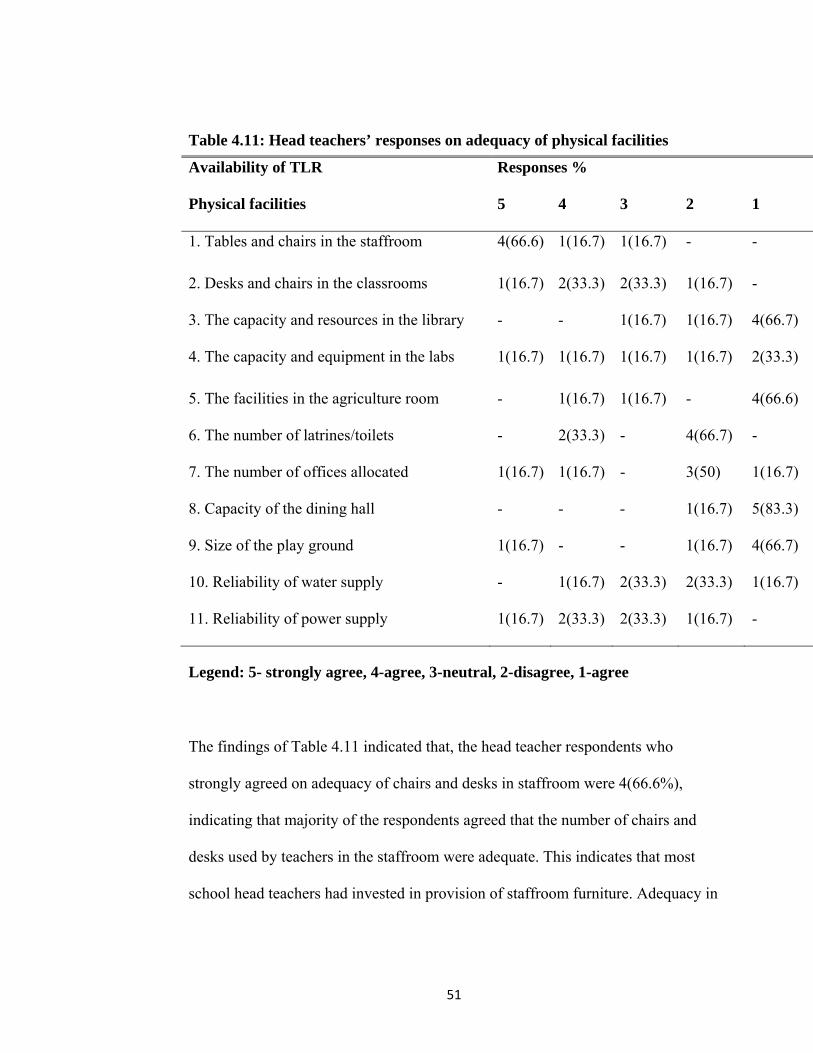
51
Table 4.11: Head teachers’ responses on adequacy of physical facilities
Availability of TLR Responses %
Physical facilities 5 4 3 2 1
1. Tables and chairs in the staffroom 4(66.6) 1(16.7) 1(16.7) - -
2. Desks and chairs in the classrooms 1(16.7) 2(33.3) 2(33.3) 1(16.7) -
3. The capacity and resources in the library - - 1(16.7) 1(16.7) 4(66.7)
4. The capacity and equipment in the labs 1(16.7) 1(16.7) 1(16.7) 1(16.7) 2(33.3)
5. The facilities in the agriculture room - 1(16.7) 1(16.7) - 4(66.6)
6. The number of latrines/toilets - 2(33.3) - 4(66.7) -
7. The number of offices allocated 1(16.7) 1(16.7) - 3(50) 1(16.7)
8. Capacity of the dining hall - - - 1(16.7) 5(83.3)
9. Size of the play ground 1(16.7) - - 1(16.7) 4(66.7)
10. Reliability of water supply - 1(16.7) 2(33.3) 2(33.3) 1(16.7)
11. Reliability of power supply 1(16.7) 2(33.3) 2(33.3) 1(16.7) -
Legend: 5- strongly agree, 4-agree, 3-neutral, 2-disagree, 1-agree
The findings of Table 4.11 indicated that, the head teacher respondents who
strongly agreed on adequacy of chairs and desks in staffroom were 4(66.6%),
indicating that majority of the respondents agreed that the number of chairs and
desks used by teachers in the staffroom were adequate. This indicates that most
school head teachers had invested in provision of staffroom furniture. Adequacy in

52
staffroom furniture means that the teachers are comfortable and can better prepare
for lessons.
When asked about the adequacy of chairs and desks in classrooms, only 1(16.7%)
of the head teachers strongly agreed on their adequacy. These results indicated that
the schools had not given priority to the comfort of learners which is essential for
good academic performance. The findings on adequacy of capacity and resources
in library from the head teachers indicated that most schools had invested little in
development of their libraries, this is cited by 4(66.7%) of head teachers . This
indicated that schools lacked a variety of textbooks and other reading materials,
perhaps schools only purchased recommended course books only which were kept
in the custody of the students. On adequacy of capacity and equipment in the
laboratory, agriculture room the head teachers responses indicated that most
schools did not allocate enough resources to equip their laboratories, cited by
2(33.3%) of head teachers who strongly disagreed. Agriculture rooms were also
depicted to be ill equipped cited by 4(66.6%) of head teachers who strongly
disagreed on their adequacy. This was probably because laboratory equipment,
agriculture room facilities are expensive and are required in large quantities since
the two areas of study are taken by a large number of students. The study
investigated the adequacy of latrines/toilets, capacity of dining hall, water supply
and power supply to schools. All the head teachers strongly agreed that the
latrines/ toilets are inadequate, and 3(50%) of head teachers strongly disagreed
that the offices allocated are adequate and 5(83.3%) strongly disagreed on the

53
adequacy of the dining hall capacity, these responses for the head teachers
indicated that the schools did not prioritize issues that seemed not to be directly
related to tuition. The increased enrolment could be resulting in congestion and
thus straining these facilities. Again the cost of putting up these facilities is met by
the parents, who are sometimes economically handicapped. Consequently
expansion and renovation of these facilities is somehow neglected. According to
Padmanabhan (2001), there exists a close relationship between the physical
environment and academic performance of students and observed that the quality
of education that students receive bears direct relevance to the availability or lack
thereof of physical facilities.
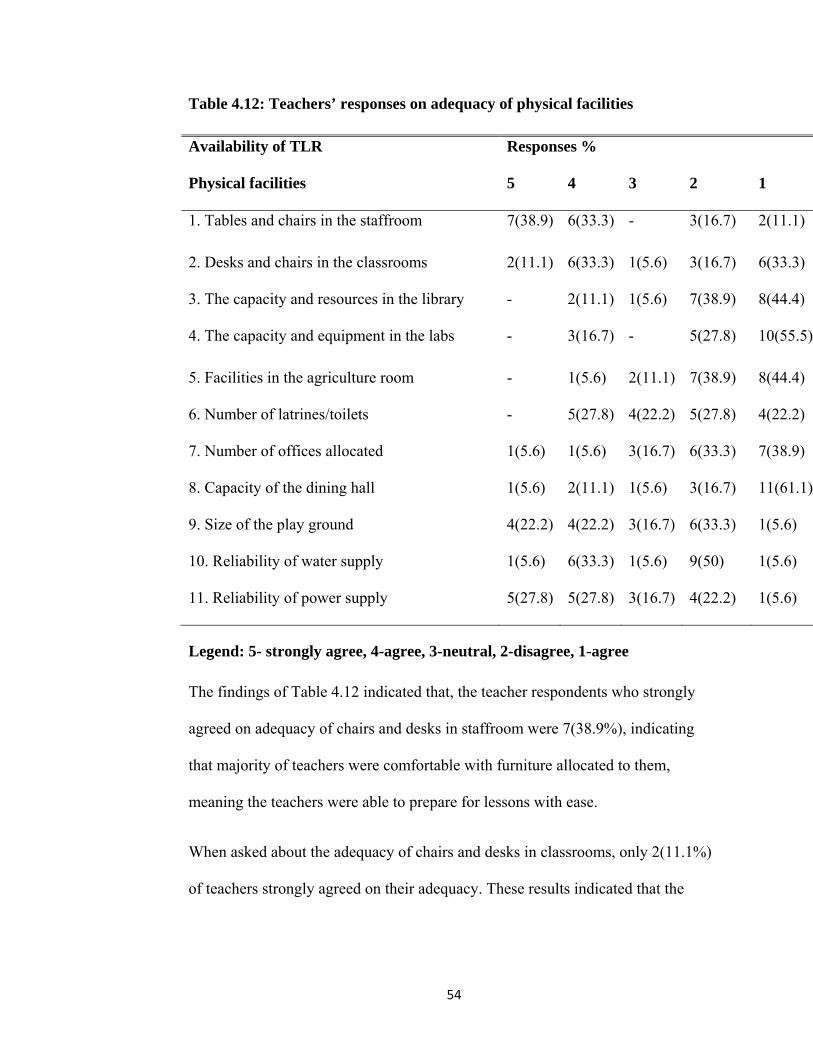
54
Table 4.12: Teachers’ responses on adequacy of physical facilities
Availability of TLR Responses %
Physical facilities 5 4 3 2 1
1. Tables and chairs in the staffroom 7(38.9) 6(33.3) - 3(16.7) 2(11.1)
2. Desks and chairs in the classrooms 2(11.1) 6(33.3) 1(5.6) 3(16.7) 6(33.3)
3. The capacity and resources in the library - 2(11.1) 1(5.6) 7(38.9) 8(44.4)
4. The capacity and equipment in the labs - 3(16.7) - 5(27.8) 10(55.5)
5. Facilities in the agriculture room - 1(5.6) 2(11.1) 7(38.9) 8(44.4)
6. Number of latrines/toilets - 5(27.8) 4(22.2) 5(27.8) 4(22.2)
7. Number of offices allocated 1(5.6) 1(5.6) 3(16.7) 6(33.3) 7(38.9)
8. Capacity of the dining hall 1(5.6) 2(11.1) 1(5.6) 3(16.7) 11(61.1)
9. Size of the play ground 4(22.2) 4(22.2) 3(16.7) 6(33.3) 1(5.6)
10. Reliability of water supply 1(5.6) 6(33.3) 1(5.6) 9(50) 1(5.6)
11. Reliability of power supply 5(27.8) 5(27.8) 3(16.7) 4(22.2) 1(5.6)
Legend: 5- strongly agree, 4-agree, 3-neutral, 2-disagree, 1-agree
The findings of Table 4.12 indicated that, the teacher respondents who strongly
agreed on adequacy of chairs and desks in staffroom were 7(38.9%), indicating
that majority of teachers were comfortable with furniture allocated to them,
meaning the teachers were able to prepare for lessons with ease.
When asked about the adequacy of chairs and desks in classrooms, only 2(11.1%)
of teachers strongly agreed on their adequacy. These results indicated that the
55
schools had not given priority to the comfort of learners, learners who are
uncomfortable easily get bored and tired and hardly concentrated in class. The
research by Cash (1993) on effect of physical facilities on learning found out that
the condition of classroom furniture correlated with students’ achievement at a
significant level hence influences their performance.
The findings on adequacy of capacity and resources in library indicated most
schools had invested little in development of their libraries, this is cited by
8(44.4%) of teachers who strongly disagreed on their adequacy. This is probably
due to the fact that most schools focus more on provision of classroom textbooks
which have a direct relation to the curriculum. Textbooks that are directly related
to the syllabus content are usually issued to the students and only supplementary
reading materials and reference books were provided for in most school libraries.
Pearls (2000) states that although teachers are required to deliver formal teaching
in a classroom, much of the day to day teaching goes on outside the classroom in
the course of interaction between learners and the environment. A well equipped
library can help to enhance teaching and facilitate learning and thus make a shift to
a learner cantered approach.
On adequacy of capacity and equipment in the laboratory, agriculture room the
teachers responses indicated that most schools did not allocate enough resources to
equip their laboratories, cited by 10(55.5) of teachers who strongly disagreed.

56
Agriculture rooms were also depicted to be ill equipped cited by 8(44.4%) of
teachers responses who strongly disagreed on their adequacy. Laboratory,
agriculture rooms provide students with an opportunity to see and make
observation of what they are taught, and that learning takes place best through
discovery exploration and interaction with the internal external environment.
(Oyeniran, 2003). The study investigated the adequacy of latrines/toilets, capacity
of dining hall, water supply and power supply to schools. The teachers strongly
agreed that the latrines/ toilets are inadequate, and 7(38.9%) of teachers strongly
disagreed that the offices allocated are adequate and 11(61.1) strongly disagreed
on the adequacy of the dining hall capacity, these responses for the teachers
indicated that the schools only prioritized on issues directly related to tuition.
Facilities such as water supply, dining hall, latrines/toilets, playground and
recreational facilities more or less address student welfare and therefore their
adequacy was sometimes over looked.

57
Students’ responses on the presence, condition and size of physical facilities Further the students were asked on the presence, condition and size of physical
facilities, as indicated in Tables 4.13 and 4.14.
Table 4.13: Presence of school facilities
School facility Present Absent
F Percent F Percent
Library 60 25 180 75
Laboratories 197 82.1 43 17.9
Classrooms 238 99.2 2 0.8
Agriculture 150 62.5 90 37.5
Dining 43 17.9 197 82.1
Latrines/ toilets 240 100 - -
Playground 195 81.2 45 18.8
The findings reveal that latrines/ toilets are available in all the schools as indicated
by 100% of the student respondents, classrooms, laboratory and playground
facilities are available as indicated by 238(99.2%) and 197(82.1%) and
195(81.2%) respectively. The facilities least available are libraries 60(25%) and
dining facilities 43(17.9%)

58
The students who indicated presence of school facilities were further asked to
indicate the conditions and size of the school facilities. The findings are presented
on Table 4.14.
Table 4.14: Condition and size of school facilities
School facility Condition F % Size F %
Library Good - - Big - -
Fair 24 40 Average 12 20
Poor 36 60 Small 48 80
Total 60 100 Total 60 100
Laboratories Good - - Big - -
Fair 68 34.5 Average 50 25.4
Poor 129 65.5 Small 147 74.6
Total 197 100 Total 197 100
Classrooms Good - - Big - -
Fair 107 45 Average 55 23.1
Poor 131 55 Small 183 76.9
Total 238 100 Total 238 100
Agriculture Good - - Big - -
Fair 53 35.3 Average 30 20
Poor 97 64.7 Small 120 80
Total 150 100 Total 150 100

59
Dining Good ‐ - Big - -
Fair 17 39.5 Average 3 7.0
Poor 26 60.5 Small 40 93
Total 43 100 Total 43 100
Toilets/Latrines Good - - Big - -
Fair 48 20 Average 60 25
Poor 192 80 Small 180 75
Total 240 100 Total 240 100
Playground Good - - Big - -
Fair 98 50.3 Average 80 41
Poor 97 49.7 Small 115 59
Total 195 100 Total 195 100
The findings on Table 4.14 showed that the condition of the school facilities were
generally poor as cited by 36(60%) for libraries,129( 65.5%) laboratories,
131(55%) classrooms, 97(64.7%), agriculture room, 26(60.5%) dining, 192(80%)
toilets, and 97(49.7%) playgrounds. This implies that the government has not
made efforts to improve facilities in the day secondary schools besides FDSE,
further the findings indicate the facilities in the day secondary schools were small,
this was reported by 48(80%) for libraries, 147(74.67%) laboratories, 183(76.9%)
classrooms, 120(80%) agriculture room, 40(93%) dining, 180(75%) toilets, and
115(59%) playgrounds. No physical facility was indicated to be in good condition

60
or big and adequate for the students. This implies that even though physical
facilities like classrooms are present, they are small and do not adequately
accommodate the students.
From the study, the chairs and desks in the staff room were adequate and this
implies that the teachers were comfortable and therefore could stay longer in
school and be available to the students. This could result in a greater
student/teacher interaction and therefore a positive influence on the
teaching/learning process. Capacity of equipments in the laboratory and
agriculture rooms was found to be having a negative influence on the teaching
learning process since they were indicated as inadequate. And consequently inhibit
performance of practical lessons. Individual learners would therefore be ill
prepared to handle practical papers and hence be unable to link theory with
practice. Power supply ensures appropriate lighting, security, use of electrical
equipments such as computers. Reliable power supply ensures timely and adequate
provision of examinations, revision materials and handouts. On the other hand
reliable water supply may enhance sanitation and hygiene in the school
environment and therefore averts infections that would otherwise disrupt the
teaching learning process. Power was determined to be reliable hence would
positively influence performance, while the contrary on water reliability.
Recreational facilities and playfields helps in making the school environment more
interesting, helps to prevent the build up of stress among students as well nurturing
61
talents through co-curricula learning. Inadequacy of physical facilities such as
latrines/toilets, departmental offices, capacity of the dining hall, and size of the
play ground brings about congestion, restricts working and space, poor sanitation
and negatively affect the entire school environment. The use of resource persons
and field excursion helps in varying the teaching/learning approaches and raises
the students’ motivation; unfortunately this is lacked in most schools and may be
contributing to de-motivated students hence low mean scores. Inadequate
computers means that the students and their teachers are not exposed to e-learning
and therefore cannot access the vast electronic library.
4.6 Influence of adequacy of human resources on students’ performance in
KCSE
The study sought to establish the adequacy of teachers employed in the district.
factors such as employment status of teachers, and enrolment for in service
training was used to determine extent of human resource availability in the district.
Average number of teachers employed per school in the district
Head teachers were asked to indicate the employment status of teachers in their
schools, and the averages are tabulated in Table 4.15

62
Table 4.15: Average number of teachers employed per school in the district
Employment status Average No. of teachers
TSC 16
BOM 5
Volunteers 2
Total 23
Table 4.15 indicates that the average number of teachers employed by TSC and
BOM per school is 16 and 5 respectively. There are 2 volunteer teachers on
average per school in the district. These findings indicate that the district is
understaffed hence the BOM intervened by employing more teachers to cater for
the shortage. The ministry of education recommends a minimum of 28 lessons per
teacher per week. The teachers indicated to be teaching 25-30 lessons per week,
meaning the teaching shortage has been eased by the BOMs effort to employ
more teachers to cater for the short fall in various departments. However there may
be glaring imbalances in staffing in the various departments in schools, such that
some departments may be over staffed while others are under staffed. On the
other hand with increasing annual enrolment rates, the government need to plan
and project teacher requirements for schools since currently the burden of paying
teachers under BOM is left to parents under the FDSE program. This gross lack of
teachers may impact negatively on students’ performance.
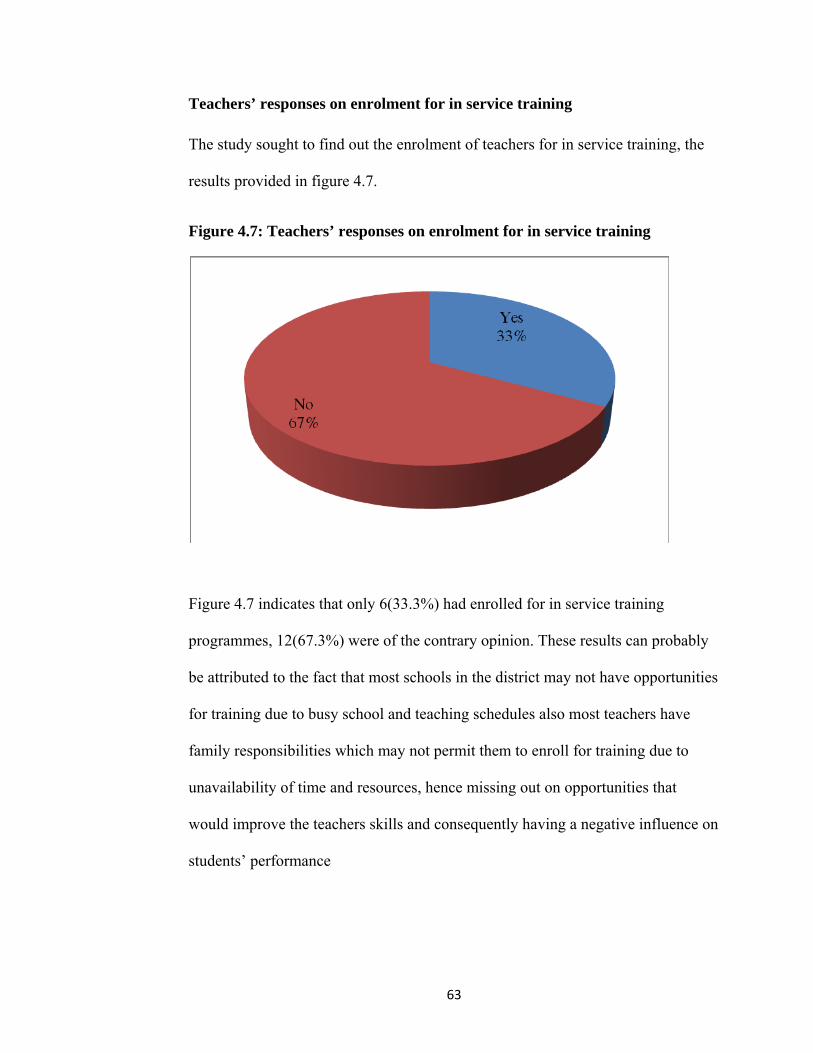
63
Teachers’ responses on enrolment for in service training
The study sought to find out the enrolment of teachers for in service training, the
results provided in figure 4.7.
Figure 4.7: Teachers’ responses on enrolment for in service training
Figure 4.7 indicates that only 6(33.3%) had enrolled for in service training
programmes, 12(67.3%) were of the contrary opinion. These results can probably
be attributed to the fact that most schools in the district may not have opportunities
for training due to busy school and teaching schedules also most teachers have
family responsibilities which may not permit them to enroll for training due to
unavailability of time and resources, hence missing out on opportunities that
would improve the teachers skills and consequently having a negative influence on
students’ performance

64
4.7 Extent of utilization of TLR in FDSE
The study investigated the extent of utilization of resources in schools. This
included all the TLR that is; TLM, physical facilities and human resources
Teachers’ responses on extent of resource utilization
The study investigated the extent of utilization of teaching learning resources in
schools, by being asked whether they made use of the TLR. The teachers were
provided with statements on a rating of 1 to 5. Such that 1 represented strongly
disagree, 2 disagree, 3 neutral, 4 agree and 5 strongly agree. The percentages of
these responses were computed and are provided in Table 4.16
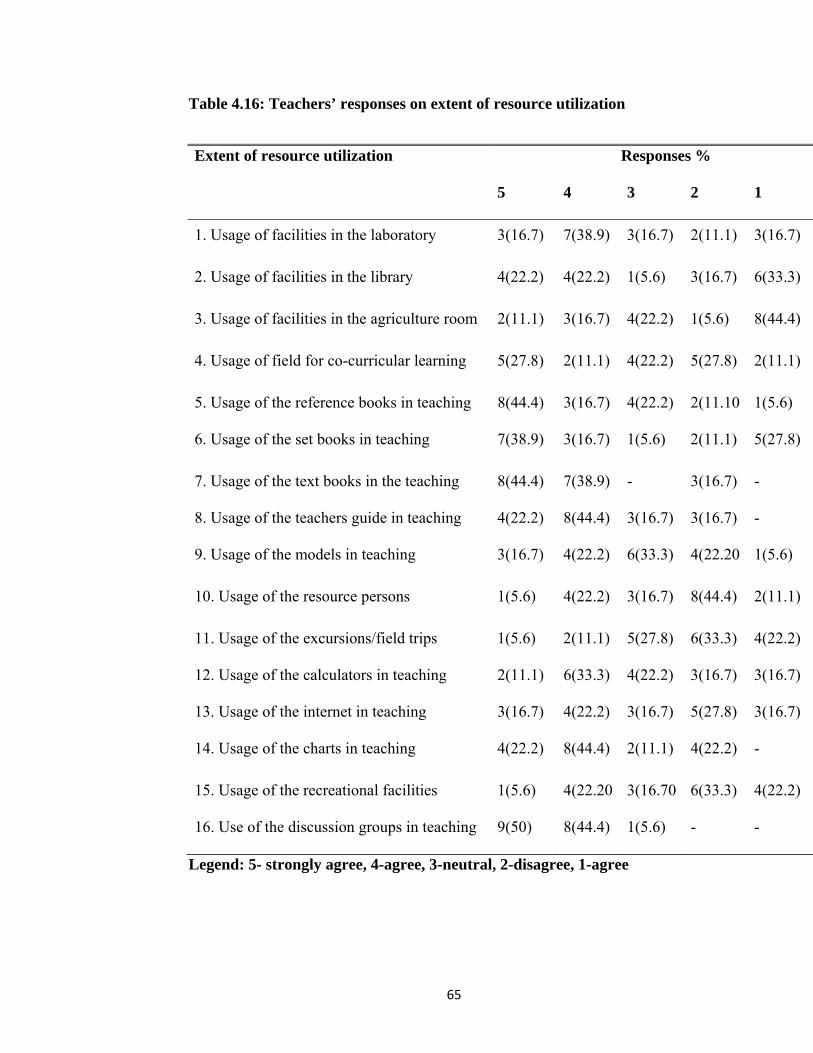
65
Table 4.16: Teachers’ responses on extent of resource utilization
Extent of resource utilization Responses %
5 4 3 2 1
1. Usage of facilities in the laboratory 3(16.7) 7(38.9) 3(16.7) 2(11.1) 3(16.7)
2. Usage of facilities in the library 4(22.2) 4(22.2) 1(5.6) 3(16.7) 6(33.3)
3. Usage of facilities in the agriculture room 2(11.1) 3(16.7) 4(22.2) 1(5.6) 8(44.4)
4. Usage of field for co-curricular learning 5(27.8) 2(11.1) 4(22.2) 5(27.8) 2(11.1)
5. Usage of the reference books in teaching 8(44.4) 3(16.7) 4(22.2) 2(11.10 1(5.6)
6. Usage of the set books in teaching 7(38.9) 3(16.7) 1(5.6) 2(11.1) 5(27.8)
7. Usage of the text books in the teaching 8(44.4) 7(38.9) - 3(16.7) -
8. Usage of the teachers guide in teaching 4(22.2) 8(44.4) 3(16.7) 3(16.7) -
9. Usage of the models in teaching 3(16.7) 4(22.2) 6(33.3) 4(22.20 1(5.6)
10. Usage of the resource persons 1(5.6) 4(22.2) 3(16.7) 8(44.4) 2(11.1)
11. Usage of the excursions/field trips 1(5.6) 2(11.1) 5(27.8) 6(33.3) 4(22.2)
12. Usage of the calculators in teaching 2(11.1) 6(33.3) 4(22.2) 3(16.7) 3(16.7)
13. Usage of the internet in teaching 3(16.7) 4(22.2) 3(16.7) 5(27.8) 3(16.7)
14. Usage of the charts in teaching 4(22.2) 8(44.4) 2(11.1) 4(22.2) -
15. Usage of the recreational facilities 1(5.6) 4(22.20 3(16.70 6(33.3) 4(22.2)
16. Use of the discussion groups in teaching 9(50) 8(44.4) 1(5.6) - -
Legend: 5- strongly agree, 4-agree, 3-neutral, 2-disagree, 1-agree
66
Table 4.16 indicated that teacher respondents strongly agreed on the use of the
following; 8(44.4%) used textbooks in teaching, 7(38.9%) used set books,
8(44.4%) used reference books, 9(50%) used discussion groups; Books, set books,
textbooks, teachers’ guides, models, calculators, charts and teaching aids, are an
essential requirement for coverage of the syllabus in preparation for national
examinations. They also enhance revision and completion of assignments.
Therefore academic achievement cannot be attained unless there is proper and
extensive use of these books. Only 7(38.9%) agreed on use of laboratory facilities,
8(44.4%) on use of teachers’ guides, 6(33.3%) on use of calculators and
8(44.4%) used charts.
Thirty three percent strongly disagreed on using library facilities, 8(44.4%) as well
on use of agriculture room, 27.8% disagreed on the use of playfield, and
5(27.8%) disagreed to be using internet in teaching and learning, these teachers
responses indicate that there was minimal use of these facilities. This implies that
text books are widely used in teaching and learning in FDSS.
The dismal use of facilities in the laboratory, agriculture room and computer room
may be attributed to the fact that these rooms are poorly equipped and therefore
teachers may find them to have little relevance in improving the mode of lesson
delivery. Again most schools have put their priorities in purchase of textbooks, set
books and teachers’ guides at the expense of other instructional materials. Grant
(1978) asserts that teaching and learning cannot be effective without adequate and
relevant use of instructional materials. According to Abimbade (1997)

67
instructional resources in teaching and learning make students to learn more and
retain better what they have been taught and that it also promotes and sustains
students’ interest. It also allows the learners to discover themselves and their
abilities and consequently provides them with an opportunity to realize their full
potential.
The study investigated the extent of use of resource persons. The responses of the
teachers were 8(44.4 %) disagreed on use of resource persons. In schools,
resources persons usually included KCSE examiners, motivational speakers and
counsellors. The examiners equip the learners with skills to answer questions in
national examinations while the motivational speakers are largely meant to guide
the students on methods of study, developmental challenges, discipline, drug and
substance abuse, relationships, among others. Resource persons play a key role in
helping schools achieve their goals, in particular academic achievement.
On the extent of use of excursion/field trip the study found out that the responses
of the teachers were 6(33.3%) disagreed on use of field trips and recreational
facilities. This could be partly due to the fact that most schools do not have buses;
hence excursions would entail hiring some means of transport which would be too
expensive. The high cost of fuel witnessed in the past few years is also making
travelling expensive even for those schools that own buses or vans. Excursions and
field trips involve a lot of time in terms of preparation and actual study which may
interfere with the formal school timetable. Excursions and field trips enhance

68
learning because they make classroom learning real and break monotony and
create interest. This agrees with the findings of Oyeniran (2003) who observed that
students learn best if they are given the opportunity to see and to make observation
of what they are taught.
The responses on the frequent use of discussion groups by the teachers was
9(50%) of the teachers strongly agreed. Discussion groups encourage interaction,
peer teaching and development of students social skills. They are therefore a very
important component in the teaching learning process. It is encouraging that most
schools have embraced this approach in their instruction. Abimbade (1997)
observes that discussion groups allows the learners to discover themselves and
their abilities and consequently provides them with an opportunity to realize their
full potential. The study sought to investigate the extent of use playfields and
recreational facilities in schools. The responses for the use of playfields were
neutral indicating the respondents agreed that they use the facilities to enhance co-
curricular learning. The percentages of teachers who strongly agreed and disagreed
were 27.8%. Recreation facilities and field events are important to a school
because they help to nurture talent, develop social skills, reduce stress and as
whole help in development of an all rounded learner. However these results
indicate that although schools are putting a lot of emphasis in the playfield
activities little emphasis is being put in other recreational facilities. This could be
due to the fact that field activities are a requirement of the ministry of education,
69
PE lesson is provided for in the time table, field events help in marketing the
school and students are actually charged levies for field activities. On the other
hand recreational events within the school are left to the individual schools to
decide and allocate funds. Perhaps this is the reason why recreational events are
seemingly neglected as well in most schools.

70
CHAPTER FIVE
SUMMARY OF THE STUDY, CONCLUSION AND
RECOMMENDATIONS
5.1 Introduction
This chapter presents the summary of the findings of the study, conclusions and
recommendations arrived at. It also gives suggestions for further studies.
5.2 Summary of the study
The study was to assess the influence of TLR on students’ performance in KCSE
in FDSE in Embakasi District, Nairobi County, Kenya. The research objectives
were: To determine how availability of teaching and learning materials used in
FDSS in Embakasi district affect students’ performance in KCSE, to establish how
adequacy of physical facilities influence students’ performance in KCSE in
Embakasi district., to establish how adequacy of human resource influence
students’ performance in KCSE in FDSE in Embakasi district and to assess extent
of resource utilization and its effect on students’ performance in KCSE in FDSE
in Embakasi district.
The study employed descriptive research design. The target population included
head teachers, class teachers and students in the entire Embakasi District. The
sample size consisted of a total of 264 respondents; 6 head teachers, 18 class
teachers and 240 students. The researcher employed self administered

71
questionnaires to gather data for the study. There were three sets of questionnaires;
head teachers, class teachers and students. Findings revealed that;
FDSE has improved student enrollment in the schools, this is seen in the steady
increase in enrolment rates over the past five years, and has also increased
provision and adequacy of TLR in the schools as reported by the majority
5(83.3%) of head teachers.
The findings revealed that latrines/ toilets are available in all the schools as
indicated by 100% of the head teachers, teachers and students. Classrooms,
laboratory and playground facilities are available as indicated by 238(99.2%),
197(82.1%) and 195(81.2%) respectively by the student respondents. The facilities
least available are libraries cited by 60(25%) and dining facilities cited by
43(17.9%), the findings implies that FDSE has contributed to an overstretch on the
school facilities. Although some schools have facilities such as libraries,
laboratories and classes, most of these facilities are regarded as either small and in
poor condition for all the physical facilities. The researcher observed that even
though some facilities like classrooms and laboratories existed they were small
and ill equipped to appropriately serve the purposes for which they were built.
The study established that the chairs and tables for teachers in schools were
adequate. The respondents who strongly agreed on adequacy of chairs and tables
in the staffroom were 4(66.6%) for the head teachers and 7(38.9%) for the
72
teachers, indicating that majority of the respondents agreed that the number of
chairs and tables were adequate. When asked about the adequacy of chairs and
desks in the classrooms, only 1(16.7%) of the head teachers and 2(11.1%) of the
teacher respondents strongly agreed on their adequacy, implying the desks in
school are not enough for the learners. On capacity and equipment in the
laboratory and agriculture room the head teachers and teachers who strongly
agreed on their adequacy were a mere: 1(16.7%) and 0.0% respectively, meaning
the facilities in the laboratories and agriculture rooms are quite inadequate. These
results indicated that the schools did not prioritize issues that seem not to be
directly related to tuition.
A greater proportion of the teachers and students reported that FDSE has affected
syllabus coverage hence contributed to poor performance in the schools. FDSE is a
clear indication to have contributed to congestion in the day secondary schools.
Majority of the students cited missed examinations as a result of lack of school
fees, 158(65.8%) on the other hand objected that there is improved performance of
students in examinations. The introduction of Free Secondary Education enhanced
students’ access to secondary education. However the increased access was not
commensurate to the number of teachers available in schools.
The study revealed employment of 5 extra teachers as on average per school as
BOM teachers and each school admitting 2 volunteers to help with the teaching
73
workload. This translates to a total of extra 42 teachers in the district not provided
for by FDSE. There was an increase in teachers’ workloads as a result of free
secondary education. The teachers were not able to do their work adequately due
to high enrolment of students and overcrowded classes. Administration of internal
examinations in the day secondary schools is also seen to be difficult as a result of
increased number of students making most of the schools only being able to sit for
internal examination once in a term.
The study also established that most teachers in the district had degree level of
academic qualification and only a few teachers had enrolled for in-service training.
4(66.7%) and 16(88.9%) of the head teacher and teacher respondents had B.Ed
level of education, none of the teacher respondents had masters level of education,
but only 2(33.3%) of head teachers. The diploma level of education had only
2(11.1%) of the teacher respondents. The research found that only 6(33.3%) of
teachers had enrolled for in-service training programmes, 12(66.7%) were of the
contrary opinion, indicating that most teachers were missing out on trainings that
would boost their performance hence boost students performance as well.
An analysis into the teaching and learning materials imply that majority of the
teacher respondents strongly agreed that TLM were adequate except for reference
guides, use of field trips, resource persons, and use of computers in teaching and
learning. This was corroborated by 3(50%) of head teachers who agreed that

74
teaching materials such as manilas and chalk were adequate, agreed on adequacy
of teachers guides and reference books and were neutral on use of field trips and
use of computers for teaching and learning.
TLR are of no use unless effectively utilized, the study shows that teacher
respondents strongly agreed on the use of the available TLM especially 8(44.4%)
used textbooks in teaching, 7(38.9%) used set books, 8(44.4%) used reference
books, 9(50%) used discussion groups; Only 7(38.9%) agreed on use of laboratory
facilities, 8(44.4%) on use of teachers’ guides, 6(33.3%) on use of calculators and
8(44.4%) used charts. Although the teachers disagreed to use certain facilities
which the study found out to be unavailable in most schools, they include facilities
in the libraries, agriculture room, disagreed on use of playfield, resource persons,
field trips, internet and recreational facilities.
5.3 Conclusion
From this study it is clear that FDSE is a fruitful and worthy programme since has
increased access to secondary education to most students who miss opportunities
in boarding secondary schools. From the study it’s also clear that TLM are
available, except physical facilities are inadequate, small and in poor condition,
inadequate recreational facilities and gross lack of human resources. An analysis
of physical facilities shows an over stretch. Teachers further indicated that
75
facilities had a negative influence on performance of students in KCSE. Teaching
and learning materials tend to be adequate and minimally shared especially in the
compulsory subjects, human resources is also a serious concern, since enrolment
in the schools increase yearly leading to inadequate curriculum supervision and
implementation in schools. The study also established that the funds released by
the government to finance free secondary education were inadequate, and was also
not released on time, cited by 4(66.7%) of the schools head teacher respondents
forcing schools to procure goods on credit or shelve some projects and this
resulted to charging levies on parents to meet purchase of certain school resources.
5.4 Recommendations
Based on the findings, analysis and conclusions of the study, the following
recommendations were made;
The government should allocate more funds to equip physical facilities in schools
which are either inadequate or completely lacking, also more funds should be
allocated to equip schools with resource persons, field trips and excursions,
internet facilities and recreational facilities, to avert charging parents levies for
these resources. Also specific subject rooms like agriculture room including
laboratories should be equipped to enhance effective teaching and learning.
TSC should employ more teachers to cater for the enormous teacher shortage, in
service training programmes should also be initiated to address manpower needs
as a result of changing times to enable teachers embrace use and access to
76
computers and the internet and provision of e-materials. Where the internet is
unavailable, unreliable or unaffordable, the development of local school networks
and the provision of e-materials to schools on compact disks (CDs/ flash disks can
support e-learning via school servers and networks.
The directorate of quality Assurance and Standards within the ministry of
education should be more empowered with resources to enable them carry out
their advisory work more effectively in schools. It is expected that their regular
visits to school would be beneficial to schools as through their guidance schools
would be able to maintain the expected standards for effective learning to take
place, this would assist principals as well to ensure all TLR are utilized effectively
Head teachers should involve all education stakeholders to aid in school
development programmes and projects. The schools should also initiate income
generating projects to subsidize government funding.
The researcher recommends that the government should build more schools to
meet the rising yearly enrolment surges to avoid overcrowding of physical
facilities, stretch of teaching and learning materials and overworking of available
teachers which in turn would compromise the quality of FDSE.
Motivational programs should be put in place for schools managers, teachers and
students so as to encourage them and maintain their focus on their roles and
contribution towards effective and efficient education programmes.

77
5.5 Areas for further research The researcher suggests that;
i. The study was conducted in Nairobi County, a similar study should be
done in other counties to establish status of TLR vis a vis performance, and
study also extended to boarding schools.
ii. A study can be conducted on methods of improvising TLM and models in
schools
iii. A study on Integration of ICT and e-learning to complement human
resources

78
REFERENCES Adan, M. (2011). Challenges faced by head teachers in implementing FDSE in
Wajir district Kenya. Unpublished M.Ed Thesis. University of Nairobi.
Afolabi, S.O. (2005). Statistical tools and models for educational planners.
Ilorin:Integrity publications
Adeogun, A.A. (2001). The principal and the financial management of public secondary schools in Osun State. Journal of Educational System and Development. 5(1), pp.1 - 10.
Ambogo, M.M. (2012). Relationship between availability of Teaching and
Learning Resources and performance in Eldoret district. Moi University. Scholarlink research institute journals. (SRIJ)
DFID (2007) in, Bontoux V and Buchan A (2007) Secondary Textbook and School
Library Provision in Sub-Saharan Africa: A Review based on 19 National Case Studies World Bank, Washington ( www.worldbank.org )
DFID in , Denning C and Bontoux V (Eds) 2001 Upgrading Book Distribution in
Africa. ADEA Working Group on Books and Learning Materials, Paris
FDSE (2014, July 8th). Nation newspaper. Nairobi: Nation Media Group. Gatende, A. (2010). Youth and Education in Kenya. Institute of Economic Affairs. Gay, G. (1992). The State of Multi-Cultural Educational Opportunity; 1996 Report Kamunge report (1988). The report on the presidential working party on education
and manpower training for the next decade and beyond. Nairobi: Government printer.
79
Kenya National Examination Council. (2013). Kenya Certificate of Secondary
Education 2013 Candidates Performance Report, Nairobi.
Kombo, K. & Tromp, A. (2005). Proposal & thesis writing. Makuyu: Don Bosco
printing press.
Krishnaswami, O. R. (2001). Methodology of research in social science, Himalaya
Mumbai, Himalaya publishing House. Likoko, S. Mutsotso, S. & Nasongo, J. (2013). Adequacy of instructional materials
and physical facilities and their effect on quality of teacher preparation in colleges in Bungoma county. International journal of science and research (IJSR)
Lyons, A. (2012) Workers of tomorrow, Education in progress,Ministry of
Education and Scientific Research. Port Fortis: Fiji.
Maicibi,N.A. (2003). Human Resource Management Success. Kampala.Net Media Publication. Ltd. UgandaMakau 1986
Mbaria, F. (2006). Relationship between learning resources and performance in
secondary schools in Ndaragwa district. Unpublished PGDE Project. University of Nairobi.
Ministry of Education Science and Technology; Republic of Kenya; Kenya Education Sector Support Programme, 2005-2010. Nairobi.
Mugenda O.M and Mugenda A.G (2003), Research Methods, Quantitative and
Qualitative Approaches. ACTS: NAIROBI.
Mulusa, T. (1988). Evaluating education, community and development
programmes. Nairobi: University of Nairobi.

80
Mwiria, K.( 1985) The Harambee School Movement: A historical perspective.
Unpublished Ph. D Thesis, University of Wisconsin.
Nachmias, F. C & Nachmias, D (2009) Research methods in the social sciences.
London. St. Martin’s press, Inc.
Orodho A. (2009), Essential of Education and Social Science Research Methods.
Masola Publishers, Kenya.
Oyeniran, J.O. (2003) Teaching methods. An introduction to principles and methods of teaching.
Padmanabhan, Y. (2001). Internal efficiency in primary education http//www.sterioso41188eci.htm
Republic of Kenya (2005), EFA, Global Monitoring Report: Making Primary Education Affordable. UNESCO.
The World Bank, (July 2013) Service Delivery Indicators- Education and Health
services in Kenya. Data for results and Accountability
UNESCO, (2007), Education for all by 2015 will we make it? Oxford University Press, Paris
UNESCO, (2008). Challenges of implementing free day secondary education in Kenya. Experiences from district. Nairobi: UNESCO.

81
APPENDICES
Appendix I: Letter of introduction to respondents Joyce Atieno Akungu,
University of Nairobi,
P.O. Box 30197,
NAIROBI.
Dear Respondents,
RE: RESEARCH PROJECT FOR A POSTGRADUATE DEGREE
PROGRAMME
I am a postgraduate student pursuing a Master’s degree in Educational
Administration and Planning at the University of Nairobi. I am conducting a
research for my final year project, which is a requirement of the degree
programme.
This questionnaire is designed to gather information on the influence of teaching
and learning resources on students’ Kenya Certificate of Secondary
Education performance in free day secondary education in Embakasi District.
Your school has been selected to be part of my study sample. Kindly provide
information to all questionnaire items.
All information will be treated with utmost confidentiality.
For this reason DO NOT write your name on this questionnaire.
Thanks in advance
Yours Sincerely,
Joyce Atieno Akungu
E55/72710/2008

82
Appendix II: Questionnaire for head teachers The information given in this questionnaire will be treated with strict
confidentiality.
Instructions
Please tick appropriately in box [ ] corresponding to your choices for structured
questions.
Write the answers to the open ended questions in the spaces provided.
Please tick [ ] the response that most closely approximates your opinion about
the statements for questions consisting of statements scaling 1 to 5 as below.
5 Strongly Agree 4 Agree 3 Neutral 2 Disagree 1 Strongly
Disagree
Section A: Background information
1. Indicate your gender Male [ ] Female [ ]
2. For how long have you served as a head teacher in this school?
Under one year [ ] 1-3 years [ ]
4-6 years [ ] 7-9 years [ ]
Over 9 [ ]
3. What is your highest academic qualification?
P.hD [ ] M. Ed [ ]
B. Ed [ ] B. Sc [ ]
Dip. Ed [ ] Any other, please specify ___
4. Indicate the number of streams in your school
1 [ ] 2 [ ] 3 [ ] above 3 [ ]

83
5. Give the number of teachers in your school as follows
TSC _________ Volunteers ________ B.O.M _______
6. What is the average number of lessons that a teacher in your school is allocated
per week? Below 18 [ ] 19-24 [ ] 25-30 [ ] above 30 [ ]
7. Indicate the enrolment in your school in the following years
Year Enrolment Total Boys Girls 2009 2010 2011 2012 2013

84
Section B: Availability of Resources & School mean score
8. Use (5 Strongly Agree 4 Agree 3 Neutral 2 Disagree 1 Strongly Disagree)
Physical facilities 5 4 3 2 1 1 The number of tables and chairs in the staffroom is adequate 2 The number of desks and chairs in the classrooms are adequate
3 The capacity and resources in the library are adequate for the number of students in the school
4 The capacity and equipment in the laboratory is adequate for the number of students in the school
5 The facilities in the home science/agriculture room are adequate for the number of students in the school
6 The number of latrines/toilets in the school are adequate for the number of students in the school
7 The number of offices allocated are adequate for the departments in the school
8 The capacity of the dining hall is adequate for the number of students in the school
9 The size of the play ground is adequate for the number of students in the school
10 The water supply to the school is reliable 11 The supply of power to the school is reliable
Teaching and learning materials (TLM) 12 The number of reference books in the school are adequate 13 The number of teachers guide in the school are adequate
14 Teaching resources such as manilas, dusters, chalk, models, charts, are adequate
15 Use of resource persons in the school is frequent 16 Use of field trips/excursions in the school is frequent 17 Use of computers in teaching and learning is common 18 Students have adequate number of calculators
19 Books and equipment storage facilities in the school are adequate
9. What are the textbook/pupil ratios for each of the following subjects in your school?
Subject Number of Pupils per text book
Mathematics
English
Kiswahili

85
10. Give the number of students with KCSE mean score in the years provided in
the table below.
Year Mean Index Total
0-4.0 4.1-6.0 6.1-9.0 9.1 and above
2009
2010
2011
2012
2013
Concept of FDSE
11. a) Does the government disburse FDSE funds in time? Yes[ ] No[ ]
b) If Yes, how has it affected your school? ............................................
12. Do you consider FDSE policy to have contributed to adequate provision of
teaching and learning resources? Yes [ ] No [ ]
13. a) Has the provision of FDSE led to increase in provision of teaching and
learning resources? Yes [ ] No [ ]b) If yes, to what extent? …………
14. What is the average number of students per class in your school?
30-40 [ ] 41-50 [ ] above 50 [ ]
15. Do you have any suggestions on the provision of TLR?
.....……………………………………………………………………………
16. Do you think availability of teaching and learning resources (TLR) influences
school performance in KCSE? Yes [ ] No [ ]
(b) If Yes, how…………………………………………………………………
Thank you for your cooperation

86
Appendix III: Questionnaire for teachers The information given in this questionnaire will be treated with strict
confidentiality.
Instructions
Please tick appropriately in box [ ] corresponding to your choices for structured
questions.
Write the answers to the open ended questions in the spaces provided.
Please tick [ ] the response that most closely approximates your opinion about
the statements for questions consisting of statements scaling 1 to 5 as below.
5 Strongly Agree 4 Agree 3 Neutral 2 Disagree 1 Strongly
Disagree
SECTION A: Background Information, Teacher’s Qualifications and
workload Information
1. What is your gender? Male [ ] Female [ ]
2. What are your teaching subjects? Languages [ ] Technicals [ ]
Humanities [ ] Sciences [ ]
3. What is your highest academic qualification?
M.Ed [ ] B.Ed [ ] B. Sc [ ] Dip. Ed [ ] others (specify)…………
4. How many years of teaching experience do you have?
0 – 5 years [ ] 6 – 10 years [ ] 11 – 15 years [ ] Over 15 years [ ]
5. How many lessons do you teach per week? Below 18 [ ] 19-24 [ ]
25-30 [ ] above 30 [ ]
6. (i) Have you ever enrolled in an in service training programme in the past one
year? Yes [ ] No [ ]

87
(ii) If yes, did you find the training relevant to your career? Yes [ ] No [ ]
SECTION B: Availability of Resources
7. Use (5 Strongly Agree 4 Agree 3 Neutral 2 Disagree 1 Strongly Disagree)
Physical facilities 5 4 3 2 1 1 The number of tables and chairs in the staffroom is adequate 2 The number of desks and chairs in the classrooms are adequate
3 The capacity and resources in the library are adequate for the number of students in the school
4 The capacity and equipment in the laboratory is adequate for the number of students in the school
5 The facilities in the home science/agriculture room are adequate for the number of students in the school
6 The number of latrines/toilets in the school are adequate for the number of students in the school
7 The number of offices allocated are adequate for the departments in the school
8 The capacity of the dining hall is adequate for the number of students in the school
9 The size of the play ground is adequate for the number of students in the school
10 The water supply to the school is reliable 11 The supply of power to the school is reliable
Teaching and learning materials (TLM) 12 The number of reference books in the school are adequate 13 The number of teachers guide in the school are adequate
14 Teaching resources such as manilas, dusters, chalk, models, charts, are adequate
15 Use of resource persons in the school is frequent 16 Use of field trips/excursions in the school is frequent 17 Use of computers in teaching and learning is common 18 Students have adequate number of calculators
19 Books and equipment storage facilities in the school are adequate

88
Extent of Resource Utilization
8. Use (5 Strongly Agree 4 Agree 3 Neutral 2 Disagree 1 Strongly
Disagree)
5 4 3 2 1 1 I make use of the facilities in the laboratory in teaching 2 I make use of the facilities in the library in teaching
3 I make use of the facilities in the agriculture/ home science/ computer room in teaching
6 I make use of the play field to enhance co-curricular learning 7 I make use of the reference books in teaching 8 I make use of the set books in my teaching 9 I make use of the text books in the teaching of subjects 10 I make use of the teachers guide in teaching 11 I make use of the models in teaching 12 I make use of the resource persons in teaching 13 I make use of the excursions/field trips in teaching 14 I make use of the calculators in teaching 15 I make use of the internet in teaching 16 I make use of the charts in teaching 17 I make use of the recreational facilities to entertain students 18 I make use of the discussion groups teaching
9. Do you consider FDSE policy to have contributed to adequate provision of
teaching and learning resources? Yes [ ] No [ ]
10. a) Has the provision of FDSE led to increase in provision of teaching and
learning resources? Yes[ ] No[ ] b) If yes, to what extent? ……………
11. Do you have any suggestions on the provision of TLR?
.....……………………………………………………………………………
12. Do you think availability of teaching and learning resources (TLR) influences
school performance in KCSE? Yes [ ] No [ ]
(b) If Yes, how…………………………………………………………………
Thank you for your cooperation
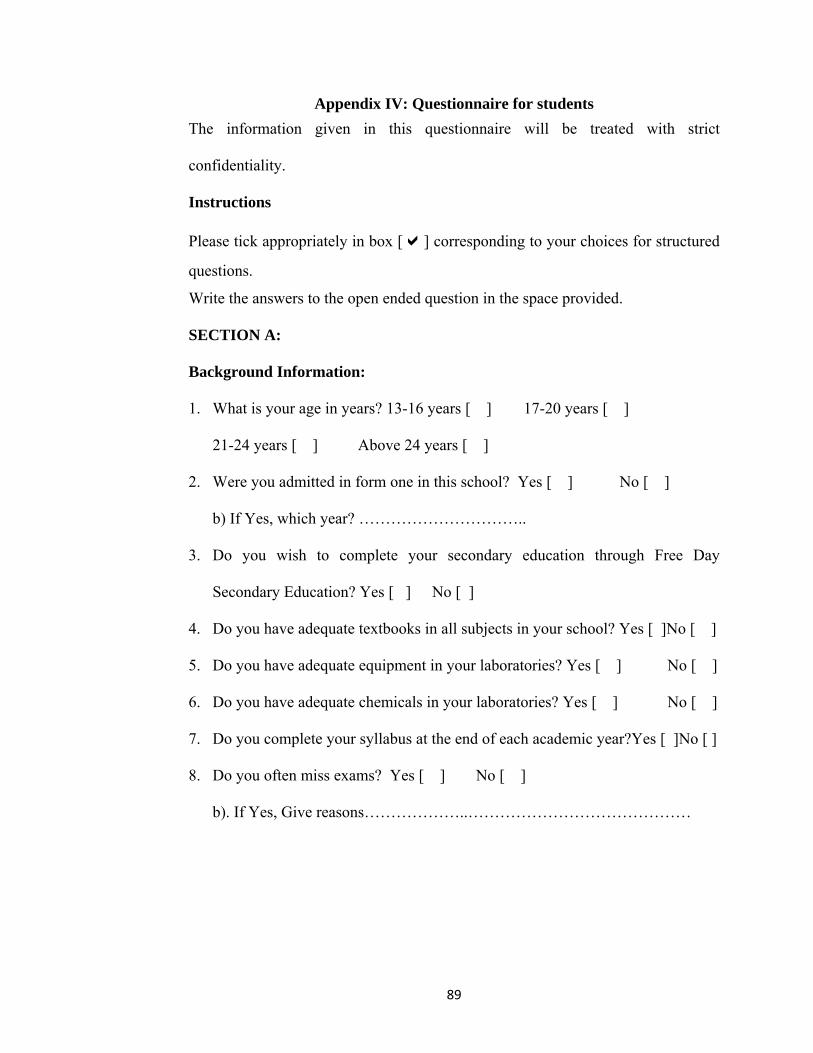
89
Appendix IV: Questionnaire for students The information given in this questionnaire will be treated with strict
confidentiality.
Instructions
Please tick appropriately in box [ ] corresponding to your choices for structured
questions.
Write the answers to the open ended question in the space provided.
SECTION A: Background Information:
1. What is your age in years? 13-16 years [ ] 17-20 years [ ]
21-24 years [ ] Above 24 years [ ]
2. Were you admitted in form one in this school? Yes [ ] No [ ]
b) If Yes, which year? …………………………..
3. Do you wish to complete your secondary education through Free Day
Secondary Education? Yes [ ] No [ ]
4. Do you have adequate textbooks in all subjects in your school? Yes [ ]No [ ]
5. Do you have adequate equipment in your laboratories? Yes [ ] No [ ]
6. Do you have adequate chemicals in your laboratories? Yes [ ] No [ ]
7. Do you complete your syllabus at the end of each academic year?Yes [ ]No [ ]
8. Do you often miss exams? Yes [ ] No [ ]
b). If Yes, Give reasons………………..……………………………………

90
Availability Physical facilities
9. Please indicate the presence, condition and size of the following facilities
Good 1 Fair 2 Poor 3
Big 1 (Accommodate adequately) Average 2 Small 3 (Inadequate)
Item Present Absent Condition Size
Library
Laboratories
Classrooms
Agriculture
Dining
Latrines/ toilets
Playground
10. Is there a provision to consult your teacher after class when you do not fully
understand a concept taught in class? Yes [ ] No [ ]
b). If Yes, how often? Always [ ] Not Always [ ]
11. What grade do you expect in K.C.S.E?
A – B+ [ ] B – C+ [ ] C – D+ [ ] Below D+ [ ]
12. Do you think the provision of FDSE has improved performance of students in
KCSE? Yes [ ] No [ ]
13. Do you think availability of teaching and learning resources influences school
performance in KCSE? Yes [ ] No [ ]
(b) If Yes, how…………………………………………………………………
Thank you for your cooperation

91
Appendix V: Letter of authorization

92
Appendix VI: Research permit