influence of soil factors on vine growth and fruit and wine quality
TRANSCRIPT
Influence of Soil Factors on
Vine Growth
and Fruit and Wine Quality
Jean-Jacques Lambert, PhD
Viticulture and Enology
UC Davis
January 21, 2011
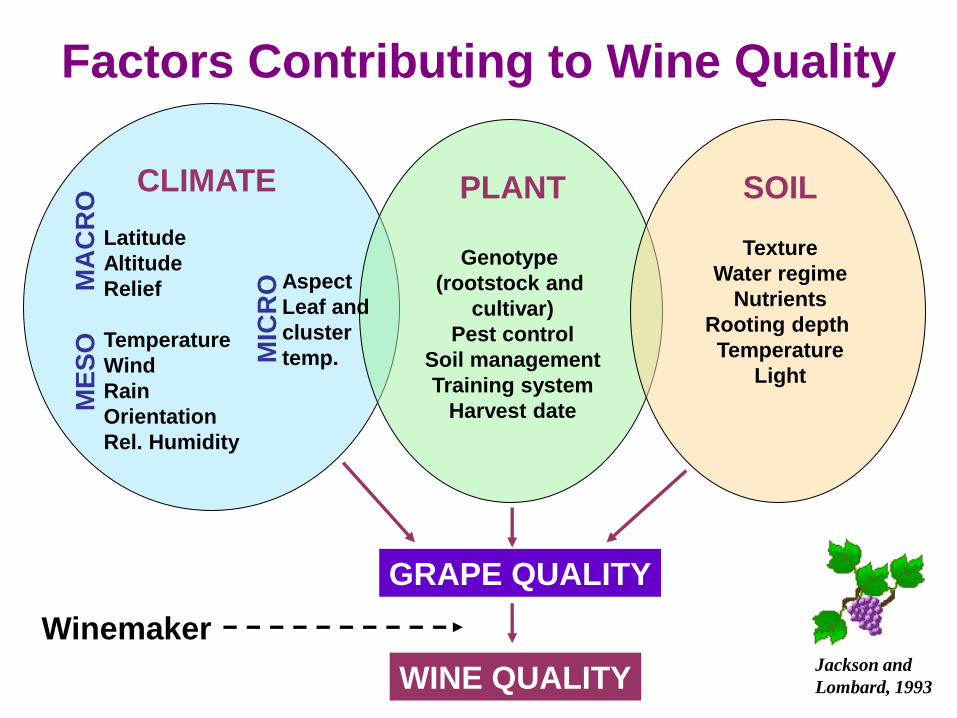
Factors Contributing to Wine Quality
PLANT
Genotype
(rootstock and
cultivar)
Pest control
Soil management
Training system
Harvest date
SOIL
Texture
Water regime
Nutrients
Rooting depth
Temperature
Light
CLIMATE
Latitude
Altitude
Relief
Temperature
Wind
Rain
Orientation
Rel. Humidity
Aspect
Leaf and
cluster
temp.
ME
SO
M
AC
RO
MIC
RO
GRAPE QUALITY
WINE QUALITY
Winemaker Jackson and
Lombard, 1993
Viticultural Soil Quality
• Traditionally, vines were grown in the poorest soils (shallow, stony, on slopes) Deep, fertile soils were reserved for food crops.
• Increasingly, grapevines have been grown in deeper, more fertile soils after the phylloxera crisis in Europe and in the new wine growing countries.
• From earlier times, the belief persists that “poor” soils increase stress on vines, lowering yields but enhancing flavors and aromas.
The Soil Factor in Viticulture
1) Depth and extent of the root system
2) Soil nutrient content
3) Other soil attributes
a. Depth
b. Coarse fragment content
c. Texture and structure
d. Color
e. pH and Carbonates
f. Limiting subsoil layers
4) Soil temperature
5) Soil water availability
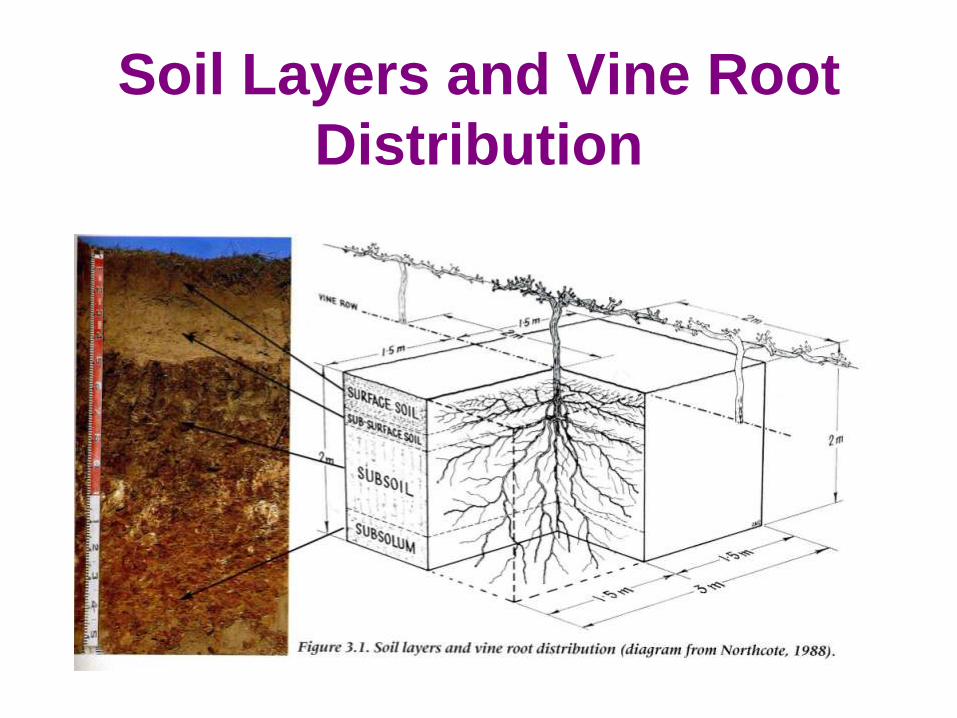
Soil Layers and Vine Root
Distribution
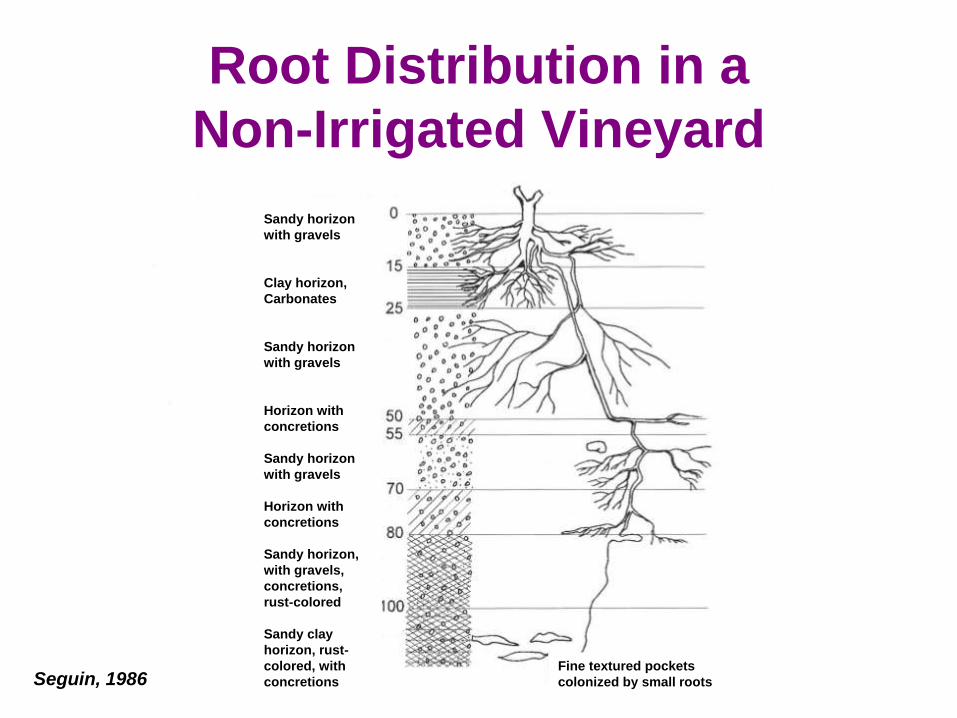
Root Distribution in a
Non-Irrigated Vineyard
Sandy horizon
with gravels
Clay horizon,
Carbonates
Sandy horizon
with gravels
Horizon with
concretions
Sandy horizon
with gravels
Horizon with
concretions
Sandy horizon,
with gravels,
concretions,
rust-colored
Sandy clay
horizon, rust-
colored, with
concretions
Fine textured pockets
colonized by small roots Seguin, 1986
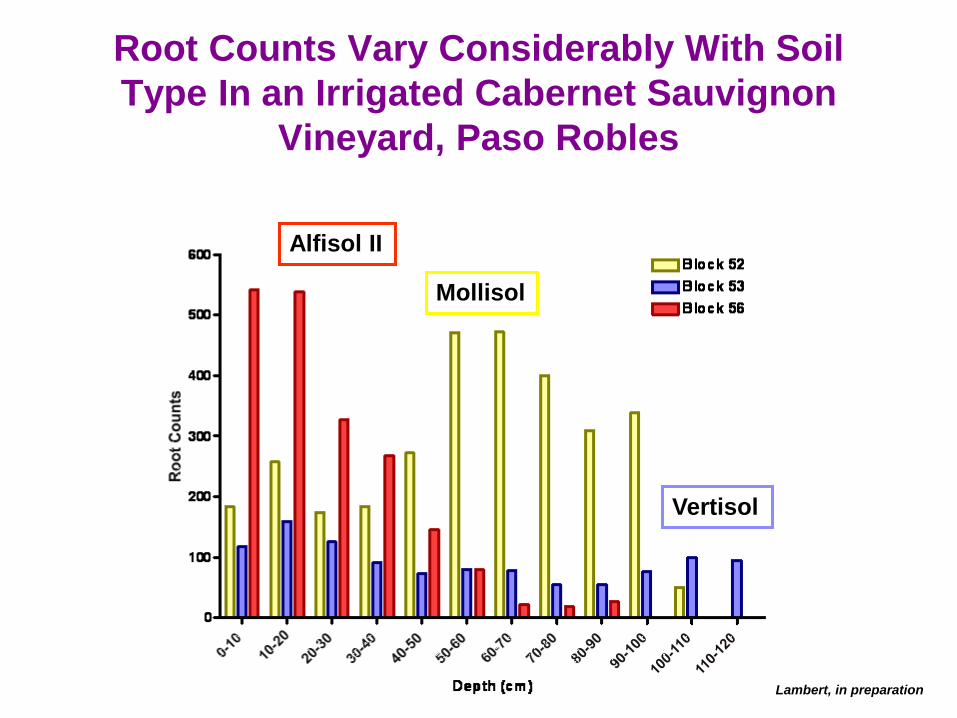
Root Counts Vary Considerably With Soil
Type In an Irrigated Cabernet Sauvignon
Vineyard, Paso Robles
Alfisol II
Mollisol
Vertisol
Lambert, in preparation
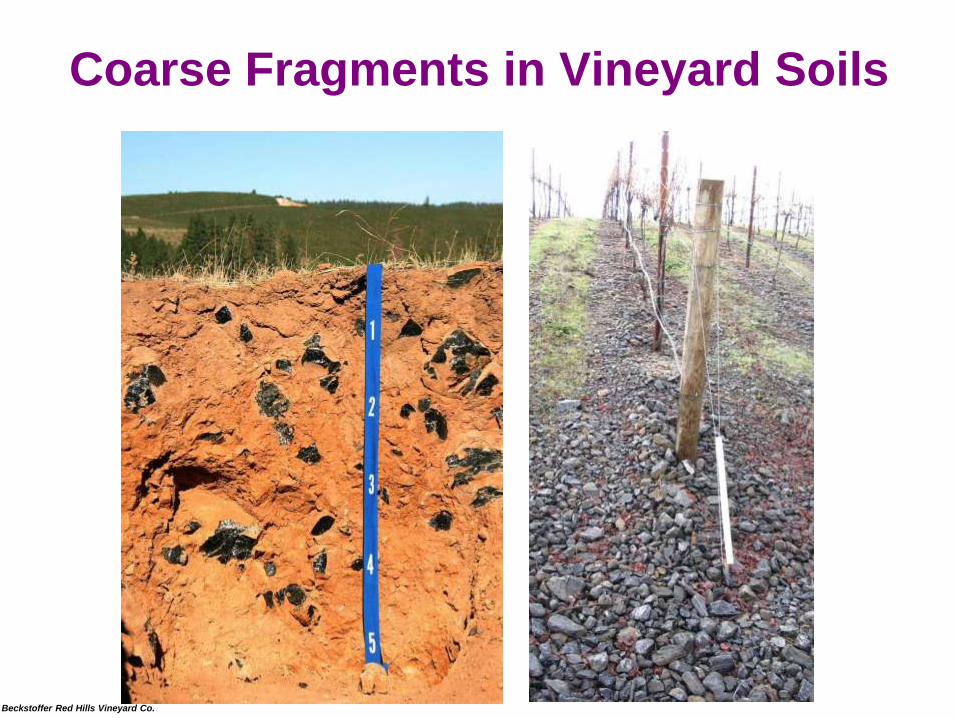
Beckstoffer Red Hills Vineyard Co.
Coarse Fragments in Vineyard Soils
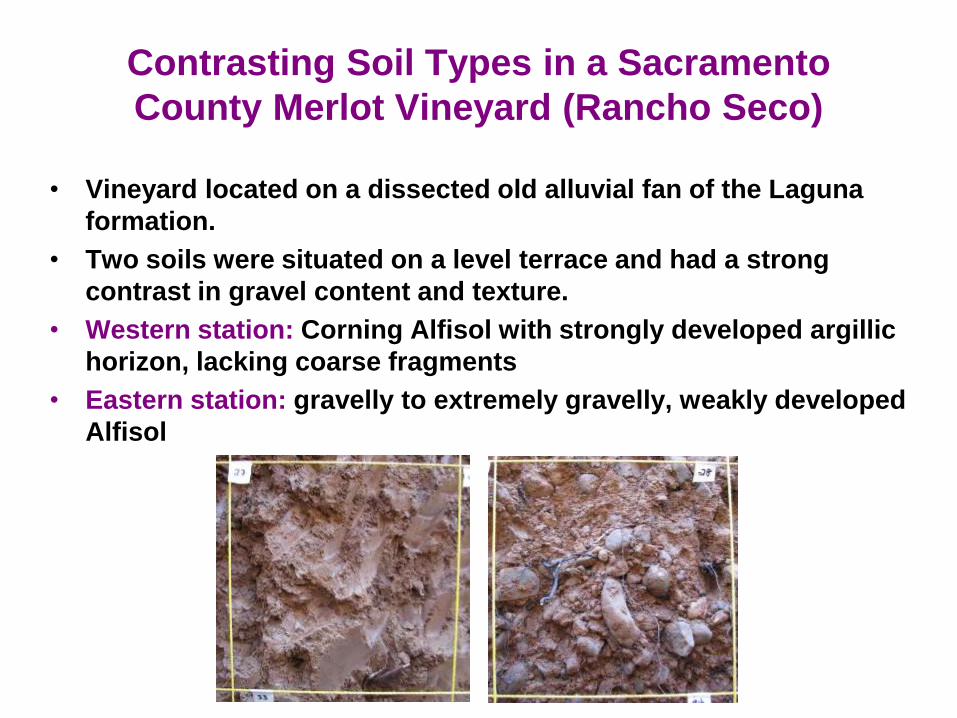
Contrasting Soil Types in a Sacramento
County Merlot Vineyard (Rancho Seco)
• Vineyard located on a dissected old alluvial fan of the Laguna
formation.
• Two soils were situated on a level terrace and had a strong
contrast in gravel content and texture.
• Western station: Corning Alfisol with strongly developed argillic
horizon, lacking coarse fragments
• Eastern station: gravelly to extremely gravelly, weakly developed
Alfisol
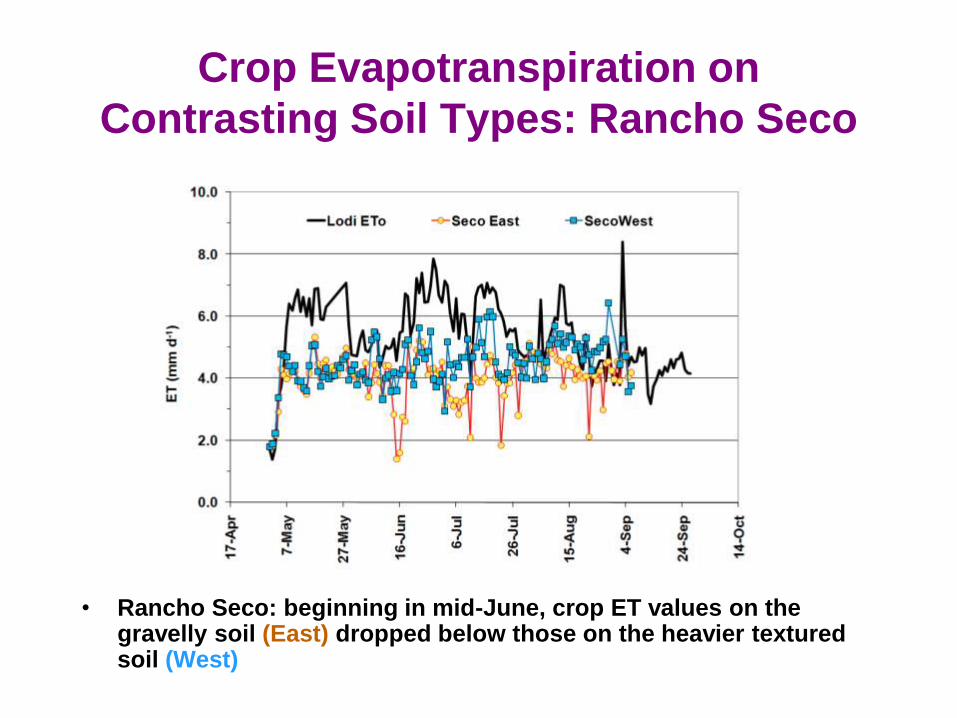
Crop Evapotranspiration on
Contrasting Soil Types: Rancho Seco
• Rancho Seco: beginning in mid-June, crop ET values on the gravelly soil (East) dropped below those on the heavier textured soil (West)

http://www.public.iastate.edu/~arossi/texture%20triangle.jpg
Soil Textures:
The Texture Triangle
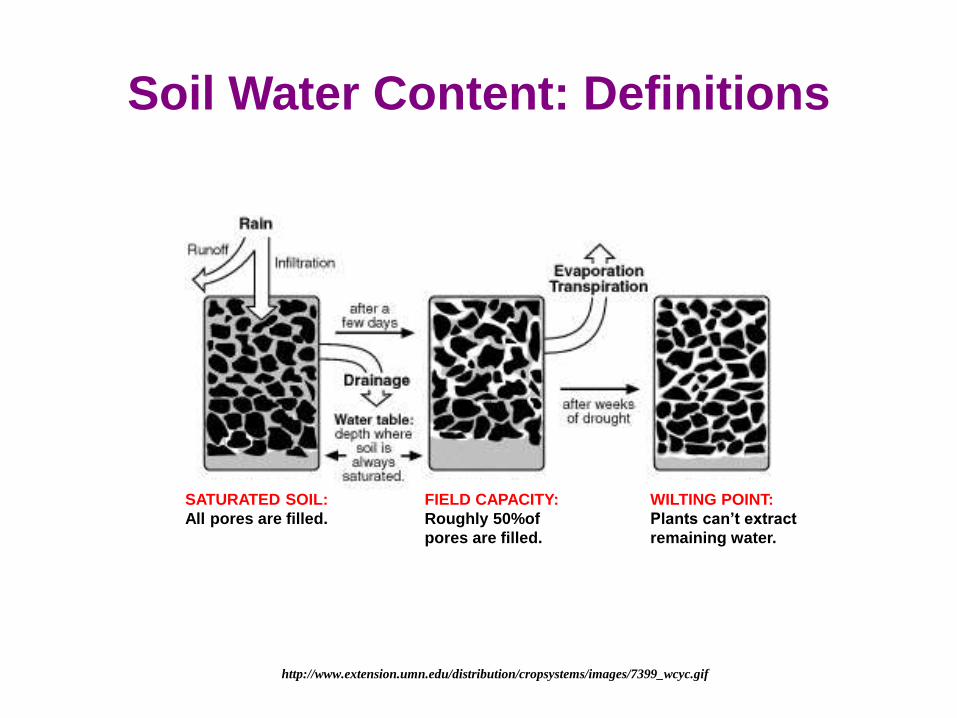
http://www.extension.umn.edu/distribution/cropsystems/images/7399_wcyc.gif
SATURATED SOIL:
All pores are filled.
FIELD CAPACITY:
Roughly 50%of
pores are filled.
WILTING POINT:
Plants can‟t extract
remaining water.
Soil Water Content: Definitions

Moisture Retention Varies
With Soil Texture
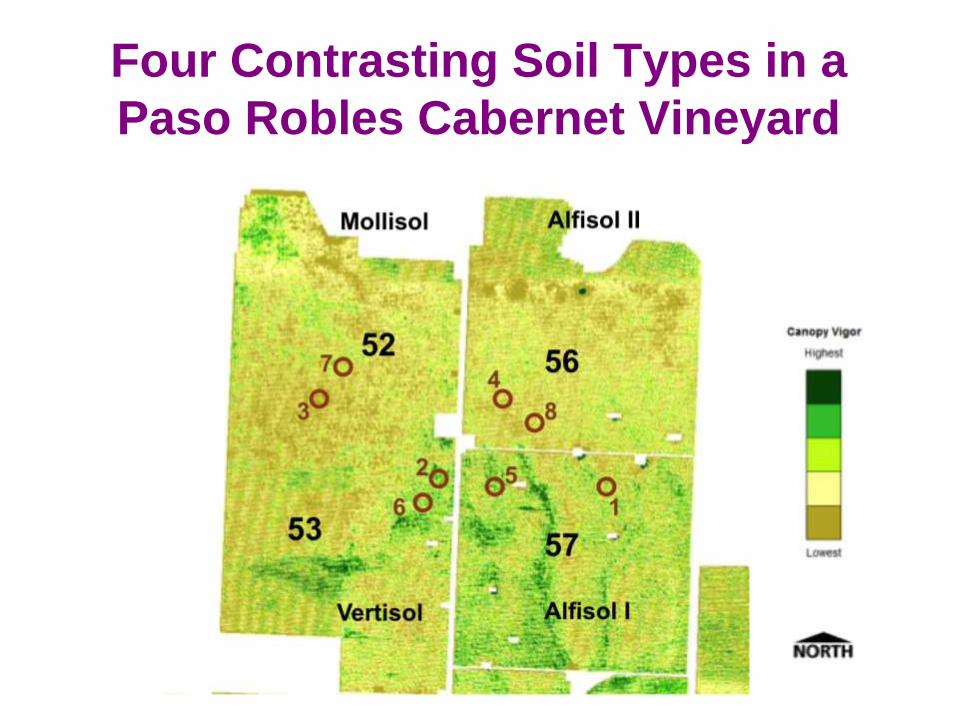
Four Contrasting Soil Types in a
Paso Robles Cabernet Vineyard
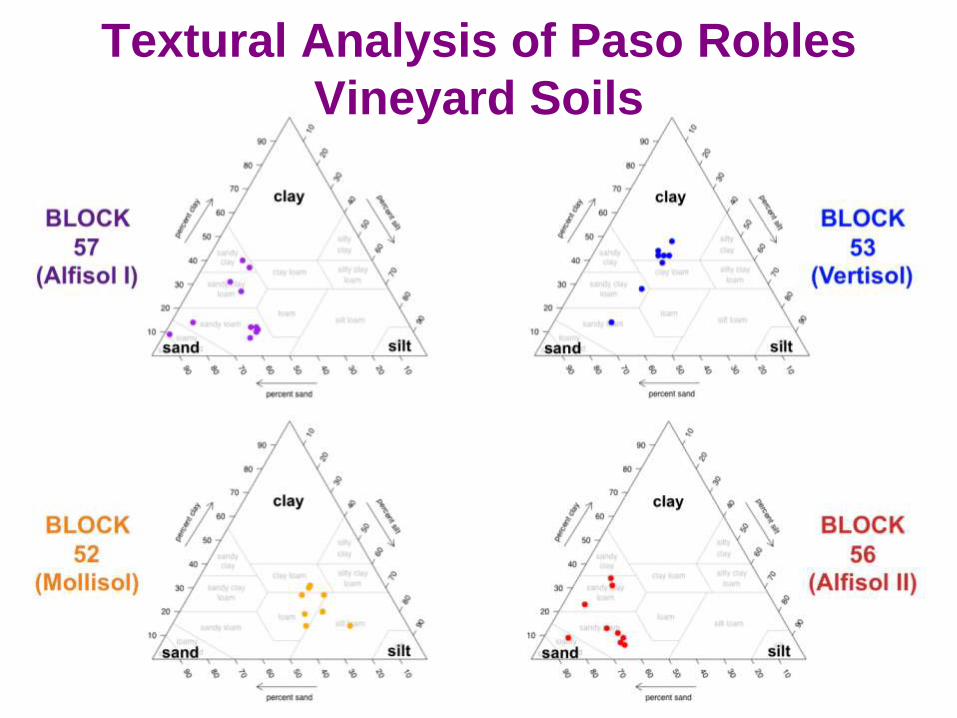
Textural Analysis of Paso Robles
Vineyard Soils
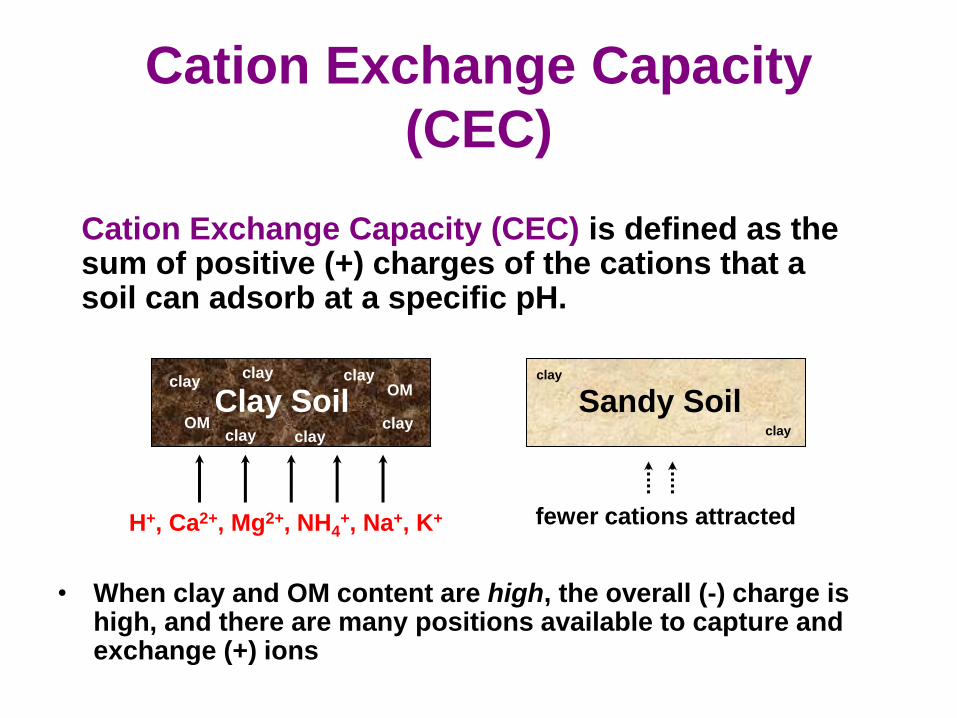
Cation Exchange Capacity
(CEC)
• When clay and OM content are high, the overall (-) charge is high, and there are many positions available to capture and exchange (+) ions
clay
clay
Clay Soil clay
OM
OM
clay
clay
H+, Ca2+, Mg2+, NH4+, Na+, K+ fewer cations attracted
Sandy Soil clay
clay clay
Cation Exchange Capacity (CEC) is defined as the sum of positive (+) charges of the cations that a soil can adsorb at a specific pH.
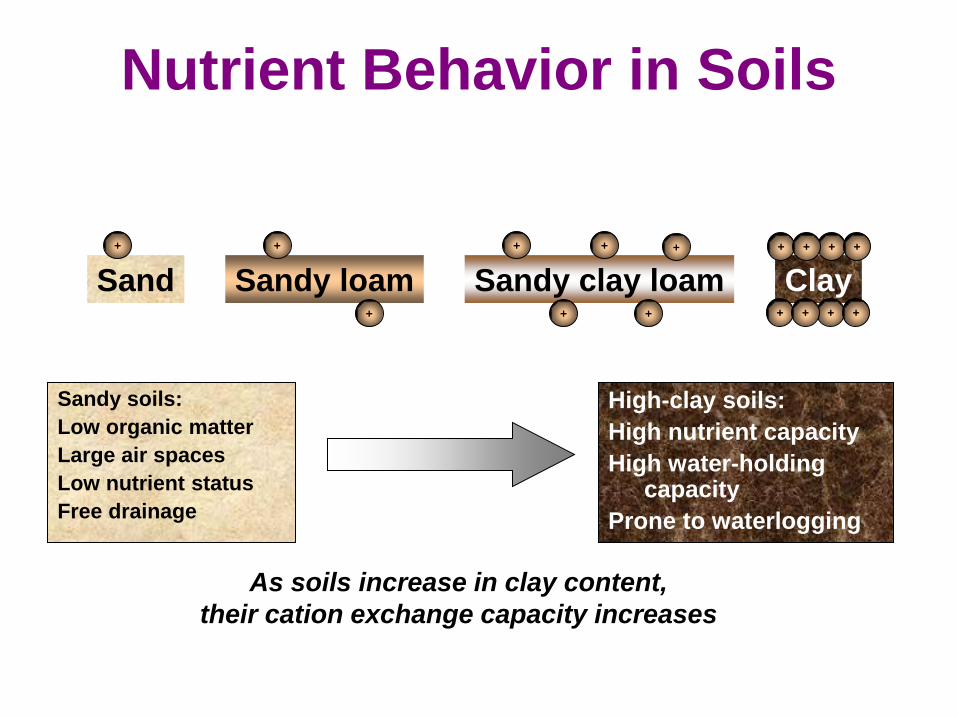
Nutrient Behavior in Soils
Sandy soils:
Low organic matter
Large air spaces
Low nutrient status
Free drainage
High-clay soils:
High nutrient capacity
High water-holding capacity
Prone to waterlogging
Sand Sandy loam Sandy clay loam Clay + + +
+
+
+ +
+
+
+
+
+
As soils increase in clay content,
their cation exchange capacity increases
+ + + +
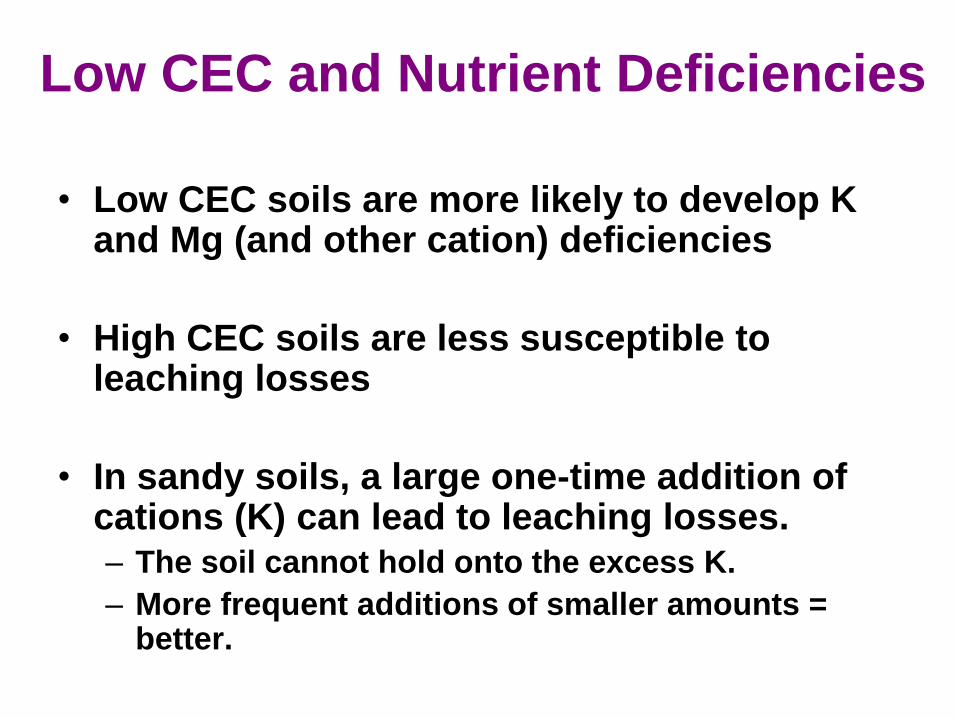
Low CEC and Nutrient Deficiencies
• Low CEC soils are more likely to develop K and Mg (and other cation) deficiencies
• High CEC soils are less susceptible to leaching losses
• In sandy soils, a large one-time addition of cations (K) can lead to leaching losses. – The soil cannot hold onto the excess K.
– More frequent additions of smaller amounts = better.
P5
0 10 20 30 40 50
0
50
100
150
CEC
P6
0 10 20 30 40 50
0
50
100
150
CEC
P7
0 10 20 30 40 50
0
50
100
150
CEC
P8
0 10 20 30 40 50
0
50
100
150
CEC
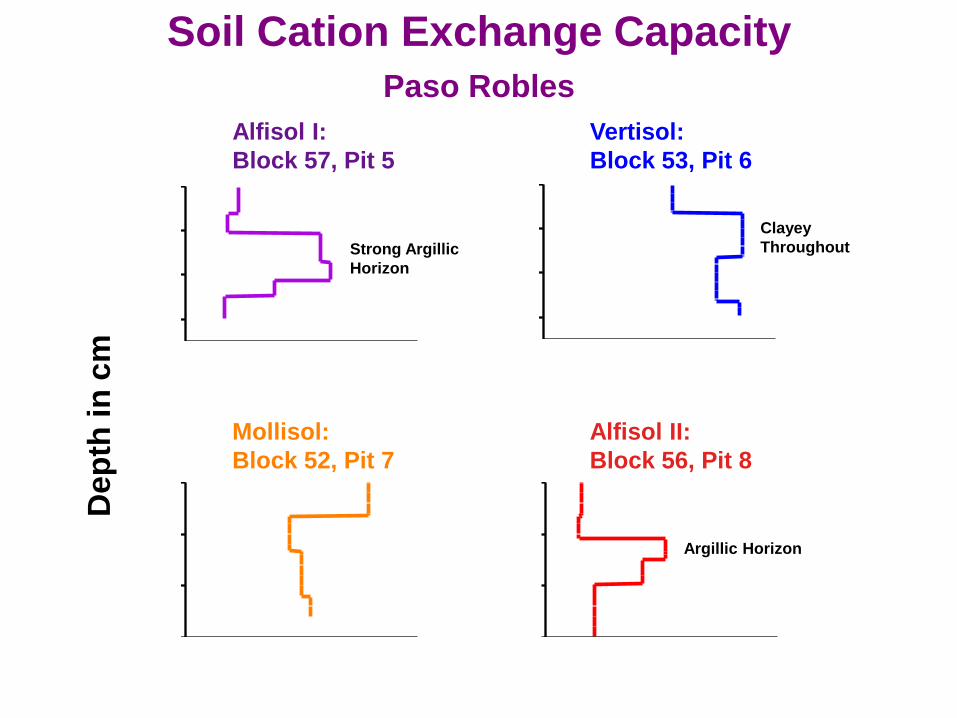
Strong Argillic
Horizon
Argillic Horizon
Clayey
Throughout
Soil Cation Exchange Capacity
Paso Robles Alfisol I:
Block 57, Pit 5
Vertisol:
Block 53, Pit 6
Mollisol:
Block 52, Pit 7
Alfisol II:
Block 56, Pit 8
Dep
th i
n c
m
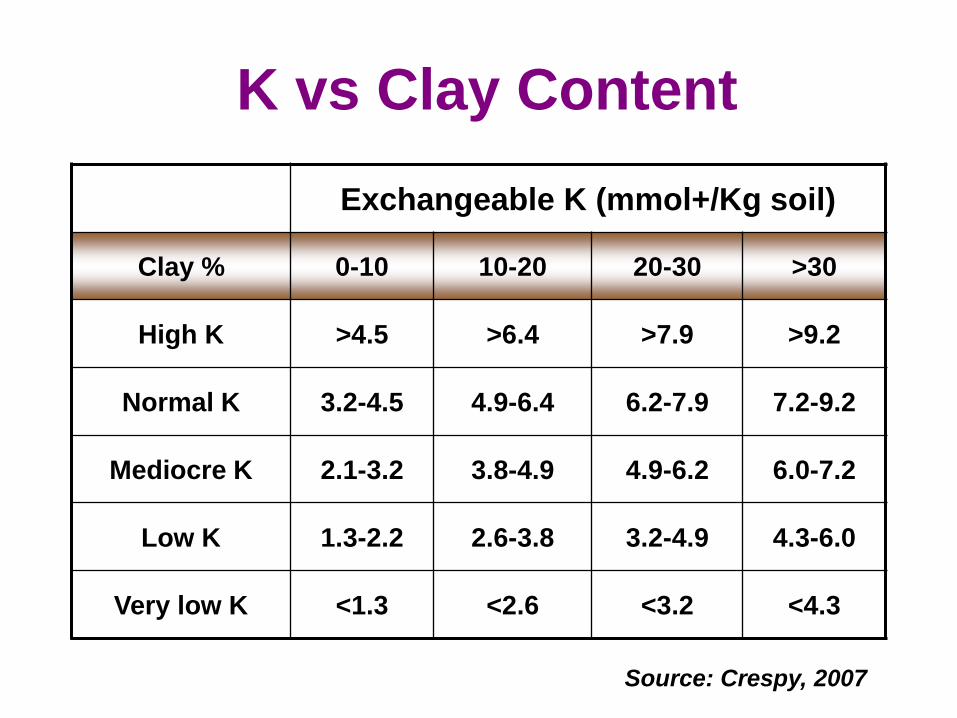
K vs Clay Content
Exchangeable K (mmol+/Kg soil)
Clay % 0-10 10-20 20-30 >30
High K >4.5 >6.4 >7.9 >9.2
Normal K 3.2-4.5 4.9-6.4 6.2-7.9 7.2-9.2
Mediocre K 2.1-3.2 3.8-4.9 4.9-6.2 6.0-7.2
Low K 1.3-2.2 2.6-3.8 3.2-4.9 4.3-6.0
Very low K <1.3 <2.6 <3.2 <4.3
Source: Crespy, 2007

Soil K/CEC Ratio With Depth Paso Robles
P5
0 1 2 3 4 5 6 7
0
50
100
150
K% CEC
P6
0 1 2 3 4 5 6 7
0
50
100
150
K% CEC
P7
0 1 2 3 4 5 6 7
0
50
100
150
K% CEC
P8
0 1 2 3 4 5 6 7
0
50
100
150
K% CEC
Dep
th i
n c
m
Alfisol I:
Block 57, Pit 5
Vertisol:
Block 53, Pit 6
Mollisol:
Block 52, Pit 7
Alfisol II:
Block 56, Pit 8
K may be LIMITING
K may be LIMITING

Vertisol Mollisol Alfisol Alfisol
9.6% 7.3% 1.4% 7.0%
Exchangeable vs. Available K Paso Robles
Depth in cm
K-Water as
% of X-K (top horizon)
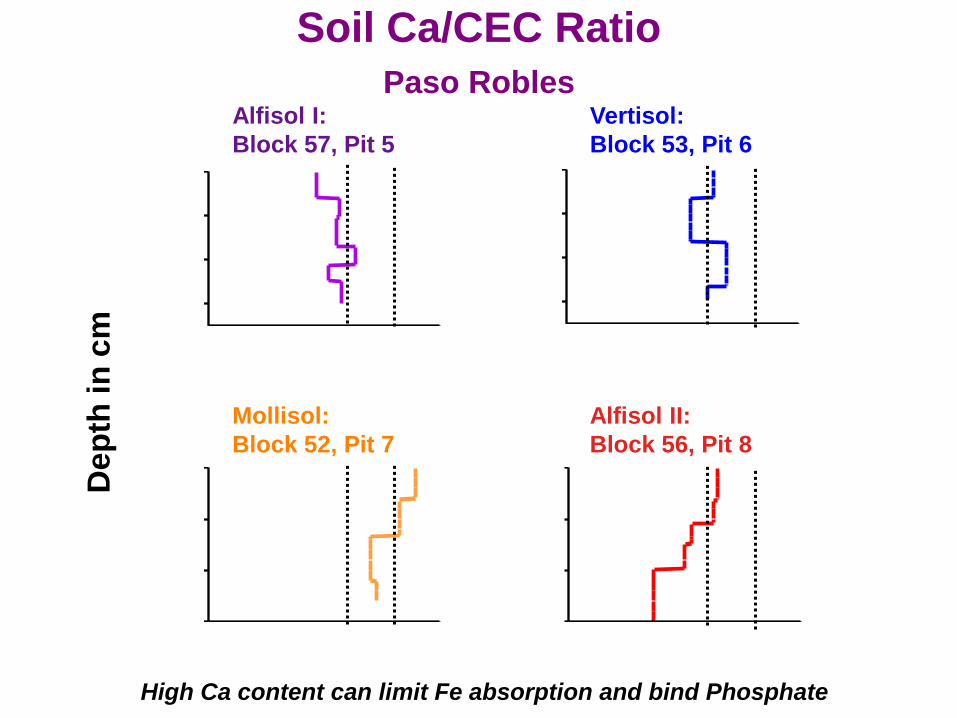
Soil Ca/CEC Ratio
Paso Robles
P5
0 10 20 30 40 50 60 70 80 90 100
0
50
100
150
%Ca on CEC
P6
0 10 20 30 40 50 60 70 80 90 100
0
50
100
150
%Ca on CEC
P7
0 10 20 30 40 50 60 70 80 90 100
0
50
100
150
%Ca on CEC
P8
0 10 20 30 40 50 60 70 80 90 100
0
50
100
150
%Ca on CEC
Dep
th i
n c
m
Alfisol I:
Block 57, Pit 5
Vertisol:
Block 53, Pit 6
Mollisol:
Block 52, Pit 7
Alfisol II:
Block 56, Pit 8
High Ca content can limit Fe absorption and bind Phosphate
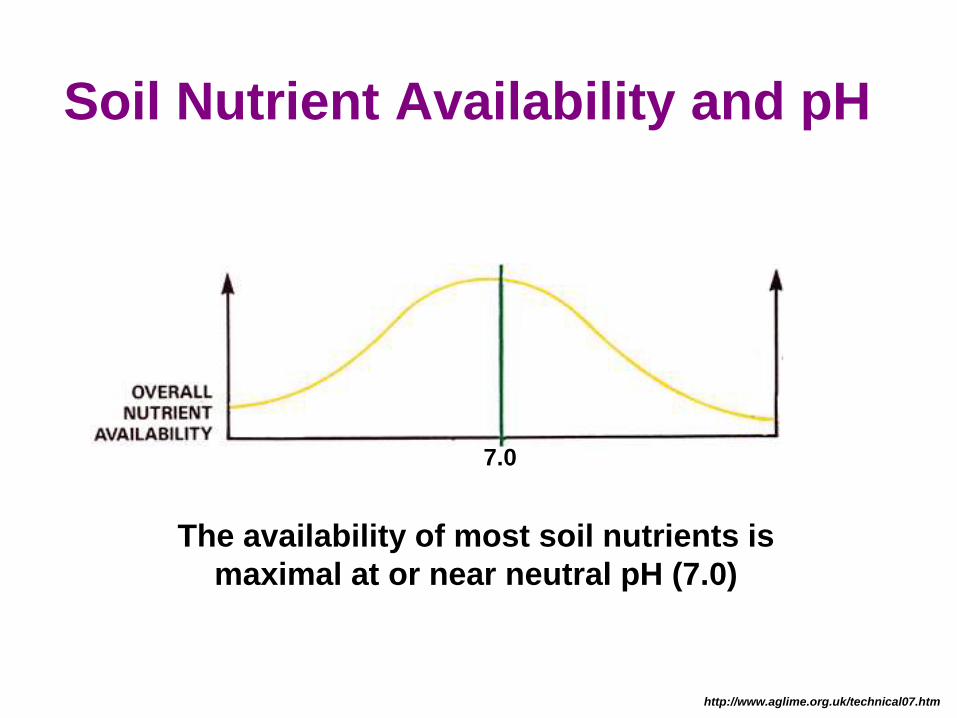
Soil Nutrient Availability and pH
The availability of most soil nutrients is
maximal at or near neutral pH (7.0)
http://www.aglime.org.uk/technical07.htm
7.0
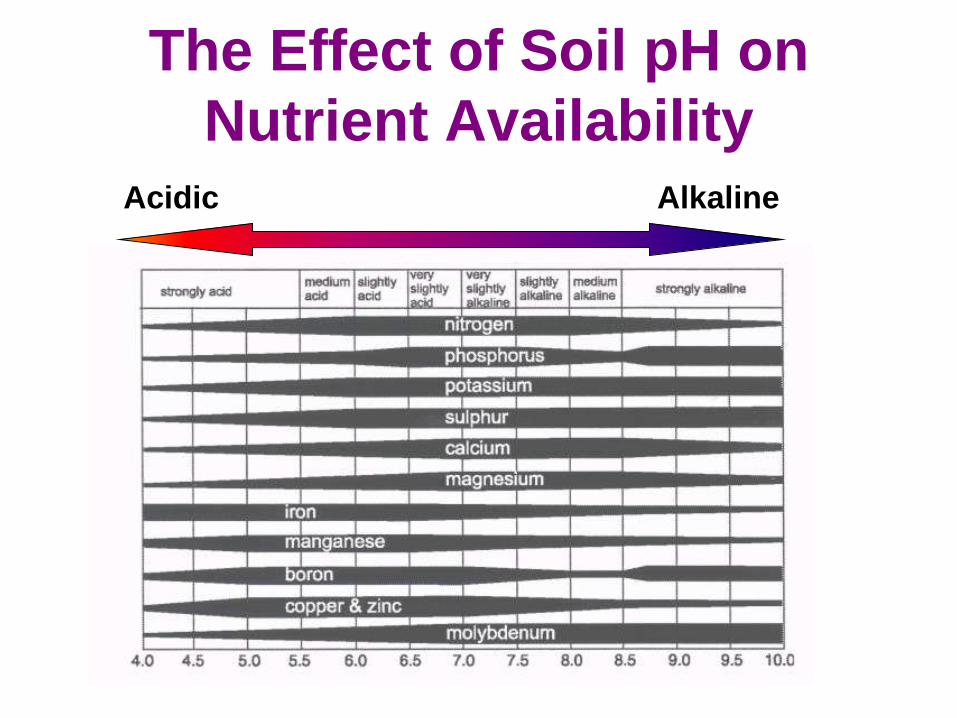
The Effect of Soil pH on
Nutrient Availability Acidic Alkaline
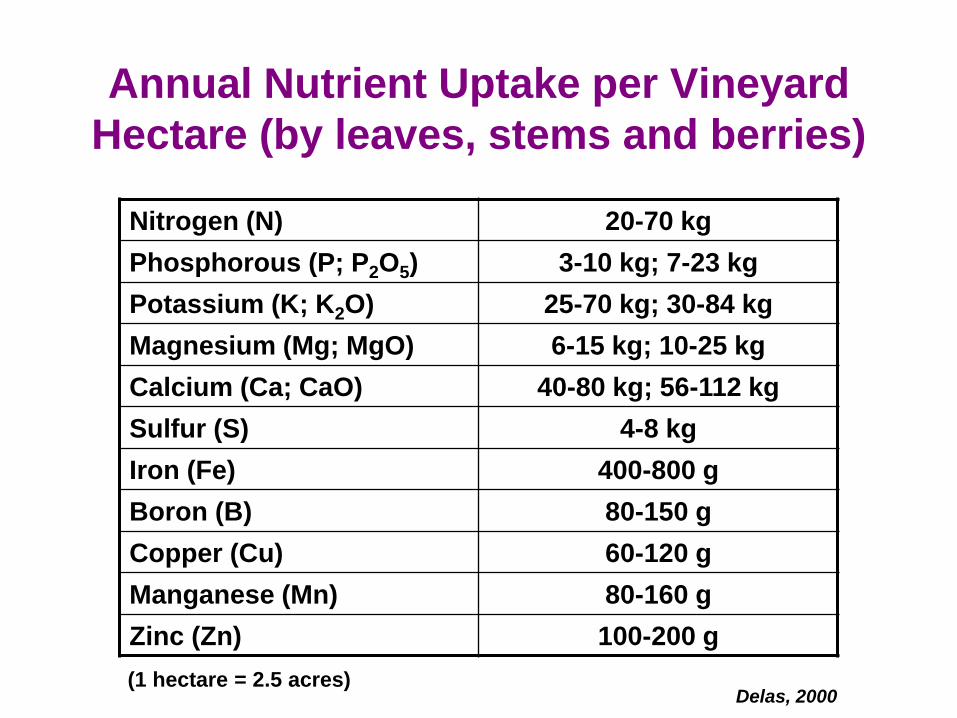
Annual Nutrient Uptake per Vineyard
Hectare (by leaves, stems and berries)
Nitrogen (N) 20-70 kg
Phosphorous (P; P2O5) 3-10 kg; 7-23 kg
Potassium (K; K2O) 25-70 kg; 30-84 kg
Magnesium (Mg; MgO) 6-15 kg; 10-25 kg
Calcium (Ca; CaO) 40-80 kg; 56-112 kg
Sulfur (S) 4-8 kg
Iron (Fe) 400-800 g
Boron (B) 80-150 g
Copper (Cu) 60-120 g
Manganese (Mn) 80-160 g
Zinc (Zn) 100-200 g
Delas, 2000 (1 hectare = 2.5 acres)

Average annual uptake of N, P, K
N = 30 kg/ha/yr = 26lbs/ac/yr
P = 4 kg/ha/yr = 3.6 lbs/ac/yr
K = 25kg/ha/yr = 22 lbs/ac/yr
- Leaves fall to the ground and are spread unevenly by wind;
- Prunings are generally reincorporated in the ground;
- Only the grapes are „removed‟, and the nutrient content of
grapes represents a smaller fraction of the overall nutrient
uptake.
Hence, actual nutrient loss from the vineyard is less than the
overall uptake by the plant.
Source: Delas, 2000
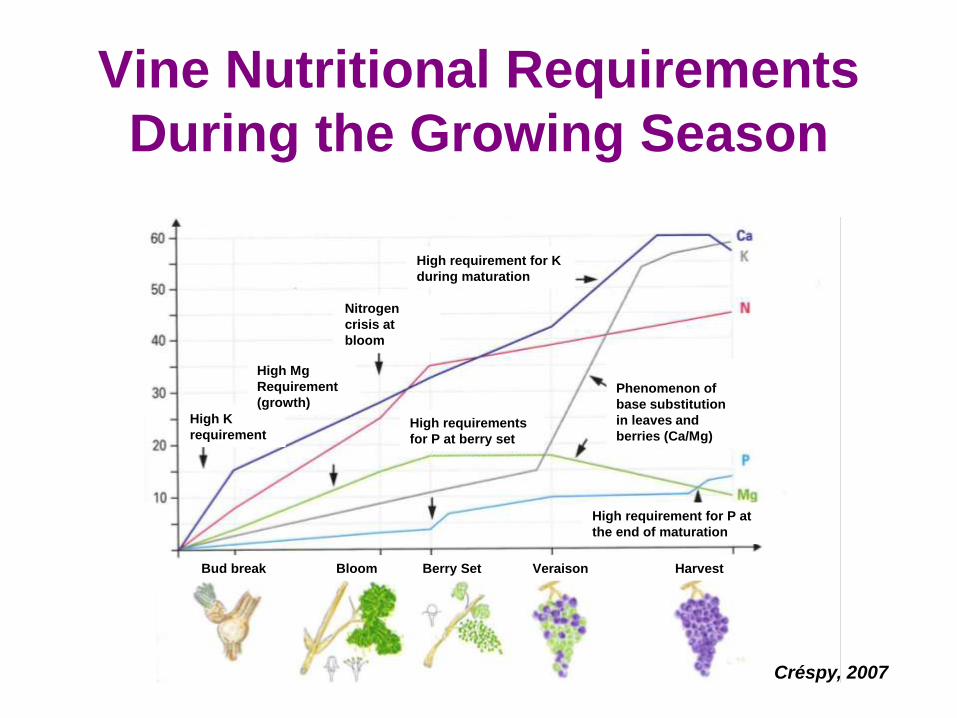
Vine Nutritional Requirements
During the Growing Season
Bud break Veraison Harvest Bloom
High K
requirement
High Mg
Requirement
(growth)
Nitrogen
crisis at
bloom
High requirement for K
during maturation
High requirements
for P at berry set
Phenomenon of
base substitution
in leaves and
berries (Ca/Mg)
High requirement for P at
the end of maturation
Berry Set
Créspy, 2007

Leaf Petiole Sampling
• Left: Sampling at bloom
• Right: Sampling at veraison
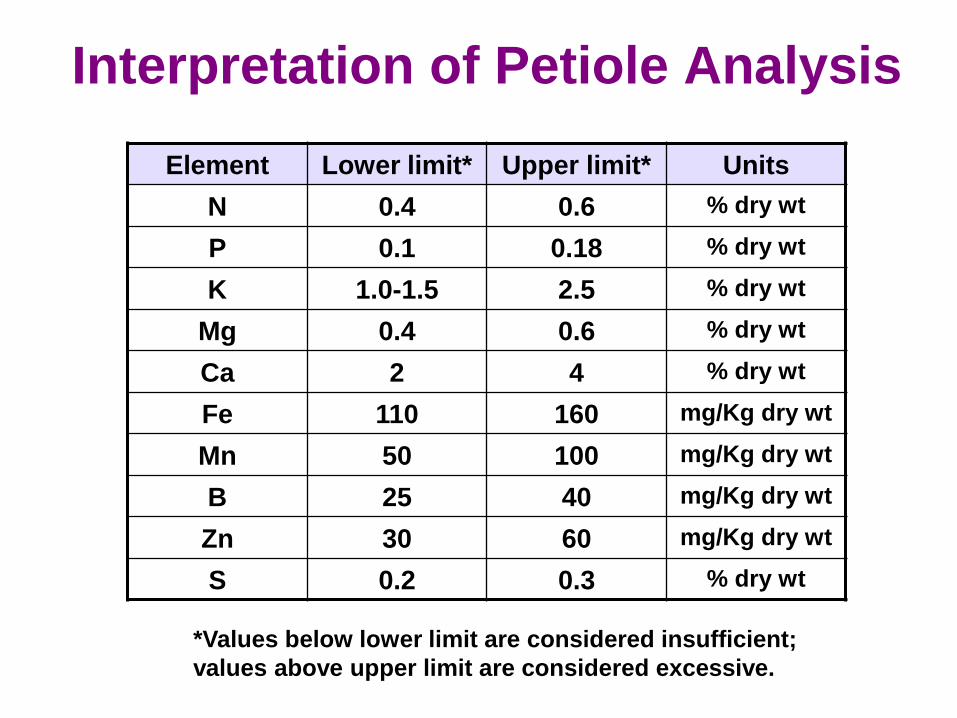
Interpretation of Petiole Analysis
Element Lower limit* Upper limit* Units
N 0.4 0.6 % dry wt
P 0.1 0.18 % dry wt
K 1.0-1.5 2.5 % dry wt
Mg 0.4 0.6 % dry wt
Ca 2 4 % dry wt
Fe 110 160 mg/Kg dry wt
Mn 50 100 mg/Kg dry wt
B 25 40 mg/Kg dry wt
Zn 30 60 mg/Kg dry wt
S 0.2 0.3 % dry wt
*Values below lower limit are considered insufficient;
values above upper limit are considered excessive.
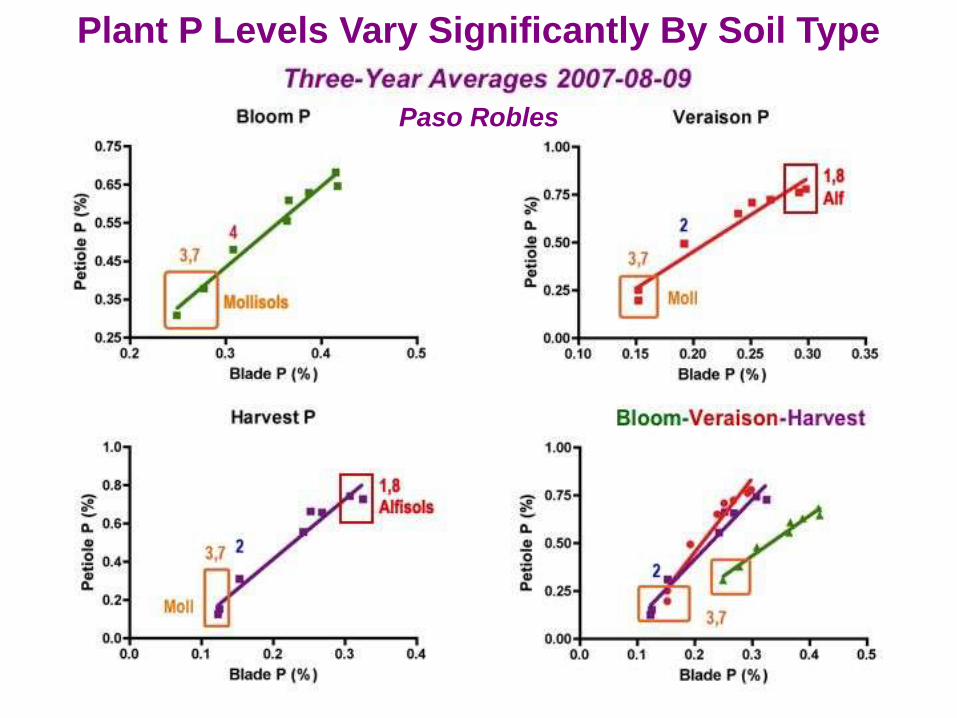
Plant P Levels Vary Significantly By Soil Type
Paso Robles
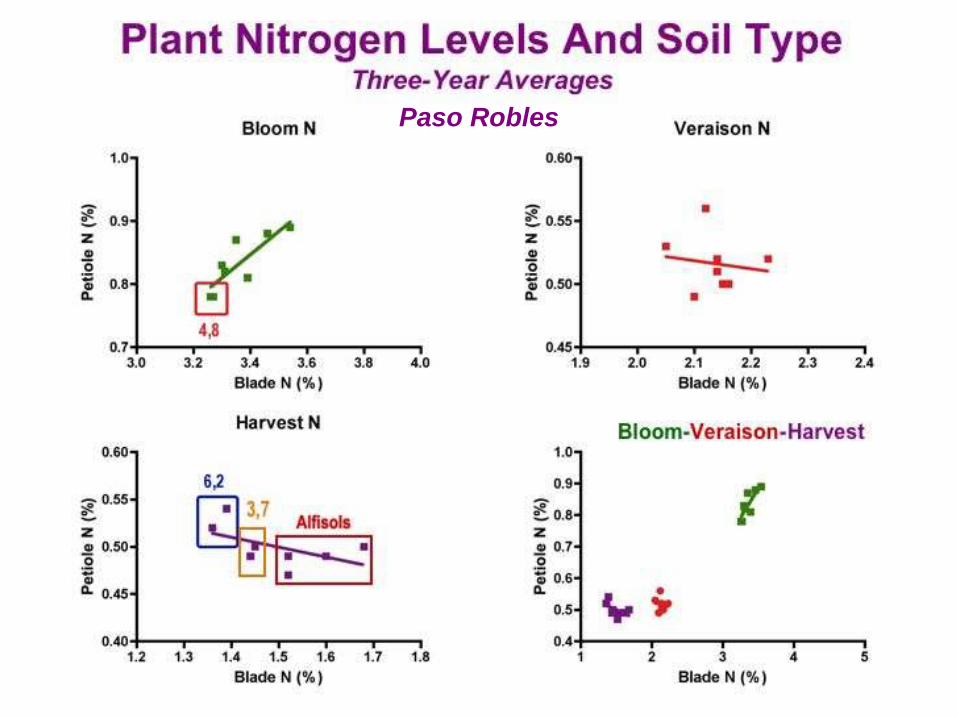
Paso Robles
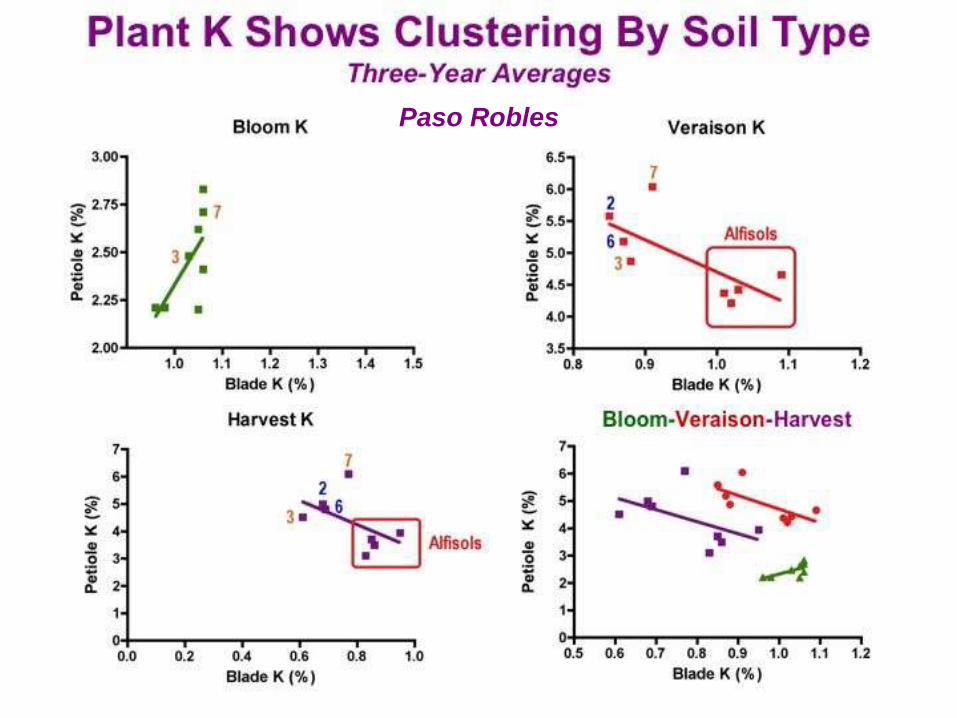
Paso Robles
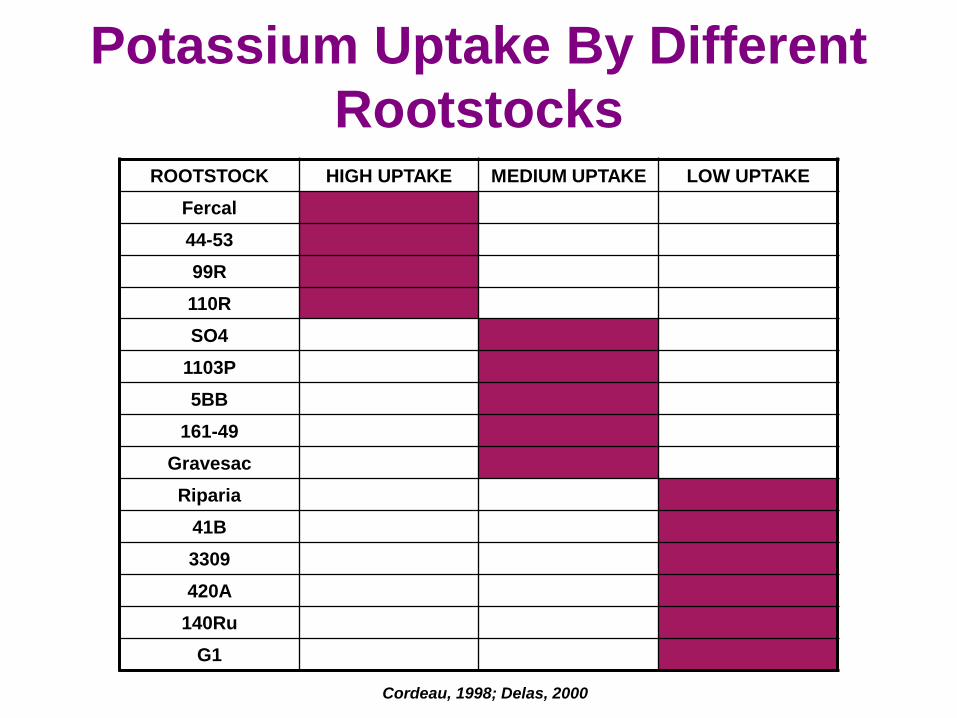
Potassium Uptake By Different
Rootstocks ROOTSTOCK HIGH UPTAKE MEDIUM UPTAKE LOW UPTAKE
Fercal
44-53
99R
110R
SO4
1103P
5BB
161-49
Gravesac
Riparia
41B
3309
420A
140Ru
G1
Cordeau, 1998; Delas, 2000
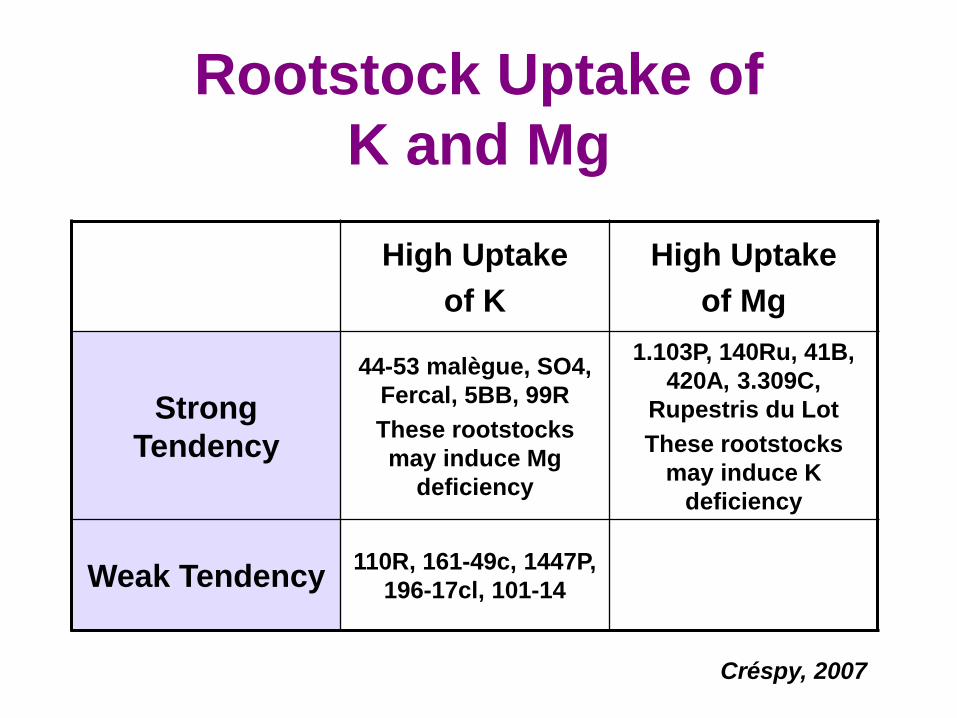
Rootstock Uptake of
K and Mg
High Uptake
of K
High Uptake
of Mg
Strong
Tendency
44-53 malègue, SO4,
Fercal, 5BB, 99R
These rootstocks
may induce Mg
deficiency
1.103P, 140Ru, 41B,
420A, 3.309C,
Rupestris du Lot
These rootstocks
may induce K
deficiency
Weak Tendency 110R, 161-49c, 1447P,
196-17cl, 101-14
Créspy, 2007
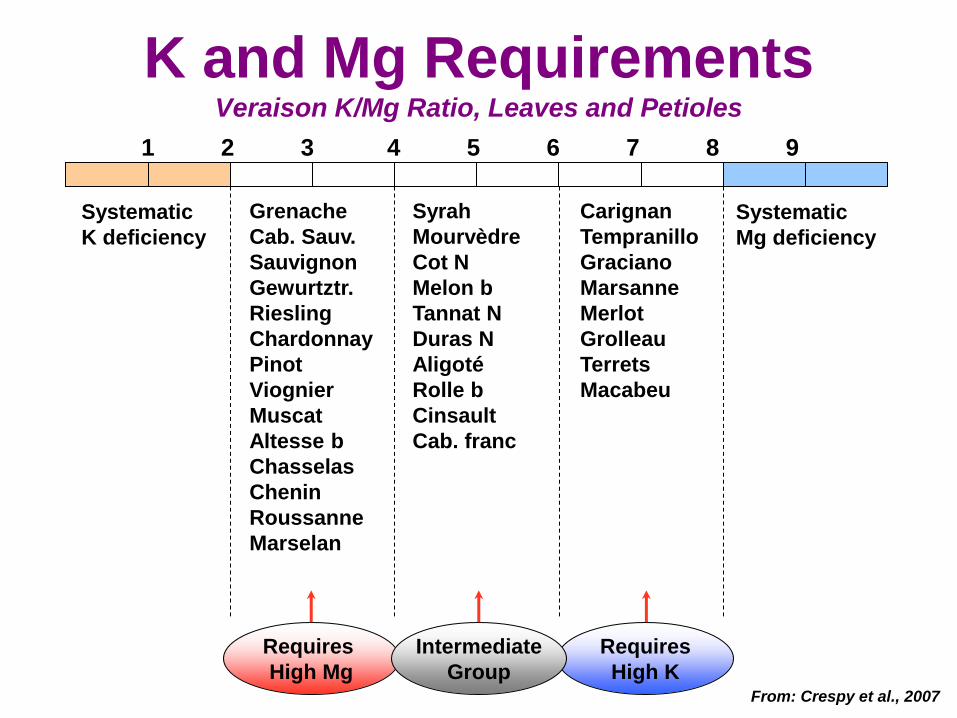
K and Mg Requirements Veraison K/Mg Ratio, Leaves and Petioles
Requires
High Mg
Requires
High K
Intermediate
Group
Systematic
K deficiency
Systematic
Mg deficiency
Grenache
Cab. Sauv.
Sauvignon
Gewurtztr.
Riesling
Chardonnay
Pinot
Viognier
Muscat
Altesse b
Chasselas
Chenin
Roussanne
Marselan
Syrah
Mourvèdre
Cot N
Melon b
Tannat N
Duras N
Aligoté
Rolle b
Cinsault
Cab. franc
Carignan
Tempranillo
Graciano
Marsanne
Merlot
Grolleau
Terrets
Macabeu
1 2 3 4 5 6 7 8 9
From: Crespy et al., 2007
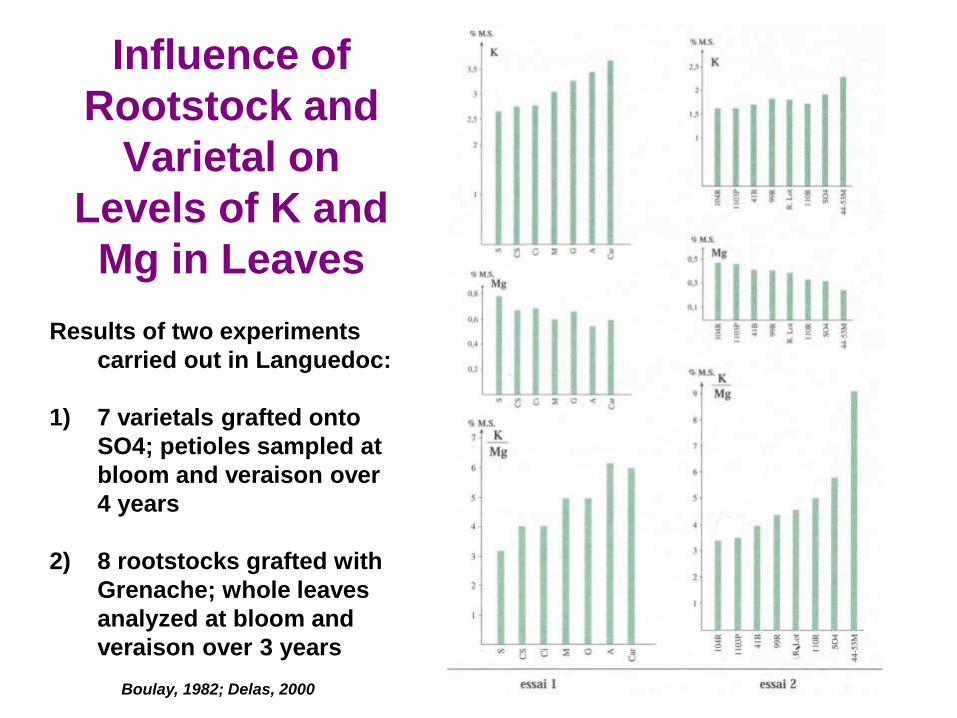
Influence of
Rootstock and
Varietal on
Levels of K and
Mg in Leaves
Results of two experiments
carried out in Languedoc:
1) 7 varietals grafted onto
SO4; petioles sampled at
bloom and veraison over
4 years
2) 8 rootstocks grafted with
Grenache; whole leaves
analyzed at bloom and
veraison over 3 years
Boulay, 1982; Delas, 2000
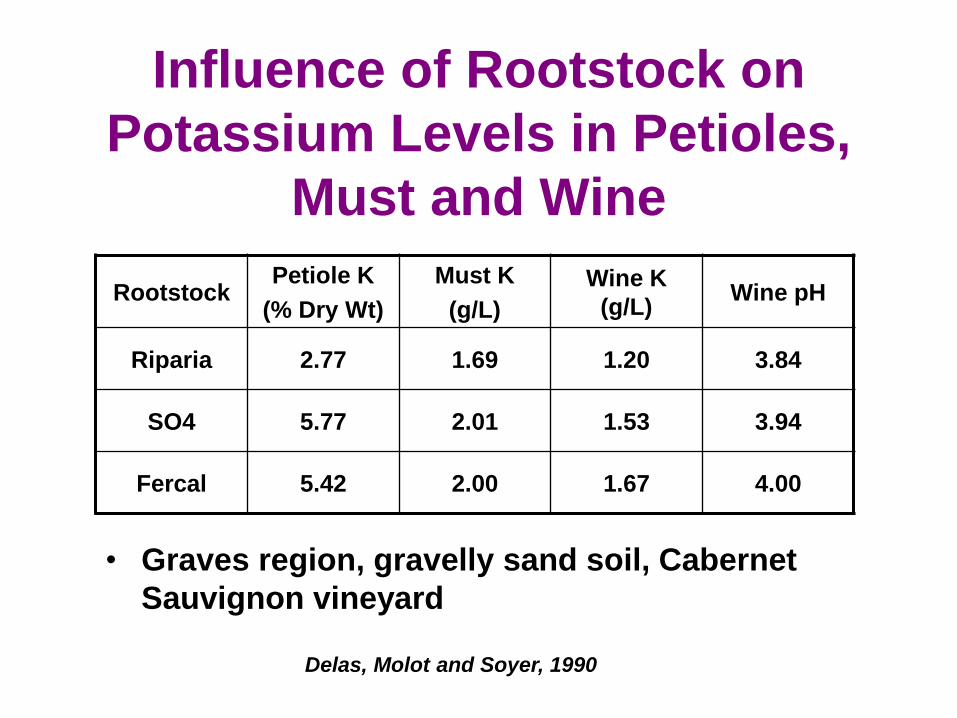
Influence of Rootstock on
Potassium Levels in Petioles,
Must and Wine
Rootstock Petiole K
(% Dry Wt)
Must K
(g/L)
Wine K
(g/L) Wine pH
Riparia 2.77 1.69 1.20 3.84
SO4 5.77 2.01 1.53 3.94
Fercal 5.42 2.00 1.67 4.00
Delas, Molot and Soyer, 1990
• Graves region, gravelly sand soil, Cabernet
Sauvignon vineyard

Influence of K Fertilization on K
Content of Petioles, Musts and Wine
and on Must and Wine Properties
• Cab. Sauvignon, Riparia rootstock, Medoc region (Delas, Molot and Soyer 1990; Delas 2000)
• Effects of K fertilization on pH of must and wine are very slight, although a pH increase is seen
Fertilization (kg K2O/ha/yr)
Petiole K (% dry wt)
Berry K (% dry wt)
Must K (g/L)1.11
Must pH Wine K
(g/L) Wine pH
0
(deficient) 0.40 1.34 1.11 3.06 0.83 3.39
60 2.18 1.89 1.52 3.13 0.94 3.41
120
(excess) 3.57 2.19 1.70 3.19 1.12 3.65
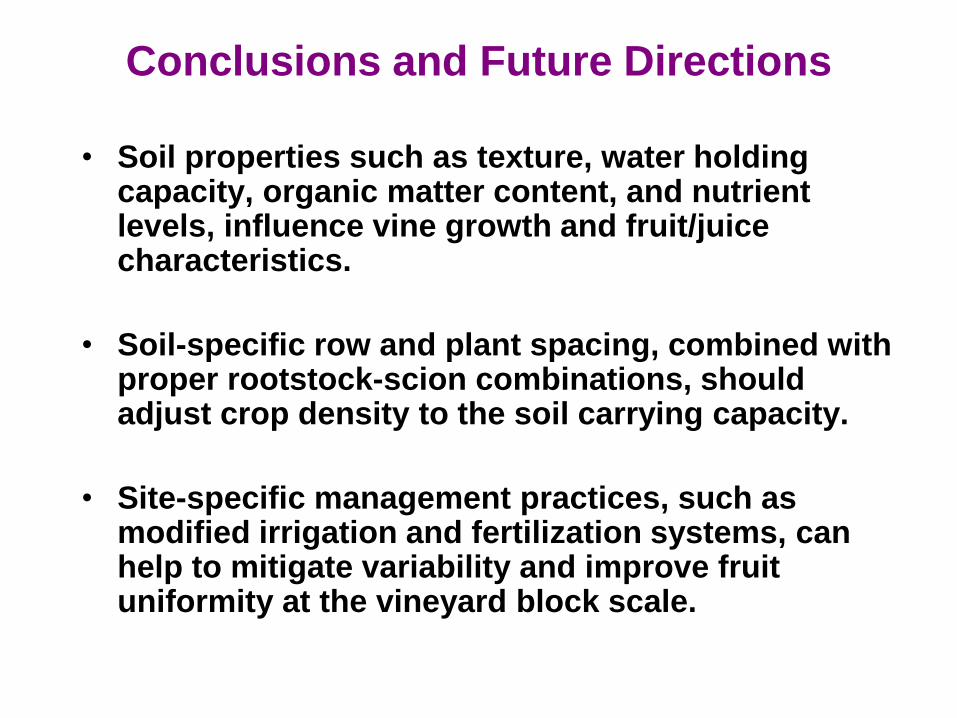
Conclusions and Future Directions
• Soil properties such as texture, water holding capacity, organic matter content, and nutrient levels, influence vine growth and fruit/juice characteristics.
• Soil-specific row and plant spacing, combined with proper rootstock-scion combinations, should adjust crop density to the soil carrying capacity.
• Site-specific management practices, such as modified irrigation and fertilization systems, can help to mitigate variability and improve fruit uniformity at the vineyard block scale.
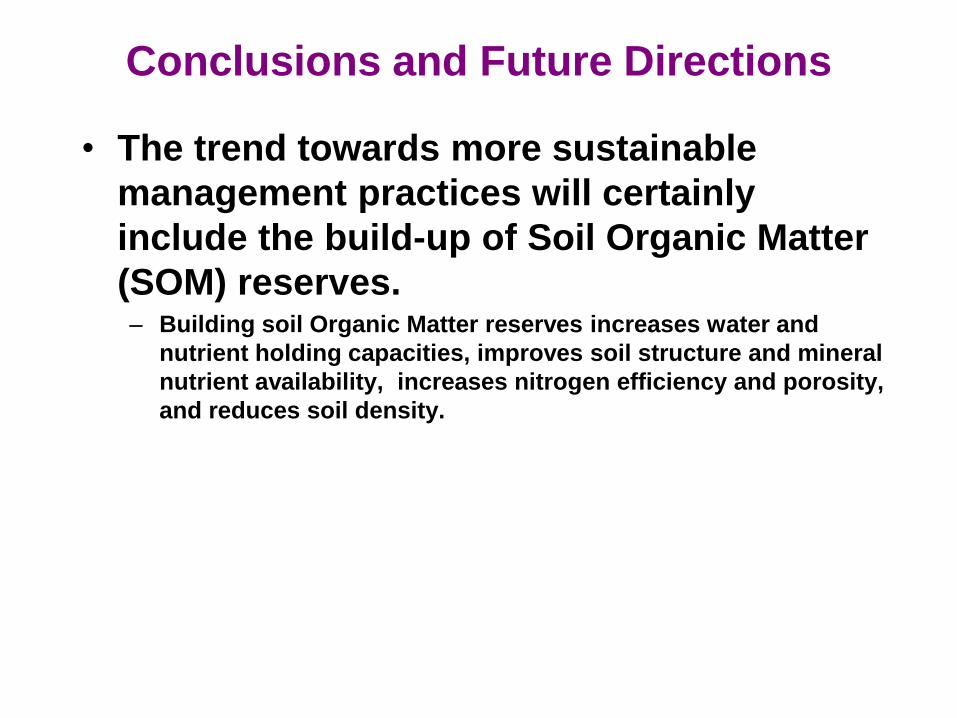
Conclusions and Future Directions
• The trend towards more sustainable
management practices will certainly
include the build-up of Soil Organic Matter
(SOM) reserves. – Building soil Organic Matter reserves increases water and
nutrient holding capacities, improves soil structure and mineral
nutrient availability, increases nitrogen efficiency and porosity,
and reduces soil density.
Acknowledgments
Dept. of Viticulture and Enology, UCD
Dept. of Land, Air and Water Resources, UCD
J. Lohr Winery, Paso Robles
Bokisch Vineyards, Rancho Seco
Mark Battany
Hildegarde Heymann
Andrew McElrone (USDA)
James A. Wolpert
Randy Dahlgren
Rick Snyder
Jerry Lohr
Kim Adams, Steve Carter
Carrie McDonnell, Anji Perry
Markus Bokisch
Funding: American Vineyard Foundation (AVF);
CA Department of Water Resources (DWR)