influence of proprioceptive feedback on the firing rate
TRANSCRIPT

Influence of proprioceptive feedback on the firing rate and recruitment of motoneurons
This article has been downloaded from IOPscience. Please scroll down to see the full text article.
2012 J. Neural Eng. 9 016007
(http://iopscience.iop.org/1741-2552/9/1/016007)
Download details:
IP Address: 128.197.181.149
The article was downloaded on 18/01/2012 at 19:13
Please note that terms and conditions apply.
View the table of contents for this issue, or go to the journal homepage for more
Home Search Collections Journals About Contact us My IOPscience

IOP PUBLISHING JOURNAL OF NEURAL ENGINEERING
J. Neural Eng. 9 (2012) 016007 (17pp) doi:10.1088/1741-2560/9/1/016007
Influence of proprioceptive feedback onthe firing rate and recruitment ofmotoneuronsC J De Luca1,2,3,4,5 and J C Kline1,2
1 NeuroMuscular Research Center, Boston University, Boston, MA, USA2 Department of Biomedical Engineering, Boston University, Boston, MA, USA3 Department of Electrical and Computer Engineering, Boston University, Boston, MA, USA4 Department of Neurology, Boston University, Boston, MA, USA
E-mail: [email protected]
Received 22 June 2011Accepted for publication 16 November 2011Published 20 December 2011Online at stacks.iop.org/JNE/9/016007
AbstractWe investigated the relationships of the firing rate and maximal recruitment threshold ofmotoneurons recorded during isometric contraction with the number of spindles in individualmuscles. At force levels above 10% of maximal voluntary contraction, the firing rate wasinversely related to the number of spindles in a muscle, with the slope of the relationshipincreasing with force. The maximal recruitment threshold of motor units increased linearlywith the number of spindles in the muscle. Thus, muscles with a greater number of spindleshad lower firing rates and a greater maximal recruitment threshold. These findings may beexplained by a mechanical interaction between muscle fibres and adjacent spindles. Duringlow-level (0% to 10%) voluntary contractions, muscle fibres of recruited motor units produceforce twitches that activate nearby spindles to respond with an immediate excitatory feedbackthat reaches maximal level. As the force increases further, the twitches overlap and tendtowards tetanization, the muscle fibres shorten, the spindles slacken, their excitatory firingsdecrease, and the net excitation to the homonymous motoneurons decreases. Motoneurons ofmuscles with greater number of spindles receive a greater decrease in excitation which reducestheir firing rates, increases their maximal recruitment threshold, and changes the motoneuronrecruitment distribution.
1. Introduction
Recently De Luca and Hostage (2010) have reported thatthe control scheme for motoneurons is invariant among suchdiverse muscles as the first dorsal interosseous (FDI), thetibialis anterior (TA), and vastus lateralis (VL). But, the valuesof the firing rates and recruitment thresholds of motor unitsvary among muscles. For example, motor units in the FDImuscle have been reported to have firing rates that reach 39pulses per second (pps) and a maximal recruitment thresholdof 67% of maximal voluntary contraction (MVC) (De Lucaet al 1982a, Seki et al 2007, De Luca and Hostage 2010,among others). In contrast, motor units of the biceps brachii(BB) muscle have been reported to have lower firing rates,5 Author to whom any correspondence should be addressed.
only reaching 26 pps and a maximal recruitment threshold of90% MVC (Kukulka and Clamann 1981, Seki and Narusawa1996, among others). There are three likely factors thatcan modulate the firing rate and recruitment range of motorunits among muscles. They are: (a) the excitation/inhibitionreceived from the central nervous system (CNS), (b) theexcitatory/inhibitory feedback from the peripheral nervoussystem, or (c) a combination of the two.
The dominant candidates for the feedback influence arethe Renshaw system, the proprioceptive system, consistingof muscle spindles and Golgi tendon organs (GTOs), andother sensors such as mechanoreceptors and joint receptors.Empirical evidence has been presented by Hultborn andPierrot-Deseilligny (1979) and Piotrkiewicz et al (2004)indicating that Renshaw cells have minor influence at low
1741-2560/12/016007+17$33.00 1 © 2012 IOP Publishing Ltd Printed in the UK
J. Neural Eng. 9 (2012) 016007 C J De Luca and J C Kline
force levels and an even lower influence at higher forces. Thesefindings are supported by modelling studies by Shoemaker andHannaford (1994) and Maltenfort et al (1998), which describethe gain of Renshaw cells as being negligible during constantforce isometric contractions. It is also known that when theproprioceptive feedback from GTOs and spindles is blocked,the firing rate of motoneurons decreases (Macefield et al 1993).That finding infers that excitatory inputs from spindles have astronger influence on motoneuron pool than inhibitory inputsfrom GTOs. If so, it is reasonable to hypothesize that thenumber of spindles present in a muscle would influence themotor unit firing rates. Consequently, we undertook to reviewthe literature and explore if a relationship exists between thefiring rates and the recruitment threshold range of motor units,with the number of spindles in a muscle.
2. Methods
2.1. Data collection
We searched the literature with two online journal searchengines: Google Scholar and PubMed. The following key-words were used along with each muscle name: firing rate,recruitment, motor unit, isometric contraction, number ofmuscle spindles, muscle weight and human muscle. Thekeywords were combined in different sequences to retrievethe maximal number of sources. The publication dates of theover 500 found articles ranged from 1884 to 2008. From these,79 studies that satisfied the following criteria were consideredfor data mining:
• Studies were published in peer-reviewed publications,with the exception of the muscle weight data from Theile(1884).
• Experiments were performed on healthy humans with noreported history of neurological disorders.
• Recording methods used to obtain the data were reported.• Number, gender and age of subjects studied were
provided.• All electromyographic (EMG) data were collected from
subjects less than 65 years of age.• Data were collected from individual muscles.• Number of observations made to determine the data values
were reported. If the data were reported as an average ofmultiple observations, the standard deviation or standarderror was provided.
• Motor unit firing rate data were acquired from EMGsignals during non-fatiguing, targeted constant-force (orforce plateau), isometric contractions.
• Motor unit recruitment data were acquired from EMGsignals during non-fatiguing, isometric contractionsranging from 0% to 100% MVC level.
The following information from studies meeting theinclusion criteria were tabulated: authors, number of subjects,methods, muscle, contraction level and the standard deviationand number of observations of each parameter value. Thesetables were compiled for the following parameters: muscleweight, number of muscle spindles, motor unit firing
rate, percentage of motor unit recruitment and maximumrecruitment threshold.
Parameters for individual muscles were provided bymultiple reports. The muscle weight was determined fromthe average value of dissected muscles from several humancadavers as outlined by Theile (1884). The number of spindlesin a muscle was determined by microscopically counting eachspindle from muscle slices (Cooper and Daniel 1949, Voss1937, among others). Motor unit firing rate data were reportedfrom constant-force isometric contractions at different forcelevels. The various studies reported the mean firing rate ofeach motor unit observed during the constant-force regionof each contraction for each subject. Representative valuesof the firing rate at a specified force level from each reportwere obtained by averaging the reported individual mean firingrate values across all motor units and subjects in each report.Following the work of De Luca and Hostage (2010), this metricwas selected because the averaged mean firing rate indicatesthe level of excitation received by the motoneuron pool andspecifies the operating point of all active motor unit firing rates.These firing rate values were grouped into one of the followingfive force ranges: 1%–10% MVC, 20%–30% MVC, 40%–60% MVC, 70%–80% MVC, 100% MVC. These groupingswere used because contractions studied in the literature weremost frequently within these force ranges.
The distribution of motor unit recruitment across theentire range of contraction forces was obtained for differentmuscles from various reports. The specific methods usedfor different muscles are detailed by Kukulka and Clamann(1981), Duchateau and Hainaut (1990), Feiereisen et al (1997),among others. These histograms indicated the number orpercentage of motor units recruited up to a certain forcelevel. They were typically obtained from slow linearlyvarying isometric ramp contractions reaching 100% MVC.We grouped the percentage of recruited motor units in thefollowing four force levels: 10% MVC, 25% MVC, 50%MVC and 75% MVC. The maximum recruitment thresholdcorresponds to the maximum force level beyond which nofurther motor unit recruitment occurred in the reported study.
2.2. Meta-analysis protocol
Each parameter was plotted as a function of the number ofmuscle spindles for all the muscles for which data were foundin the literature. One example of more than 50 plots generatedis shown in figure 1 which presents the motor unit firing ratesat 100% MVC, plotted as a function of the number of spindlesin different muscles. Each point plotted represents data fromtwo independent sources. The size of the data points relates tothe magnitude of a common weighting factor (wx,y) assignedto that point. Because the data were mined from studiesthat were performed with varying number of subjects andcontractions, the data for different muscles provided varyingdegrees of significance. In meta-analysis studies, this disparityis mitigated by assigning a singular weighting factor to boththe independent (wx) and dependent (wy) variable on the x andy axes.
The singular weighting factor (wx or wy) was calculatedas the inverse of the quotient of the coefficient of variation
2

J. Neural Eng. 9 (2012) 016007 C J De Luca and J C Kline
Muscle Spindles (#) 600 0 100 200 300 400 500
0
20
40
60
Ave
rag
ed M
ean
F
irin
g R
ate
(pp
s)
EI EHL ED BB SO TB VLVMTAAP FDI
Figure 1. Example of the motor unit firing rates plotted against thenumber of spindles across muscles. Each data point represents anaverage of all mean motor unit firing rates reported in a singlepeer-reviewed reference for a muscle with a specified number ofmuscle spindles. Circle size indicates the magnitude of theweighting factor of that data point (see text for details). Muscleswith data included in the plot are listed at the top of the plot andextended with dashed lines to the corresponding number of spindleson the horizontal axis. They are: FDI—first dorsal interosseous;EI–extensor indicis; AP–adductor pollicis; EHL—extensor hallucislongus; ED—extensor digitorum; TA—tibialis anterior; BB—bicepsbrachii; VM—vastus medialis; SO—soleus; VL—vastus lateralis;TB—triceps brachii. Confidence intervals of two standarddeviations (95.45%) are illustrated by bolder, non-vertical dashedlines. Data points outside of the confidence intervals were markedas outliers (indicated by the black circle) and excluded from furtheranalysis.
divided by the number of observations reported with eachdatum value. The coefficient of variation was used in placeof the standard deviation to account for the presence of largerstandard deviations with measurements of greater magnitude.In some studies, data were reported with a standard deviationof zero. In such cases it was assumed that a standard deviationcould have been measured, but was rounded down to zero.In those cases we assigned a value of 0.49, the lowest two-significant figure value that would be rounded-off to zero.Other reported data values were measured from only oneobservation and did not have a standard deviation. In suchcases, a singular weighting factor could not be assigned. Thesevalues were either excluded from the study, or kept if alldata values in a category were obtained from one observation.For the number of muscle spindles parameter, all data in theset were considered singletons and singular weighting factorswere not assigned to any of those data values.
The common weighting factor (wx,y) of each point in aplot was calculated from the x-axis data set singular weightingfactor (wx) and y-axis data set singular weighting factor (wy)as
wx,y = (w−2
x + w−2y
)−1/2.
If the data set plotted on the x-axis (independent variable)did not have an assigned singular weighting factor (wx) dueto the previously described statistical limitations, the finalcommon weighting factor (wx,y) of each datum point in theplot was set equal to the singular weighting factor of wy . Ifneither variable had an assigned singular weighting factor, a
unity common weighting factor (wx,y = 1) was assigned toall data points in the plot. The final common weight of eachdatum point was normalized to the mean common weightingfactor of the data set and then plotted.
A weighted linear regression was performed on theweighted data points. Confidence intervals were calculatedat two standard deviations (95.45%) about the regressionline as illustrated by the dashed lines in figure 1. Datapoints outside the confidence intervals were excluded fromfurther consideration. An example of excluded data isshown as a black datum point in figure 1. This method ofexclusion prevented outlier data from extraneous literaturereports from influencing the grouped data. A final weightedlinear regression was performed on the remaining data points.The parameters of the second regression analysis (not shownin figure 1) are reported in section 3 and were used for furtheranalysis.
3. Results
Data for the parameters used in this study are listed in table 1.A total of 26 muscles are included. The sources from whichthe data were obtained are listed in the appendix.
3.1. Firing rate (λavg)
Figure 2 presents the firing rate values at each of the fiveforce levels as functions of the number of spindles acrossdifferent muscles. The linear regression lines were calculatedas discussed in section 2. Excluding figure 2(d), the R2
values did not exceed 0.5. Such values are not uncommonfor meta-analysis studies due to the unknown, but likelyconsiderable, variability that exists across studies performedusing different methods on different subjects by differentresearchers. According to Rosenthal and Rosnow (1991),low R2 values in a meta-analysis do not limit the validityof the correlations and relationships portrayed by the data. Inthe plots, an inverse relationship between the firing rate andthe number of spindles was progressively more evident withincreasing force levels. With the singular exception of thelowest force level, the regressions demonstrated that musclescontaining more spindles had lower firing rates than muscleswith fewer spindles.
The regression lines from all force ranges studied wereplotted together in figure 2(f) where a progression of the slopeof the regression lines can be seen clearly. The regressionlines were plotted with a solid line over the region for whichspindle data were available from the literature. The dottedextensions of the regression lines are included to visuallyindicate the complete pattern of the behaviour of the firingrates as a function of number of spindles in the muscles. Itis apparent that the behaviour of the regression lines in figure2(f) changes with force level. Therefore, the firing rate ofmotor units in a muscle is a function of both the number ofmuscle spindles in that muscle and the force level of isometriccontraction. It can be modelled according to the followingequation:
λavg(ϕ, s) = m(ϕ)s + b(ϕ), (1)
3

J. Neural Eng. 9 (2012) 016007 C J De Luca and J C Kline
Table 1. Summary of all data collected in the meta-analysis performed in this study. The abbreviations refer to the following muscles:masseter (MA), orbicularis oculi (OO), lateral pterygoid (LP), platysma (Plat), trapezius (Trap), abductor digiti minimi (ADM), abductorpollicis brevis (APB), adductor pollicis (AP), anconeus (Anc), biceps brachii (BB), brachioradialis (BR), deltoid (DE), extensor carpiradialis (ECR), extensor carpi ulnaris (ECU), extensor digitorum (ED), extensor indicis (EI), flexor carpi radialis (FCR), first dorsalinterosseous (FDI), triceps brachii (TB), extensor hallucis longus (EHL), gastrocnemius (GA), rectus femoris (RF), soleus (SO), tibialisanterior (TA), vastus lateralis (VL), vastus medialis (VM). Each number in parentheses refers to the source reference listed in the appendixfrom which the data were obtained.
Number of Averaged firing rate (pps) Max REC Percentage of MU recruitment (%)
muscle <10% 20%–30% 40%–60% 70%–80% 100% threshold <10% 20%–30% 40%–60% 70%–80%Muscle spindles Weight (g) MVC MVC MVC MVC MVC (% MVC) MVC MVC MVC MVC
MA 114 (40) 27.4 (69) 35 (58) 52 (58) 97 (58) 100 (58) 100 (58)160 (27)
OO 4 (69) 18.3 (13)LP 6 (40) 8.3 7.4 (54) 17.8 (54)
14.8 (3)Plat 12.8 (69) 28.6 (13)Trap 437 (75) 201.2 (69) 11.2 (77) 17.8 (78)
12.9 (79) 17.2 (22)14.7 (78)
ADM 8.6 (69) 11.9 (67) 13.2 (67) 16.4 (67) 17.4 (67) 20.3 (67) 90 (68) 32 (68) 49 (68) 67 (68) 91 (68)APB 80 (57) 6.3 (69) 69 (70) 25 (70) 75 (70) 98 (70) 100 (70)AP 75 (57) 5.5 (69) 29.9 (4) 30 (19) 75 (19) 98 (19) 100 (19) 100 (19)
26.9 (6) 50 (42) 41 (42) 86 (42) 100 (42) 100 (42)35.4 (6)
Anc 11.2 (69) 10.3 (43) 10.5 (43)BB 320 (39) 163.9 (69) 11.4 (12) 9.8 (33) 10.8 (32) 14.3 (32) 16.5 (32) 90 (42) 6 (42) 47 (42) 80 (42) 96 (42)
13 (65) 18 (60) 20.8 (60) 26.2 (60) 31.1 (4)16 (46) 21.6 (60)
BR 70 (76) 67.4 (69) 18.3 (46)19.1 (8)
DE 182 (37) 355.7 (69) 14 (18)ECR 74 (76) 44.3 (69) 9.6 (66) 12.6 (14) 21 (15)ECU 157 (76) 25.3 (69) 15.2 (14) 23 (15)ED 219 (76) 42.8 (69) 27.4 (50)EI 68 (76) 7.1 (69) 27.1 (50)FCR 129 (76) 28.8 (69) 12 (64) 19 (64)FDI 34 (63) 9.3 (69) 10.4 (61) 18.3 (20) 19.4 (60) 32.3 (15) 29.3 (28) 35 (19) 65 (19) 92 (19) 100 (19) 100 (19)
10.2 (62) 13.5 (38) 26.1 (20) 31.1 (60) 30.4 (7) 78 (71) 42 (71) 79 (71) 93 (71) 98 (71)13.2 (78) 16.7 (60) 21.4 (9) 50.9 (36) 52 (17)
16.1 (78) 20.9 (15) 39 (59) 60 (36)18.7 (1) 24.3 (36) 67 (16)17.6 (15) 20.6 (45)
25.7 (60)18.7 (72) 24.6 (72)
TB 520 (39) 346.4 (69) 10.9 (43) 11.1 (29)10.7 (31)15.3 (43)
EHL 92 (74) 30.6 (69) 16.7 (44)GA 156 (74) 390.2 (69) 9.7 (53) 12.1 (53)RF 232 (76) 254.9 (69) 10.2 (49) 12.1 (49)
11.9 (48)SO 408 (74) 402.3 (69) 7.4 (41) 10.6 (41) 10.7 (4)TA 284 (74) 133.7 (69) 11.5 (53) 16.1 (11) 16.2 (21) 21.8 (5) 32.1 (5) 90 (26) 39 (26) 63 (26) 89 (26) 98 (26)
12.2 (11) 12.7 (24) 16.7 (5) 28 (11) 41.9 (11) 70 (21) 100 (21)12.7 (73) 11.3 (23) 15.5 (10) 31.3 (15) 28.1 (55) 90 (16)10.2 (25) 14.7 (53) 22 (11) 23.8 (21)
14 (73) 15.7 (13)15.6 (15) 19.1 (15)
21.4 (21)16.3 (73)
VL 440 (76) 607.3 (69) 8.7 (30) 9.1 (2) 18.5 (34) 20.8 (34) 25 (34) 95 (16)15.7 (34) 12.6 (35) 16.4 (35)10.1 (35) 14.1 (47)
16 (56)VM 350 (76) 427.5 (69) 8.8 (52) 10.5 (52) 14 (52) 18.5 (52) 23.8 (51)
26 (52)
where λavg is the firing rate in pps, s is the number of musclespindles in a muscle: 34 � s � 440 and ϕ is the normalizedMVC force: 0 < ϕ < 1.
The slope, m(ϕ), from figure 2(f) was plotted as a functionof normalized contraction force in figure 2(h). This force levelwas determined as an average of all force levels from each data
point in one plot (e.g. figure 2(a)). The standard error obtainedfrom the slope of each regression line in figure 2(f) is indicatedby the vertical lines in figure 2(h). The slope increases in alinear fashion as a function of contraction force, and may bedescribed as
m(ϕ) = Aϕ + B. (2)
4

J. Neural Eng. 9 (2012) 016007 C J De Luca and J C Kline
0 100 200 300 400 500 Muscle Spindles
600
0 100 200 300 400 500 6000
20
40
60
Muscle Spindles
Ave
rag
ed M
ean
F
irin
g R
ate
(pp
s)
(d)
0
40
60
20
Ave
rag
ed M
ean
F
irin
g R
ate
(pp
s)
(c)
0
20
40
60
Ave
rag
ed M
ean
F
irin
g R
ate
(pp
s)
(b)
0
20
40
60
Ave
rag
ed M
ean
F
irin
g R
ate
(pp
s)
(a)
0.2 0.8 1.0-0.05
-0.03
-0.02
-0.01
0.01
Slo
pe
0.4 0.6
0
-0.04
0
0 100 200 300 400 500 6000
10
20
30
40
Muscle Spindles
Ave
rag
ed M
ean
F
irin
g R
ate
(pp
s) 100 % MVC 70-80
40-60
20-30
10
1-10 % MVC y = 0.002x + 10.2 R2 = 0.042
20-30 % MVC y = -0.006x + 16.6 R2 = 0.158
40-60 % MVC y = -0.016x + 23.2 R2 = 0.430
70-80 % MVC y = -0.031x + 33.0 R2 = 0.528
100 % MVC y = -0.037 + 37.9 R2 = 0.461
(e)
(g)
(h)
20
30
40
50
10
Y-I
nte
rcep
t
0
(f)
Contraction Force (Normalized MVC)
Figure 2. Motor unit firing rates plotted as a function of the number of spindles across muscles. (a–e) Plots of the firing rate versus thenumber of spindles at each of five different force levels are presented. Circle size indicates the data point weight; black circles representoutliers excluded from the analysis. The force level, regression equation and R2 values are indicated on each plot. Note that each plot hasdata points for different muscles, depending on the data that could be mined from the literature. (f) The regression lines for the various forceranges are grouped together. The dashed continuations of some of the lines represent regions where no data were available. (g, h) The slopeand y-intercept of each regression line plotted as functions of normalized isometric contraction force. Vertical bars indicate the value of ±standard error. Regression statistics are described in the text and listed in table 2.
Table 2. Regression statistics of the y-intercept-force and slope-force regressions in figure 2 and equation (4) as well as those in figure 4 andequation (9).
Averaged firing rate and recruitment regression statistics
A = −0.041 ± 0.004 B = 0.003 ± 0.002 C = 37 ± 2.8 D = −0.60 ± 1.8 E = 0.13 ± 0.005 F = 0.17 ± 0.008 G = 9.8 ± 0.9
The MATLAB Curve Fitting Toolbox was used to obtain thevalues of the parameters A and B. The values which providedthe best fit are presented in table 2. The R2 value for the fitwas 0.981.
The intercepts of the regression lines in figure 2(f) werealso plotted as a function of normalized contraction force in
figure 2(g). The intercepts increase as a function of the squareroot of the force, and may be described as
b(ϕ) = C(ϕ)1/2 + D. (3)
The values of C and D were obtained with the MATLAB CurveFitting Toolbox and are presented in table 2. The R2 value forthe fit is 0.989.
5

J. Neural Eng. 9 (2012) 016007 C J De Luca and J C Kline
0 0.2 0.4 0.6 0.8 1.0
0100 200 300 400 500
0
10
20
30
40
Ave
rag
ed M
ean
F
irin
g R
ate
(pp
s)
Normalized MVC (ϕ) Spindles (#)
Figure 3. Firing rates of motor units as a function of the number ofspindles in a muscle and the normalized contraction force level.Data plotted comes from the model of motor unit firing rates inequation (5). The resolution of forces plotted is 0.05 normalizedMVC.
By substituting equations (2) and (3) into equation (1) weobtain the following equation that describes the relationshipfor the motor unit firing rate as a function of the number ofmuscle spindles and normalized isometric contraction force:
λavg(ϕ, s) = (Aϕ + B)s + C(ϕ)1/2 + D. (4)
When the parameter values from table 2 are replaced, theequation reduces to
λavg(ϕ, s) = (−0.041ϕ + 0.003)s + 37(ϕ)1/2 − 0.60. (5)
This equation predicts the firing rate of motor units in a muscleas a function of the isometric contraction force level, and thenumber of muscle spindles in that same muscle. Note thatthe equation is not precise because it is derived from a meta-analysis. For example, it fails at ϕ = 0, where it predicts −0.5pps for s = 34 (the FDI muscle) and 0.76 pps for s = 440 (theVL muscle). Nonetheless, it does provide a description of therelationship between the firing rate and the number of musclespindles in the muscles.
Equation (5) was used to compute the approximate firingrate data for muscles with different numbers of spindles acrossall levels of contraction force. The resulting distribution isshown in figure 3. The lowest computed firing rate is limited bythe 5% MVC incremental resolution of the force data availablefrom the literature. Ten muscles were used to generate thesurface in figure 3. These are: the first dorsal interosseous(FDI) with 34 spindles, the adductor pollicis (AP) with 75spindles, the flexor carpi radialis (FCR) with 129 spindles,the deltoid (DE) with 182 spindles, the rectus femoris (RF)with 232 spindles, the tibialis anterior (TA) with 284 spindles,the biceps brachii (BB) with 320 spindles, the vastus medialis(VM) with 350 spindles, the soleus (SO) with 408 spindlesand the vastus lateralis (VL) with 440 spindles.
The distributions of firing rates of three of these muscles,the FDI, TA and VL, have been studied by De Luca andHostage (2010). While the absolute values of the firing rates
0 0.5 1.0 1.5 2.0 2.5 3.0 3.5 4.0 0
20
40
60
Spindle Density (#/g)
Ave
rag
ed M
ean
F
irin
g R
ate
(pp
s)
10 20-30 40-60
70-80 100 % MVC
TB VL
VM BB TA
FDIBR
DE ECR
Figure 4. Firing rates of motor units plotted against the spindledensity. The force range of each regression line is shown on the plot.Muscles included in the plot are illustrated by vertically dashed linesand denoted by abbreviations listed above the plot. They are:DE—deltoid; VL—vastus lateralis; VM—vastus medialis;BR—brachioradialis; TB—triceps brachii; ECR—extensor carpiradialis; BB—biceps brachii; TA—tibialis anterior; FDI—firstdorsal interosseous. The dashed extensions of some regression linesindicate regions where no data were available from the literature.
extracted from their plots differ slightly from those shown infigure 3, their relative values demonstrate consistent behaviourwith the data herein. At low forces, all muscles, independent ofthe number of spindles, demonstrate the greatest increment infiring rate. At greater force levels, muscles having a relativelylow number of muscle spindles, such as the FDI, have largeincrements in firing rates, with diminishing but still substantialincrements at greater force levels (figure 3). In contrast,muscles with a relatively larger number of spindles, such asthe VL, maintain consistently smaller firing rate increments asshown by the diminishing slope of the firing rate distributionin figure 3.
A similar regression analysis was performed for thefiring rate as a function of spindle density. Figure 4 showsthe summary of five regression lines, each representing thepreviously specified force ranges. Note that the domain ofspindle density plotted was limited to 0–4 spindles per gram.Data lying beyond this range were not available for all forcelevels studied.
3.2. Motor unit recruitment
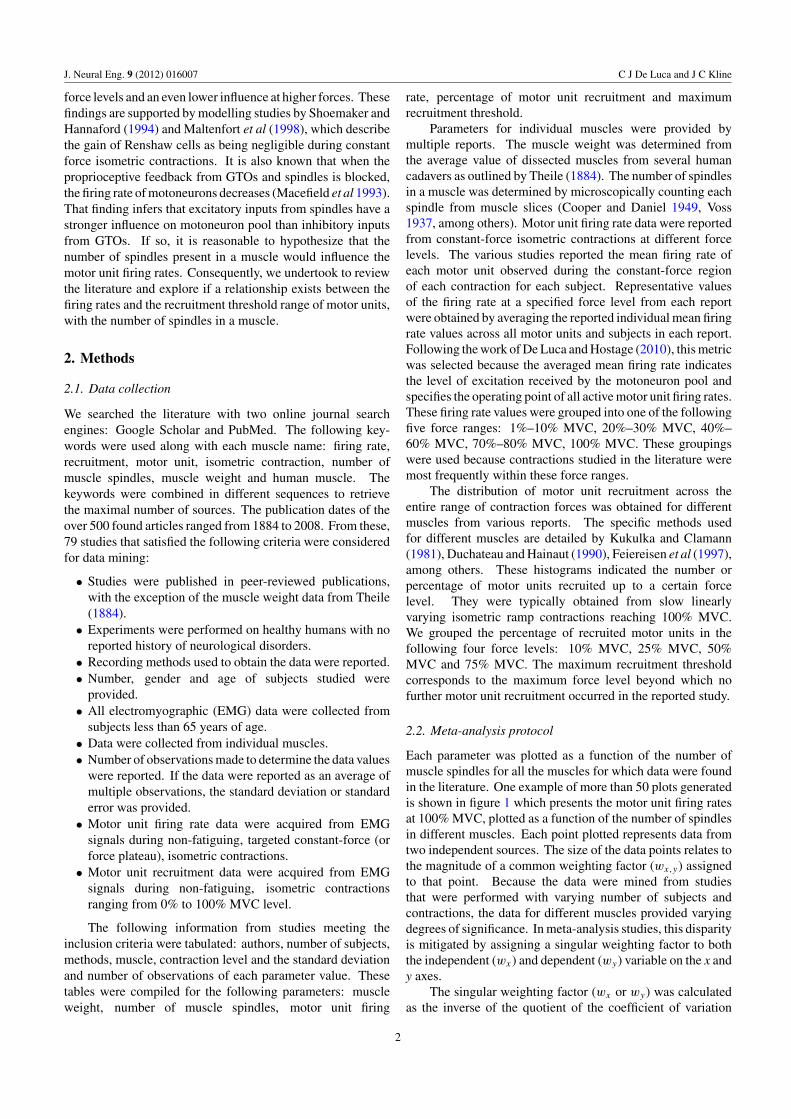
Figure 5 presents the percentage of motor units in a musclereported to be recruited at each of the four force levels analysedas functions of the number of spindles present in the muscle.A weighted linear regression analysis was performed on eachdata set. The regression lines for the different force levelsare plotted together in figure 5(e). As in the previous figures,the dotted extension of the regression lines are included tovisually indicate the complete pattern of the behaviour of thepercentage of recruited motor units as a function of numberof spindles in the muscles. As the number of spindles in amuscle increases, the percentage of recruited motor units ata specific force level decreases, and the slope decreases withincreasing force levels. At the highest force level considered(75% MVC), where most motor units in some muscles and
6
J. Neural Eng. 9 (2012) 016007 C J De Luca and J C Kline
0 100 200 300 4000
20
40
60
80
100
Spindles (#)
Rec
ruit
ed M
U (
%)
100
80
60
40
20
100
80
60
40
20
100
80
60
40
20
0 100 200 300 4000
20
40
60
80
100
Spindles (#)
(e)
(f)
10 % MVC y = -0.117x + 59.4 R2 = 0.357
(a)
50 % MVC y = -0.052x + 102.3 R2 = 0.598
75 % MVC y = -0.007x + 100.2 R2 = 0.291
(b)
(c)
(d)
(g)
75 % MVC
50
25
10
25 % MVC y = -0.123x + 97.6 R2 = 0.537
Contraction Force (Normalized MVC) 0 0.2 0.4 0.6 0.8 1.0
0
40
60
80
100
20
Y-I
nte
rcep
t
-0.2
-0.1
0.05
-0.05
0
-0.15
Slo
pe
5
5
0
5
0
0
0
Rec
ruit
ed M
U (
%)
Rec
ruit
ed M
U (
%)
Rec
ruit
ed M
U (
%)
Rec
ruit
ed M
U (
%)
Figure 5. Percentage of motor units recruited plotted as a function of the number of spindles across muscles. (a–d) Plots for the motor unitrecruitment versus the number of spindles at each of four different force levels are presented. Circle size indicates the data point weight;black circles represent outliers excluded from the analysis. The force level, regression equation and R2 value are indicated on each plot.Note that some plots have data points for different muscles, depending on the data that could be mined from the literature. (e) Regressionlines are grouped together with each force level indicated. (f, g) The slope and y-intercept of each line were plotted as functions of isometriccontraction force. Error bars indicate value ± standard error. Regression statistics are described in the text and shown in table 2.
all the motor units in other muscles have been recruited, theslopes of regression lines decrease and approach zero.
Consequently, the percentage of motor units recruited ina muscle during a given isometric contraction is a functionof both the number of muscle spindles in that muscle and theforce level of contraction. The relationship may be modelledaccording to the following equation:
%MU(s, ϕ) = m(ϕ)s + b(ϕ) (6)
where %MU is the percentage of motor units recruited, s is thenumber of muscle spindles in a muscle: 34 � s � 320 and ϕ
is the normalized MVC force: 0 < ϕ < 1.The slope, m(ϕ), from figure 5(e) was plotted as a function
of normalized contraction force in figure 5(g). In a mannersimilar to that used in the firing rate data, the force levelwas determined as an average of all force levels from eachdata point in one plot (e.g. figure 5(a)). The standard errorobtained from the slope of each regression line in figure 5(e) is
7
J. Neural Eng. 9 (2012) 016007 C J De Luca and J C Kline
0 5 10 15 0
20
40
60
80
100
Spindle Density (#/g)
Rec
ruit
ed M
U (
%)
10
25
50
75 % MVC
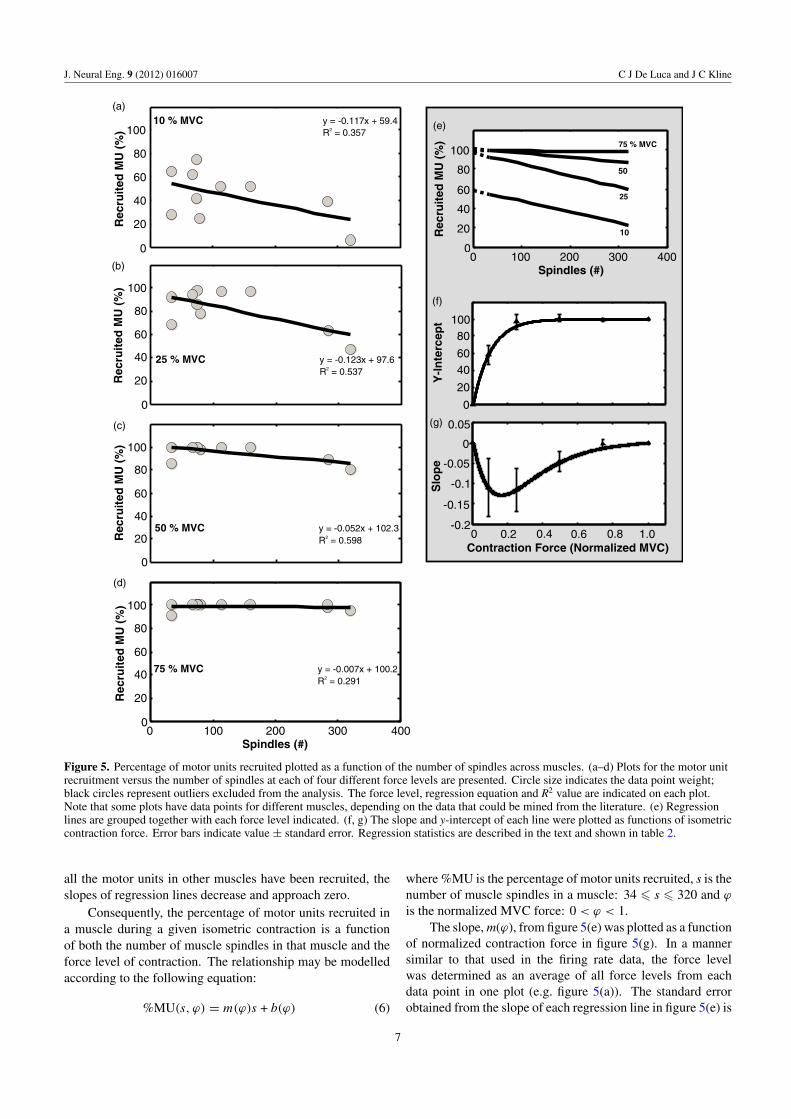
Figure 6. Percentage of motor units recruited plotted against thespindle density. The force level of each regression is indicated onthe plot. The dashed extensions of some regression lines indicateregions where no data were available from the literature.
indicated by the vertical lines in figure 5(g). The slope may beapproximated by exponential functions of the following form:
m(ϕ) = Eϕ/F(e(1−1/F ) − e(1−ϕ/F)
). (7)
The MATLAB Curve Fitting Toolbox was used to obtain thevalues of the parameters E and F. The values which providedthe best fit are presented in table 2. The R2 value for the fitwas 0.994.
The intercepts of the regression lines in figure 5(e) werealso plotted as a function of normalized contraction force infigure 5(f). The intercept also varies as an exponential functionof the contraction force, and may be described as
b(ϕ) = 100(1 − e−Gϕ)/(1 − e−G). (8)
The value of G is listed in table 2. The R2 value for the fit was0.995.
By substituting equations (7) and (8) into equation (6) weobtain the following equation that describes the relationshipfor the percentage of motor units recruited as a functionof the number of muscle spindles and normalized isometriccontraction force:
%MU(s, ϕ) = Eϕs/F(e(1−1/F ) − e(1−ϕ/F)
)
+ 100(1 − e−Gϕ)/(1 − e−G). (9)
When the average parameter values from table 2 are replaced,the equation reduces to
%MU(s, ϕ) = 0.0058sϕ(1−360e−5.9ϕ)+100(1−e−9.8ϕ).(10)
This equation predicts the approximate percentage of the totalnumber of motor units recruited in a muscle as functions ofthe isometric contraction force level and the number of musclespindles in that same muscle.
The percentage of motor units in a muscle that is recruitedat each of the four force levels was also examined as a functionof spindle density. The plot in figure 6 shows a reverserelationship to that obtained with the number of spindles.
3.3. Maximum recruitment threshold (τmax)
Plots of the maximum recruitment threshold versus the numberof spindles and spindle density are shown in figure 7. Weightedlinear regressions were determined for each data set. Bothplots have low R2 values due to the high variability of theavailable data. The regressions indicate that the maximumrecruitment threshold is directly related to the number ofspindles in a muscle (figure 7(a)) and is inversely related tothe muscle spindle density (figure 7(b)). Using figure 6(a), themaximum recruitment threshold was defined as a function ofthe number of spindles in a muscle by the following equation.
τmax = 46 + 0.11s, (11)
where τmax is the maximum motor unit recruitment thresholdand s is the number of muscle spindles 34 � s � 440.
The relationships between the firing rate and themaximum recruitment threshold of 22 different muscles, forwhich these parameter values were available, and the numberof spindles and spindle density are shown collectively infigure 8. The bar plot (figure 8(a)) indicates the spindledensity versus the number of spindles. The vertical dashedlines indicate the location of the individual muscles alongthe spindle spectrum. Figures 8(b) and (c) present the firingrates and the maximum recruitment threshold, respectively.Muscles like the FDI, which have fewer spindles and greaterspindle density, have higher motor unit firing rates and lowermaximum recruitment threshold. Muscles like the BB, withmore spindles and less spindle density, have lower motor unitfiring rates and a higher maximum recruitment threshold.
3.4. Density of motor unit recruitment as a function ofnumber of spindles
Given equation (10), the incremental percentage of motor unitsrecruited at any force level as a function of muscle spindlesmay be predicted. Figure 9 presents a graph of the relationship.In this figure, the trajectories are bounded by the maximalrecruitment threshold presented in figure 7(a). In figure 9 thelowest force threshold of motor unit recruitment is limited bythe 5% MVC resolution of contraction forces available fromthe literature.
The same ten muscles used to present the firing ratedistribution in figure 3 were also used to generate thesurface relating density of motor unit recruitment with thenumber of muscle spindles and isometric force level. Thedensities for four of these muscles, the FDI, AP, BB and TA,have been obtained empirically by Duchateau and Hainaut(1990), Kukulka and Clamann (1981) and Feiereisen et al(1997). Their recruitment histogram (density functions) arecomparable to our calculated data for the same four musclesin figure 9 and provide an indication that equation (10) isreasonably valid, given the limitations of the scattered datasources. The progression of recruitment densities relative toincreasing number of spindles in muscles shown in figure 9is useful for illustrating the change in the density function.(Note that a more accurate representation would require a setof empirical data obtained under uniform conditions.)
8

J. Neural Eng. 9 (2012) 016007 C J De Luca and J C Kline
(a) (b)
Spindles (#)
Th
resh
old
(%
MV
C)
Max
imu
m R
ecru
itm
ent
0 5 10 15Spindle Density (#/g)
0 100 200 300 400 5000
20
40
60
80
100 y = 0.11x + 46 R2 = 0.462
y = -2.8x + 77 R2 = 0.197
Figure 7. Regression analysis of the maximum recruitment threshold as a function of: (a) the number of muscle spindles, and (b) spindledensity. Circle size indicates the data point weight; filled circles represent outliers excluded from the analysis. The regression equation andR2 value are indicated on each plot.
It may be seen in figure 9 that muscles having a relativelylow number of muscle spindles, such as the FDI and the AP,have a recruitment threshold density function that may beapproximated by an exponential; meaning that the largestincrement of motor units is recruited at the lower (nearzero) force threshold, with diminishing increments recruitedat increasingly greater thresholds as shown by Freund et al(1975) and Duchateau and Hainaut (1990). Such musclesalso have a maximum recruitment threshold of about 50%to 60% MVC (Kukulka and Clamann 1981, De Luca et al1982a, De Luca and Hostage 2010). In contrast, muscles withrelatively large number of spindles, such as the soleus andVL, have a recruitment threshold density function that peaksat approximately 25% MVC, with decreasing increments oneither side, which are similar to the empirical data presentedby Kukulka and Clamann (1981). These muscles also havea maximum recruitment threshold up to 95% MVC as seenin both the predicted values in figure 9 and the empiricalobservations by De Luca and Hostage (2010).
4. Discussion
Meta-analysis studies have an inherent limitation due tothe lack of control over the homogeneity of the sourceand quality of the data. It is therefore impressive to findsubstantial correlations with acceptable R2 values amongseparately measured parameters. The reasonable R2 valuesand the orderly progression of the regression lines suggestthat a relationship exists between the regressed variablesand the number of spindles across muscles. These orderlyrelationships are a gratifying outcome of data points whichare obtained from different sources. The noise in the datadue to the diversity of the sources would tend to obscurerelationships among parameters. The fact that the regressionsof the data are not obliterated by the noise is an indication thatthe relationships are sound and may be taken as representingphysiological relationships.
The dominant finding of the study is the indication ofrelationships between muscle spindle feedback, contractionforce, motor unit firing rates and recruitment. Specifically,muscles with fewer spindles exhibit higher firing ratesand lower recruitment threshold range. In muscles with
more spindles, motor units have lower firing rates and agreater recruitment threshold range. These observations aresummarized in figure 8.
In contrast, the relationship between spindle density,firing rate and recruitment threshold range was generally,but not consistently, the opposite of that found with thenumber of spindles in individual muscles. This is likelydue to the fact that larger muscles, which have a greaternumber of motor units, also have a smaller spindle density.Figure 8(a) shows this trend, with the apparent exceptionof the FDI and the lateral pterygoid muscles. Even thoughlarger muscles have a greater number of spindles, they havea proportionally larger mass that does not necessarily beara progressive relationship to the number of spindles. Thus,the spindle density does not constitute a reliable independentvariable for the spindle feedback. This point is accentuated bythe relationship between the FDI muscle and the AP muscle.The FDI has a relatively low spindle density compared to theAP muscle, but still possesses a greater firing rate value andlower maximal recruitment threshold value. Consequently, thespindle number provides a better association with the motorunit control parameters.
Although, it is beyond the ability of a meta-analysisto establish causal relationships, the consistency of thecorrelations, across a diverse range of muscles, of the firingrates and recruitment threshold ranges with the degree ofspindle involvement provides a reasonable basis for suggestingthe existence of a mechanism for their interaction. An insightinto the behaviour of firing rates and mechanisms associatedwith the recruitment of motor units has been provided bythe work of Broman et al (1985) and of Westgaard and DeLuca (2001). Both studies found that when a motor unitwas recruited during slow varying isometric contractions, thefiring rates of previously active motor units decreased. Theobservation was more apparent when the rate of force increasewas relatively slow (<1% MVC s−1). They suggested that thisphenomenon could result from the influence of the feedbackfrom the GTOs and muscle spindles.
When the primary and secondary endings in the musclespindles are stretched they provide an excitatory (positive)feedback, via the type Ia and type II fibres, to virtually allof the motoneurons in the homonymous motoneuron pool
9

J. Neural Eng. 9 (2012) 016007 C J De Luca and J C Kline
100 % MVC 70-80
40-60
20-30
10
0 100 200 300 400 500
80
60
40
20
0
(b)
MA GA
SO VL VM
BB TA
ED FDI
ECU
FCR EI DE
(a)
Trap RF MA
LP BR ECR
AP APB
(c) 100
Spindles (#)
Th
resh
old
(%
MV
C)
Max
imu
m R
ecru
itm
ent
0
20
40
Ave
rag
ed M
ean
F
irin
g R
ate
(pp
s)
Sp
ind
le D
ensi
ty (
#/g
)
0
5
15
10
Figure 8. Muscle spindle density, firing rate, and maximumrecruitment threshold plotted against the number of spindles in amuscle. (a) The bar plot includes spindle data from each of 20human muscles, which are indicated by arrows above the bar plot.The abbreviations refer to the following muscles: LP—lateralpterygoid; FDI—first dorsal interosseous; EI—extensor indicis;BR—brachioradialis; ECR—extensor carpi radialis; AP—adductorpollicis; APB—abductor pollicis brevis; MA—masseter;FCR—flexor carpi radialis; GA—gastrocnemius; ECU—extensorcarpi ulnaris; DE—deltoid; ED—extensor digitorum; RF—rectusfemoris; TA—tibialis anterior; BB—biceps brachii; VM—vastusmedialis; SO—soleus; VL—vastus lateralis; Trap—trapezius.(b) Firing rate and (c) maximum recruitment threshold plots weretaken from the data in figures 2(f) and 8(a), respectively. Verticaldashed lines are superimposed to show the observed motor unitfiring rates and maximum recruitment threshold of the motor unitsof several muscles in the bar plot.
(Mendell and Henneman 1971, Scott and Mendell 1976,Watt et al 1976, among others). It is also known thatwhen the GTOs are stretched they provide a disynaptic non-reciprocal inhibition (negative) feedback, via type Ib fibres,to the homonymous motoneurons. It has been shown byBinder et al (1977) and verified by Edin and Vallbo (1990)that the Ib fibres respond to tension generated by individual
0 0.2 0.4 0.6 0.8 1.0
0 100 200 300 400 500
0
10
20
30
40
Normalized MVC (ϕ)
Rec
ruit
ed M
U (
%)
Spindles (#)
Figure 9. Motor unit recruitment density as a function of thenumber of spindles in a muscle and the normalized contraction forcelevel. Data plotted come from the model of motor unit recruitmentin equation (10) and adjusted for noise by the regression equation ofmaximal recruitment threshold in figure 6(a). The resolution offorces plotted is 0.05 normalized MVC.
motor units. We cannot estimate the relative contribution ofthe GTOs to the proprioceptive negative feedback becausevirtually no information is available on their performance inhumans. However, it is known from the work of Gandevia et al(1990) and Macefield et al (1993) that the disynaptic feedbackpath of the Ib fibres from the GTOs is less effective than themonosynaptic path of the Ia fibres from the spindles. Forthese reasons and because reports of spindle counts are readilyavailable for many muscles, we will continue the discussionby expressing the influence of the proprioceptive feedback asa function of the number of spindles in a muscle.
There are several other aspects of the spindle mechanismthat might influence the excitation to the motoneuron pool,but they also are not well understood. For example, theinvolvement of the type II spindle afferents is also uncertain.While type II spindle afferents connect to motoneurons in a yetunclassified array of mono-, di- and polysynaptic connections,and could have disparate influence on the motoneuron pool,studies by Stauffer et al (1976) and Munson et al (1982)suggest that their inputs elicit effects consistent with those ofprimary spindle afferents. Other inputs such as those frompresynaptic inhibition of spindle afferents are also presentwithin a motoneuron pool, but according to Hultborn et al(1987) and Pierrot-Deseilligny (1997) they are weak amongstmotoneurons of active muscles; only having a strong effecton the synapses of motoneurons of surrounding inactivemuscles. Heteronymous primary spindle afferent input tothe contracting muscle may also be influential. Increasesin spindle feedback tend to be excitatory when originatingfrom synergists and inhibitory when from antagonists (Ashbyand Labelle 1977, Mao et al 1984, Bayoumi and Ashby1989, among others). However, Chalmers and Bawa (1977)have shown that primary muscle spindle input does not existbetween all synergists. Meunier et al (1990) and Creangeet al (1992) have demonstrated that this feedback is not
10

J. Neural Eng. 9 (2012) 016007 C J De Luca and J C Kline
limited to muscles acting on the same joint, but can originatefrom muscles across two joints. These few characterizationsnotwithstanding, a quantifiable classification of heteronymousmuscle spindle input has yet to be determined. An additionalvariable is the size and quanta of excitatory post synapticpotentials (EPSPs) released by each spindle synapse on amotoneuron. Although an all-inclusive distribution of EPSPsin motoneurons has yet to be documented, studies by Mendelland Henneman (1971) and Sypert et al (1980) indicate thatEPSPs are stronger in primary than secondary afferents andtheir overall strength is related to the afferent’s conductionvelocity.
While these and other variables exist within a motoneuronpool, the extent of their presence is weakly substantiated inthe literature, and some remain speculative. Therefore, whileacknowledging the existence of other spindle variables thatcould affect the firing behaviour of motor units, our discussionwill focus on the currently characterized and substantiallyclassified neural interactions; that is, those between primarymuscle spindle afferents and motoneurons.
We now propose an explanation for our data based ona mechanical interaction between muscle fibres and nearbyspindles, with special emphasis on the characteristics of themechanical coupling when a muscle fibre is recruited, as partof a motor unit, and when it is substantially activated asthe contraction increases. Consider the following plausiblesequence of events unfolded in figure 10. When a motorunit is recruited during a contraction, including an isometriccontraction, muscle fibres of the recruited motor unit fire at alow firing rate and they cycle through a series of contractionsand relaxations where the sequential force twitches do notoverlap, as shown in figure 10(a). The nearby muscle spindles,greater than 90% of which are arranged in parallel to the musclefibres (Binder and Stuart 1980, Burke et al 1987), slacken asthe muscle fibre contracts and lengthen as the muscle fibresrelax. The diagrams in figure 10(a) show three states thatoccur throughout the duration of a muscle fibre contractioninduced by a force twitch. In state (1) the muscle fibres areat rest and the spindle is at rest. As a new α-motoneuron isrecruited, a pulse activates the muscle fibres of the associatedmotor unit. It has been suggested by Vallbo (1974), Burkeet al (1979), Edin and Vallbo (1990), and others that the γ -motoneurons are excited along with the α-motoneuron. Thissimultaneous occurrence is also predicted by the ‘commondrive’ property proposed by De Luca et al (1982b) and De Lucaand Erim (1994) and confirmed independently by Semmler andNordstrom (1997), Marsden et al (1999), among others. Thus,γ -motoneurons to spindles adjacent to the newly recruitedmuscle fibres are also activated causing the intrafusal fibresof the spindle to contract. When a pulse arrives from the α-motoneuron, the muscle fibre(s) begin to shorten, the nearbyspindle(s) slacken (state 1–2) and the Ia fibres are positionedto respond to a stretch of the intrafusal fibres. In the transitionfrom state 2 to 3, the muscle fibre relaxes to its original length.In so doing, it stretches the taught spindle. The intrafusalfibres are stretched and the Ia fibres fire.
At low force levels, the earlier-recruited motor units arenot tetanized and influence the length of adjacent spindles.
The spindle shortening produces the fast increasing excitatoryfeedback to the homonymous motoneurons, as reported byMacefield et al (1991) and shown by the solid line in thecartoon of spindle feedback in figure 10(c). In this non-overlapping region (the shaded regions in the range of 0 to10% MVC) the work of Broman et al (1985) displayed asa cartoon in figure 10(d) showed that during a very-slowincreasing (1.5% MVC s−1) isometric contraction, the firingrates of motor units #1 and #2 increased continuously up to10% MVC. This behaviour indicates that the excitation fromthe spindle was additive to the slow increasing excitation fromthe CNS.
As the excitation to the motoneuron increases, the firingrates of the motor units increase and the force twitches overlap(figure 10(b)). The muscle fibres assume a shorter length andthe adjacent spindles slacken (state 1–2 in figure 10(b)). Thesequence in figure 10(a) is repeated, except that the degree ofshortening and lengthening of the muscle fibres and spindlesbecomes increasingly smaller as the firing rate increases. Theintrafusal fibres are stretched over a shorter distance and theIa firings decrease, as shown in figure 10(b). According toMacefield et al (1991), in this range the firings of the Iafibres decrease and the excitatory feedback to the homonymousmotoneurons decreases. (See dashed line segment and non-shaded regions in figure 10(c).) The effects of this behaviourare seen in the non-shaded regions of figure 10(d). When theexcitation to motor unit #2 passes the 10% MVC level, thefiring rate of the previously recruited motor unit #1 decreaseswith respect to that of motor unit #2; and when motor unit #3is recruited at above 10% MVC, the firing rates of motor units#1 and #2 begin to decrease as the force continues to increaseslowly. This behaviour occurs while the rate of force increaseis similar to where motor units #1 and #2 were recruited.Thus, with similar increases of excitation from the CNS, thefiring rates of motor units #1 and #2 decrease, implying thatexcitation from the spindles is decreasing. This interpretationis consistent with the presence of decreasing excitation fromthe spindles as reported by Macefield et al (1991) and shownby the dashed line in figure 10(c).
The above explanation may seem to be in conflict with the‘common drive’ property (De Luca et al 1982b, De Luca andErim 1994, De Luca and Hostage 2010 among others) whichstates that when the net excitation (central and peripheral,including from spindles) increases the firing rates of earlierrecruited motor units should increase rather than decrease asin the example reported by Broman et al (1985) shown in figure10. This apparent inconsistency may be explained as follows.In the special force paradigm used by Broman et al (1985)the target force was increased slowly (less than 0.1% MVCs−1). During this interval, at least one (observed) and possiblyother (unseen) motor units were recruited. They influencethe spindles near their fibres to provide negative feedbackand cause the firing rates of previously active motor unitsto decrease. The newly recruited motor units have greaterforce twitches and provide the necessary force to overcomethe reduced force of the earlier recruited motor units. Thisphenomenon is evident because in figure 10 the rate of increaseof the excitation is very slow. This is a discrete micro effect
11

J. Neural Eng. 9 (2012) 016007 C J De Luca and J C Kline
(b) Non-Overlapping State Overlapping State
Muscle Fibre Force
Tim
e
Ia γ mn
α mn
Ia γ mn
α mn
Ia γ mn
α mn
1
2
3
Ia γ mn
α mn 1
2
3 Ia γ mn
α mn
Ia Firing Rate
Co
ntr
acti
on
Fo
rce
(% M
VC
)
Time
α m
n F
irin
g R
ate
(pp
s)
(c)
MU 1
MU 2
MU 3
10
Muscle FibreForce
Tim
e
20 20
10
30 30
10
5
(a)
(d)
Force
0 0
Figure 10. Sequence of events that connects the mechanical influence of newly recruited muscle fibres on the near-by spindles. Note that asa matter of convenience the force level of 10% MVC is used as a demarcation point between non-overlapping and overlapping forcetwitches. Motoneuron (mn) and spindle behaviour below the 10% MVC level are shaded grey while activity above the 10% MVC point isnot shaded. The actual MVC cut-off level would depend on the force twitch duration and the firing rate characteristics of the muscle. (a)When a motoneuron is recruited it fires with low firing rates. At firing rates that correspond to average inter-pulse intervals longer than thetime duration of the force twitches (commonly at force levels <10% MVC), muscle fibre force twitches contract without sequentialinteraction. The muscle fibres shorten and lengthen with each subsequent excitation. A mechanically coupled spindle in the vicinity of themuscle fibres first shortens (slackens) and then is stretched with each sequential excitation. As the spindle stretches, the Ia excitationincreases. We refer to this situation as the non-overlapping state. (b) As the excitation to the motoneuron increases, the firing rates increaseand when average inter-pulse intervals become shorter than the time duration of the force twitches (commonly at force levels >10% MVC),subsequent muscle fibre force twitches overlap and the spindle shortens (slackens) because the force twitch cycle does not return to theresting state. The muscle fibres shorten, the spindles slacken, and the Ia excitation decreases. We refer to this as the overlapping state. (c)The cartoon describes the observation of Macefield et al (1991). Note that the Ia excitation (shaded regions and solid line) increases up toabout 10% MVC and subsequently decreases (non-shaded regions and dashed line). The increasing Ia excitation is caused by the stretchingof the spindle in the non-overlapping state. As the spindle enters the overlapping state, the range of the stretching decreases and the Iaexcitation decreases, as shown with the dashed line. (d) A cartoon of firing rates of motor units recruited during slow increasing isometricforce in the TA muscle as observed by Broman et al (1985). Note that in the shaded regions of the plot, when motor unit #2 is recruited,below 10% MVC, the firing rates of both motor units #1 and #2 increase. In the non-shaded regions, when motor unit #3 is recruited above10% MVC, the firing rates of both motor units #1 and #2 begin to decrease. The firing rate profiles behave according to the profile of the Iaexcitation in (c). (Note: (c) is a cartoon of figure 2 from Macefield et al (1991) and (d) is redrawn from figure 5 of Broman et al (1985).
12

J. Neural Eng. 9 (2012) 016007 C J De Luca and J C Kline
that is temporarily inconsistent with the general concept ofthe common drive when expressed on a macro scale. It isnoteworthy to point out that the micro effect is quickly over-ridden when the excitation increases to provide additionalforce as may be seen in figure 1 in Broman et al (1985).In so doing, the relationship of the common drive becomesevident.
Although they are mostly considered as secondary factors,the GTOs also respond to the muscle fibre shortening bystretching, and the Ib fibres increase their firing rate. Thisaction provides an increasing inhibitory or negative feedbackto the homonymous motoneurons. Therefore, the combinednegative feedback from the muscle spindles and the GTOselicited by the recruitment of a motoneuron decreases the totalexcitation to the motoneuron pool. As a result the rate ofincrease of the firing rate will decrease.
A similar explanation involving the proprioceptivefeedback from spindles was also used by De Luca et al(2009) to explain the modulation of the common driveduring sustained isometric contractions. In the light ofthis explanation, the involvement of the Renshaw systemfor explaining the decrease in the firing rate of motor unitssubsequent to the recruitment of new motor units in Westgaardand De Luca (2001) needs to be reconsidered.
Now let us return to the data in figure 2. Note that infigure 2(a) the firing rate values at the force levels of 1%to 10% MVC remain essentially invariant to the number ofspindles. Considering the above argument, as the force levelincreases in the 10% MVC range, most active spindles in amuscle exist in the dynamic state and send positive feedback(increasing excitation) to the homonymous motoneuron pool.According to Freund et al (1975) and Duchateau and Hainaut(1990), and as may be seen in figure 9, in muscles such as theFDI, about 50% of the motor units in the muscle are recruitedin the 0%–10% MVC range. In contrast, in muscles withmore spindles, like the BB, only 5%–10% of the motor unitsare recruited in the same force range (Kukulka and Clamann1981). This difference between the FDI and the other musclesis clearly seen in figure 9. Although the BB has nearly tentimes the number of spindles of the FDI, only one-tenth of itspopulation is recruited resulting in about the same number ofspindles activated in both muscles at forces within the 10%MVC range. Hence, the amount of positive feedback to therespective motoneurons is more or less similar. Consequently,in the 10% MVC range the firing rates of the motoneuronsremain unaffected by the number of spindles in the muscle.
As the excitation to the motoneuron pool increases further,the firing rates increase and the muscle fibre force twitchesbegin to overlap; the spindles become fixed in a slackened state(figure 10(b)). The excitatory feedback from muscle spindlesis now less than it was previously during the dynamic spindlestate. This decrease in excitation is equivalent to a negativefeedback to the homonymous motoneurons. The degree ofthe negative feedback increases with increasing overlap ofthe force twitches. It follows that the greater the number ofspindles in the muscle, the greater the negative feedback, thelower the firing rate and the greater the maximal motor unitrecruitment threshold. The inverse relationship between the
firing rate and number of spindles is evident in figures 2(b)–(e) at each force level above 10% MVC and it is defined byequation (5).
Equation (5) also predicts that if a muscle hasapproximately 700 spindles, the firing rates of the motor unitsin the force range of 10% to 100% MVC would convergeat 12 pps, as is evident in figure 2(f). At this point, thedecreasing excitation from the spindles activated below the10% MVC range is approximately equal to the increasingexcitation of the common drive (described by De Luca et al(1982b), and De Luca and Erim (1994)) to the motoneuronpool. This interpretation indicates that the interplay betweenthe increasing and decreasing excitations of approximately700 spindles in one muscle is approximately equal to the netincrease of excitation from the CNS between 10% and 100%MVC. It would be interesting to test this prediction, but nosuch muscle exists. The longissimus thoracis muscle has beenreported to have 1193 spindles (Voss 1963). But that musclereceives innervations from several spinal cord levels and is bestdescribed as having several motoneuron pools, thus it does notprovide a test case for the inference. The one muscle thatapproximates the condition is the gluteus maximus, which has629 spindles (Voss 1959). We found no firing rate data for thismuscle in the literature.
The slope of the inverse relationship between the firingrate and the number of spindles increases as the contractionlevel increases (see figure 2). This behaviour may be accountedfor by the motor unit recruitment densities shown as afunction of the contraction force in figure 9. In muscleswith a low number of spindles, the negative feedback to themotoneuron pool is greater at lower force levels, diminishesquickly and ends at relatively lower force levels where themaximal recruitment threshold is reached. For muscles witha relatively large number of spindles, the negative feedbackpersists throughout a greater force range, thus reducing thefiring rate of the earlier recruited motor units to a greaterextent. This behaviour is evident in the firing rate equation(5) which states that muscles with smaller number of spindles,such as the FDI, would have on average a maximum meanfiring rate of 35.1 pps, and for those with relatively largernumber of spindles, such as the VL, the maximal firing ratewould be 19.7 pps.
The relationship between the maximal recruitmentthreshold and the number of spindles in a muscle is providedby equation (11). According to this equation, if a musclecontains no spindles (or if the spindles were dysfunctional)the maximal recruitment threshold would be approximately50% MVC, a number not too far from that reported in muscleswith relatively few spindles such as the FDI. Those withlarge number of spindles, such as the VL, would have highermaximal recruitment threshold, in the range of 95% MVC, avalue consistent with that observed by De Luca and Hostage(2010).
The data for the recruitment of motor units collected alsoenabled the derivation of the density function of the numberof recruited motor units as a function of number of musclespindles and force level. The values of the density functioncompare well with those reported by Freund et al (1975) and
13

J. Neural Eng. 9 (2012) 016007 C J De Luca and J C Kline
Duchateau and Hainaut (1990) for the FDI which has theform of a negative exponential function as may be seen infigure 9 for low values of spindles (34), and by Kukulka andClamann (1981) for the BB, which has the form of a morewidely distributed function having a peak at the lower end ofthe spindle distribution, as may be seen in figure 9 when thevalue of the spindle is 320.
In conclusion, motoneurons of muscles with greaternumber of spindles receive greater negative feedback whichreduces their firing rates, increases their maximal recruitmentthreshold and changes the distribution of motoneuronrecruitment over the force range.
Acknowledgments
We are grateful to Dr Michael LaValley for the assistancehe provided in constructing the statistical analysis used toperform the meta-analysis, and to Dr Serge H Roy for hisguidance on general statistical procedures. This work wassupported in part by Bioengineering Research Partnership(BRP) grants HD050111 from the NCMRR/NICHD/NIH,BRP grant NS058250 from NINDS/NIH, and grant NS 058250from NINDS/NIH to Altec Inc.
Appendix
Database sources
(1) Adam A, De Luca C J and Erim Z 1998 Handdominance and motor unit firing behavior J. Neurophysiol.80 1373–82
(2) Adam A and De Luca CJ 2005 Firing rates of motorunits in human vastus lateralis muscle during fatiguingisometric contractions J. Appl. Physiol. 99 268–80
(3) Aoki S, Uchida S and Inoue H 2005 Fatigue-relatedchanges in discharge patterns of motor units in the inferiorhead of the lateral pterygoid muscle in humans Arch. OralBiol. 50 727–37
(4) Bellemare F, Woods J J, Johansson R and Bigland-RitchieB 1983 Motor-unit discharge rates in maximal voluntarycontractions of three human muscles J. Neurophysiol. 501380–92
(5) Bigland-Ritchie B, Furbush F, Gandevia S C and ThomasC K 1992 Voluntary discharge frequencies of humanmotoneurons at different muscle lengths Muscle andNerve 15 130–7
(6) Bigland-Ritchie B, Johansson R, Lippold O C J, SmithS and Woods J J 1983 Changes in motoneurone firingrates during sustained maximal voluntary contractionsJ. Physiol. 340 335–46
(7) Bigland-Ritchie B, Thomas C K, Rice C L, HowarthJ V and Woods J J 1992 Muscle temperature, contractilespeed, and motoneuron firing rates during humanvoluntary contractions J. Appl. Physiol. 73 2457–61
(8) Calder K M, Stashuk D W and McLean L 2008Physiological characteristics of motor units in thebrachioradialis muscle across fatiguing low-levelisometric contractions J. Electromyography Kinesiology18 2–15
(9) Carpentier A, Duchateau J and Hainaut K 2001 Motorunit behaviour and contractile changes during fatigue inthe human first dorsal interosseus J. Physiol. 534 903–12
(10) Christie A and Kamen G 2009 Motor unit firing behaviorduring prolonged 50% MVC dorsiflexion contractions inyoung and older adults J. Electromyography Kinesiology19 543–52
(11) Connelly D M, Rice C L, Roos M R and Vandervoort A A1999 Motor unit firing rates and contractile properties intibialis anterior of young and old men J. Appl. Physiol.87 843–52
(12) Dartnall T J, Nordstrom M A and Semmler J G 2008Motor unit synchronization is increased in biceps brachiiafter exercise-induced damage to elbow flexor musclesJ. Neurophysiol. 99 1008–19
(13) De Luca C J, Adam A, Wotiz R, Gilmore D andNawab S H 2006 Decomposition of surface EMG signalsJ. Neurophysiol. 96 1646–57
(14) De Luca C J and Erim Z 2002 Common drive inmotor units of a synergistic muscle pair J. Neurophysiol.87 2200–4
(15) De Luca C J, Foley P J and Erim Z 1996 Motor unitcontrol properties in constant-force isometric contractionsJ. Neurophysiol. 76 1503–16
(16) De Luca C J and Hostage E C 2010 Relationship betweenfiring rate and recruitment threshold of motoneuronsin voluntary isometric contractions J. Neurophysiol.104 1034–46
(17) De Luca C J, LeFever R S, McCue M P andXenakis A P 1982 Behaviour of human motor units indifferent muscles during linearly varying contractionsJ. Physiol. 329 113–28
(18) De Luca C J, LeFever R S, McCue M P and XenakisA P 1982 Control scheme governing concurrentlyactive human motor units during voluntary contractionsJ. Physiol. 329 129–42
(19) Duchateau J and Hainaut K 1990 Effects ofimmobilization on contractile properties, recruitment andfiring rates of human motor units J. Physiol. 422 55–65
(20) Erim Z, Beg M F, Burke D T and De Luca C J 1999 Effectsof aging on motor-unit control properties J. Neurophysiol.82 2081–91
(21) Erim Z, De Luca C J, Mineo K and Aoki T 1996 Rank-ordered regulation of motor units Muscle and Nerve19 563–73
(22) Falla D and Farina D 2008 Motor units in cranialand caudal regions of the upper trapezius muscle havedifferent discharge rates during brief static contractionsActa Physiol. Scand. 192 551–8
(23) Farina D, Arendt-Nielsen L and Graven-Nielsen T 2005Experimental muscle pain reduces initial motor unitdischarge rates during sustained submaximal contractionsJ. Appl. Physiol. 98 999–1005
(24) Farina D, Arendt-Nielsen L, Merletti R and Graven-Nielsen T 2002 Assessment of single motor unitconduction velocity during sustained contractions of thetibialis anterior muscle with advanced spike triggeredaveraging J. Neurosci. Methods 115 1–12
14

J. Neural Eng. 9 (2012) 016007 C J De Luca and J C Kline
(25) Farina D, Arendt-Nielsen L, Merletti R and Graven-Nielsen T 2004 Effect of experimental muscle painon motor unit firing rate and conduction velocityJ. Neurophysiol. 91 1250–9
(26) Feiereisen P, Duchateau J and Hainaut K 1997 Motorunit recruitment order during voluntary and electricallyinduced contractions in the tibialis anterior Exp. BrainRes. 114 117–23
(27) Freimann R 1954 Untersuchungen uber zahl undanordnung der muskelspindeln in den kaumuskeln desmenschen Anatomischer Anzeiger 100 258–64
(28) Gandevia S C, Macefield G, Burke D and McKenzie D K1990 Voluntary activation of human motor axons in theabsence of muscle afferent feedback Brain 113 1563–81
(29) Garland S J, Griffin L and Ivanova T 1997 Motor unitdischarge rate is not associated with muscle relaxationtime in sustained submaximal contractions in humansNeurosci. Lett. 239 25–8
(30) Grande G and Cafarelli E 2003 Ia afferent input alters therecruitment thresholds and firing rates of single humanmotor units Exp. Brain Res. 150 449–57
(31) Griffin L, Ivanova T and Garland S J 2000 Role of limbmovement in the modulation of motor unit dischargerate during fatiguing contractions Exp. Brain Res. 130392–400
(32) Gydikov A and Kossarov D 1974 Some features ofdifferent motor units in humans biceps brachii PflugersArchiv; Eur. J. Physiol. 347 75–88
(33) Hu X L, Tong K Y and Hung L K 2006 Firing propertiesof motor units during fatigue in subjects after strokeJ. Electromyography Kinesiology 16 469–76
(34) Jakobi J M and Cafarelli E 1998 Neuromuscular driveand force production are not altered during bilateralcontractions J. Appl. Physiol. 84 200–6
(35) Kalmar J M and Cafarelli E 1999 Effects of caffeine onneuromuscular function J. Appl. Physiol. 87 801–8
(36) Kamen G, Sison S V, Du C C D and Patten C 1995 Motorunit discharge behavior in older adults during maximal-effort contractions J. Appl. Physiol. 79 1908–13
(37) Kiesewetter G 1959 Untersuchengen uber zahl,anordnung und lange der muskelspindeln in denschultermuskeln des menschen Anatomischer Anzeiger106 285–8
(38) Knight C A and Kamen G 2004 Enhanced motor unitrate coding with improvements in a force-matching taskJ. Electromyography Kinesiology 14 619–29
(39) Korner G 1960 Untersuchungen uber zahl, anordnungund lange der muskelspindeln in einigen schulterdenoberarmmuskeln und im musculus sternalis des menschenAnatomischer Anzeiger 108 99–103
(40) Kubota K and Masegi T 1977 Muscle spindle supply tothe human jaw muscle J. Dental Res. 56 901–9
(41) Kuchinad R A, Ivanova T D and Garland S J 2004Modulation of motor unit discharge rate and h-reflexamplitude during submaximal fatigue of the human soleusmuscle Exp. Brain Res. 158 345–55
(42) Kukulka C G and Clamann H P 1981 Comparison ofthe recruitment and discharge properties of motor unitsin human brachial biceps and adductor pollicis duringisometric contractions Brain Res. 219 45–55
(43) Le Bozec S and Maton B 1987 Differences betweenmotor unit firing rate, twitch characteristics and fibre typecomposition in an agonistic muscle group in man Eur. J.Appl. Physiol. 56 350–5
(44) Macefield V G, Fuglevand A J, Howell J N and Bigland-Ritchie B 2000 Discharge behavior of single motor unitsduring maximal voluntary contractions of a human toeextensor J. Physiol. 528 227–34
(45) Masakado Y, Kamen G and DeLuca C J 1991 Effects ofpercutaneous stimulation on motor unit firing behavior inman Exp. Brain Res. 86 426–32
(46) Maton B and Gamet D 1989 The fatigability oftwo agonistic muscles in human isometric voluntarysubmaximal contraction: an EMG study Eur. J. Appl.Physiol. 58 369–74
(47) Meyers B M and Cafarelli E 2005 Caffeine increases timeto fatigue by maintaining force and not by altering firingrates during submaximal isometric contractions J. Appl.Physiol. 99 1056–63
(48) Person R S and Kudina L P 1972 Discharge frequency anddischarge pattern of human motor units during voluntarycontraction of muscle Electroencephalography ClinicalNeurophysiology 32 471–83
(49) Person R S 1974 Rhythmic activity of a group ofhuman motoneurones during voluntary contraction of amuscle Electroencephalography Clinical Neurophysiol-ogy 36 585–95
(50) Peters E J D and Fuglevand A J 1999 Cessation of humanmotor unit discharge during sustained maximal voluntarycontraction Neurosci. Lett. 274 66–70
(51) Rice C L, Vollmer T L and Bigland-Ritchie B 1992Neuromuscular responses of patients with multiplesclerosis Muscle and Nerve 15 1123–32
(52) Roos M R, Rice C L, Connelly D M and Vandervoort A A1999 Quadriceps muscle strength, contractile properties,and motor unit firing rates in young and old men Muscleand Nerve 22 1094–103
(53) Rose J and McGill K 2005 Neuromuscular activationand motor-unit firing characteristics in cerebral palsyDevelopmental Medicine Child Neurology 47 329–36
(54) Ruangsri S, Whittle T and Murray G M 2007 Superiorhead of human lateral pterygoid muscle: single motorunit firing rates during isometric force Arch. Oral Biol.52 995–1001
(55) Rubinstein S and Kamen G 2005 Decreases in motor unitfiring rate during sustained maximal-effort contractions inyoung and older adults J. Electromyography Kinesiology15 536–43
(56) Ruiter C J, Elzinga M J H, Verdijk P W L, Mechelen Wand Haan A 2004 Voluntary drive-dependent changes invastus lateralis motor unit firing rates during a sustainedisometric contraction at 50% of maximum knee extensionforce Pflugers Archiv; Eur. J. Physiol. 447 436–44
15
J. Neural Eng. 9 (2012) 016007 C J De Luca and J C Kline
(57) Schulze M L 1955 Die absolute und relative zahlder muskelspindeln in den kurzen daumenmuskeln desmenschen Anatomischer Anzeiger 102 290–1
(58) Scutter S D and Turker K S 1998 Recruitment stabilityin masseter motor units during isometric voluntarycontractions Muscle and Nerve 21 1290–8
(59) Seki K, Kizuka T and Yamada H 2007 Reductionin maximal firing rate of motoneurons after 1-weekimmobilization of finger muscle in human subjectsJ. Electromyography Kinesiology 17 113–20
(60) Seki K and Narusawa M 1996 Firing rate modulation ofhuman motor units in different muscles during isometriccontraction with various forces Brain Res. 719 1–7
(61) Semmler J G and Nordstrom M A 1995 Influence ofhandedness on motor unit discharge properties and forcetremor Exp. Brain Res. 104 115–25
(62) Semmler J G and Nordstrom M A 1998 Motor unitdischarge and force tremor in skill- and strength-trainedindividuals Exp. Brain Res. 119 27–38
(63) Smith R D and Marcarian H Q 1966 The musclespindles of the dorsal and palmar interosseus musclesAnatomischer Anzeiger 119 409–14
(64) Sogaard, K, Christensen H, Fallentin N, Mizuno M,Quistorff B and Sjogaard G 1998 Motor unit activationpatterns during concentric wrist flexion in humans withdifferent muscle fibre composition Eur. J. Appl. Physiol.78 411–6
(65) Sogaard, K 1995 Motor unit recruitment pattern duringlow-level static and dynamic contractions Muscle andNerve 18 292–300
(66) Sturm H, Schmied A, Vedal J P and Pagni S 1997Firing pattern of type-identified wrist extensor motor unitsduring wrist extension and hand clenching in humansJ. Physiol. 504 735–45
(67) Tanji J and Kato M 1973 Firing rate of individual motorunits in voluntary contraction of abductor digiti minimimuscle in man Exp. Neurol. 40 771–83
(68) Tanji J and Kato M 1973 Recruitment of motor unitsin voluntary contraction of a finger muscle in man Exp.Neurol. 40 759–70
(69) Theile F W 1884 GewichtsbEstimmungen zur Entwick-elung des Muskelsystems und Des skelettes beim men-schen (Leipzig: Engelmann)
(70) Thomas C K and del Valle A 2001 The role of motorunit rate modulation versus recruitment in repeatedsubmaximal voluntary contractions performed by controland spinal cord injured subjects J. Electromyography andKinesiology 11 217–29
(71) Thomas C K, Ross B H and Calancie B 1987 Humanmotor-unit recruitment during isometric contractions andrepeated dynamic movements J. Neurophysiol. 57 311–24
(72) Thomas C K, Ross B H and Stein R B 1986 Motor-unit recruitment in human first dorsal interosseousmuscle for static contractions in three different directionsJ. Neurophysiol. 55 1017–29
(73) Vander Linden D W, Kukulka C G and Soderberg G L1991 The effect of muscle length on motor unit dischargecharacteristics in human tibialis anterior muscle Exp.Brain Res. 84 210–8
(74) Von Hoyer E 1963 Untersuchungen uber anzahl,lange und verteilung der muskelspindeln in derunterschenkelmuskulatur Anatomischer Anzeiger 11336–44
(75) Voss H 1958 Zahl und anordnung der muskelspindelnin den unteren zungenbeinmuskeln, dem m. sternoclei-domastoideus und den bauch- und tiefen nackenmuskelnAnatomischer Anzeiger 105 265–75
(76) Voss H 1956 Zahl und anordnung der muskelspindeln imm. pronator quadratus Anatomischer Anzeiger 103 85–8
(77) Westad C, Mork P J and Westgaard R H 2004Firing patterns of low-threshold trapezius motor unitsin feedback-controlled contractions and vocational motoractivities Exp. Brain Res. 158 465–73
(78) Westgaard R H and De Luca C J 2001 Motor control oflow-threshold motor units in the human trapezius muscleJ. Neurophysiol. 85 1777–81
(79) Westgaard R H and De Luca C J 1999 Motor unitsubstitution in long-duration contractions of the humantrapezius muscle J. Neurophysiol. 82 501–4
References
Ashby P and Labelle K 1977 Effects of extensor and flexor group Iafferent volleys on the excitability of individual soleusmotoneurones J. Neurol. Neurosurg. Psychiatry 40 910–9
Bayoumi A and Ashby P 1989 Projections of group Ia afferents tomotoneurons of thigh muscles in man Exp. Brain Res. 76 223–8
Binder M D, Kroin J S, Moore G P and Stuart D G 1977 Theresponse of Golgi tendon organs to single motor unitcontractions J. Physiol. 271 337–49
Binder M D and Stuart D G 1980 Responses of Ia and spindle groupII afferents to single motor-unit contractions J. Neurophysiol.43 621–9
Broman H, De Luca C J and Mambrito B 1985 Motor unitrecruitment and firing rates interaction in the control of humanmuscles Brain Res. 337 311–9
Burke D, Aniss A M and Gandevia S C 1987 In-parallel andin-series behavior of human muscle spindle endingsJ. Neurophysiol. 58 417–26
Burke D, Skuse N F and Stuart D G 1979 The regularity of musclespindle discharge in man J. Physiol. 291 277–90
Chalmers G R and Bawa P 1997 Synaptic connections from largeafferents of wrist flexor and extensor muscles to synergisticmotoneurones in man Exp. Brain Res. 116 351–8
Cooper S and Daniel P M 1949 Muscle spindles in human extrinsiceye muscles Brain 72 1–24
Creange A, Faist M, Katz R and Penicaud A 1992 Distribution ofheteronymous Ia facilitation and recurrent inhibition in thehuman deltoid motor nucleus Exp. Brain Res. 90 620–4
De Luca C J and Erim Z 1994 Common drive of motor units inregulation of muscle force Trends Neurosci. 17 299–305
De Luca C J, Gonzalez-Cueto J A and Adam A 2009 Motor unitrecruitment and proprioceptive feedback decrease the commondrive J. Neurophysiol. 101 1620–8
De Luca C J and Hostage E C 2010 Relationship between firing rateand recruitment threshold of motoneurons in voluntaryisometric contractions J. Neurophysiol. 104 1034–46
De Luca C J, LeFever R S, McCue M P and Xenakis A P 1982aBehaviour of human motor units in different muscles duringlinearly varying contractions J. Physiol. 329 113–28
De Luca C J, LeFever R S, McCue M P and Xenakis A P 1982bControl scheme governing concurrently active human motorunits during voluntary contractions J. Physiol. 329 129–42
16

J. Neural Eng. 9 (2012) 016007 C J De Luca and J C Kline
Duchateau J and Hainaut K 1990 Effects of immobilization oncontractile properties, recruitment and firing rates of humanmotor units J. Physiol. 422 55–65
Edin B B and Vallbo A B 1990 Muscle afferent responses toisometric contractions and relaxations in humansJ. Neurophysiol. 63 1307–13
Feiereisen P, Duchateau J and Hainaut K 1997 Motor unitrecruitment order during voluntary and electrically inducedcontractions in the tibialis anterior Exp. Brain Res.114 117–23
Freund H J, Budingen H J and Dietz V 1975 Activity of singlemotor units from human forearm muscles during voluntaryisometric contractions J. Neurophysiol. 38 933–46
Gandevia S C, Macefield G, Burke D and McKenzie D K 1990Voluntary activation of human motor axons in the absence ofmuscle afferent feedback Brain 113 1563–81
Hultborn H, Meunier S, Pierrot-Deseilligny E and Shindo M 1987Changes in presynaptic inhibition of Ia fibres at the onset ofvoluntary contraction in man J. Physiol. 389 757–72
Hultborn H and Pierrot-Deseilligny E 1979 Changes in recurrentinhibition during voluntary soleus contractions in man studiedby an H-reflex technique J. Physiol. 297 229–51
Kukulka C G and Clamann H P 1981 Comparison of the recruitmentand discharge properties of motor units in human brachialbiceps and adductor pollicis during isometric contractionsBrain Res. 219 45–55
Macefield V G, Gandevia S C, Bigland-Ritchie B, Gorman R Band Burke D 1993 The firing rates of human motoneuronesvoluntarily activated in the absence of muscle afferent feedbackJ. Physiol. 471 429–43
Macefield G, Hagbarth K, Gorman R, Gandevia S C and Burke D1991 Decline in spindle support to alpha-motoneurones duringsustained voluntary contractions J. Physiol. 440 497–512
Maltenfort M G, Heckman C J and Rymer W Z 1998 Decorrelatingactions of Renshaw interneurons on the firing of spinalmotoneurons within a motor nucleus: a simulation studyJ. Neurophysiol. 80 309–23
Mao C C, Ashby P, Wang M and McCrea D 1984 Synapticconnections from large muscle afferents to the motoneurons ofvarious leg muscles in man Exp. Brain Res. 56 341–50
Marsden J, Farmer S, Halliday D, Rosenberg J and Brown P 1999The unilateral and bilateral control of motor unit pairs in thefirst dorsal interosseous and paraspinal muscles in manJ. Physiol. 521 553–64
Mendell L M and Henneman E 1971 Terminals of single Ia fibers:location, density, and distribution within a pool of 300homonymous motoneurons J. Neurophysiol. 34 171–87
Meunier S, Penicaud A, Pierrot-Deseilligny E and Rossi A 1990Monosynaptic Ia excitation and recurrent inhibition fromquadriceps to ankle flexors and extensors in man J. Physiol.423 661–75
Munson J B, Sypert G W, Zengel J E, Lofton S A and Fleshman J W1982 Monosynaptic projections of individual spindle group IIafferents to type-identified medial gastrocnemius motoneuronsin the cat J. Neurophysiol. 48 1164–74
Pierrot-Deseilligny E 1997 Assessing changes in presynapticinhibition of Ia afferents during movement in humansJ. Neurosci. Methods 74 189–99
Piotrkiewicz M, Kudina L and Mierzejewska J 2004 Recurrentinhibition of human firing motoneurons (experimental andmodeling study) Biol. Cyberkinetics 91 243–57
Rosenthal R and Rosnow R L 1991 Essentials of BehavioralResearch: Methods and Data Analysis 2nd edn (New York:McGraw-Hill) pp 283–6
Scott J G and Mendell L M 1976 Individual EPSPs produced bysingle triceps surae Ia afferent fibers in homonymous andheteronymous motoneurons J. Neurophysiol. 39 679–92
Seki K, Kizuka T and Yamada H 2007 Reduction in maximal firingrate of motoneurons after 1-week immobilization of fingermuscle in human subjects J. Electromyogr. Kinesiol. 17 113–20
Seki K and Narusawa M 1996 Firing rate modulation of humanmotor units in different muscles during isometric contractionwith various forces Brain Res. 719 1–7
Semmler J G and Nordstrom M A 1997 Relationship between motorunit short-term synchronization and common drive in humanfirst dorsal interosseous muscle Brain Res. 767 314–20
Shoemaker M and Hannaford B 1994 A study and model of the roleof the Renshaw cell in regulating the transient firing rate of themotoneuron Biol. Cyberkinetics 71 251–62
Stauffer E K, Watt D G, Taylor A, Reinking R M and Stuart D G1976 Analysis of muscle receptor connections byspike-triggered averaging 2. Spindle group II afferentsJ. Neurophysiol. 39 1393–402
Sypert G W, Fleshman J W and Munson J B 1980 Comparison ofmonosynaptic actions of medial gastrocnemius group Ia andgroup II muscle spindle afferents on triceps surae motoneuronsJ. Neurophysiol. 44 726–38
Theile F W 1884 Gewichtsbestimmungen zur Entwickelung desMuskelsystems und des Skelettes beim Menschen (Leipzig:Engelmann)
Vallbo A B 1974 Human muscle spindle discharge during isometricvoluntary contractions. Amplitude relations between spindlefrequency and torque Acta Physiol. Scand. 90 319–36
Voss H 1937 Untersuchungen uber zahl, anordnung und lange dermuskelspindeln in den lumbricalmuskeln des menschen undeiniger tiere Z. Mikrosk. Anat. Forsch. 42 509–24
Voss H 1959 Weitere untersuchungen uber die absolute und relativezahl der muskelspindeln im verschieedenen (muskelgruppenhuft-, oberschenkel- und unterarmmuskeln) des menschenAnat. Anz. 107 190–7
Voss H 1963 Untersuchungen uber die absolute und relative zahl dermuskelspindeln in weiteren muskelgruppen (mm. scaleni undruckenmuskeln) des menschen Anat. Anz. 112 276–9
Watt D G, Stauffer E K, Taylor A, Reinking R M and Stuart D G1976 Analysis of muscle receptor connections byspike-triggered averaging: 1. Spindle primary and tendonorgan afferents J. Neurophysiol. 39 1375–92
Westgaard R H and De Luca C J 2001 Motor control oflow-threshold motor units in the human trapezius muscleJ. Neurophysiol. 85 1777–81
17