influence of nitrate and ammonium availability on …digital.csic.es/bitstream/10261/82971/3/ribot...
TRANSCRIPT

1
Running head: Nitrate and ammonium uptake kinetics 1
Influence of nitrate and ammonium availability on uptake 2
kinetics of stream biofilms 3
Miquel Ribot1, Daniel von Schiller2, Marc Peipoch1, Francesc Sabater3, Nancy B. Grimm4 4
and Eugènia Martí1 5
6
1Biogeodynami7
Accés a la Cala St. Francesc 14, 17300, Blanes, Spain. E-mail: [email protected], 8
[email protected] and [email protected]. Tel:+34972336101, Fax:+34972337806 9
2Catalan Institute for Water Research, Emili Grahit 101, Edifici H2O, Parc Científic i 10
Tecnològic de la Universitat de Girona, 17003, Girona, Spain. E-mail: 11
[email protected]. Tel: +34972183380, Fax:+34972183248 12
3Department of Ecology, Faculty of Biology, University of Barcelona, Avinguda Diagonal 13
645, 08028 Barcelona, Spain. E-mail: [email protected]. Tel: +34934021516, Fax: 14
+34934111438 15
4School of Life Sciences, Arizona State University, Tempe, AZ 85287-4501, USA. E-16
mail:[email protected]. Telf: +14809654735, Fax: +14809656899 17
18

2
Abstract 19
Human activity has significantly increased dissolved inorganic nitrogen (DIN) availability 20
and has modified the relative proportion of nitrate (NO3-) and ammonium (NH4
+) species in 21
many stream ecosystems. Understanding the relationship between DIN concentration and 22
DIN uptake is crucial to predict how streams will respond to increased DIN loading. 23
Nonetheless, this relationship remains unclear due to the complex interactions governing 24
DIN uptake. In this study, we aimed to evaluate how biofilms from two streams differing in 25
background DIN concentration would respond to increases in availability and changes in 26
speciation (i.e., NO3- or NH4
+) of DIN. We measured DIN uptake by biofilms in artificial 27
flumes located in each stream, using separate 15N-NO3- and 15N-NH4
+ additions in a graded 28
series of increasing DIN concentrations. The ambient uptake rate (U) was higher for NO3- 29
than for NH4+ in both streams, but only U for NH4
+ differed between the two streams. In 30
addition, the uptake efficiency (UN-specific) at ambient conditions was higher in the low-N 31
stream for both DIN species. In terms of uptake kinetics, the Michaelis-Menten model best 32
fit the relationship between uptake and concentration in the case of NH4+ (for both streams) 33
but not in the case of NO3- (neither stream). Moreover, saturation of NH4
+ uptake occurred 34
at lower rates (lower Umax) in the low-N than in the high-N stream, but affinity for NH4+ was 35
higher (lower Ks) in the low-N stream. Together, these results indicate that the response 36
capacity of biofilm communities to short-term increases of DIN concentration is primarily 37
determined by the ambient DIN concentrations under which they develop. This study also 38
shows that DIN uptake by benthic biofilms varies not only with DIN availability, but also 39
with DIN speciation, which is often modified by human activities. 40
Key words: Nitrate, ammonium, biofilm, nitrogen uptake, Michaelis-Menten kinetics, 41
stream, land use, agriculture 42
43

3
Introduction 44
Human activities have significantly increased the concentration of dissolved 45
inorganic nitrogen (DIN) in streams (Howarth et al. 1996, Carpenter et al. 1998). 46
Understanding how stream DIN uptake (i.e., the process by which stream biota immobilize 47
DIN from the water column) responds to the human alteration of DIN availability has 48
become a research focus for stream ecologists over the past decades (Mulholland & Webster 49
2010). Some researchers have studied DIN uptake kinetics (i.e., changes in uptake rates in 50
response to changes in concentration) based on the relationship between whole-reach DIN 51
uptake and DIN concentration, using measurements from different streams spanning a broad 52
range of background DIN concentrations (Dodds et al. 2002, Bernot et al. 2006, Newbold et 53
r studies have focused on DIN uptake kinetics within the 54
same stream by following changes in whole-reach uptake in response to short-term DIN 55
56
or by investigating DIN uptake kinetics in mesocosms (Eppley et al. 1969, Kemp and Dodds 57
58
According to these studies, there are three mathematical models that describe the 59
relationship between DIN uptake and concentration in streams. The first model corresponds 60
to a first-order response, where uptake rate is directly proportional to concentration of 61
substrate (Dodds et al. 2002). The second model, the efficiency-loss model, follows a power 62
relationship where uptake rate increases with concentration 63
et al. 2007). The third model follows Michaelis-Menten kinetics, characterized by saturation 64
of uptake when availability exceeds biological demand (Earl et al. 2006). In general, results 65
from inter-stream comparisons suggest that the linear and efficiency-loss models best fit the 66
67
Conversely, results from enrichment experiments within the same stream or in mesocosms 68
4
(i.e., with the same community) suggest that the Michaelis-Menten model best fits DIN 69
70
Human activities not only alter the concentration of DIN, but they also change the 71
relative proportion of the two major DIN species: nitrate (NO3-) and ammonium (NH4
+) 72
(Stanley and Maxted 2008, Lassaletta et al. 2009, Martí et al. 2010). Uptake rates and 73
kinetics are expected to differ between NO3- and NH4
+, since energetic costs of assimilation 74
associated with NO3- are generally higher than those associated with NH4
+ (Dortch 1990, 75
Naldi and Wheeler 2002). Furthermore, dissimilatory transformations, wherein neither 76
compound is incorporated into biomass, contribute to both NH4+ and NO3
- uptake . 77
Nitrification (i.e., oxidization of NH4+ to NO3
- by autotrophic or heterotrophic bacteria and 78
archaea) will result in apparent NH4+ uptake, whereas NO3
- uptake may include 79
denitrification (i.e., the respiratory process by which bacteria reduce NO3- to N2). These 80
transformations are carried out by different organisms and governed by different controlling 81
factors (Bothe et al. 2007), and thus may additionally contribute to the expected differences 82
between NO3- and NH4
+ uptake kinetics. Most studies have investigated NO3- or NH4
+ 83
uptake separately; thus, we do not know how uptake kinetics differ between these two DIN 84
species under similar environmental conditions. In addition, little is known about differences 85
in uptake kinetics of NO3- or NH4
+ for stream biofilms (i.e., the microbial communities that 86
develop on stream substrata associated to increases in DIN availability. Understanding DIN 87
uptake kinetics of stream biofilms is especially important since biofilms are major 88
contributors to nutrient dynamics in stream networks (Pusch et al. 1998, Battin et al. 2003) 89
and may therefore play a role in ameliorating anthropogenic DIN inputs. 90
In this study, we compared uptake rates and kinetics for NO3- and NH4
+ between 91
biofilms developed in two streams differing in background DIN concentrations. We 92
measured biofilm uptake rates using experiments that separately added 15N-labeled NO3- and 93

5
NH4+ at increasing concentrations of the two DIN species to artificial flumes located in each 94
stream. We predicted that ambient uptake rates would be higher for NO3- than for NH4
+, and 95
in the high-N stream compared to the low-N stream, due to the higher availability of NO3- 96
with respect to NH4+ as well as the overall higher DIN availability in the high-N stream. In 97
terms of uptake kinetics, we predicted that Michaelis-Menten model would best fit the 98
relationship between DIN uptake and concentration because DIN uptake is mediated by 99
enzymatic processes. In particular, we expected lower maximum uptake (Umax) and half-100
saturation constant (Ks) for NH4+ than for NO3
- because of the lower energetic cost for 101
assimilation of NH4+ than of NO3
-. We further expected Umax and Ks to be lower in the low-102
N stream than in the high-N stream owing to differences in N affinity between stream 103
biofilms resulting from different histories of nutrient exposure. 104
105
Material and Methods 106
Study sites 107
N; 929 m asl) is a forested stream situated 108
within the protected area of the Parc Natural del Montseny at the headwaters of the 109
catchment of the river L110
agricultural stream situated next to gardening plantations in a lower part of the same 111
catchment. Discharge (mean ± SE, in L/s) was 56 ± 12 for Font del Regàs, and 163 ± 35 for 112
Santa Coloma (biweekly samplings from September 2004 to July 2007; Ribot et al. 113
unpublished data), and concentrations (mean ± SE, in µg N/L) of NO3- and NH4
+ were 181 ± 114
11 and 12 ± 1 for Font del Regàs, and 780 ± 44 and 19 ± 2 for Santa Coloma (biweekly 115
samplings from September 2004 to July 2007; Ribot et al. unpublished data). Hereafter, we 116
refer to Font del Regàs as the low-N stream and to Santa Coloma as the high-N stream. 117
118
6
Channel experiments 119
We conducted the experiments from 3 to 24 July 2007 in the low-N stream and from 120
23 October to 7 November 2007 in the high-N stream. We placed a set of 6 parallel PVC 121
channels (6 m long and 15 cm wide) on the streambed using a metallic structure that held 122
them together and above the stream water (Fig. 1a). Water from an upstream tank fed all 123
channels continuously with a mean (± SE) flow rate of 1.8 ± 0.018 L/min (from 124
measurements done daily throughout the experiments and in each channel). We filled the 125
channels with stream cobbles of similar size and biofilm coverage, which were collected 126
from the streambed within <50m upstream from the channel setting. We then exposed them 127
to 24-h fertilization cycles of increasing concentration levels (1x, 4x, 8x, 16x and 32x the 128
background concentration) of either NO3- or NH4
+ (n = 3 channels each; Fig. 1a and b). We 129
released two independent solutions of NO3- (as NaNO3) and NH4
+ (as NH4Cl) to the 130
corresponding channels at a constant rate, using a 3-output carboy (one per channel), 131
maintaining a constant head in the carboy with a Masterflex (Vernon Hills, Illinois, USA) 132
L/S battery-powered peristaltic pump. To maintain the background stoichiometric ratio 133
between DIN and soluble reactive phosphorus (SRP) throughout the fertilization cycles, we 134
also added phosphate (as NaH2PO4·H2O) proportionally into the solution at each fertilization 135
level. 136
To estimate N uptake rates of biofilms, we conducted a tracer addition of either 137
15NO3- (n = 3 channels) or 15NH4
+ (n = 3 channels) over the last 6 h of each fertilization 138
level. We added two independent solutions amended with 15NO3- (as 99% enriched K15NO3) 139
or 15NH4+ (as 99% enriched 15NH4Cl) in conjunction with NaCl as a conservative tracer at a 140
constant rate using a similar setup as described above. We calculated the amount of K15NO3 141
and 15NH4Cl to produ 15142
7
channels. To verify steady plateau conditions, we automatically recorded conductivity at the 143
end of each channel using a portable WTW conductivity meter (Weilheim, Germany). 144
Prior to fertilizations, we collected water at the downstream end of each channel for 145
the analysis of ambient nutrient concentration (3 replicates per channel) and 15NH4+ and 146
15NO3- signatures (1 replicate per channel). We also collected composite biofilm samples for 147
the analysis of biomass, pigment content, and 15N natural abundance (1 replicate per 148
channel) by scraping 3 randomly selected cobbles and filtering the biomass onto ashed, pre-149
weighed GF/F filters. Before completion of the fertilization period (when fertilization and 150
15N addition were running together), we collected another set of water samples for the 151
analysis of nutrient concentration and 15NH4+ and 15NO3
- signatures and of biofilm samples 152
(3 replicates per channel). After that, we stopped the additions, emptied the channels, 153
cleaned them, and filled them again with cobbles from the stream to initiate the experiment 154
with a higher fertilization level (Fig. 1b). We filtered the water samples immediately through 155
ashed Whatman (Maidstone, UK) GF/F glass-fiber filters into acid-washed, plastic 156
containers and stored them on ice for transportation to the laboratory. We estimated the 157
cobble surface by covering it with aluminum foil and weighing it. We stored the filters with 158
biofilm samples on ice in the field, and then froze them (for chlorophyll-a analysis) or oven-159
dried them (for ash free dry mass and 15N analysis) in the laboratory until further processing. 160
We measured and logged photosynthetically active radiation (PAR) every 10 min using a 161
Skye (Powys, UK) SKP215 quantum sensor connected to a Campbell Scientific data logger. 162
We measured temperature at plateau conditions using a WTW portable conductivity meter. 163
Laboratory analyses 164
We analyzed water samples for the concentrations of NO3-, NH4
+, and SRP on a 165
Bran+Luebbe (Norderstedt, Germany) TRAACS 2000 autoanalyzer following standard 166
colorimetric methods (APHA, 1995). We processed water samples for the analysis of 15NO3- 167

8
and 15NH4+ using the ammonia-diffusion technique (Sigman et al. 1997 and Holmes et al. 168
1998, respectively). For 15NO3- determination, we amended a known volume of sample with 169
3 g of MgO and 5 g of NaCl and boiled it to remove the NH4+. We then added 0.5 mg MgO 170
3- to NH4
+, and treated the remaining sample as 171
for 15NH4+. For 15NH4
+ determination, we amended a known volume of sample with 3 g/L of 172
MgO and 50 g/L of NaCl and a Teflon filter packet containing a 1-cm-diameter ashed 173
Whatman GF/D fiber glass filter acidified with 25 µL of 2.5 M KHSO4 (to trap the 174
volatilized NH3), and incubated it on a shaker at 40ºC for 4 wk. Once the incubation was 175
completed, we removed the filter packets and placed them in a desiccator for 4 d. Filters 176
were then encapsulated in tins and stored until 15N analysis. 177
We oven-dried filters with biofilm samples at 60ºC until they reached a constant 178
weight. To estimate the biofilm ash-free dry mass (AFDM; in g m-2), we weighed 179
subsamples on a Sartorious (Göttingen, Germany) MC1 analytical balance, and combusted 180
them at 500ºC for 5 h. We determined the chlorophyll-a content of biofilms (in g/cm2) 181
following McIntire et al. (1996). We submerged frozen filters in a known volume of 90% 182
v/v acetone and kept them in dark conditions at 4ºC overnight. We sonicated the filters for 5 183
min and centrifuged them for 10 min at 4000 rpm. We measured the absorbance of the 184
resultant supernatant at 664, 665 and 750 nm before and after acidification using a Shimadzu 185
(Tokyo, Japan) UV spectrometer. To determine the 15N signature of biofilms, we weighed 186
subsamples of 1-cm diameter to the nearest 0.001 mg on a Mettler-Toledo (Greifensee, 187
Switzerland) MX5 microbalance and encapsulated them in tins. We sent the samples for 188
analysis at the University of California Stable Isotope Facility (Davis, California, USA). The 189
N content (as a percentage of dry mass) and the abundance of the heavier isotope, expressed 190
as the 14N:15N ratio compared to that of a standard (N2 from the atmosphere) using the 191
15 -flow isotope-ratio mass 192
9
spectrometry (20 20 mass spectrometer; PDZ Europa, Northwich, UK) after sample 193
combustion in an on-line elemental analyzer (PDZ Europa ANCA-GSL). 194
Calculation of uptake rates and data analysis 195
Differences in ambient nutrient concentrations, biofilm AFDM and biofilm 196
chlorophyll-a content between streams were explored using independent t- tests. 197
To calculate the uptake rates of NO3- and NH4
+ we first calculated the amount of 15N 198
tracer contained in biofilm (15Nbiofim; in µg N/m2) using the following equation: 199
15 = × 100 × ( ) (1) 200
where Bbiofilm is the biofilm biomass as dry mass per unit of area, N is the biofilm N content 201
expressed as percentage of dry mass, MF is the molar fraction of 15N in biofilm at plateau 202
conditions (MFi) and at background conditions (MFb). 203
We estimated the biofilm N uptake rate (U; in µg N m-2 s-1) for either NO3- or NH4
+ 204
using the following equation (adapted from von Schiller et al. 2007): 205
= 15
× (15 ) (2)
206
where 15Nbiofim is the amount of 15N tracer in biofilm biomass from eqn (1), Taddition is the 207
duration of the 15N addition (6 h), 15Nflux is the 15N flux (as either NO3- or NH4
+) at plateau 208
conditions in the channel water and Nflux is the total N flux (as either NO3- or NH4
+) at each 209
fertilization level in the channel water based on concentration and channel flow rate (µg N s-210
1). We then calculated the biomass-specific N uptake rate (UN-specific; d-1) for both biofilm 211
communities and DIN species as a surrogate of N uptake efficiency by dividing the biofilm 212
N uptake rate (µg N m-2 s-1) by the N content of dry mass (µg N/m2). 213
To compare U and UN-specific for NO3- and NH4
+ at ambient conditions within and 214
between streams, we used a two-way ANOVA with DIN species (n=2) and stream (n=2) as 215
10
factors. Post-hoc Tukey HSD tests following significant ANOVA (p < 0.05) were used to 216
further examine the effects of stream and DIN species on both U and UN-specific. 217
To explore the relationship between U and concentration of each DIN species at the 218
different levels of fertilization, we determined the fit of our experimental data to the 3 219
mathematical models described in the introduction. The 1st-order response model followed 220
the equation: 221
= + (3) 222
where U is assumed to increase linearly with DIN concentration (C). The Michaelis-Menten 223
model followed the equation: 224
=
+ (4)
225
where C is the DIN concentration, Umax is the maximum uptake rate, and Ks is the 226
concentration at which half the maximum uptake is reached. Ks is an indicator of the biofilm 227
affinity for DIN; high values indicate lower affinity than low values. Finally, the efficiency 228
loss model followed the equation: 229
= (5) 230
where U is assumed to increase with DIN concentration (C) as a power law with a slope 231
(b)<1. 232
The a and b coefficients from each mathematical model (for the Michaelis-Menten 233
model, a corresponds to Umax and b corresponds to Ks), were calculated based on Gauss-234
Newton algorithm, an iterative process which seeks the values of the parameters that 235
minimize the sum of the squared differences between the observed and predicted values of 236
the dependent variable. We then estimated the confidence intervals (95 %) for each 237
coefficient by the generic function confint powered by R software. The default method 238
11
assumes asymptotic normality, and needs suitable coef and vcov methods to be available. 239
The default method can be called directly for comparison with other methods. We used the 240
Akaike Information Criterion (AIC) to estimate Akaike weights (Wi), which yield the 241
relative likelihood of each model given a particular data set. Within the set of candidate 242
models for the data, we selected the model with the highest Wi value. 243
We conducted all statistical tests with R 2.14.0 (R Foundation for Statistical 244
Computing, Vienna, Austria, http://www.R-project.org/.). When necessary, data were log-245
transformed prior to analysis in order to meet assumptions of homogeneity of variance and 246
normality (Zar, 1996). 247
248
Results 249
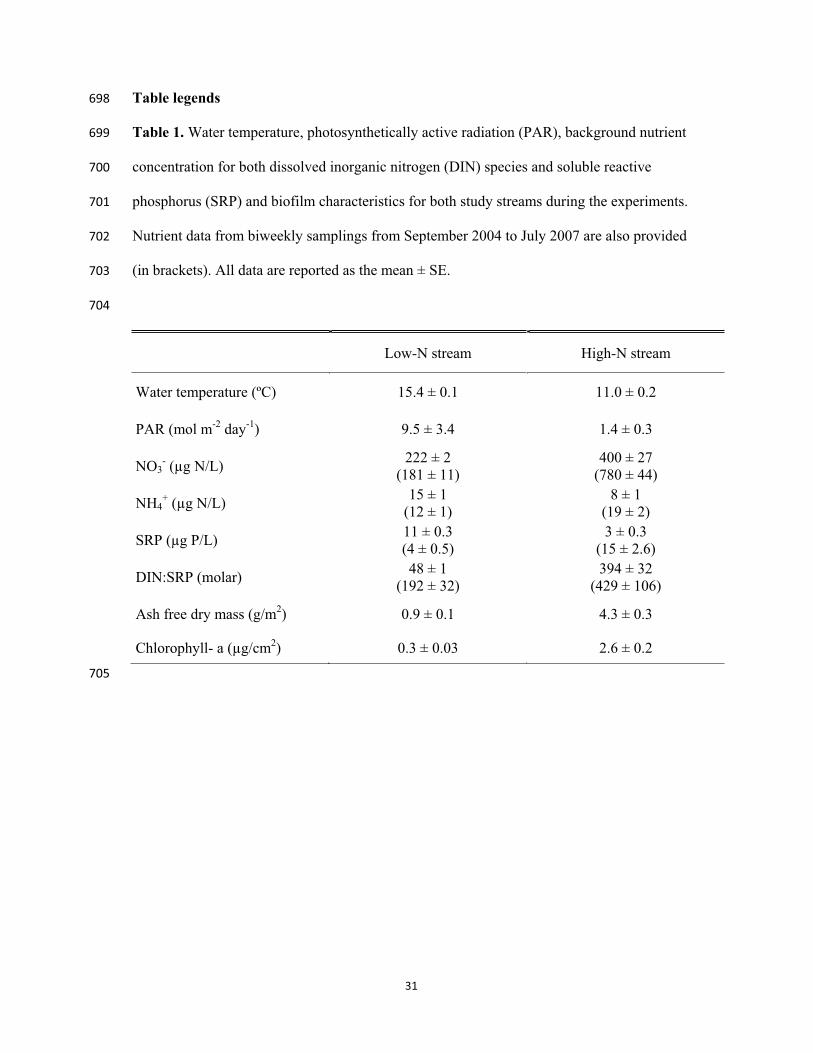
The two study streams differed substantially in environmental conditions during the 250
experiments (Table 1). Mean water temperature and PAR were 1.4 and 7 times higher, 251
respectively, in the low-N stream than in the high-N stream. Consistent with the long-term 252
trend (i.e, biweekly sampling), mean NO3- concentration was 2 times higher in the high-N 253
stream (t-test, p < 0.001, Table 1). Mean NH4+ concentration in the low-N stream was half 254
of that in the high-N stream (t-test, p < 0.001) contrasting to the long-term trend, when the 255
mean NH4+ concentration of the low-N stream was twice as low as that of the high-N stream 256
(Table 1). Mean SRP concentration was 4 times lower and mean DIN:SRP ratio was 8 times 257
higher in the high-N stream with respect to the low-N stream (t-test, p < 0.001). 258
Furthermore, the two study streams showed important differences in biofilm structure (Table 259
1). The mean AFDM and the mean chlorophyll-a content were significantly higher (5 and 9 260
times, respectively) in the biofilm of the high-N stream than in the biofilm of the low-N 261
stream (t-test, p < 0.001). 262
12
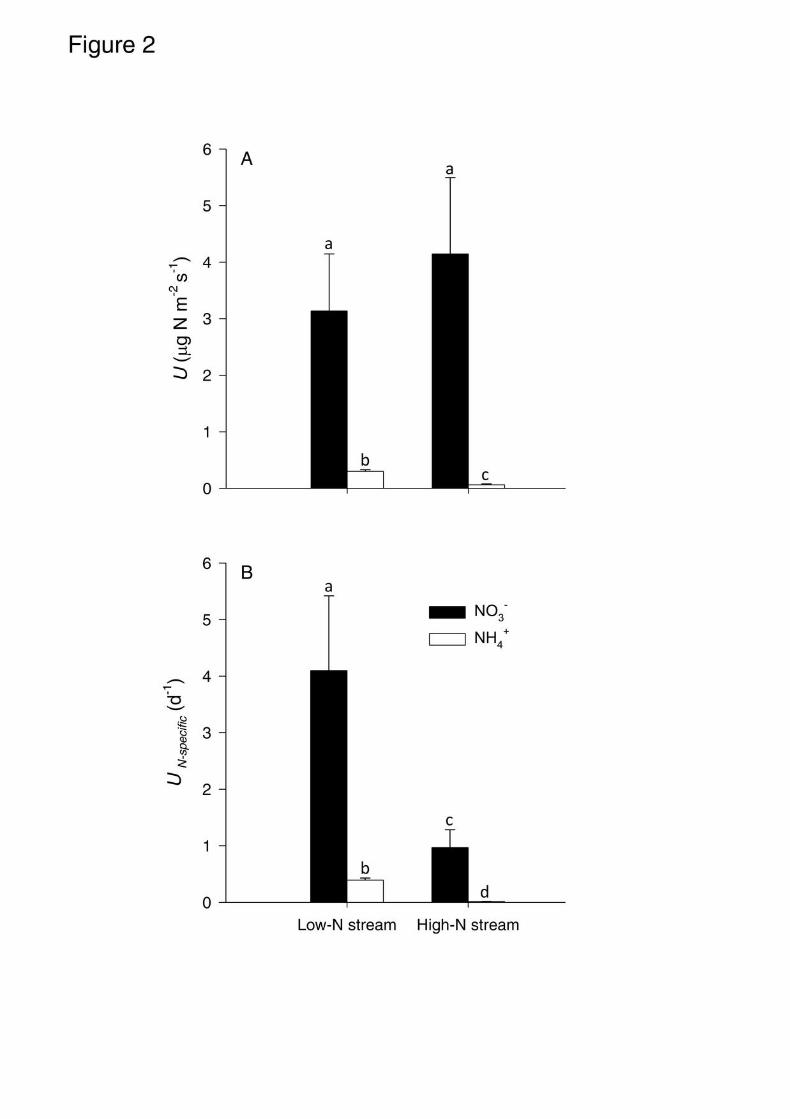
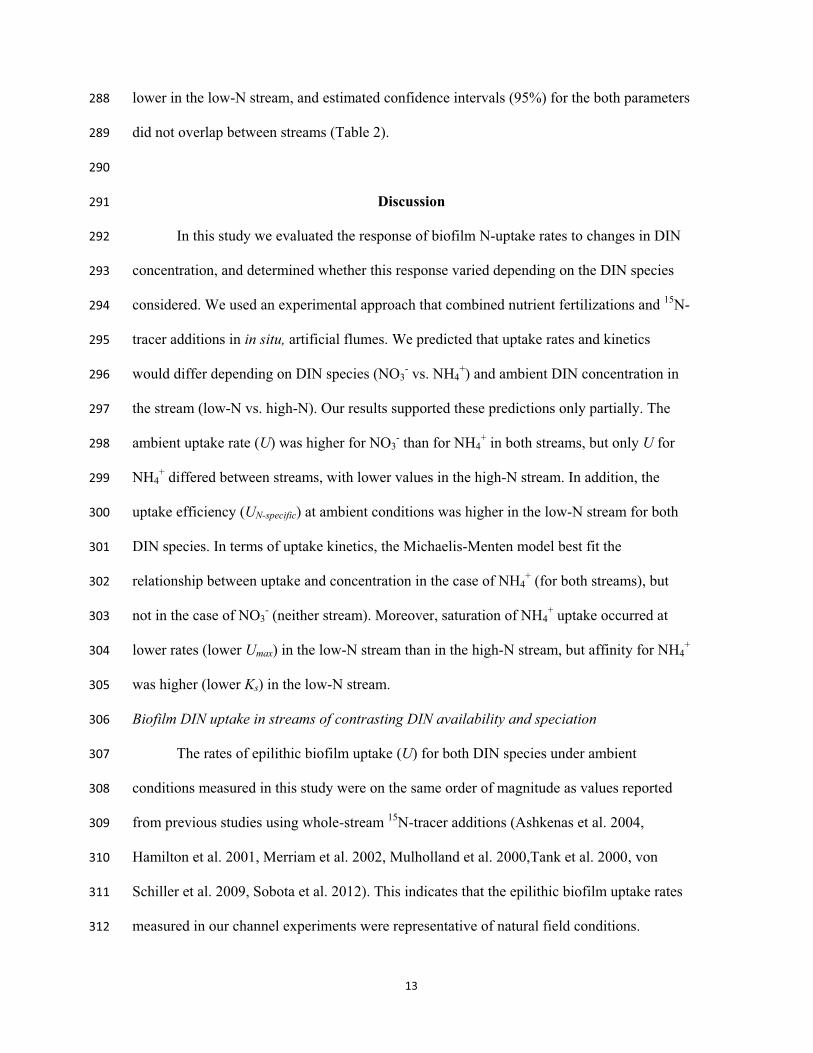
Results from the two-way ANOVAs showed that both factors (DIN species and 263
stream) as well as their interaction had a statistically significant effect on both U and UN-264
specific at ambient concentrations (p < 0.01 in all cases). The U (µg N m-2 s-1) for NO3- (mean 265
± SE = 3.1 ± 0.6 in the low-N stream and 4.1 ± 0.8 in the high-N stream) was higher than U 266
for NH4+ (0.3 ± 0.02 in the low-N stream and 0.06 ± 0.01 in the high-N stream) in both 267
streams (Fig 2A). Post-hoc comparisons between streams showed that U for NH4+ 268
significantly differed between streams (Tukey HSD test, p = 0.001) whereas U for NO3- did 269
not (Tukey HSD test, p = 0.636). Similarly, UN-specific (d-1) for NO3- (mean ± SE = 4.1 ± 0.8 270
in the low-N stream and 1.0 ± 0.2 in the high-N stream) was higher than UN-specific for NH4+ 271
(0.4 ± 0.02 in the low-N stream and 0.01 ± 0.002 in the high-N stream) in both streams (Fig 272
2B). In contrast to U, post-hoc comparisons showed that UN-specific for both NO3- and NH4
+ 273
differed between streams (Tukey HSD test, p < 0.001). 274
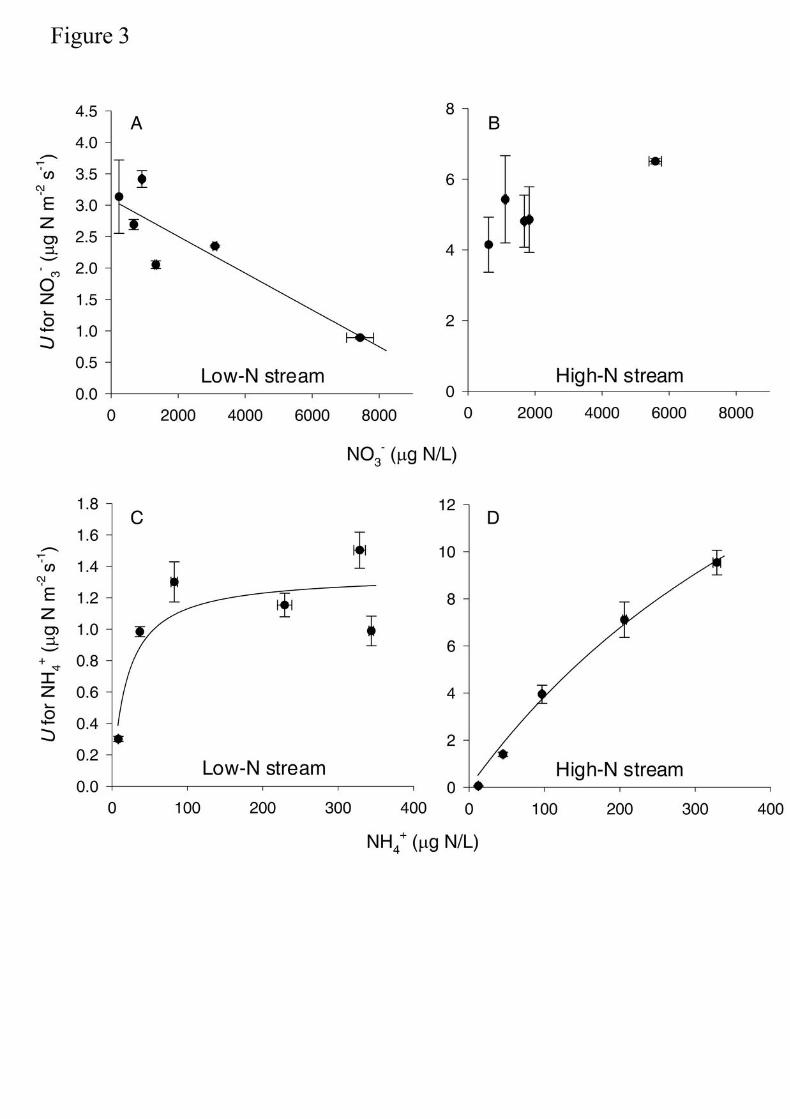
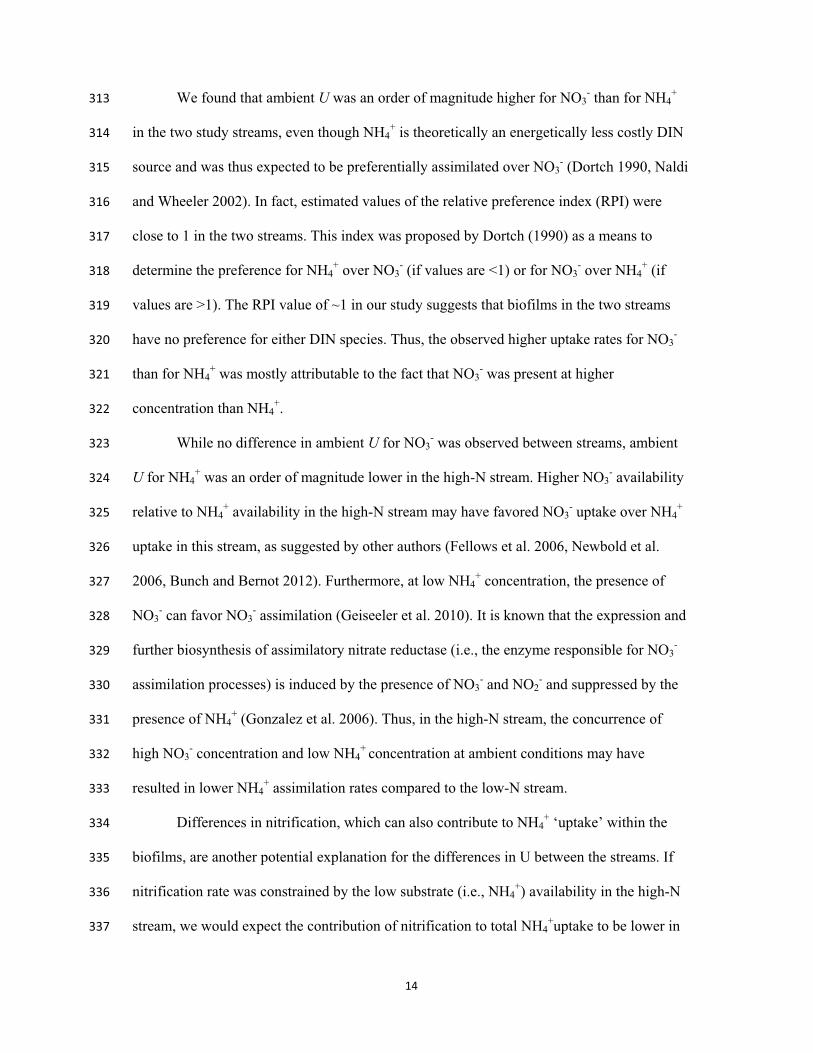
Uptake responses to increases in DIN concentration differed substantially between 275
DIN species and streams (Fig. 3). The relationship between U and concentration for NO3- 276
differed between the two streams, but in any case uptake kinetics fitted a Michaelis-Menten 277
model (Fig. 3A-B). In the low-N stream, AIC analysis indicated that the relationship 278
between U and concentration for NO3- better fit a 1st-order model with a negative slope 279
(Table 2). Conversely, in the high N-stream the estimated confidence intervals (95%) for the 280
b parameter in the three models crossed 0, indicating no significant fit, and AIC analysis 281
resulted in no clear model selection (Table 2). 282
U for NH4+ varied with increases in NH4
+ concentration in the two study streams 283
(Fig. 3C-D). The AIC analysis selected the Michaelis-Menten model as the best fit for the 284
relationship between U for NH4+ and NH4
+concentration in both streams (Table 2). 285
However, uptake kinetic parameters differed between the two streams. The maximum 286
uptake rate (Umax; in µg N m-2 s-1) and the half saturation constant (Ks; in µg N/L) were 287
13
lower in the low-N stream, and estimated confidence intervals (95%) for the both parameters 288
did not overlap between streams (Table 2). 289
290
Discussion 291
In this study we evaluated the response of biofilm N-uptake rates to changes in DIN 292
concentration, and determined whether this response varied depending on the DIN species 293
considered. We used an experimental approach that combined nutrient fertilizations and 15N-294
tracer additions in in situ, artificial flumes. We predicted that uptake rates and kinetics 295
would differ depending on DIN species (NO3- vs. NH4
+) and ambient DIN concentration in 296
the stream (low-N vs. high-N). Our results supported these predictions only partially. The 297
ambient uptake rate (U) was higher for NO3- than for NH4
+ in both streams, but only U for 298
NH4+ differed between streams, with lower values in the high-N stream. In addition, the 299
uptake efficiency (UN-specific) at ambient conditions was higher in the low-N stream for both 300
DIN species. In terms of uptake kinetics, the Michaelis-Menten model best fit the 301
relationship between uptake and concentration in the case of NH4+ (for both streams), but 302
not in the case of NO3- (neither stream). Moreover, saturation of NH4
+ uptake occurred at 303
lower rates (lower Umax) in the low-N stream than in the high-N stream, but affinity for NH4+ 304
was higher (lower Ks) in the low-N stream. 305
Biofilm DIN uptake in streams of contrasting DIN availability and speciation 306
The rates of epilithic biofilm uptake (U) for both DIN species under ambient 307
conditions measured in this study were on the same order of magnitude as values reported 308
from previous studies using whole-stream 15N-tracer additions (Ashkenas et al. 2004, 309
Hamilton et al. 2001, Merriam et al. 2002, Mulholland et al. 2000,Tank et al. 2000, von 310
Schiller et al. 2009, Sobota et al. 2012). This indicates that the epilithic biofilm uptake rates 311
measured in our channel experiments were representative of natural field conditions. 312
14
We found that ambient U was an order of magnitude higher for NO3- than for NH4
+ 313
in the two study streams, even though NH4+ is theoretically an energetically less costly DIN 314
source and was thus expected to be preferentially assimilated over NO3- (Dortch 1990, Naldi 315
and Wheeler 2002). In fact, estimated values of the relative preference index (RPI) were 316
close to 1 in the two streams. This index was proposed by Dortch (1990) as a means to 317
determine the preference for NH4+ over NO3
- (if values are <1) or for NO3- over NH4
+ (if 318
values are >1). The RPI value of ~1 in our study suggests that biofilms in the two streams 319
have no preference for either DIN species. Thus, the observed higher uptake rates for NO3- 320
than for NH4+ was mostly attributable to the fact that NO3
- was present at higher 321
concentration than NH4+. 322
While no difference in ambient U for NO3- was observed between streams, ambient 323
U for NH4+ was an order of magnitude lower in the high-N stream. Higher NO3
- availability 324
relative to NH4+ availability in the high-N stream may have favored NO3
- uptake over NH4+ 325
uptake in this stream, as suggested by other authors (Fellows et al. 2006, Newbold et al. 326
2006, Bunch and Bernot 2012). Furthermore, at low NH4+ concentration, the presence of 327
NO3- can favor NO3
- assimilation (Geiseeler et al. 2010). It is known that the expression and 328
further biosynthesis of assimilatory nitrate reductase (i.e., the enzyme responsible for NO3- 329
assimilation processes) is induced by the presence of NO3- and NO2
- and suppressed by the 330
presence of NH4+ (Gonzalez et al. 2006). Thus, in the high-N stream, the concurrence of 331
high NO3- concentration and low NH4
+ concentration at ambient conditions may have 332
resulted in lower NH4+ assimilation rates compared to the low-N stream. 333
Differences in nitrification, which can also contribute to NH4+ uptake within the 334
biofilms, are another potential explanation for the differences in U between the streams. If 335
nitrification rate was constrained by the low substrate (i.e., NH4+) availability in the high-N 336
stream, we would expect the contribution of nitrification to total NH4+uptake to be lower in 337
15
that stream. In fact, in the two streams we observed an increase 15NO3- at plateau 338
conditions in the channels where we did the additions of 15NH4+, which is indicative of 339
nitrification (mean ± SE, -N stream and the high-N 340
stream, respectively). Based on the 15NO3 increases, for each fertilization cycle we 341
estimated the contribution of nitrification to total biofilm NH4+ uptake . In the low-N stream 342
this contribution ranged from 0.2% to 7.6%, whereas it was <0.2% in the high-N stream. 343
These results contrast with findings from Bernhardt et al. (2002), who found a higher 344
contribution of nitrification to total NH4+ uptake in high-NO3
- streams of Hubbard Brook 345
(New Hampshire, USA). They hypothesized that when assimilatory processes switch to 346
NO3- uptake (i.e., in high-NO3
- streams), competition between nitrifiers and heterotrophs is 347
ameliorated, resulting in higher nitrification rates. Our data do not support this mechanism, 348
since nitrification rate was probably lower in the high-N stream. Instead, we suggest that 349
combination of both lower NH4+ assimilation and lower nitrification by biofilms in the high-350
N stream explains the differences in U for NH4+ between the two streams. 351
The UN-specific values indicate that the biofilm from the high-N stream was less 352
efficient at taking up both NO3- and NH4
+ from the water column than the biofilm from the 353
low-N stream. Lower uptake efficiencies are often found in streams with high DIN 354
concentrations, due to saturation of the assimilative processes ( Brien et al. 2007). Thus, 355
our results suggest functional differences in the way DIN is cycled within biofilm 356
communities grown under low- and high-N conditions, which in turn may also determine the 357
observed differences in the uptake kinetic response for both DIN species between stream 358
types. 359
Biofilm DIN uptake kinetics 360
Contrary to expectations from nutrient kinetic theory, increases in NO3- availability 361
did not enhance biofilm uptake rates for NO3-. In the high-N stream, addition of NO3
- had no 362

16
effect on biofilm uptake, suggesting that uptake capacity of biofilm assemblages was most 363
likely saturated at the ambient NO3- concentration. Earl et al. (2006) suggested that when N 364
is no longer limiting in streams, a zero-order mathematical model (i.e., constant rate with 365
slope of 0) is more applicable, which is in concordance with results found in the high N-366
stream. The lack of biofilm uptake response to increases in NO3- concentration could be 367
alternatively explained by tight coupling of NO3- uptake to availability of other nutrients 368
(Fairchild et al. 1985, Sterner et al. 1992). In this regard, Schanz and Juon (1983) suggested 369
that phosphorus (P) is potentially a limiting element at DIN:P ratios above 20 (others have 370
suggested a transition from N to P limitation at DIN:P ratios around 16-17; Redfield 1958, 371
Grimm and Fisher 1986). Although we added SRP in the fertilization solutions to maintain 372
background DIN:P ratios throughout fertilizations, these ratios were well above the potential 373
P-limitation thresholds, especially in the high-N stream (i.e., mean ± SE, 394 ± 32). In this 374
sense, NO3- uptake in the high-N stream may have been constrained by P insufficiency. 375
However, If P was the limiting nutrient, one might expect that increases in P availability 376
should alleviate any P limitation and thus enhance NO3- uptake. We believe this alternative 377
explanation is unlikely, since previous nutrient-limitation bioassays in the high-N stream 378
have failed to show P limitation (von Schiller et al. 2007). 379
Increases in NO3- availability in the low-N stream provoked a decrease in biofilm 380
uptake rates, indicating a possible inhibitory effect of high NO3- concentrations on biofilm 381
uptake in this stream. Inhibitory effects on the uptake of NH4+ or NO2
- at high concentrations 382
are reported in the literature (usually associated with nitrification processes; Kim et al 2006, 383
Vadivelu et al. 2007). However, as far as we know, there is no previous evidence of 384
inhibition of NO3- uptake at high NO3
- concentrations. Nevertheless, inhibitory effects of 385
long-term NO3- enrichment on periphyton growth have been reported from nutrient-386
diffusing substrate experiments (Bernhardt and Likens 2004) and a few studies have shown 387

17
potentially toxic effects of NO3- on freshwater animals and plants (Camargo and Alonso 388
2006; Lambert and Davy 2011). Unfortunately, our experiments do not allow us to 389
determine the mechanisms that could explain the observed pattern, but they provide 390
evidence that a short-term, sharp increase in NO3- concentration may have inhibitory effects. 391
Michaelis-Menten kinetics described biofilm uptake responses to increases in NH4+ 392
concentration in the two streams. Because values of Ks were higher than ambient 393
concentrations of NH4+ in both streams, we conclude that biofilm uptake for this DIN source 394
was below saturation at ambient concentrations (Tilman 1982). Therefore, biofilms were 395
able to respond positively to short-term increases in NH4+ concentration within a certain 396
range in the two streams. Bunch and Bernot (2012) also compared uptake responses of 397
microbial communities to NH4+ and NO3
- enrichments; and they observed that responses 398
were more immediate and pronounced in the case of NH4+ and were delayed and more 399
variable in the case of NO3-. They suggested that preference for NH4
+ as a DIN source by 400
microbial communities dictates stronger and more rapid uptake responses to changes in 401
NH4+ than in NO3
- concentration. 402
Our results agree with those by Bunch and Bernot (2012) in showing rapid response 403
to increases in NH4+; however, in this study the values of RPI of ~1 indicated no clear 404
preference for NH4+ over NO3
-, at least under ambient conditions. An alternative explanation 405
for the difference in the kinetic responses between NO3- and NH4
+ involves enzymatic 406
responses to short-term changes in availability. Increased availability of NH4+ in NH4
+-407
amended channels may have triggered repression of NO3- reductase and increased biofilm 408
NH4+ uptake to meet N demand (Gonzalez et al. 2006). This could explain the positive 409
biofilm NH4+ uptake response to increases in NH4
+ concentration even though uptake 410
responses for NO3- indicated that biofilm demand for this DIN species was saturated at 411
ambient conditions. Previous studies show a Michaelis-Menten response of nitrification 412
18
rates to increases in NH4+ concentration within a similar range of NH4
+ concentrations used 413
in our study (Koper et al. 2010). Nitrification was likely substrate-limited at the relatively 414
low NH4+ concentrations in the two study streams, which would produce a positive response 415
to increased NH4+ concentration that conforms to a Michaelis-Menten model. However, our 416
a posteriori calculations of nitrification contribution to the whole-channel uptake suggest 417
that this is only a minor contributor to observed kinetics of NH4+ uptake. We suggest that a 418
combination of several of the above-mentioned mechanisms best explains the different 419
kinetic responses of NH4+ and NO3
- in the two study streams. 420
Although NH4+ uptake kinetics fit the Michaelis-Menten model in the two streams, 421
the kinetic parameters (i.e., Ks and Umax) clearly differed between streams, supporting our 422
predictions. NH4+ Umax of the biofilm in the high-N stream was 21 times higher than Umax of 423
the biofilm in the low-N stream. The high-N stream had higher biofilm biomass as well as 424
more photoautotrophic organisms (as indicated by the chlorophyll-a content) than the low-N 425
stream, which could explain the higher maximum uptake observed in the high-N stream. 426
However, Umax weighted by N content of biofilm dry mass, a surrogate measure of uptake 427
efficiency, was only 4 times higher in the high-N stream. Biofilms in the low-N stream were 428
therefore relatively more efficient in the uptake of NH4+ than those in the high-N stream, 429
which is in agreement with uptake results measured at ambient DIN conditions. 430
In contrast, the biofilm in the low-N stream showed a higher affinity (i.e., lower Ks) 431
for NH4+ than the biofilm in the high N-stream. Higher affinities for substrate are often 432
attributed to microorganisms exposed to lower ambient concentrations (Collos et al. 2005, 433
Martens-Habbena et al. 2009). This explanation may not apply to our study if we only 434
consider ambient NH4+ concentration, which was similar and low in the two streams. 435
However, it is more appropriate in discussing nutrient limitation to consider the total DIN 436
concentration, which was two times lower in the low-N stream, since biofilms are capable of 437

19
meeting their N demand by uptake of either DIN species. Alternatively, differences in NH4+ 438
affinity between streams may be caused by boundary-layer constraints arising from 439
differences in biofilm structure (Dodds et al. 2002). In support of this idea, the higher 440
AFDM content per unit area in the high N-stream implies thicker biofilms and higher 441
diffusion limitation for DIN to reach all cells in the biofilm (Stewart 2003, Teissier et al. 442
2007). Diffusion limitation has been demonstrated for inorganic carbon uptake and 443
nitrification activity in model biofilms; both processes were restricted to the surface layer of 444
different thickness (Gieseke et al. 2005). As a result, the thickness of the biofilm in the high-445
N stream may contribute to increase the range of NH4+ concentration within which there is a 446
positive response of NH4+ uptake rate. It is worth noting that the constraints due to diffusion 447
in thicker biofilms operate for both N assimilation and nitrification; and thus, this can 448
contribute to amplify the NH4+ concentration range before saturation because the two 449
processes may be subjected to different kinetics. 450
Finally, we cannot rule out differences between the two streams in environmental 451
conditions, such as light availability and temperature, as causes of observed differences in 452
biofilm uptake kinetics for NH4+. Although we aimed to conduct experiments in the two 453
streams within similar ranges of environmental conditions, a large flood occurred in the 454
high-N stream, forcing us to postpone the experiment until the biofilm communities 455
recovered fully. As a result, temperature and light availability were higher in the low-N 456
stream than in the high-N stream during the experiments, which could have enhanced 457
biofilm activity and kinetic responses in the low-N stream. However, the relevance of 458
temperature for nutrient uptake kinetics remains unclear; some studies have shown no 459
evidence of sensitivity of Michaelis-Menten parameters to temperature (Smith et al 2011). 460
Although light availability was higher in the low-N stream, the chlorophyll a content in the 461
high-N stream was ~9 times higher than in the low-N stream. Thus, this factor could not 462
20
have caused the kinetic differences observed, at least for the photoautotrophic component of 463
the biofilms. These arguments suggest that observed differences in biofilm uptake kinetics 464
between streams are more influenced by stream differences in DIN concentrations and 465
relative proportions of the two DIN species than by differences in other environmental 466
factors. 467
Conclusions 468
Biofilm uptake responses to short-term changes in DIN concentration in the two 469
investigated Mediterranean streams during the study period varied depending on ambient 470
conditions, including DIN concentrations, where biofilm developed, as well as on the DIN 471
species considered. Under short pulses of increased DIN concentration, these particular 472
stream biofilms were more reactive to changes in NH4+ concentration than to changes in 473
NO3- concentration, yet ambient uptake rates for NO3
- far exceeded those for NH4+, largely 474
because the former N species was present at much higher concentration. The greater kinetic 475
response to NH4+ may be attributable to repression of enzymes associated with NO3
- uptake, 476
or a different process (nitrification) contributing to total uptake. The lack of response to 477
NO3- suggests this species is at saturating concentrations. Our results contrast with findings 478
from laboratory-scale experiments, in which NO3- kinetics conformed to the Michaelis-479
Menten model (Eppley et al. 1969, Kemp and Dodds 2002, Maguer et al. 2011). In our 480
study, stream biofilm communities were able to respond to increases in NH4+ concentration, 481
which is an energetically cheaper N source than NO3- and is also the substrate for 482
nitrification. However, clear differences in NH4+ response by biofilms were observed 483
between the two streams, likely owing to differences in biofilm characteristics, interactions 484
which other N species, such as NO3-, or adaptive changes in affinity. 485
As pointed out by other studies, human activities associated with different land uses 486
not only may enrich the adjacent streams with DIN but may also alter the proportion of DIN 487
21
species in those ecosystems. In this regard, streams draining catchments dominated by 488
agricultural practices tend to be enriched in NO3- whereas streams draining urbanized 489
catchments are often NH4+-enriched (Stanley and Maxted 2008; Lasaletta et al. 2009; Martí 490
et al. 2010). Given widespread changes in land use, our findings have implications for 491
understanding and managing N losses to downstream ecosystems, since the distinct N 492
species that reach stream ecosystems could be potentially retained by the in-stream biofilm 493
communities (i.e., NH4+) or exported downstream, with the subsequent enrichment of 494
receiving waters (i.e., NO3-). 495
496
497
498
499
500
501
502
503
504
505
506
507
508
509
510
511
512
22
Acknowledgements 513
We thank A. Poch, S. Merbt and L. Proia for excellent field assistance and J. L. Riera 514
for assistance in statistical analyses. We are also grateful to the Font del Regàs landowners 515
and Massaneda Garden for allowing access to the study sites during the experiments. This 516
study was funded by the Spanish Ministry of Education and Science through NICON project 517
(ref: CGL2005-7362). M. Ribot was supported by a contract with the Spanish Ministry of 518
Science and Innovation through the ISONEF project (CGL2008-05504-C02-02/BOS). M. 519
Peipoch was funded by a Formación de Personal Investigador PhD fellowship from the 520
Spanish Ministry of Science and Innovation. ork was additionally funded 521
by a Juan de la Cierva postdoctoral contract (JCI-2010-06397) from the Spanish Ministry of 522
Science and Innovation. N. B. Grimm was supported by funds from the Spanish Council for 523
Scientific Research (CSIC). 524
525
23
Literature cited 526
APHA (American Public Health Association). 1995. Standard methods for the examination 527
of water and wastewater, 19th edition. American Public Health Association, 528
Washington DC. 529
Ashkenas, L. R., S. L. Johnson, S. V. Gregory, J. L. Tank, and W. M. Wollheim. 2004. A 530
stable isotope tracer study of nitrogen uptake and transformation in an old-growth 531
forest stream. Ecology 85:1725-1739. 532
Battin, T. J., L. A. Kaplan, J. D. Newbold, and C. M. E. Hansen. 2003. Contributions of 533
microbial biofilms to ecosystem processes in stream mesocosms. Nature 426:439-534
442. 535
Bernot, M. J., J. L. Tank, T. V. Royer, and M. B. David. 2006. Nutrient uptake in streams 536
draining agricultural catchments of the midwestern United States. Freshwater 537
Biology 51:499-509. 538
Bernhardt, E. S., and G. E. Likens. 2004. Controls on periphyton biomass in heterotrophic 539
streams. Freshwater Biology 49:14-27. 540
Bernhardt, E. S., R. O. Hall, and G. E. Likens. 2002. Whole-system estimates of nitrification 541
and nitrate uptake in streams of the Hubbard Brook Experimental Forest. Ecosystems 542
5:419-430. 543
Bothe, H., S. J. Fergusson, and W.E. Newton. 2007. Biology of the Nitrogen Cycle. 1st 544
edition, Elsevier B.V, Oxford, UK. 545
Bunch, N. D., and M. J. Bernot. 2012. Nitrate and ammonium uptake by natural stream 546
sediment microbial communities in response to nutrient enrichment. Research in 547
Microbiology 163:137-141. 548

24
Camargo, J. A., and A. Alonso. 2006. Ecological and toxicological effects of inorganic 549
nitrogen pollution in aquatic ecosystems: A global assessment. Environment 550
International 32:831-849. 551
Carpenter, S. R., N. F. Caraco, D. L. Correll, R. W. Howarth, A. N. Sharpley, and V. H. 552
Smith. 1998. Nonpoint pollution of surface waters with phosphorus and nitrogen. 553
Ecological Applications 8:559-568. 554
Collos, Y., A. Vaquer, and P. Souchu. 2005. Acclimation of nitrate uptake by phytoplankton 555
to high substrate levels. Journal of Phycology 41:466-478. 556
Covino, T. P., B. L. Mcglynn, and R. A. Mcnamara. 2010. Tracer Additions for Spiraling 557
Curve Characterization (TASCC): Quantifying stream nutrient uptake kinetics from 558
ambient to saturation. Limnology and Oceanography-Methods 8:484-498. 559
Dodds, W. K., A. J. Lopez, W. B. Bowden, S. Gregory, N. B. Grimm, S. K. Hamilton, A. E. 560
Hershey, E. Marti, W. H. Mcdowell, J. L. Meyer, D. Morrall, P. J. Mulholland, B. J. 561
Peterson, J. L. Tank, H. M. Valett, J. R. Webster, and W. Wollheim. 2002. N uptake 562
as a function of concentration in streams. Journal of the North American 563
Benthological Society 21:206-220. 564
Dortch, Q. 1990. The interaction between ammonium and nitrate uptake in phytoplancton. 565
Marine Ecology-Progress Series 61:183-201. 566
Earl, S. R., H. M. Valett, and J. R. Webster. 2006. Nitrogen saturation in stream ecosystems. 567
Ecology 87:3140-3151. 568
Eppley, R. W., J. N. Rogers, and J. J. Mccarthy. 1969. Half-saturation constant for uptake of 569
nitrate and ammonium by marine phitoplankton. Limnology and Oceanography 570
14:912-920. 571
Fairchild, G. W., R. L. Lowe, and W. B. Richardson. 1985. Algal periphyton growth on 572
nutrient-diffusing substrates-an in situ bioassay. Ecology 66:465-472. 573
25
Fellows, C. S., H. M. Valett, C. N. Dahm, P. J. Mulholland, and S. A. Thomas. 2006. 574
Coupling nutrient uptake and energy flow in headwater streams. Ecosystems 9:788-575
804. 576
Gieseke, A., J. L. Nielsen, R. Amann, P. H. Nielsen, and D. De Beer. 2005. In situ substrate 577
conversion and assimilation by nitrifying bacteria in a model biofilm. Environmental 578
Microbiology 7:1392-1404. 579
Geisseler, D., W. R. Horwath, R. G. Joergensen, and B. Ludwig. 2010. Pathways of nitrogen 580
utilization by soil microorganisms - A review. Soil Biology & Biochemistry 581
42:2058-2067. 582
Gonzalez, P. J., C. Correia, I. Moura, C. D. Brondino, and J. J. G. Moura. 2006. Bacterial 583
nitrate reductases: Molecular and biological aspects of nitrate reduction. Journal of 584
Inorganic Biochemistry 100:1015-1023. 585
Grimm, N.B., and S.G. Fisher. 1986. Nitrogen limitation potential of Arizona streams and 586
rivers. Journal of the Arizona-Nevada Academy of Science 21:31-43 587
Hamilton, S. K., J. L. Tank, D. F. Raikow, W. M. Wollheim, B. J. Peterson, and J. R. 588
Webster. 2001. Nitrogen uptake and transformation in a midwestern US stream: A 589
stable isotope enrichment study. Biogeochemistry 54:297-340. 590
Holmes, R. M., J. W. Mcclelland, D. M. Sigman, B. Fry, and B. J. Peterson. 1998. 591
Measuring 15N-NH4+ in marine, estuarine and fresh waters: An adaptation of the 592
ammonia diffusion method for samples with low ammonium concentrations. Marine 593
Chemistry 60:235-243. 594
Howarth, R. W., G. Billen, D. Swaney, A. Townsend, N. Jaworski, K. Lajtha, J. A. 595
Downing, R. Elmgren, N. Caraco, T. Jordan, F. Berendse, J. Freney, V. Kudeyarov, 596
P. Murdoch, and Z. L. Zhu. 1996. Regional nitrogen budgets and riverine N&P 597

26
fluxes for the drainages to the North Atlantic Ocean: Natural and human influences. 598
Biogeochemistry 35:75-139. 599
Kemp, M. J., and W. K. Dodds. 2002. The influence of ammonium, nitrate, and dissolved 600
oxygen concentrations on uptake, nitrification, and denitrification rates associated 601
with prairie stream substrata. Limnology and Oceanography 47:1380-1393. 602
Kim, D. J., D. I. Lee, and J. Keller. 2006. Effect of temperature and free ammonia on 603
nitrification and nitrite accumulation in landfill leachate and analysis of its nitrifying 604
bacterial community by FISH. Bioresource Technology 97:459-468. 605
Koper, T. E., J. M. Stark, M. Y. Habteselassie, and J. M. Norton. 2010. Nitrification exhibits 606
Haldane kinetics in an agricultural soil treated with ammonium sulfate or dairy-waste 607
compost. Fems Microbiology Ecology 74:316-322. 608
Lambert, S. J., and A. J. Davy. 2011. Water quality as a threat to aquatic plants: 609
discriminating between the effects of nitrate, phosphate, boron and heavy metals on 610
charophytes. New Phytologist 189:1051-1059. 611
Lassaletta, L., H. Garcia-Gomez, B. S. Gimeno, and J. V. Rovira. 2009. Agriculture-induced 612
increase in nitrate concentrations in stream waters of a large Mediterranean 613
catchment over 25 years (1981-2005). Science of The Total Environment 407:6034-614
6043. 615
Maguer, J. F., S. L'Helguen, J. Caradec, and C. Klein. 2011. Size-dependent uptake of 616
nitrate and ammonium as a function of light in well-mixed temperate coastal waters. 617
Continental Shelf Research 31:1620-1631. 618
Martens-Habbena, W., P. M. Berube, H. Urakawa, J. R. De La Torre, and D. A. Stahl. 2009. 619
Ammonia oxidation kinetics determine niche separation of nitrifying Archaea and 620
Bacteria. Nature 461:976-979. 621
27
Martí, E., J. Riera, and F. Sabater. 2010. Effects of Wastewater Treatment Plants on Stream 622
Nutrient Dynamics Under Water Scarcity Conditions. Pages 173-195 in S. Sabater 623
and D. Barceló (editors). Water Scarcity in the Mediterranean. The Handbook of 624
Environmental Chemistry. Springer Berlin, Heidelberg. 625
Mcintire, C. D., S. V. Gregory, A. D. Steinman, and G. A. Lamberti. 1996. Modeling 626
benthic algal communities: an example from stream ecology. Academic Press. 627
Merriam, J. L., W. H. Mcdowell, J. L. Tank, W. M. Wollheim, C. L. Crenshaw, and S. L. 628
Johnson. 2002. Characterizing nitrogen dynamics, retention and transport in a 629
tropical rainforest stream using an in situ 15N addition. Freshwater Biology 47:143-630
160. 631
Mulholland, P. J., J. L. Tank, D. M. Sanzone, W. M. Wollheim, B. J. Peterson, J. R. 632
Webster, and J. L. Meyer. 2000. Nitrogen cycling in a forest stream determined by a 633
15N tracer addition. Ecological Monographs 70:471-493. 634
Mulholland, P. J., and J. R. Webster. 2010. Nutrient dynamics in streams and the role of J-635
NABS. Journal of the North American Benthological Society 29:100-117. 636
Naldi, M., and P. A. Wheeler. 2002.15N measurements of ammonium and nitrate uptake by 637
Ulva fenestrata (Chlorophyta) and Gracilaria pacifica (Rhodophyta): Comparison of 638
net nutrient disappearance, release of ammonium and nitrate, and 15N accumulation 639
in algal tissue. Journal of Phycology 38:135-144. 640
Newbold, J. D., T. L. Bott, L. A. Kaplan, C. L. Dow, J. K. Jackson, A. K. Aufdenkampe, L. 641
A. Martin, D. J. Van Horn, and A. A. De Long. 2006. Uptake of nutrients and 642
organic C in streams in New York City drinking-water-supply watersheds. Journal of 643
the North American Benthological Society 25:998-1017. 644

28
O'Brien, J. M., and W. K. Dodds. 2008. Ammonium uptake and mineralization in prairie 645
streams: chamber incubation and short-term nutrient addition experiments. 646
Freshwater Biology 53:102-112. 647
O'Brien, J. M., and W. K. Dodds. 2010. Saturation of NO3- uptake in prairie streams as a 648
function of acute and chronic N exposure. Journal of the North American 649
Benthological Society 29:627-635. 650
O'Brien, J. M., W. K. Dodds, K. C. Wilson, J. N. Murdock, and J. Eichmiller. 2007. The 651
saturation of N cycling in Central Plains streams: 15N experiments across a broad 652
gradient of nitrate concentrations. Biogeochemistry 84:31-49. 653
Payn, R. A., J. R. Webster, P. J. Mulholland, H. M. Valett, and W. K. Dodds. 2005. 654
Estimation of stream nutrient uptake from nutrient addition experiments. Limnology 655
and Oceanography-Methods 3:174-182. 656
Pusch, M., D. Fiebig, I. Brettar, H. Eisenmann, B. K. Ellis, L. A. Kaplan, M. A. Lock, M. 657
W. Naegeli, and W. Traunspurger. 1998. The role of micro-organisms in the 658
ecological connectivity of running waters. Freshwater Biology 40:453-495. 659
Redfield, A. C. 1958. The biological control of chemical factors in the environment. 660
American Scientist 46:205-221. 661
Schanz, F., and H. Juon. 1983. 2 different methods of evaluating nutrient limitations of 662
periphyton bioassays, using water from the river Rhine and 8 of its tributaries. 663
Hydrobiologia 102:187-195. 664
Sigman, D. M., M. A. Altabet, R. Michener, D. C. Mccorkle, B. Fry, and R. M. Holmes. 665
1997. Natural abundance-level measurement of the nitrogen isotopic composition of 666
oceanic nitrate: an adaptation of the ammonia diffusion method. Marine Chemistry 667
57:227-242. 668

29
Smith, S. L. 2011. Consistently modeling the combined effects of temperature and 669
concentration on nitrate uptake in the ocean. Journal of Geophysical Research-670
Biogeosciences 116. 671
Stanley, E. H., and J. T. Maxted. 2008. Changes in the dissolved nitrogen pool across land 672
cover gradients in Wisconsin streams. Ecological Applications 18:1579-1590. 673
Sterner, R. W., J. J. Elser, and D. O. Hessen. 1992. Stoichiometric relationships among 674
producers, consumers and nutrient cycling in pelagic ecosystems. Biogeochemistry 675
17:49-67. 676
Stewart, P. S. 2003. Diffusion in biofilms. Journal of Bacteriology 185:1485-1491. 677
Tank, J. L., J. L. Meyer, D. M. Sanzone, P. J. Mulholland, J. R. Webster, B. J. Peterson, W. 678
M. Wollheim, and N. E. Leonard. 2000. Analysis of nitrogen cycling in a forest 679
stream during autumn using a 15N-tracer addition. Limnology and Oceanography 680
45:1013-1029. 681
Tilman, D., S. S. Kilham, and P. Kilham. 1982. Phytoplankton community ecology. The role 682
of limiting. Annual Review of Ecology and Systematics 13:349-372. 683
Teissier, S., M. Torre, F. Delmas, and F. Garabetian. 2007. Detailing biogeochemical N 684
budgets in riverine epilithic biofilms. Journal of the North American Benthological 685
Society 26:178-190. 686
Vadivelu, V. M., J. Keller, and Z. G. Yuan. 2007. Effect of free ammonia on the respiration 687
and growth processes of an enriched Nitrobacter culture. Water Research 41:826-688
834. 689
von Schiller, D., E. Marti, and J. L. Riera. 2009. Nitrate retention and removal in 690
Mediterranean streams bordered by contrasting land uses: a 15N tracer study. 691
Biogeosciences 6:181-196. 692

30
von Schiller, D., E. Marti, J. L. Riera, and F. Sabater. 2007. Effects of nutrients and light on 693
periphyton biomass and nitrogen uptake in Mediterranean streams with contrasting 694
land uses. Freshwater Biology 52:891-906. 695
Zar J.H. (1996) Biostatistical analysis, 3rd edn. Prenticel-Hall, New Jersey. 696
697
31
Table legends 698
Table 1. Water temperature, photosynthetically active radiation (PAR), background nutrient 699
concentration for both dissolved inorganic nitrogen (DIN) species and soluble reactive 700
phosphorus (SRP) and biofilm characteristics for both study streams during the experiments. 701
Nutrient data from biweekly samplings from September 2004 to July 2007 are also provided 702
(in brackets). All data are reported as the mean ± SE. 703
704
Low-N stream High-N stream
Water temperature (ºC) 15.4 ± 0.1 11.0 ± 0.2
PAR (mol m-2 day-1) 9.5 ± 3.4 1.4 ± 0.3
NO3- (µg N/L) 222 ± 2
(181 ± 11) 400 ± 27
(780 ± 44)
NH4+ (µg N/L) 15 ± 1
(12 ± 1) 8 ± 1
(19 ± 2)
SRP (µg P/L) 11 ± 0.3 (4 ± 0.5)
3 ± 0.3 (15 ± 2.6)
DIN:SRP (molar) 48 ± 1 (192 ± 32)
394 ± 32 (429 ± 106)
Ash free dry mass (g/m2) 0.9 ± 0.1 4.3 ± 0.3
Chlorophyll- a (µg/cm2) 0.3 ± 0.03 2.6 ± 0.2
705

32
Table 2. Statistical parameters of linear, Michaelis-Menten and efficiency loss models used 706
to evaluate the model that best fits the relationship between uptake rate (U) and DIN 707
concentration (C) for both streams and DIN species (NO3- and NH4
+). +). The Akaike 708
information criterion (AIC) was used to estimate Akaike weights,Wi, which give the relative 709
likelihood of each model. The highest relative likelihoods are marked in bold. For the 710
Michaelis-Menten model, a corresponds to the maximum uptake rate (Umax; µg N m-2 s-1) 711
and b corresponds to the half saturation constant (Ks;µg N/L). The 95% confidence intervals 712
of the values are also reported in brackets. 713
714
715
Low-N stream High-N stream NO3
- a b AIC Wi a b AIC Wi
Linear, U = a + bC 3.1 (2.7 3.5)
-2.9e-4 (-4.0e-4 - -1.8e-4) 33.4 0.97 4.3
(3.1 5.5) 4.0e-4
(-2.3e-5 8.2e-4) 55.1 0.36
Michaelis-Menten, U = a C / b + C 2.1 (1.6 2.6)
-85.8 (-131.9 - -7.6) 48.0 0 6.5
(4.8 9.2) 384
(-36.5 1282) 55.6 0.28
Efficiency Loss, U = a Cb 11.9 (5.3 27.1)
-0.2 (-0.4 - -0.1) 48.1 0.03 1.3
(0.3 5.6) 0.2
(-1.0e-2 0.4) 55.1 0.37
NH4+ a b AIC Wi a b AIC Wi
Linear, U = a + bC 0.8 (0.5 1.0)
1.6e-3 (2.9e-4 2.9e-3) 17.3 0 0.3
(-0.5 - 1.1) 3.0e-2
(2.5e-2 - 3.4e-2) 45.1 0.03
Michaelis-Menten, U = a C / b + C 1.3 (1.2 1.5)
17.1 (7.8 34.9) 2.6 0.98 28.0
(17.4 113) 628
(307 3449) 38.9 0.77
Efficiency Loss, U = a Cb 0.4 (0.2 0.7)
0.2 (9.3e-2 0.3) 10.9 0.02 8.2e-2
(3.0e-2 - 0.2) 0.8
(0.7 - 1.0) 41.7 0.19
716

33
Figure legends 717
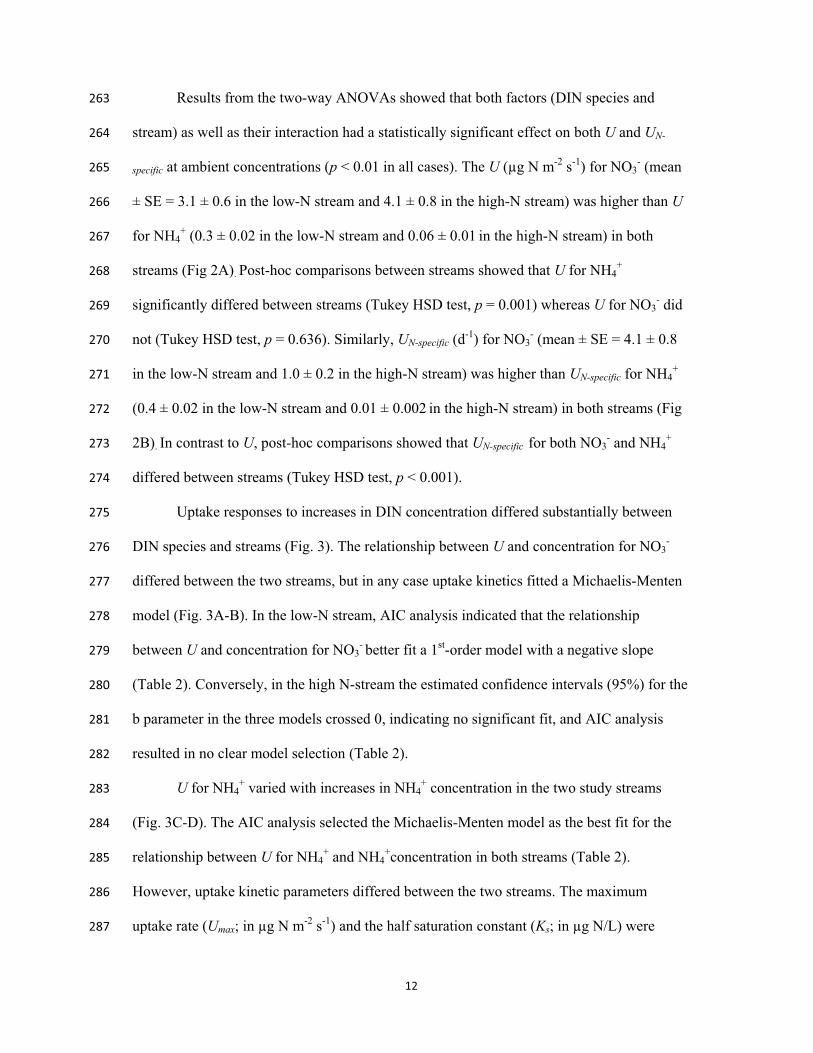
Figure 1. Scheme of the channel setting used to experimentally approach the objectives of 718
this study. (A) In-situ channels structure. Upstream water supplied the feeding tank, which 719
in turn fed each channel independently. Fertilization and 15N amended solutions for NO3- or 720
NH4+ reached each single channel independently (3 channels for each DIN species). (B) 721
Detail of experimental design to conduct the different fertilization levels (over 24h each) and 722
the 15N tracer additions (over the last 6 h for each fertilization treatment) to measure biofilm 723
N uptake for each DIN species (3 channels for each DIN species treatment). For each N 724
fertilization cycle, we used a new set of colonized substrata from the stream that was 725
collected upstream of the channel setting 726
727
Figure 2. Uptake rate (U; A) and biomass-specific N uptake rate (UN-specific; B) at ambient 728
concentrations for the two DIN species (NO3- and NH4
+) and study streams. Each value is 729
the mean ± SE of 3 replicates (one per channel). Different letters indicate significant 730
differences (p < 0.05) based on post-hoc Tukey HSD test, after a significant two-way 731
ANOVA test. 732
733
Figure 3. Uptake kinetics of NO3- and NH4
+ in the low-N stream (A and C) and the high-N 734
stream (B and D). The first point in each panel corresponds to the uptake rate (U) measured 735
at ambient DIN concentration. Subsequent points correspond to measurements of U 736
throughout experimental fertilizations. Each point is the mean ± SE of 3 replicates (one per 737
channel). Lines represent the selected regressional model from AIC analysis (see Table 2 for 738
regression statistics). 739
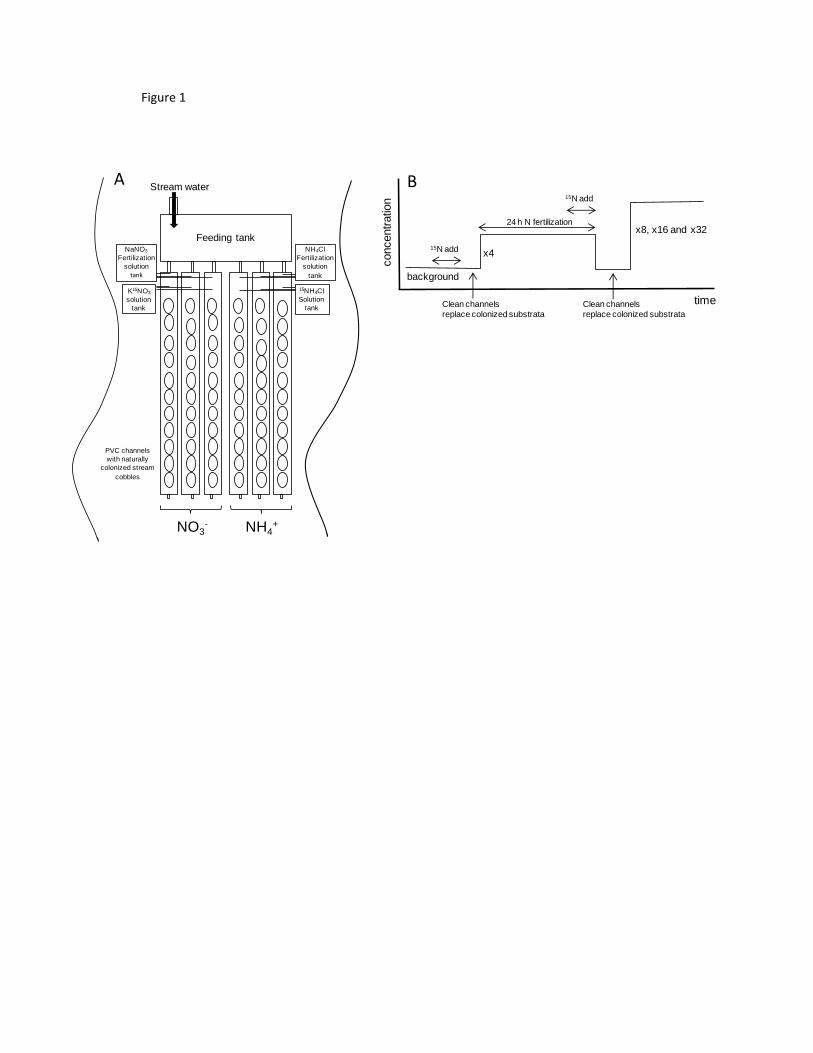
Figure 1
A
Feeding tank
NO3-
PVC channels with naturally
colonized stream cobbles
NH4+
NaNO3
Fertilization solution
tank
NH4ClFertilization
solutiontank
K15NO3
solutiontank
15NH4ClSolution
tank
Stream water
conc
entr
atio
n
x8, x16 and x32
time
background
x4
24 h N fertilization
15N add
Clean channelsreplace colonized substrata
15N add
B
Clean channelsreplace colonized substrata