influence of monitoring and evaluation on the …
TRANSCRIPT

i
INFLUENCE OF MONITORING AND EVALUATION ON THE POVERTY
GRADUATION PROGRAM OF BOMA IN NGURUNIT, NAMAREI AND
ILLAUTLOCATIONS, MARSABIT COUNTY, KENYA
BY
JEREMIAH SARUNYE LENGURE
A RESEARCH PROJECT SUBMITTED IN PARTIAL FULFILLMENT OF THE
REQUIREMENTS FOR THE DEGREE OF MASTER OF ARTS IN MONITORING
AND EVALUATION
SCHOOL OF PLANNING & ARCHITECTURE
MASENO UNIVERSITY
2021

ii
DECLARATION
Student:
This research proposal is my original work and has not been submitted to any other institution of
learning for examination or an academic award.
Jeremiah Sarunye Lengure: EL/SPM/01079/2016
Sign.......................................... Date………………………….
Supervisor:
This research proposal has been submitted for examination with my approval as the university
supervisor.
Sign.......................................... Date………………………….
Dr. Ochieng' M.A. Ahonobadha
Department of Urban and Regional Planning
Maseno University

iii
ACKNOWLEDGEMENT
I express my sincere gratitude to my supervisor, Dr. Marilyn Apella for her guidance during the
study. I am very grateful to all my lecturers who impacted me with knowledge throughout my
coursework. I thank the Maseno University for giving me a chance to pursue this course.
I appreciate the immense support from BOMA project in Kenya, the staff who willingly and
generously provided me with the information I needed for my study. I wish to pass my sincere
gratitude to my family, colleagues and friends who have been supporting me throughout this
journey in prayers and encouragement. Finally, I thank The Almighty God for his blessings and
giving me strength. To Him I give all the glory.

iv
DEDICATION
I wish to dedicate this work to my wife Caroline, daughter Shammy, and my parents Mr and Mrs
Lengure
v
ABSTRACT
Since 1990, more than 1.1 billion people have moved out of extreme poverty globally. Africa is
the poorest, with 28 of the world‟s poorest countries, and more than half of the world‟s poor,
living in Sub-Sahara. Kenya is ranked eighth globally and sixth in Africa, among countries with
the largest number of people living in extreme poverty with 29% (14.7 million) of its population
consuming less than $1.90 (Sh197) per day or Kshs 5,910 monthly. Marsabit County, poverty
index rating in 2018, stood at 83.2%. Against this backdrop, BOMA Project a Non-
Governmental Organization (NGO) working in Marsabit County put in place a poverty
graduation program. This study sought to examine the extent to which monitoring and evaluation
(M&E) contributed to project performance. The main objective of the study was to analyse the
influence of the monitoring and evaluation system on BOMA‟s poverty graduation program in
Ngurunit, Namarei and Illaut Locations, in Marsabit County. The specific objectives were to:
Establish influence of monitoring and evaluation on the performance of BOMA micro businesses
in Ngurunit, Namarei And Illaut Locations, Marsabit County; Establish influence of monitoring
and evaluation on human capacity building in BOMA Project; Establish influence of monitoring
and evaluation data on the performance of saving and lending scheme of BOMA micro
businesses in Ngurunit, Namarei And Illaut Locations, Marsabit County. The researcher
conducted an experimental study, where a Randomized Control Trail (RCT) was used to evaluate
the influence of BOMA‟s project, alongside other mixed research approaches (Interviews, FGDs
and document analysis) for triangulation purposes. The study targeted women adults, who
benefited from BOMA intervention and graduated more than a year ago and those who have
never benefited from BOMA programs. A random sample of 49 women was used, 24
beneficiaries and 25 non-beneficiaries. 13 interviews were conducted with project implementers
(10 field officers and 3 with M&E officers). Face to face interviews, questionnaires, documents
analysis and Focused Group Discussion (FGD) were used to collect data. Data collected was
analyzed using descriptive statistics. Results reveal high increase in assets, income and savings
with BOMA beneficiaries compared to non-beneficiaries. BOMA beneficiaries reported a
cumulative 78% increase in income compared to only 20% by non-beneficiaries. A 100% of
beneficiaries have savings and save regularly in more than one place compared to only 20% of
the non-beneficiaries with saving and only 8% who regularly save. Also results shows that
BOMA beneficiaries have been empowered to access credit services. On borrowing 96% of the
beneficiaries borrow compared to only 8% of non-beneficiaries with 100% beneficiaries in
position to repay their own loans compared to only 8% of non-beneficiaries. These results can be
attributed to the monitoring and evaluation as a management function, as confirmed by the
FGDS. In conclusion, the study has shown that monitoring and evaluation has an influence on
project performance. However, M&E results and findings shared to all relevant people for timely
decisions and planning. BOMA management also should take active part in M&E activities. The
study is therefore beneficial to NGOs, donor agencies, project managers, policy makers and
project management students who are involved in the designing and implementation of result-
based and effective M&E.

vi
TABLE OF CONTENT
DECLARATION ............................................................................................................................ ii
ACKNOWLEDGEMENT ............................................................................................................. iii
DEDICATION ............................................................................................................................... iv
ABSTRACT .................................................................................................................................... v
TABLE OF CONTENT ................................................................................................................. vi
ABBREVIATIONS AND ACRONYMS ....................................................................................... x
DEFINITION OF ERMS ............................................................................................................... xi
LIST OF TABLES ....................................................................................................................... xiii
LIST OF FIGURES ..................................................................................................................... xiv
CHAPTER ONE: INTRODUCTION ......................................................................................... 1
1.1Background of the Study ........................................................................................................... 1
1.2 Problem Statement .................................................................................................................... 4
1.3 The Main Objective .................................................................................................................. 5
1.3.1 Specific Objectives of the Study ............................................................................................ 5
1.4 Research Questions ................................................................................................................... 5
1.5 Scope and Limitations of the Study .......................................................................................... 6
1.6 Justification of the Study .......................................................................................................... 6
CHAPTER TWO: LITERATURE REVIEW ............................................................................ 8
2.1 Introduction ............................................................................................................................... 8
2.1.1 Influence of Monitoring and Evaluation of Performance of Businesses ............................... 8
2.1.2 Influence of Monitoring and Evaluation on Human Capacity ............................................. 11
2.1.3 Influence of Monitoring and Evaluation on PERFORMANCE Saving and Lending
Schemes ............................................................................................................................... 14
2.2 Conceptual Framework ........................................................................................................... 17
2.3 Conceptual Framework ........................................................................................................... 18
2.4 Knowledge Gap ...................................................................................................................... 18
CHAPTER THREE: RESEARCH METHODOLOGY ......................................................... 21
3.1 Research Design...................................................................................................................... 21
3.1.1 BOMA Project ..................................................................................................................... 21
3.1.1.1 Targeting ........................................................................................................................... 22

vii
3.1.1.2 Standard of Living Index .................................................................................................. 22
3.1.1.3 Business Monitoring form (Business Plan, Progress Report, Exit Report) ...................... 23
3.1.1.4 Mentoring and Training .................................................................................................... 23
3.1.1.5 Savings Group Constitution and Exit Report.................................................................... 23
3.1.1.6 Database ............................................................................................................................ 24
3.2 Study Area .............................................................................................................................. 24
3.3 Study and Target Population ................................................................................................... 26
3.3.1 Sample Size .......................................................................................................................... 26
3.4 Data Collection Procedures..................................................................................................... 27
3.4.1Interview Guides ................................................................................................................... 27
3.4.2 Interview Guides .................................................................................................................. 28
3.4.3 Questionnaire Analysis ........................................................................................................ 28
3.4.4 Focus Group Discussion ...................................................................................................... 29
3.4.5 Document Analysis .............................................................................................................. 29
3.5 Data Analysis Procedures ....................................................................................................... 29
3.5.1 Operational Definition of Variables ..................................................................................... 31
3.6 Reliability and Validity ........................................................................................................... 32
3.7 Ethical Consideration .............................................................................................................. 33
CHAPTER FOUR: RESULTS AND DISCUSSION ............................................................... 34
4.1 Response Rate ......................................................................................................................... 34
4.2 Demographic Data of Respondents ........................................................................................ 34
4.2.1 Distribution of Respondents by Age (Beneficiaries and Non- Beneficiaries) ..................... 35
4.2.2 Level of Education of the Respondents ............................................................................... 35
4.2.3 Work duration of the respondents ........................................................................................ 38
4.2.4 Marital Status ....................................................................................................................... 39
4.2.5 Sources of Income................................................................................................................ 40
4.2.6 Business Type ...................................................................................................................... 41
4.2.7 Business Value vs Graduation Period .................................................................................. 45
4.2.8 Failed Business .................................................................................................................... 47
4.2.9 Income vs Graduation Period............................................................................................... 48
4.2.10 Food security vs Graduation Period ................................................................................... 50

viii
4.2.11 Trainings ............................................................................................................................ 52
4.2.12 Savings ............................................................................................................................... 54
4.2.13 Borrowing .......................................................................................................................... 56
4.2.14 Loan Repayment ................................................................................................................ 57
4.2.15 Asset ................................................................................................................................... 57
4.3 Determinants of Effectiveness of a Monitoring and Evaluation System for Projects ............ 61
4.3.1 Performance of M&E ........................................................................................................... 61
4.4 Influence of Monitoring and Evaluation Systems on The Performance of BOMA Supported
Micro Businesses, Saving and Lending Schemes. ............................................................... 63
4.5 Influence of Data Quality on Performance of BOMA Supported Micro Businesses, Saving
and Lending Schemes .......................................................................................................... 68
4.6 Influence of Monitoring and Evaluation Systems on Performance of Human Capacity ........ 73
4.7 Discussion of Findings ............................................................................................................ 76
CHAPTER FIVE: SUMMARY, CONCLUSIONS AND RECOMMENDATIONS ............ 79
5.1 Introduction ............................................................................................................................. 79
5.2 Summary of Findings .............................................................................................................. 79
5.2.1Influence of M&E structure on BOMA supported micro-business, savings, and lending
scheme performance. ........................................................................................................... 79
5.2.2 Influence of Data Quality on The Performance on BOMA Supported Micro-Business,
Savings, and Lending Scheme Performance. ....................................................................... 80
5.2.3 Influence of Monitoring and Evaluation Systems on Human Capacity Performance ......... 80
5.3 Conclusion .............................................................................................................................. 81
5.3.1 Influence of M&E on BOMA Supported Micro-business, Savings and Lending Scheme
Performance ......................................................................................................................... 81
5.3.2 Influence of Data Quality on The Performance on BOMA Supported Micro-Business,
Savings, and Lending Scheme Performance ........................................................................ 81
5.3.3 Influence of Monitoring and Evaluation Systems on Human Capacity Performance ......... 82
5.4 Recommendations ................................................................................................................... 82
5.4.1 Influence of M&E on the Performance of Monitoring and Evaluation Systems of Boma .. 82
5.4.2 Influence of Data Quality on the Performance on BOMA Supported Micro-Business,
Savings and Lending Scheme Performance ......................................................................... 82
ix
5.4.3 Influence of Monitoring and Evaluation Systems on Human Capacity Performance ......... 83
5.5 Suggestions for Further Research ........................................................................................... 83
REFERENCES ............................................................................................................................ 84
APPENDICES ............................................................................................................................. 93

x
ABBREVIATIONS AND ACRONYMS
ACRONYM Description
ASALS Arid and Semi-Arid Lands of Africa
BOMA It‟s a Swahili Word Meaning Enclosure
BRAC Bangladesh Rural Advancement Committee
CFPR/TUP Challenging the Frontiers of Poverty Reduction/ Targeting the Ultra-Poor
HSNP Hunger Safety Net Program
NGO Non-Governmental Organization
PAAP Poverty Alleviation Action Programme
PEC Poverty Eradication Commission
PRA Participatory Rural Appraisal
RCT Randomized Control Trial
REAP Rural Access Entrepreneurship Program
SL Sustainable Livelihoods
UN United Nation.
UNICEP United Nations Children Education Fund
WFP World Food Program
USAID The United States Agency for International Development
M&E Monitoring and Evaluation
PEPFAR President‟s Emergency Plan for Aid Relief
FGD Group Discussion
ES Economic Strengthening

xi
DEFINITION OF ERMS
1. Performance of monitoring and evaluation systems: Performance of monitoring and
evaluation systems is the ability of measured project activities to provide users of the system
access to quality and accurate information that can be used for organizational learning and
decision making.
1 Monitoring: Refers to the continuous tracking of project by way of collecting and analyzing
data as the project progresses. It is the systematic process of collecting and analyzing
information to track the efficiency of an organization in achieving its goals.
2 Evaluation: Refers to the process of determining the worth or significance of an activity,
policy or program. It is the systematic and objective assessment of the ongoing or completed
projects in terms of design, implementation and results in order to judge issues such as
programme relevance, effectiveness, impact and sustainability.
3 Monitoring and evaluation: Monitoring and evaluation is the process of systematically
collecting and analyzing information of ongoing project and comparison of the project
outcome/impact against the project intentions.
4 Monitoring and evaluation systems: Is a set of components which are related to each other
within a structure and serve a common purpose of tracking the implementation and results of
a project.
5 Stakeholders involvement: Refers to the inclusiveness of the project primary stakeholders,
secondary and tertiary stakeholders in the project monitoring and evaluation process.
6 Non-governmental organization is a private voluntary association of individuals or other
entities, not operated for profit or for other commercial purposes.

xii
7 Human capacity: this is defined as the capabilities of employees in an organization to
perform their monitoring and evaluation duties efficiently, effectively and sustainably to
support the M&E system. For the system to perform employees should have the skills and
experience.
8 Microbusiness: These are small businesses started by individuals or groups, through grants
or financed by their own initiatives.
9 Savings and lending’s: Are groups of people who come together in an organized manner to
form group to pool money together through buying and selling of shares to enable them save
and eventually borrow from themselves, this is common in places where the services of
banks are not available or places of poverty-stricken communities.
10 Graduation period (Poverty): Is the period that intervened persons are deemed to have
moved out of poverty based on timing, indicators and threshold that are in place.
11 Poverty Graduation Programmes: Helps people attain the confidence and the capacity to
independently generate income, buoyed by increased social and health awareness. It targets
individuals living in extreme poverty and provides them with basic resources, financial
education, technical training, life skill coaching, and social support so that they can
“graduate” from the program with food security and sustainable sources of income.

xiii
LIST OF TABLES
Table 1.1 Operational Definition of Variables ............................................................................. 31
Table 3.1 Sample size ................................................................................................................... 27
Table 4.1. ...................................................................................................................................... 35
Table 4.2: Distribution of Respondents by Level of Education (Beneficiaries and Non
Beneficiaries) ................................................................................................................................ 36
Table 4.3: Distribution of Respondents by Age (officers) ............................................................ 36
Table 4.4:Gender of the Respondents (officers) ........................................................................... 37
Table 4.5 : Level of Education of The Respondents (officers) ..................................................... 38
Table 4.6: Work Duration of the Respondents (officers) ............................................................. 38
Table 4.7: Household Members .................................................................................................... 39
Table 4.8: Sources of Income ....................................................................................................... 40
Table 4.9 : Business Type ............................................................................................................. 41
Table 4.10: How Current Business Started. .................................................................................. 45
Table 4.11: Business Value vs Graduation Period ........................................................................ 45
Table 4.12 :Business Operation .................................................................................................... 48
Table 4.13: Income ....................................................................................................................... 48
Table 4.14: Food Security vs Graduation Period .......................................................................... 50
Table 4.15 : Reason for Missing Food vs Graduation Period ....................................................... 52
Table 4.16: Mentorship and Training ........................................................................................... 52
Table 4.17: Mentorship and Training ........................................................................................... 53
Table 4.18: Frequency of Mentorship and training ...................................................................... 53
Table 4.19: Savings ....................................................................................................................... 54
Table 4.20: Savings Place ............................................................................................................. 54
Table 4.21: savings Frequency ..................................................................................................... 55
Table 4.22: Money to Save ........................................................................................................... 55
Table 4.23: Borrowing and Lending Frequency ........................................................................... 56
Table 4.24: Borrowing Tendency ................................................................................................. 56
Table 4.25 : Loan Repayment Ability ........................................................................................... 57
Table 4.26: Non Productive Asset Ownership .............................................................................. 58
Table 4.27: Livestock Ownership ................................................................................................. 60
Table 4.28 : Performance Rating .................................................................................................. 61
Table 4.29: Structure of monitoring and evaluation on performance of BOMA supported micro
business. ........................................................................................................................................ 64
Table 4.31: Data quality on performance of BOMA supported micro business and saving and
lending schemes. ........................................................................................................................... 68
Table 4.33: BOMA Monitoring and Evaluation Need Influence on Human Capacity. ............... 73
Table 4.35:ReliabilityStatistics ..................................................................................................... 76

xiv
LIST OF FIGURES
Graph 4.1 Sources of Income ....................................................................................................... 41
Graph 4.2: Type of Income ........................................................................................................... 43
Graph 4.3: Sources of Income ...................................................................................................... 47
Graph 4.9: Food Security .............................................................................................................. 51
1
CHAPTER ONE
INTRODUCTION
1.1Background of the Study
Many organisations, see project monitoring and evaluation activity as a donor requirement rather
than a management tool (Babbie & Mouton, 2006). For this reason, organisations especially
Non- Govermental Organisations (NGOs), implement project M&E just to cope with demands
and pressures from funding agencies rather than as a measure to contribute to project
performance (Kusek & Rist, 2004). Despite many studies having been done, only a few
organisations have faith in M&E partly because its influence on project performance is not well
understood (Khan, 2001; Ogula, 2002; Kusek & Rist, 2004; Nyonje, Ndunge, & Mulwa, 2012).
On the other hand, for a successful adoption of M&E system, skilled people are required who
can fulfill the M&E functions and tasks. Main tasks include establishing and using a
computerized system, designing the general outline of the M&E system, facilitating learning,
cope with new changes and managing communication of M&E findings. Insufficient knowledge
and skills are the most common blame on why a project system is not delivering results. In
practice knowledge and skills is acquired while undertaking the job through concrete experience,
(UNDP, 1998). To meet skills and knowledge needs will involve training the staff either
internally or externally or going for already trained people. Time to time, every M&E officer
needs to upgrade his skills through trainings and workshops. The field officers will also require
continuous skills building since information requirements in a project changes over time and new
methods will be needed for data collection and analysis (UNDP, 1998). According to Hughues
and Gibbs et al., (2002), for M&E to be adopted organizations need to have staffs who have
unique and definite skills expertise. NGOs lack the ability to get them and this indicates that the

2
areas which require these skills are not undertaken, making the adoption of an M&E system
unsuccessfully implemented. Gilliam et al., (2003) also observe that, this implies deficiency of
quality data therefore decision making as regards the project is solely centered on perception not
tangible data.
A study of monitoring, evaluation and learning system on comic relief by Sam Mcpherson
indicated that not all Non-Governmental Organisation (NGO) explicitly link their Monitoring,
Evaluation and Learning (MEL) systems and their requirement in the aid chain. If they were to
do this, it would support them to think more systematically about the differing roles of
commissioning, intermediate and implementing NGOs with regards to MEL, and how MEL can
be designed to help them evaluate how well they are playing their specific role.
In many cases, because of limited budget and resources, organizations are dependent on others to
provide data and rely on goodwill rather than explicit authority to encourage compliance. The
lack of sufficient numbers of skilled M&E personnel to gather required data and poor
management information systems make storing and sharing data difficult. A study conducted in
Nairobi Kenya where data from 30 non-government organizations was collected and analyzed,
established that the more the number of M&E staff the better the M&E performance. The study
found out that with limited staff, M&E systems in NGOs have difficulty receiving quality and
timely data and information from other parts and levels of organizations. The study further found
out that good governance structure, more funding for M&E and proper indicator definition
impacted positively on the performance of M&E system, (Clear, 2013).
According to the Kenya Social Protection Sector Review (2012), monitoring and evaluation of
social programmes in Kenya is still weak, and where it is done the information is not made

3
public. In addition, most NGOs do not have the capacity to hire M&E persons and ICT staff
who, have skills, understand M&E systems and are able to develop appropriate tools. Hence,
they end up with week M&E systems that don‟t meet either their needs (Chesos, 2010).
According to Koffi-tessio (2002),M&E systems are not meeting their obligatory requirements as
decision making tool; Instead their activities are controlled by a bureaucratic management.
According to Shapiro (2011), M&E is also viewed as a donor and not a management
requirement.
Odhiambo (2000), researched on challenges facing monitoring and evaluation practices in
Kenya. He noted that evaluation when done was yet to reach an acceptable level, when
undertaken, and rather dealt more with inputs and outputs than with impacts. He also noted that
there is lack of competence when it comes to qualified practitioners as there are few
professionally trained evaluators. A significant number of NGOs lack sufficient funding for their
activities; monitoring and evaluation are taken as an expenditure that they cannot have the funds
for and so employing persons with lower qualifications (certificates and diplomas) to pay low
wages than employing the degree and master holders who will require high wages (Gilliam et al,
2003).
The above confirms that the M&E systems are not performing satisfactorily in developing
countries. They are facing challenges that are contributing to their insufficiency and which calls
for intervention. Research also shows that the foundation for evaluation is being built in many
developing countries (Kusek and Rist, 2004). Consequently, there has been a growing global
movement to demonstrate accountability and tangible results, and also due to the international
donors focus on development impact, many developing countries will be expected to adopt
results-based M&E systems,in future.

4
1.2 Problem Statement
In the developing countries, Kenya included, governments are faced with several challenges in
addition to inability to resourcefully respond to changing needs of communities. The current
slower economic growth in developing countries, have been attributed to the poor utilization of
available resources that has continually made poverty index to go up, instead of reducing. The
Impacts of poverty graduation programmes initiated by the governments and Non-governmental
organizations are not adequately established, resulting to citizen not having a better-quality life
which is the core objective of the poverty graduation programmes. There has been an increase
use of data, as a result of the existence of a rich and relevant data following the recently
developed methodological tools for analysis. However, high-quality evaluations, remains
relatively rare in the field of Micro-business and entrepreneurship policy. The lack of monitoring
and evaluation mechanisms, skills, capabilities and opportunities to train staff in M&E is clearly
a major systemic gap across the region. While there is no need to possess extraordinarily
complex monitoring and evaluation systems, there is certainly a need for them to better
understand and realize the importance of the M&E systems in order to improve their programs.
Thus, there is a need to ensure that account is taken of the interactions between the outcomes of
different Micro-business and entrepreneurship policies and programmes for informed judgments
to be made about potential adjustments for graduation programmes to be able to clearly
demonstrate medium- and longer-term economic impacts.
It is upon this, that this study investigated the influence of M&E in the BOMA poverty
graduation programme in Marsabit County. This study investigated to what extent the data on
saving by residents was used to inculcate a saving culture by beneficiaries of the project. This
study evaluated the role played by M&E systems and how M&E assisted BOMA in its

5
operations. Thirdly, this study investigated how the use of monitoring and evaluation influenced
the performance of human capacity. This was in relation to project performance and trainings.
On Project performance the study looked at the timeliness of project delivery, the number of
activities implemented and availability of resources.
1.3 The Main Objective
The main objective of the study was to establish the influence of monitoring and evaluation on
project performance of BOMA in Marsabit County.
1.3.1 Specific Objectives of the Study
The Specific objectives were to:
i. Establish influence of monitoring and evaluation on the performance of BOMA micro
businesses in Ngurunit, Namarei And Illaut Locations, Marsabit County
ii. Establish influence of monitoring and evaluation on human capacity building in BOMA
Project.
iii. Establish influence of monitoring and evaluation dataon the performance of saving and
lending scheme of BOMA micr---------------obusinessesin Ngurunit, Namarei And Illaut
Locations, Marsabit County
1.4 Research Questions
i. How has the use of monitoring and evaluation influenced the performance of
microbusinesses, saving and lending schemes?
ii. How has the use of monitoring and evaluation influenced the performance of human
capacity?
iii. How has the use of data influenced the performance of microbusinesses, saving and
lending schemes?

6
1.5 Scope and Limitations of the Study
The proposed research covered the performance of monitoring and evaluation systems in non-
government organizations in Kenya, with special emphasis of BOMA project in Marsabit county.
The study was limited to establish how BOMA monitoring and evaluation influenced the
performance of microbusinesses, saving and lending scheme and human capacity building in
Marsabit county households. This study did not focus on the BOMA‟s targeting process, cash
transfer, social interaction and Health support components.
The research was further limited geographically to BOMA Project in Korr/Ngurunit ward,
Marsabit South Constituency in Marsabit County. This might have impeded the number and
variability of the respondents that the study could have targeted.
Some respondents were unavailable, and others didn‟t have enough time to give required
information due to their busy schedule which hindered effective data collection and findings.
However, the researcher addressed this problem by making a follow-up to allow them respond at
their most convenient time.
1.6 Justification of the Study
Outcomes of this study will particularly help the NGOs staff, donor agencies and project
managers to better understand the influence of M&E systems and the need for adopting them in
order to meet expectations of the stakeholders and also to provide important information for
future interventions. NGOs can benefit from basic concepts of project monitoring and evaluation
which to date no empirical attempt has been made to demonstrate how it would contribute to
better management of NGOs in Kenya. First, NGOs have embraced a strategic re-orientation
towards project management based on the program concept in an attempt to benchmark with
multilateral development agencies. Secondly, within the strategic thinking, there is need to

7
provide feedback on utilization of resources and impacts being achieved. Thirdly, the kind of
impacts achieved will have a direct implication on the quality of infrastructure and ultimately
that of NGOs deliverables in Kenya. Thus, it will be useful for researchers and policy makers to
understand the aspect project monitoring and evaluation and its constituent elements likely to
influence NGO's projects implementation for strengthening the existing systems. The study
findings are expected to be beneficial to the Kenyan NGOs.

8
CHAPTER TWO
LITERATURE REVIEW
2.1 Introduction
Managing Poverty graduation programmes projects require an operational M&E system. The
M&E system is the set of planning, information gathering and synthesis, refection, and reporting
processes, along with the necessary supporting conditions and capacities required for the outputs
of M&E to make valuable contributions to decision making and learning. This chapter presents
forth a write up based on the influence of monitoring and evaluation on performance of
businesses, influence of monitoring and evaluation on human capacity and influence of
monitoring and evaluation on performance of savings and lending schemes.
2.1.1 Influence of Monitoring and Evaluation of Performance of Businesses
There have been a number of recent advances in data collection and policy evaluation
techniques for Micro-business and entrepreneurship policy development, many of which are
likely to be particularly valuable in the evaluation of Micro-business and entrepreneurship
programmes and policies (OECD, 2017).
The current slower economic growth in developing countries, have been attributed to the poor
application of entrepreneurial activities. The government in Kenya and scholars have alluded to
various constraints that limit entrepreneurs from sustaining their businesses as emanating from
global challenges, and some are a result of governments having to internationalize their
economic policies to suit their trading partners. Garcia and Capitan (2016) argue that
entrepreneurs continue to struggle in developing their business, because the business
environments in various spaces are not suitable for entrepreneurs. SMMEs performance can be
improved through application of systematic processes that tracks their mistakes and barriers, this

9
has been made possible by technology and the existences of rich and relevant data within
different sectors which remain unexploited for Micro-business and entrepreneurship policy
evaluation. Recently-developed analytical tool could become an important resource in the area
of Micro-business and entrepreneurship policies analysis and development. A further challenge
is to ensure that account is taken of the interactions between the outcomes of different Micro-
business and entrepreneurship policies and programmes, for informed judgments be made about
potential adjustments to the policy mix; i.e. identifying programmes that can be expanded and
programmes that merit abrogation. Moodley (2009) argues that business assessment tools should
be able to diagnose what influences SMMEs in the environment where they are based and how
they can be able to provide them with a mechanism for their growth in their various areas of the
operations with the intention to improve their performance. Abreu-Ledon et al. (2018) is of the
view that “it is problematic to measure performance that is only expressed in financial terms”.
Governments and society expect SMMEs to create jobs in their communities and yet ignore
their well-being.
The business analysis conducted on behalf of SMMEs, in accounting and auditing, is not enough
to assess their performance and ascertain their business focus in this decade of the Fourth
Industrial Revolution. There is a need to monitor and evaluate small business of any type to
track the errors and limitations associated with the implementation of their business strategies.
Research indicated that “Some entrepreneurs have been exposed to constraints that result from
their inability to sustain financial viability”, (Matsiliza, 2018). Vulnerable groups (e.g children,
disables and women) have not secured good positions or a healthy financial viability in SMMEs;
hence they fall short in developing their local communities.

10
Lambrecht and Pirnay (2005) agree that the M&E focus of small business, should be directed
towards on improving their compliance to government policies and regulations, administrative
procedures, and taxation. However, SMMEs M&E can offer more than merely that, the process
can assist SMMEs in avoiding inaccurate judging of capacities on their success and
performance. Monitoring will also prepare them in generating enough information and resources
needed for auditing purposes and manage results by comparing them with their plans and
objectives.
The overall Result Based M&E can also improve the overall performance and quality of
SMMEs and set new standards instead of using laid back ideas that can‟t sustain the business.
Ideas, programmes, and projects evaluated can also set new standards and strategies for future
programmes to be better planned. The SMMEs knowledge generated from monitoring and
evaluation can assist them in information sharing and networking.
There has been an increase in the use of the most reliable and rigorous evaluation techniques,
including for Micro-business and entrepreneurship policy. New econometric techniques such as
propensity score matching, can be used correct selection biases. The use of Randomised Control
Trials (RCT) has significantly increased recently, whereby the treatment group and their
performance is compared over time-controlled group who were randomly excluded in order to
establish a counterfactual. However, high-quality evaluations are few in the field of Micro-
business and entrepreneurship policy. In US it is reported that, out of 53 programmes, 39 of the
had either never conducted a performance evaluation or had conducted only one in the past
decade, (GAO, 2012). In addition, the UK National Audit Office concluded that none of the UK
government evaluations in the field of business support provided convincing evidence of policy
impacts (NAO, 2020).

11
Key indicators need to be developed to monitor outcomes and assess the degree to which
intended or promised outcomes are being achieved (Kusek & Rist, 2004). Data is needed
frequently to build evidence and track results. According to Guijt (1999) “information needs to
be collected at optimal moments and with a certain frequency”.
A longitudinal study conducted in 2018, on BOMA beneficiaries enrolled between 2011 and
2013, revealed positive results; impact still continues, and more importantly increasing (BOMA
project, 2018). Longevity studies conducted in 2012 and 2018 by BOMA project, also show
women‟s increased income and gains in savings and social equity (BOMA project, 2018). A
midline conducted by BOMA project in 2017, in comparison to baseline analysis show that after
only 12 months of being into the program. Household income increased by 77%, savings
increased by 1,055%, business values increased, on average, by 47.44% (BOMA project, 2018).
This proves that with good systems programmes can achieve their intended goals. This study
focused solely on monitoring and evaluation systems put in place by BOMA with a view to
establishing to what extent the data collected from the M and E exercise were used to improve
project outcomes.
2.1.2 Influence of Monitoring and Evaluation on Human Capacity
The technical capacity of the organization in conducting evaluations, the value and participation
of its human resources in the policymaking procedure, their incentive to impact resolutions, that
can be enormous determinants of how the evaluation‟s lessons are made, conversed and
perceived (Vanessa and Gala, 2011). People in the project should be have clear job allocation
and designation be fitting their skill, if they are insufficient then training for the necessary skills
should be set. For projects with staff out in the field to carry out project monitoring activities on
their own need to have constant and intensive onsite support, (Ramesh, 2002). Capacity building

12
of employees is the actual organizational focus on the employee to turn them to be better, either
as a individual or as a contributor to the firm. Organization are responsible and expected to
enhance output of their employee, (Pearce and Robinson, 2004).
According to Foresti, (2007), this organizations should not only focus on trainings, but learning
approaches can be used, from secondments to research institutes and opportunities to work on
impact evaluations in or outside the organization to improve their performance, to time spent by
project staff in evaluation section and similarly, time taken by evaluators in the ground.
Evaluation must also be autonomous and relevant. For objectivity, those responsible for the
design and implementation of the development intervention should be independent,(OECD,
2002 and Gaarder and Briceno, (2010)). The study shows that it is vital to determine what
methods are appropriate to the users‟ needs the given context and subjects of data, baseline, and
indicators, (Hulme, 2000).
In order to carryout a quality monitoring evaluation efficiently, there are some critical
factors that essential be taken into the version, such as the use of pertinent skills, sound
methods, adequate resources and accountability,(Jones et al, 2009). The resources include
expertise in M&E and financial resources. Rogers (2008) suggests the use of multi-
stakeholders‟ dialogs and within a supportive institutional framework while being cognizant of
political influence in data collection, hypothesis testing and, in the intervention, in order to let
bigger involvement and recognize the differences that may arise.
The M&E system need skilled people who effectively execute the M&E tasks for which they are
responsible. Therefore, understanding the skills needed and the capacity of people involved in
the organization (undertaking human capacity assessments) and addressing capacity gaps

13
(through structured capacity development programs) should be at the center of the M&E system
Gorgens & Kusek, (2010). In its framework for a functional M&E system, UNAIDS (2008)
notes that, not only is it necessary to have dedicated and adequate number of M&E staff, it is
essential for all staff to have the adequate skills for the work. Moreover, M & E trainings should
focus on a wide range of activities, such as formal training, in-service training, mentorship,
coaching and internships. Lastly, M&E capacity building need not only to focus on the technical
aspects of M&E, but also should address skills in leadership, financial management, facilitation,
supervision, advocacy and communication.
An adequate supply of skilled M&E professionals is critical for the sustainability of M&E
systems. Furthermore, there is need for projects to recognize that “growing” evaluators need far
more technically oriented M&E training and development than can usually be obtained with one
or two workshops. Acevedo et al.(2010) argues that a combination of both formal training and
on-the-job experience are important in developing evaluators with various options for training
and development opportunities which include: the relevant institutions (public sector, the private
sector, universities, professional associations), job assignment, and mentoring programs.
Monitoring and evaluation carried out by untrained and inexperienced people is a great waste of
organizations resources, it is time consuming, costly and can generate impractical and irrelevant
results which when used can negatively affect the project,(Nabris, 2002). According to UNDP
(2011), most organization in pacific are faced with the challenge of inadequate monitoring and
evaluation systems, and capabilities and opportunities to train staff in technical skills in this
area. During the UNDP assessment with the CSOs in pacific it was noted that lack of monitoring
and evaluation mechanisms and skills was the major systemic gap across the region and this gap
can be addressed not necessarily through training on extraordinarily complex monitoring and

14
evaluation systems, but just a rudimentary knowledge of, and ability to utilize reporting,
monitoring and evaluating systems, ( UNDP, 2011)
2.1.3 Influence of Monitoring and Evaluation on PERFORMANCE Saving and Lending
Schemes
Effective monitoring and evaluation (M&E) systems for savings group (SG) programs must be
able to produce results that can be used to make informed decision by donors, program
implementers, the groups and even individual group members themselves. Additionally, the
management information system (MIS) must be affordable for the SG and its members. Also,
the data collection using MIS should not be burdensome to group members. There is a need to
design project-specific monitoring systems to collect specialized data of interest to stakeholders.
However, there are limited resources and, more importantly, the need to focus the M&E design,
concentration should be placed on a selection of key indicators based on the program‟s goals
and logic model, (Economic Strengthening for Vulnerable Populations, 2014)
RCT Studies in Mali (BARA and IPA, 2013), Burundi (Annan et al., 2013), Malawi (Ksoll et
al., 2013) and Malawi, Uganda and Ghana (IPA, 2012), have reported a significantly increase in
the levels of savings and credit (both number of loans and level of credit) in the treatment areas
compared to the control areas. Also, a small qualitative study which involved 40 respondents, in
Zambia reported an increase in savings because of SG membership (Taneja, undated). These
findings are considered as a further stage in the outcome chain. Indeed, once members have
decided to stay in a group, there will be specific mechanisms which will lead them to use the
services of the SG (i.e. savings and loans in particular) in the way they do. Therefore, adopting
an M&E approach will focus on understanding and revealing what these mechanisms for saving
and taking loans from SGs might be. Across countries, studies have also reported that, at

15
different degrees, loans and share out monies are used for business investments, agricultural
inputs, education expenses, food, household consumption, and building or repairing a house
(Anyango et al., 2007; BARA and IPA, 2013; Boyle, 2009; Cameron and Ananga, 2015; Taneja,
undated; Ksoll et al., 2013; IPA, 2012).
Research conducted in Western Kenya shows that members majorly save for school fees, food
and small businesses. Similarly, members reported having used the last SG distribution for the
same three reasons (DAI, 2010). Ethnographic studies in coastal Kenya also reported that SG
loans were mostly used to pay school fees (Elliott, 2014). Again, these findings are considered
as a further step in the outcome chain. From a M&E perspective, all the different outcome stages
imply a set of mechanisms which are meant to trigger the respective set of outcomes. Beyond
outcomes, we have identified a set of impacts which are the long-term changes expected by the
TOC. SG members may choose to stay in a group, use the services provided by the group and
clearly have a reasoning around why they use the services in specific ways. After this self-
reasoning on choices, there is a level of impact which may happen irrespective of the decisions
of SG members and result from reasoning of other people and other factors at play in a
particular context, rather than the reasoning of the SG members. For instance, women may
experience a higher level of empowerment or respect from their husband as a result of the ways
in which they have used the services even if that impact was not the main aim that pushed them
in using such services. Similarly, members may become less vulnerable to shocks or have better
livelihoods, but again this would not only be a result of their previous decisions. Indeed, it also
depends on many other factors, such as market opportunities, social networks, availability of
inputs, good weather and so on. This level of impact is often what RCT studies have focused on.
In the current literature, while there seems to be a certain degree of agreement on the fact that
16
SG services are appreciated and used for different purposes by their members, therefore
enriching financial inclusion, the medium- and longer-term impact of SGs economic impact is
for instance not always found. An RCT study in Burundi finds an increase in monthly
expenditure, asset ownership and economic mobility (Annan et al., 2013), and the mix-method
evaluation conducted in Zanzibar finds improved income from businesses and ability to buy
more inputs (Anyango et al., 2007). On the other hand, an RCT study conducted in Mali finds
no substantial changes (BARA and IPA, 2013) and an RCT study conducted in Ghana, Uganda
and Malawi finds no changes in asset ownership and PTT scores (IPA, 2012). Rather than being
conclusive, such findings suggest that participation in SGs is supporting members, and in
particular women, to invest in small businesses which may lead or not to an immediate increase
in income and expenditures. However, as noted by some qualitative studies, the small
contributions from SGs may help women stabilise their activities (BARA and IPA, 2013) and
contribute to the household (Bermudez and Matuszeski, 2010). As previously stated, these
findings become the final impact stage in a M&E approach. The reasonings which lead to
certain outcomes may not always be intended or predicted by the project. For instance, it was
found that participation may give women more time to cope with emergencies. In particular, it
has been noted that by accessing quick credit from their SGs women gain more time to manage
decisions of selling animals or to look for work to pay for school fees – although such coping
strategies remain the same. This was noted both in Kenya (Elliott, 2014) and Ghana (Cameron
and Ananga, 2015) where the qualitative study Join SG (01) Stay in SG (02) Save take and
repay loans (03) Use loans and share out (04) Better livelihoods Reduced livelihoods
vulnerability increased empowerment (impact).
17
In summary, this literature review has shown that while there is general agreement about the
valued aspects of SGs (i.e. financial and social benefits) and their widespread use by members
(i.e. mechanisms from a M&E perspective), the outcomes and impact of SGs, are less clear.
Investment in small businesses, an improvement in food security and a decrease in school
absenteeism seem to be the main changes produced by SG membership together with women‟s
improved social status and control over resources and household decision-making. However,
such literature does not explore the mechanisms behind the use of SG services in environments
where they are potentially present together with other informal services. Also, such literature
lacks a more nuanced picture of who benefit from SGs and in which ways. In this evaluation of
SGs, we are adopting an M&E approach to explore to its influence on saving groups
performance.
2.2 Conceptual Framework
According to Mugenda & Mugenda (2013), conceptual framework involves forming ideas about
the relationship between variables in the study and showing the relationship graphically. In this
research study, the independent variables are tools and methods, management role, level of
training and stakeholder‟s involvement. These variables in turn affects the state of monitoring
and evaluation systems in BOMA project and therefore, the independent variable will be
performance of M&E systems and is the variable that cannot be directly controlled.

18
2.3 Conceptual Framework
Independent variables Intervening variables Dependent variable
Figure 1: conceptual framework for influence of management on M&E on Performances of
Micro business, savings and lending scheme
2.4 Knowledge Gap
Literature reviewed revealed that there has been increased use of Randomised Control Trials
(RCT), has significantly increased recently, whereby the treatment group and their performance
is compared over time-controlled group who were randomly excluded in order to establish a
counterfactual However, high-quality evaluations are few in the field of Micro-business and
entrepreneurship policy. SMMEs performance can be improved through application of
systematic processes that tracks their mistakes and barriers, this has been made possible by
technology and the existences of rich and relevant data within different sectors which remain
unexploited for Micro-business and entrepreneurship policy. Recently-developed analytical tool
could become an important resource in the area of Micro-business and entrepreneurship policies
Influence of M & E
Systems
-Timeliness of
project delivery
-Number of
activities
implemented
-Resources
availability
_General level of
satisfaction of
project performance
Resources
organization
Leadership,
stakeholder‟s
participation and
funds availability
Performance of Human
capacity
-Performance
-Training
Performance of savings and
lending schemes
-Savings
-Borrowing Loaning
-Loan repayment
Performance of Micro-
business
-Household assets
-Income
- Food security

19
analysis and development. A further challenge is to ensure that account is taken of the
interactions between the outcomes of different Micro-business and entrepreneurship policies and
programmes, for informed judgments be made about potential adjustments to the policy mix; i.e.
identifying programmes that can be expanded and programmes that merit abrogation
Monitoring and evaluation carried out by untrained and inexperienced people is bound to be time
consuming, costly and the results could generated prove impractical and irrelevant. Therefore,
this will definitely impact the success of projects.
Additionally, the lack of capabilities and opportunities to train staff in technical skills in this area
is clearly a factor to be considered. During the UNDP assessment with the CSOs in pacific it was
noted that lack of monitoring and evaluation mechanisms and skills was the major systemic gap
across the region and this gap can be addressed not necessarily through training on
extraordinarily complex monitoring and evaluation systems, but just a rudimentary knowledge
of, and ability to utilize reporting, monitoring and evaluating systems, (UNDP, 2011)
In the current literature, while there seems to be a certain degree of agreement on the fact that SG
services are appreciated and used for different purposes by their members, therefore enriching
financial inclusion, there seems to be less clarity with regard to the medium- and longer-term
impact of SGs economic, impact is for instance not always found. This study sought to fill this
research gap by investigating influence of monitoring and evaluation. The literature review
presents gaps and arguments that need to be authenticated through investigation (Kothari, 2000).
The literature review revealed that establishing of an M&E system involves a combination of
building blocks that do not operate in isolation but complement each other to generate a
functional monitoring and evaluation system. A number of studies indicated that Kenya, being at

20
its infancy stage, is facing a number of challenges in developing its M&E system. None of the
studies reviewed was done on the influence of monitoring and evaluation systems on
performance of micro business, savings and lending schemes. The study will therefore address
the knowledge gap.

21
CHAPTER THREE
RESEARCH METHODOLOGY
3.1 Research Design
The study adopted an experimental research design. According to Shadish, Cook, and Campbell
(2002) experiment is “a study in which an intervention is deliberately introduced to observe its
effects”. This study therefore tested whether an intervention has had a measurable effect or not
by comparing the situation of an intervention group with the situation of a comparison group.
This was done by comparing the situation of a BOMA beneficiaries that received the
development intervention with the situation of a non-beneficiaries that did not. The difference
can then be attributed to the intervention. A target population can be comprised of households, in
Ngurunit, Illaut and Naimarey locations.
3.1.1 BOMA Project
BOMA Project monitors progress on several Key Performance Indicators (KPIs). Program
monitoring is a continuous process carried out with a two-year frame of reference and is
universally administered among business groups. This section discusses the tools BOMA Project
uses to monitor program outputs and outcomes through KPIs. In addition to the data collection
tools discussed here, BOMA Project has developed administrative tools to ensure accountability.
These include receipts for each grant disbursement signed by mentors and a picture of all the
members from each group receiving money. Spot-check audits are done quarterly to 1) ensure all
of the paperwork is in place for grants and the database is up to date; 2) to ensure that BOMA
Project ‟s program is delivered properly in the field.

22
3.1.1.1 Targeting
BOMA Project uses the Progress Out of Poverty Index to assist in targeting potential clients and
tracking of client progress over time. Targeting provides a poverty likelihood estimate set against
various poverty lines. For an individual to be accepted into the BOMA Project program, her/his
household must have an extreme poverty likelihood score corresponding to a 50% or greater
chance of falling below the extreme poverty line ($1.25 PPP 2005). Given the limitations of the
PTT discussed previously, BOMA Project triangulates poverty targeting through two additional
processes: (1) country-specific inclusion and exclusion criteria and (2) participatory wealth
ranking. Each country office has developed a set of inclusion and exclusion criteria‟s regardless
of their PTT scores. For instance, regardless of a household‟s PTT score BOMA Project does
not work with anyone who currently has full-time wage employment. On the other end, since the
PTT weights household size heavily (the smaller the household the less likely it is to be in
poverty) an individual may be included if the bread winner in the household has recently passed
on. These stepsare designed to produce a set of locally relevant poverty indicators and to
specifically identify the poorest households in the community. The exercise also operates as an
introductory meeting in which BOMA Project seeks to generate buy-in among community
leaders.
3.1.1.2 Standard of Living Index
The Standard of Living Assessment (SOLA) is a limited multidimensional poverty assessment
tool developed by BOMA Project to provide a baseline understanding of client poverty status
and changes in non-expenditure indicators over time. BOMA Project collects data on numerous
measures of poverty such as education (e.g. children in school), house structure quality (e.g.
roofing with walls) and nutrition (food quality and severity of periods of hunger). The SOLI is

23
performed with at least one member from each business group. At the two-year mark, along with
the Exit Report, a follow-up SOLI is performed on a sample of originally surveyed clients.
3.1.1.3 Business Monitoring form (Business Plan, Progress Report, Exit Report)
BOMA Project Business Plans help determine the feasibility of the business idea and track
progress towards its implementation. Six months after the business starts, a Progress Report is
completed to monitor key operating goals. Satisfactory meeting of certain set thresholds makes
the business qualify to receive an additional small grant. If the business fails to complete its
goals, they are mentored for a period of time to help them correct the problem and then
rechecked once again. At the end of two years, in which the business has received ongoing
monitoring and mentoring, the Business Mentor completes an Exit Report for each business
group where they review businesses records, evaluate business stock and the available capital.
3.1.1.4 Mentoring and Training
As part of an ongoing process, each business group is mentored on a regular basis, thereby
giving personal attention and guidance in building a successful business. Business Mentors are
required to sign record books in each visit they make. Country office staff members perform
periodic spot checks and review stamped record books to certify that mentoring is taking place
with the appropriate frequency. To track training, the Business Mentors take attendance at each
training session and monitor their understanding of the training with questions and exercises at
the end of each class.
3.1.1.5 Savings Group Constitution and Exit Report
In addition to business-level reports, Business Mentors are also a signed to Business Savings
Groups. Savings groups are an exit strategy for the program, this will act as a local supply of
continuing capital for businesses created through the program. As such, BOMA Project is

24
primarily interested in their sustainability. Savings groups are initiated, but not run by Business
Mentors; rather, while BOMA Project provides resources, ultimately each group decides the
manner in which the group is governed. Monitoring of this component of the program is focused
first on ensuring that the basic structure and rules of each group is laid down in the constitution.
The mentor collect monitoring information monthly for the first 18 months a savings group is in
operation, by tracking total savings, number of members, group attendance and other basic
indicators of group viability. The Saving Group Exit Report is performed at the two-year mark
and records several indicators of group sustainability.
3.1.1.6 Database
BOMA Project has developed a customized and integrated online database enabling us to access
all Business Application, SOLI and Progress Report data as soon as a new business is formed
and funded.
3.2 Study Area
The study will be conducted in Ngurunit, Illaut and Namarei locationsin Marsabit
county.“Marsabit County boarders lake Turkana to the west, Ethiopia to the north, Samburu
county to the south and Wajir and Isiolo counties to the east”,(Marsabit county, 2018). It covers
an area of 66,923.1km2. Although ranked as the largest county in the country, it has an estimated
population of 459,785 from an estimated 61,850 households. The county consists of four sub-
counties: Laisamis, North Horr, Saku, and Moyale, (Munene, F, Mativo, A & Leokoe, T. 2018).
This study will be conducted in Laisamis sub-county situated in the southern side of Marsabit, in
Ngurunit and Illaut location which borders Samburu County to the south west.

25
Figure 3.1: Presents the map of the study area
Source; Google maps
Above is a Map of the study area. The area is situated at the southern side of Marsabit County, in
Laisamis sub-county, and borders Samburu County to the south west. The area lies on 570 m
above the sea level and sparsely populated. People main economic activity is pastoralism.
Settlement are influenced by rain and pasture. Mobile network coverage is sparse. The climate is
considered to be a local steppe climate. Ngurunit is located 129 km, Illaut is 139 km and
Namarei is 107 kms from Marsabit County. During the year there is little or no rainfall, with an
average temperature of 25 degrees throughout the year. The area has an inactive national reserve.
The area has great potential for livestock trade. Unfortunately, they face chronic food shortages
through the year, (Marsabit County, 2018)

26
The prevalence of Acute Malnutrition by MUAC for Laisamis Sub County was 7.1% which is at
emergency 7 according to WHO classification. According to NDMA Bulletin January 2018, the
Proportion of children „at risk‟ of malnutrition was 20.8 percent compared to the long-term
average of 22 percent and 21.7 percent same period last year. Illaut, Naimarey and Ngurunit
reported emergency levels which had surpassed the normal thresholds according to NDMA Long
term Average of 22 Percent, (Marsabit County, 2018)
3.3 Study and Target Population
A population is an identifiable total group or aggregation of elements (people) that are of interest
to a researcher and pertinent to the specified information problem. This includes defining the
population from which the sample is drawn. According to Salkind (2008), population is the
entire of some groups. This is also supported by Sekaran and Bougie (2010); population is
defined as entire group of people the researchers want to investigate.
The total number of funded beneficiaries was 40, 2 travelled out of their locations, 5 passed on, 8
Migrated to other counties (and could not be traced). The total number of traceable beneficiary
household on this area was 25; a sample size of 25 beneficiaries‟ households and 24 non-
beneficiaries‟ households (list received from BOMA had 30 participants who were deemed as
better off thus did not qualify for funding, 6 could not be traced ending up with a sample of 24) ,
was used.
3.3.1 Sample Size
A sample is a subset of population. In selecting a sample, one should select that which provide
the required information. Frankel and Wallen (1996) points out that sampling, is a process of
selecting individuals who will participate in a study. In this stratified sampling method was used
to select the respondents. Stratified sampling method is appropriate for the study as it allows the
27
researcher to representatively sample even the smallest and most inaccessible subgroup in the
population. This allows the researcher to sample the rare extreme of the given population. The
researcher also chose this method to observe existing relationship between two subgroups.
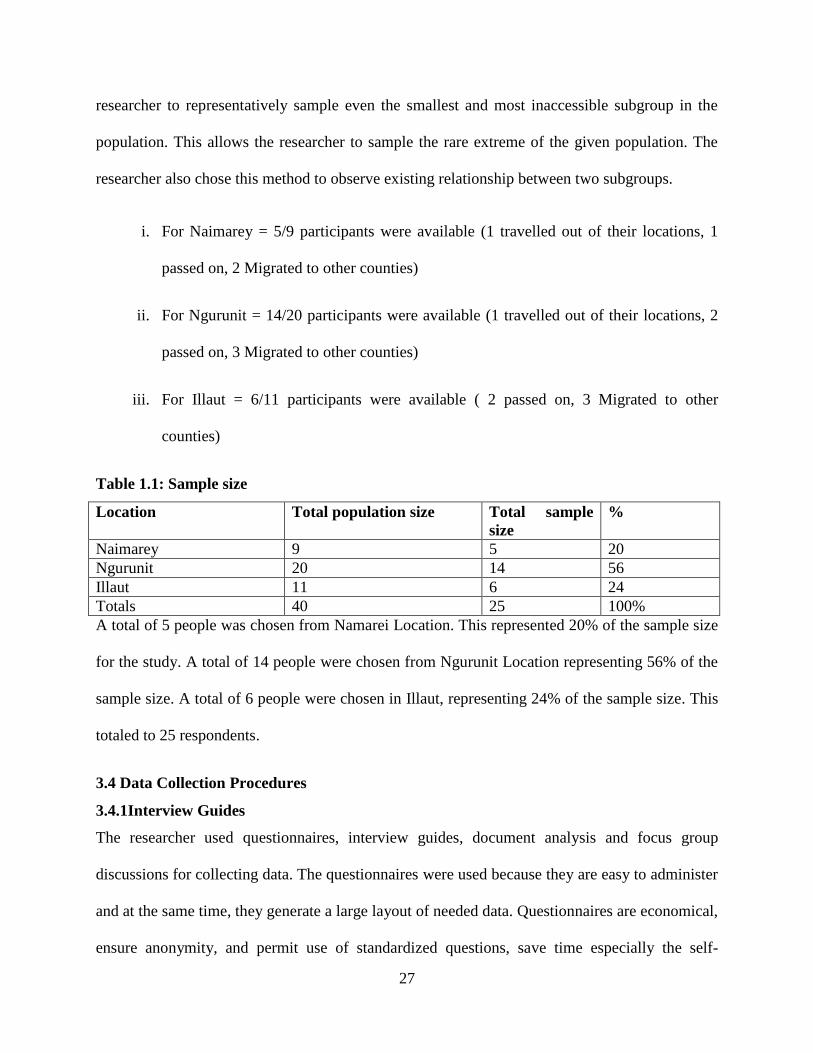
i. For Naimarey = 5/9 participants were available (1 travelled out of their locations, 1
passed on, 2 Migrated to other counties)
ii. For Ngurunit = 14/20 participants were available (1 travelled out of their locations, 2
passed on, 3 Migrated to other counties)
iii. For Illaut = 6/11 participants were available ( 2 passed on, 3 Migrated to other
counties)
Table 1.1: Sample size
Location Total population size Total sample
size
%
Naimarey 9 5 20
Ngurunit 20 14 56
Illaut 11 6 24
Totals 40 25 100%
A total of 5 people was chosen from Namarei Location. This represented 20% of the sample size
for the study. A total of 14 people were chosen from Ngurunit Location representing 56% of the
sample size. A total of 6 people were chosen in Illaut, representing 24% of the sample size. This
totaled to 25 respondents.
3.4 Data Collection Procedures
3.4.1Interview Guides
The researcher used questionnaires, interview guides, document analysis and focus group
discussions for collecting data. The questionnaires were used because they are easy to administer
and at the same time, they generate a large layout of needed data. Questionnaires are economical,
ensure anonymity, and permit use of standardized questions, save time especially the self-

28
administered as the respondents have an ample time to think and fill the questionnaires at ease,
hence minimizing errors.
3.4.2 Interview Guides
The beneficiaries and non-beneficiary‟s questionnaire focused on beneficiaries and non
beneficiaries. Part A of the questionnaire gathered general information about the respondents.
This included the demographic details, and contact information for possible follow up. Part B
collected about, the standard of living. Part C of the questionnaire gathered information on the
monitoring and evaluation aspects of the project. This being the main part of the questionnaire, it
explored the possible role project played in monitoring and evaluation as it relates to the various
activities - training and mentorship for micro-business, savings and lending schemes, Lending,
borrowing, and saving. Part D of the questionnaire, on the other hand gathered information on
the respondent‟s accumulation of assets both as non-productive and livestock.
3.4.3 Questionnaire Analysis
The mentors (officers) questionnaire, this questionnaire focused on officers, mentors and who
delivered trainings to the beneficiaries, and their supervisors who monitor data collection process
and do analysis of the collected data. The questionnaires were designed in sections. The
respondents were given instructions and enough time to fill the questionnaires and
confidentiality was assured. The respondents were shown how to fill the questionnaires for those
who were deemed necessary for the purposes of comprehension. Part. A: of the questionnaire
gathered information on demographics details and the period they have worked for the project.
Part. B: focused on Project Performance. This was measured in terms of timeliness, activities
implemented, cost of the project and General level of satisfaction of project performance. Part.
C: focused on the influence of monitoring and evaluation system on performances of the project,

29
by measuring the influence of monitoring and evaluation system on performances of Micro-
business, savings and lending schemes, Influence of data quality on Micro Business, savings and
lending schemes Performance and Influence of M&E on Human capacity Performance.
3.4.4 Focus Group Discussion
3 FGDS were conducted. One focused on the officers from various BOMA project operation
areas. The second focused on beneficiaries and the third was with the non-beneficiaries. The
team was composed of a facilitator, a note taker and participants. The FGD strongly focused on
the understanding the influence of M&E on the performance of project activities. The capacity of
the M&E team, management attitude and their roles in regard to using M&E finding in decisions
making, stakeholders‟ involvement and the use of data.
3.4.5 Document Analysis
Document analysis was done on participants micro- business, saving and lending groups record
books and the same confirmed from the electronic data that was available from the field officers.
The record books were accessed with the permission from the respondents and the electronic
data was requested through the management.
3.5 Data Analysis Procedures
This is the process of collecting, modeling and transforming data in order to highlight useful
information, suggesting conclusions and supporting decision making (Sharma, 2005). The
researcher collected the data, using questionnaires, interview guides, focus group discussion and
document analysis. The data that was collected was examined and checked for completeness and
clarity. Quantitative data was analyzed using descriptive statistics while qualitative data was
analyzed thematically. The data was then presented using frequency Tables, bar graphs and pie
charts. This helped to identify information relevant to the research questions and objectives. In

30
analyzing data qualitatively, the researcher aimed at cross checking the M&E activities
implemented and at what time, in the project and the resultant effect. It was also of particular
interest to compare the trends, patterns and relations to both projects‟ beneficiaries and non-
beneficiaries. Qualitative data was analyzed using thematically, which is a method concerned
with the explanation of the status of some phenomenon at a particular time or its development
over a period of time (Cherry, 2015). It is a method that permits researchers to study an observed
phenomenon unobtrusively- that is, without being directly involved with people or situations
(Msila & Setlhako, 2013). Documents (business and saving book record) from beneficiaries and
supervisors were subjected to careful criticism to ensure authenticity and validity to establish the
trustworthiness of all the data. They were then analyzed for their content regarding the three key
activities of monitoring and evaluation and their influence of project performance. Qualitative
data was managed in a manner which ensured that it was broken down into discernable units to
show patterns and trends (Bogdan & Biklen, 2007). The use of different sources of information
in this study to assess a particular area was important, increased the validity of the findings. All
of the data was treated with due circumspection, and the relevant qualifiers were applied in terms
of these data streams.
The use of three different sources of information to collect data about the projects and later
doing content analysis ensured triangulation of data to increase validity and reliability of data.
Triangulation is generally considered to be one of the best ways to enhance validity and
reliability in qualitative research. This research design therefore assisted in drawing inferences
about the influence of monitoring and evaluation system for projects at BOMA Kenya. The
research design was chosen due to its adequacy to fulfill the research objectives

31
3.5.1 Operational Definition of Variables
This section dealt with the operational definition of study variables, along with other components
of the conceptual framework. The dependent variables are the Influence of M&E system on
project performance. The independent variables were human capacity building, performance of
micro business and saving schemes.
Table 1.2 Operational Definition of Variables
Objective
Type of
variable
Indicators Level
of Scale
Data
Collection
Data
Analysis
To establish the
influence of monitoring
and evaluation systems
on organization
performance
dependent
variables
Influence of
M&E system
on project
performance
-Project activities were delivered
on time
-All activities promised were
implemented
-Resources availability (M&E
tools, for tracking)
_General level of satisfaction of
project performance
5 Point
Likert
Scale
Questionnaire
Interview
guide
FGD
Descriptive
To establish how
BOMA monitoring and
evaluation influenced
the performance of
micro businesses
Independent
variable
performance
of micro
business,
- Management attitude towards
Micro businesses
- Identification of indicators
-data collection
-Results /findings analysis
-use of information/feedback
-The roles of M&E
5 Point
Likert
Scale
Questionnaire
Interview
guide
FGD
Descriptive
To establish how
BOMA monitoring and
evaluation influenced
human capacity
building.
independent
variable
Human
capacity
-Skill gaps identification
-Personnel skills
-use of information/feedback
- personnel assessments
-Training/capacity
building
5 Point
Likert
Scale
Questionnaire
Interview
guide
FGD
Descriptive
To establish how
BOMA monitoring and
evaluation data
influenced the
performance of saving
and lending scheme
independent
variable
Performance
of saving and
lending
schemes
- Management attitude towards
Micro businesses
- Identification of indicators
-data collection
-Results /findings analysis
-use of information/feedback
-The roles of M&E
5 Point
Likert
Scale
Questionnaire
Interview
guide
FGD
Descriptive
Source: Researcher, (2020)

32
3.6 Reliability and Validity
An instrument is deemed reliable if it reflects its stability and consistency within a given context.
It is the consistency of measurement over time, whether it provides the same results on repeated
trails. Reichardt and Cook, (1997) define reliability as “a characteristic of an instrument that
reflects the degree to which the instrument provokes consistent responses”. Before actual data
collection, piloting of the questionnaire was carried out (Golafshani, 2003). The questionnaire
was sent out to 10 respondents working in various programmes in BOMA project. The number
of respondents arrived at by calculating 10% of the targeted population/ sample size (Mugenda
and Mugenda, 2003). 5 respondents were considered few and as a result, 5 more were added
making a total of 10 respondents. Piloting helped the researcher to test the reliability of the
instrument. A Cronbach alpha test was used to measure the internal consistency and reliability of
the data collection instruments. Cronbachs coefficient alpha is computed using excel to
determine how items correlate among themselves. Reliability of at least 0.70 or higher is
recommended for social Science research (Mugenda and Mugenda, 2003). The Cronbachs
reliability coefficient was 0.85 which was more than 0.7 and therefore the instruments were
deemed to be reliable.
Orodho, (2005), validity refers to “the degree to which the empirical measures or several
measures of the concept, accurately measure the concept”. It indicates the extent to which the
instrument measures the constraints under investigation (Mugenda and Mugenda, 1999). This
study used content validity, criterion validity and construct validity. To ensure content validity,
research experts reviewed the questionnaires to confirm the data that is collected represent the
content that the test is designed to measure. According to Bordens & Abott (2011), content
validity of an instrument is improved through expert judgment in constructing the instrument
items. The researcher used also simple English to ensure that the respondents understand them

33
easily. Effort was also made to construct clear and precise questionnaires with the help of the
supervisors in order to avoid ambiguity. The researcher prepared the research instruments in
close consultation with the supervisors, whose expert judgment helped improve content validity.
3.7 Ethical Consideration
Proper permission from chiefs, ward administration office and the BOMA office was obtained
before the study was carried out. The respondents in the study were offered a detailed
explanation about the study so that they could participate voluntarily after full disclosure.
Additionally, utmost confidentiality of the respondents and their responses were safeguarded. In
addition, the information obtained from the respondents will not be used for other purposes other
than drawing the conclusion of this study.

34
CHAPTER FOUR
RESULTS AND DISCUSSION
This chapter presented data analysis and interpretation of the research findings in three sections.
All three sections presented study responses on the assessment of monitoring and evaluation
systems and performance at BOMA project Marsabit County. First, the research response rate
was computed and presented, secondly the demographic information of the respondents, then
finally the findings on three key objectives areas of the study were presented and interpreted
using frequency Tables, pie charts and bar graphs.
4.1 Response Rate
The study targeted 50 community members‟ respondents and 12 officers „drawn from 3
locations. However, 49 respondents and 10 officers responded and returned their questionnaires
contributing to 98% and 83% response rate respectively. According to Mugenda and Mugenda
(1999), a response rate of 50% is adequate for analysis and reporting; a rate of 82.1% is good
while a response rate of 90% and over is excellent; therefore, this response rate was adequate for
analysis and reporting.
4.2 Demographic Data of Respondents
The community respondents were requested to provide information on their gender, and age
bracket. BOMA employers were in addition asked to provided information on their level of
education
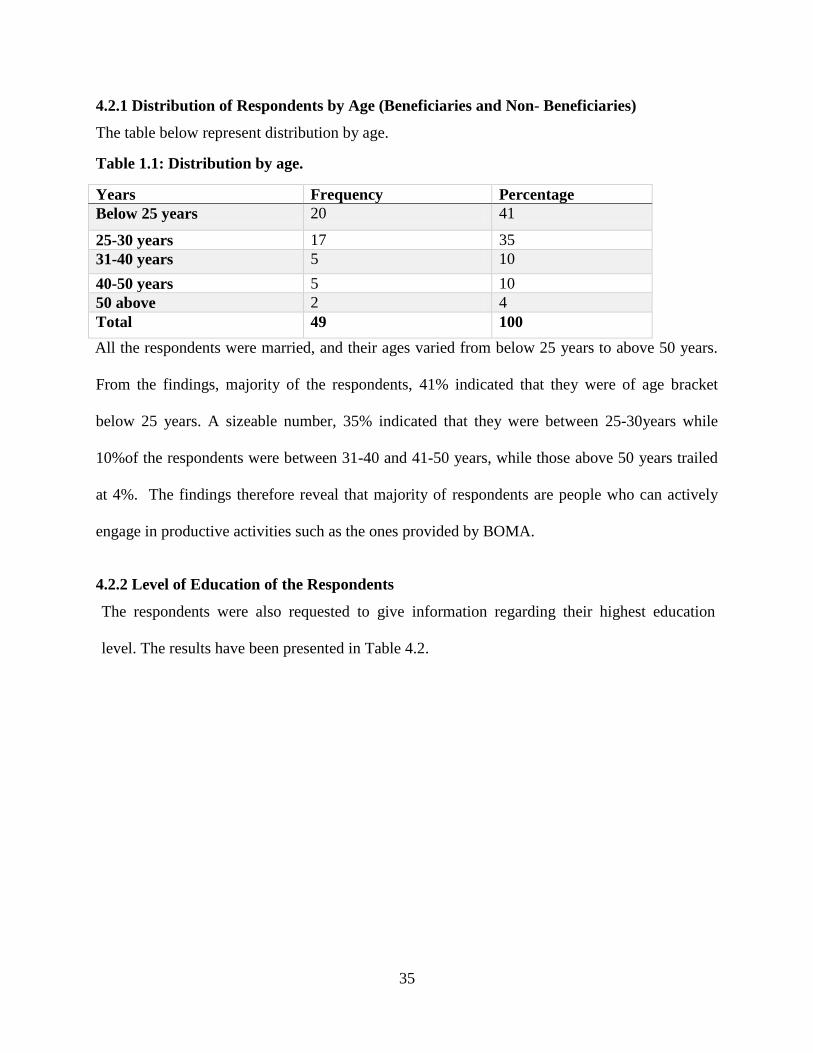
35
4.2.1 Distribution of Respondents by Age (Beneficiaries and Non- Beneficiaries)
The table below represent distribution by age.
Table 1.1: Distribution by age.
Years Frequency Percentage
Below 25 years 20 41
25-30 years 17 35
31-40 years 5 10
40-50 years 5 10
50 above 2 4
Total 49 100
All the respondents were married, and their ages varied from below 25 years to above 50 years.
From the findings, majority of the respondents, 41% indicated that they were of age bracket
below 25 years. A sizeable number, 35% indicated that they were between 25-30years while
10%of the respondents were between 31-40 and 41-50 years, while those above 50 years trailed
at 4%. The findings therefore reveal that majority of respondents are people who can actively
engage in productive activities such as the ones provided by BOMA.
4.2.2 Level of Education of the Respondents
The respondents were also requested to give information regarding their highest education
level. The results have been presented in Table 4.2.
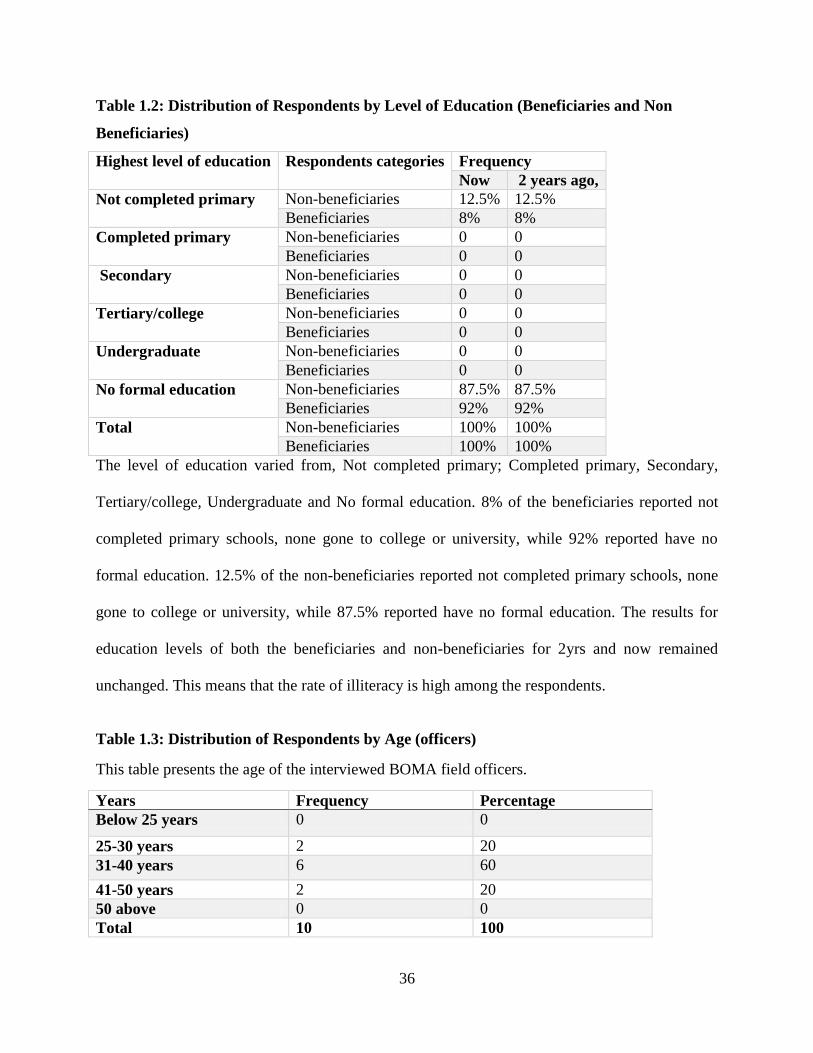
36
Table 1.2: Distribution of Respondents by Level of Education (Beneficiaries and Non
Beneficiaries)
Highest level of education Respondents categories Frequency
Now 2 years ago,
Not completed primary Non-beneficiaries 12.5% 12.5%
Beneficiaries 8% 8%
Completed primary Non-beneficiaries 0 0
Beneficiaries 0 0
Secondary Non-beneficiaries 0 0
Beneficiaries 0 0
Tertiary/college Non-beneficiaries 0 0
Beneficiaries 0 0
Undergraduate Non-beneficiaries 0 0
Beneficiaries 0 0
No formal education Non-beneficiaries 87.5% 87.5%
Beneficiaries 92% 92%
Total Non-beneficiaries 100% 100%
Beneficiaries 100% 100%
The level of education varied from, Not completed primary; Completed primary, Secondary,
Tertiary/college, Undergraduate and No formal education. 8% of the beneficiaries reported not
completed primary schools, none gone to college or university, while 92% reported have no
formal education. 12.5% of the non-beneficiaries reported not completed primary schools, none
gone to college or university, while 87.5% reported have no formal education. The results for
education levels of both the beneficiaries and non-beneficiaries for 2yrs and now remained
unchanged. This means that the rate of illiteracy is high among the respondents.
Table 1.3: Distribution of Respondents by Age (officers)
This table presents the age of the interviewed BOMA field officers.
Years Frequency Percentage
Below 25 years 0 0
25-30 years 2 20
31-40 years 6 60
41-50 years 2 20
50 above 0 0
Total 10 100

37
From the findings, majority of the respondents, 60% (6), indicated that they were of age bracket
31-40 years. A sizeable number, 20% (2), indicated that they were between age 41-50 years and
25-30 years. No one was below 25 years or above 50 years. The findings therefore reveal that
majority of employees at BOMA in Kenya are above age 25.
The table below shows the gender of interviewed BOMA field officers.
Table 1.4: Gender of the respondents (officers)
Gender of the respondents Frequency Percentage (%)
Male 6 60
Female 4 50
Total 10 100
From the findings, majority of the respondents, 60% (6) were male while 40% (4) of the
respondents were female. The results indicated a slightly larger percentage of men were
involved in filling the questionnaires as compared to that of female thus insinuating that many
male working for BOMA in Kenya participated in the study. This overrepresentation of male
employees is a clear indication of gender imbalance in staff distribution at BOMA in Kenya
especially in M&E which may have a negative impact on the effectiveness of M&E system.
Majority of the respondents were from the M&E unit which is an area generally dominated by
men. This is due to the nature of the work which involves a lot of field work and travelling, and
many women tend to shy away from such jobs.
This table represents the education level of the interviewed BOMA field officers.

38
Table 1.5: Level of Education of The Respondents (officers)
Highest level of education Frequency Percentage (%)
Tertiary/college 1 10
Undergraduate 7 70
Postgraduate 2 20
Total 10 100
From the findings, majority of the respondents, 70% (7), indicated that they had achieved
undergraduate as their education level while 20% (2) indicated that they had attained
postgraduate level. Only one respondent (10%) indicated that had tertiary/college as the level of
education. The findings implied that most of the employees of BOMA in Kenya had obtained
postgraduate and undergraduate as their highest education level indicating had the knowledge,
capacity, skills and management expertise to conduct M&E activities successfully.
4.2.3 Work duration of the respondents
The respondents were requested to indicate how long they had been working for BOMA
In Kenya. The findings are illustrated in Table 1.7.
The table below represents data of officer‟s work durations.
Table 1.6: work duration of the respondents (officers)
Work duration of the respondents Frequency Percentage (%)
Less than 1 year 0 0
1-3 years 3 30
4-6 years 5 50
7-9 years 2 20
9 years and above 0 0
Total 10 100
From the findings, majority of the respondents, 50% (5) stated that they had worked for BOMA
in Kenya for a period of 4-6 years. Followed by, respondents whose time lagged between 1-3
years, these were 30% (3) and lastly followed by 20% (2) for a period of 7-9 years. No
respondent had worked for less than 1 year. The results indicate that most employees, 70% (7),

39
had worked in BOMA in Kenya for a long duration, of over 4 years and thus had sufficient
information on the organization‟s M&E processes, and its influences on the programme
4.2.4 Marital Status
All the respondents were married.
The table below presents data for the change in the number of household member‟s overtime.
Table 1.7: Household members
Household members Now
Percentage
2 years
ago,
Percentage
Change
Percentage
%
change in
adults
%change
in children
Less than 5
people
Non-
beneficiaries
87.5% 96% -8.5%
Beneficiaries 80% 92 -12%
Between 6
and 10
people
Non-
beneficiaries
12.5% 4% 8.5%
Beneficiaries 20% 8% 12%
Between 11
and 15
people
Non-
beneficiaries
0 0 0
Beneficiaries 0 0 0
More than
15 people
Non-
beneficiaries
0 0 0
Beneficiaries 0 0 0
The study sought to find out the distribution of the respondents‟ household members in the
targeted locations. From the Table above the number for dependent‟s for both beneficiaries and
non-beneficiaries for household members less than 5 people decreased by 12% and 8.5%
respectively, increasinghousehold members between 6 and 10 people by 12% and 8.5%
respectively, as confirmed through the FGDs this increase is attributed to the increase in income
that led to the beneficiary households accommodating more people in the household, or more
births due to increased income. On the other hand, the non – beneficiaries‟ households had to
accommodate more members to aid in expenditure and increase income sources.

40
4.2.5 Sources of Income
The table presents data for change of sources of income overtime for both beneficiaries and non-
beneficiaries.
Table1.8: sources of income
#sources of
income
Respondents Now % 2 years
ago, %
% change
1
Non-beneficiaries 83% 92% -9%
Beneficiaries 0% 88% -88%
2 Non-beneficiaries 16% 7% 9%
Beneficiaries 80% 10% 70%
More than 3 Non-beneficiaries 1% 1% 0%
Beneficiaries 20% 2% 18%
The non-beneficiaries, who were depending on only one source of income, decrease by 9%,
resulting to the same increase in the number of non-beneficiaries depending on 2 sources of
income. Those depending on more than 3 sources of income remained unchanged. On the other
hand, for beneficiaries there were significant changes in all sources of income. For those
depending on 1 source of income, there was a decrease of 88%, which resulted to an increase of
2 sources and more than 3 sources of income by 70% and 18% respectively. On FGD discussions
with non-beneficiaries‟, respondents lamented that lack of mentorship, especially during the first
4 months, has resulted to poor growth and progress of their business, despite them copying
BOMA beneficiaries. This confirms that people need to be mentored and guided for them to
diversify their sources of income. Below is a graphical representation of changes in sources of
income for both beneficiaries and non- beneficiaries‟ overtime.

41
-100%
-50%
0%
50%
100%
No
n-p
arti
cip
ants
par
tici
pan
ts
No
n-p
arti
cip
ants
par
tici
pan
ts
No
n-p
arti
cip
ants
par
tici
pan
ts
1 2 More than 3
per
cen
tage
ove
rtim
e
Sources of income
Sources of Income
%2 years ago %Now % Change
Figure 1.1: Sources of income
Sources of income have increased more overtime for beneficiaries compare to the non
beneficiaries. This can be attributed to a proper monitoring and evalution system in place as
stated by participants during the FGD.
4.2.6 Business Type
This table presents business type changes overtime for both beneficiaries and non-beneficiaries.
Table 1.9: Business type
business type Respondents %
now
% 2 years
ago,
%
change
Kiosk/duka
Non-beneficiaries 8% 4% 4%
Beneficiaries 48% 0% 48%%
Livestock business Non-beneficiaries 0 4% 4%
Beneficiaries 12% 4% 8%
Grocery
Non-beneficiaries 4% 0% 4%
Beneficiaries 8% 4% 4%
Clothes
Non-beneficiaries 4% 0% 4%
Beneficiaries 12% 0% 12%
Butchery Non-beneficiaries 4% 0% 4%
Beneficiaries 20% 4% 16%
Other (please state- relative sending
money, casual labour, local brew)
Non-beneficiaries 80% 92% 8%
Beneficiaries 0% 88% 92%
No, I do not have a business Non-beneficiaries 80% 92% 12%
Beneficiaries 0% 88% 88%

42
Business types in the study area were of varied types including kiosk, grocery, livestock,
butchery and clothes. A comparison between beneficiaries and non-beneficiaries was such that
amongst those who owned kiosks, 48% had kiosks while amongst non-beneficiaries a only 8%
had kiosks. Amongst those who owned livestock business, 12% had livestock business while
none had livestock business amongst the non-beneficiaries.
Amongst those who owned grocery, 8% had grocery while amongst the non-beneficiaries4%
had grocery. Amongst those who owned butchery, 20% had Butchery while amongst the non-
beneficiaries 4% had butchery. Amongst those who owned clothes 12% had clothes while
amongst the non-beneficiaries 4% had clothes. 80% of the of the non -beneficiaries who had not
any businesses were dependent on other sources of incomes such as relative sending money,
casual labour, local brew which was not sustainable.
Over the last 2 years there was an 88% increase in the number of beneficiaries who reported to a
have started a micro business compared to only 12% of non-beneficiaries.
Below is a figure representation of Business type changes over time for both beneficiaries and
non-beneficiaries.

43
Figure 1.2: Type of income
From the figure above we can see that all the types of businesses increased overtime with and
exception of livestock business for non-beneficiaries. This upward trend can be attributed to the
spillover effect as a result of BOMA presence in the locality motivating people to engage in
income generating activities as a result of seeing their families or neighbors who have benefited
from the BOMA.
As narrated by a respondent in Namarei during an FGD discussion, that she started her business
as a result of her sister, who was supported by BOMA. The sister used to send her some goods to
sell at the satellite camp, on an agreement of sharing profits, she then accumulated her profits
and used it to start her own business.

44
0%10%20%30%40%50%60%70%80%90%
100%
Non-part Non-part Non-part Non-part Non-part Non-part Non-part
Kiosk/dukaLivestock businessGrocery Clothes Butchery Other (please state- relative sending money, casual labour, local brew)
No, I do not have a business
Per
cen
tage
ch
ange
Businesss type
Other sources of income and no business
% 2 years ago, % Now
Figure 1.3: Sources of income
From this figure we can see that there is a drop-in people without business and people depending
on other sources of income. This is attributed to the spillover effect. But the drop is high among
the intervene beneficiaries compared to non-beneficiaries.

45
The table below presents how business was started for both beneficiaries and non-beneficiaries.
Table 1.10: How current business started.
How current business started Respondents Percentage
Through BOMA grants Non-beneficiaries 0%
Beneficiaries 100%
Through other grants (other
NGOs/ govt money)
Non-beneficiaries 4%
Beneficiaries 0%
Helped by relative Non-beneficiaries 12%
Beneficiaries 0
Through self (selling of
livestock, loan e.t.c)
Non-beneficiaries 4%
Beneficiaries 0
No, Ido not have a business Non-beneficiaries 80%
Beneficiaries 0%
All beneficiaries reported that their business where facilitated by BOMA, and the non-
beneficiaries reported that they started business either through other grants or through their own
initiatives this accounted for the 20% of non-beneficiary‟s businesses (4% through other grants,
12% Helped by relative and 4% by Self).
4.2.7 Business Value vs Graduation Period
Table below presents business value vs graduation period for both beneficiaries and non-
beneficiaries.
Table 1.11: Business value vs graduation period
Business
value
Respondents %now %2
years
ago,
%chang
e
Graduation period
A year
ago,
Yes- 2 or
more years
0- 10,000 Non-beneficiaries 8% 4% 4% N/a N/a
Beneficiaries 4% 0% 96% 1 0
10,001 –
20,000
Non-beneficiaries 4% 4% 0% N/a N/a
Beneficiaries 52% 0% 52% 10 3
20,001-
30,000
Non-beneficiaries 4% 4% 0% N/a N/a
Beneficiaries 32% 0% 32% 1 7
More than
30000
Non-beneficiaries 0 0% 0 N/a N/a
Beneficiaries 12% 0% 12% 0 3
No, i do not
have a
business
Non-beneficiaries 80% 92% 16% N/a N/a
Beneficiaries 0% 100% 100% 0 0

46
For the business Value 8% of non- beneficiaries and 4% of beneficiaries had a business with a
business value of 0-10,000. On business Value category of 10001-20,000 non- beneficiaries were
at 4% while the beneficiaries were at 52%. On business Value category of 20001-30,000 non-
beneficiaries were at 4% while the beneficiaries were at 32%.
On business Value category of More than 30,000 non- beneficiaries were at 0% while the
beneficiaries were at 32%. 80% of non -beneficiaries had not business, thus no reliable income
compares to 100% of beneficiaries with Business. Overall this means that there was a positive
growth in business values for both beneficiaries and non-beneficiaries‟ overtime, but the increase
was higher for beneficiaries compared to non-beneficiaries. The beneficiaries reported a highest
of 96% increase in reported business values compared to the highest in non-beneficiaries who
reported a 4%. Refer the figure 4.5&4.6, for more details.
See below figure representation of business growth over time for both beneficiaries and non-
beneficiaries

47
Figure 1.4: Business growth overtime - beneficiaries
From the figure 1.4, it is evident that time is directly related with growth. Most of the
beneficiaries who have graduated 2 or more years ago have a higher business values compare to
those who graduated a year ago. Confirming that BOMA‟s intervention continues after
graduation. “We no longer rely on our husbands for cash to buy food or little household items,
we sometimes even surprise them with kikois (Sukas) when we go for shopping” As stated by
one of the respondents from Namarei.
4.2.8 Failed Business
Table below represents number and reasons for failed business for both beneficiaries and non-
beneficiaries.
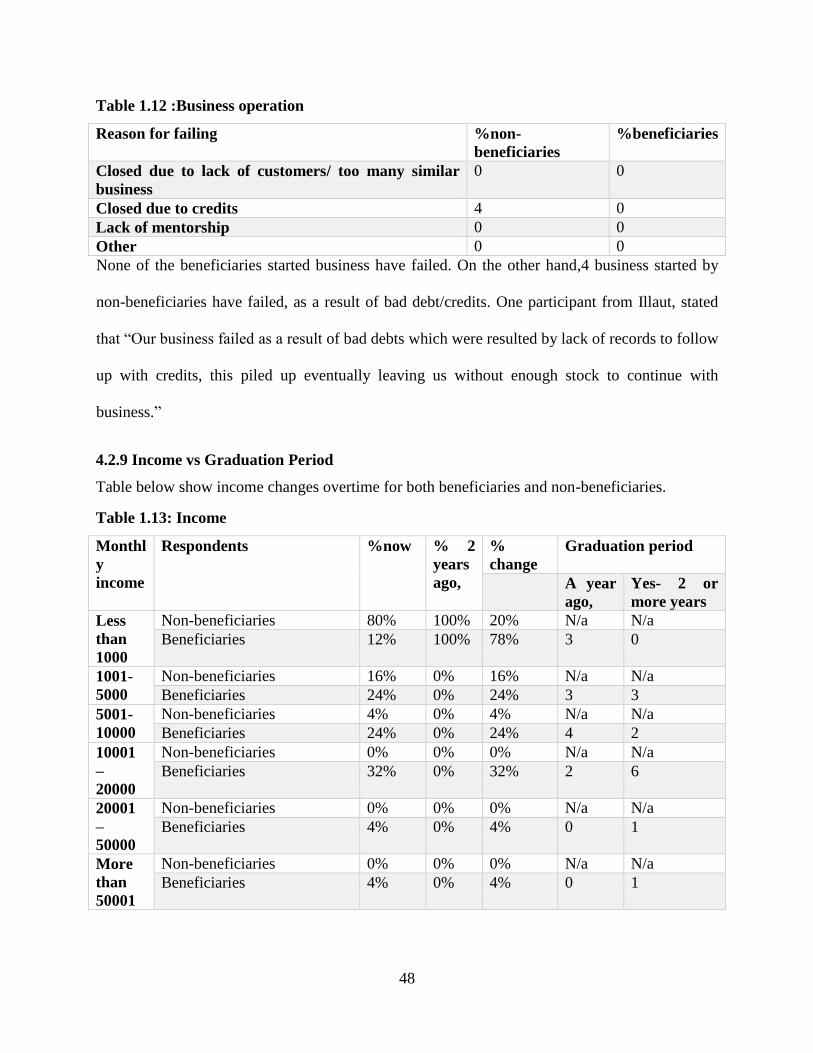
48
Table 1.12 :Business operation
Reason for failing %non-
beneficiaries
%beneficiaries
Closed due to lack of customers/ too many similar
business
0 0
Closed due to credits 4 0
Lack of mentorship 0 0
Other 0 0
None of the beneficiaries started business have failed. On the other hand,4 business started by
non-beneficiaries have failed, as a result of bad debt/credits. One participant from Illaut, stated
that “Our business failed as a result of bad debts which were resulted by lack of records to follow
up with credits, this piled up eventually leaving us without enough stock to continue with
business.”
4.2.9 Income vs Graduation Period
Table below show income changes overtime for both beneficiaries and non-beneficiaries.
Table 1.13: Income
Monthl
y
income
Respondents %now % 2
years
ago,
%
change
Graduation period
A year
ago,
Yes- 2 or
more years
Less
than
1000
Non-beneficiaries 80% 100% 20% N/a N/a
Beneficiaries 12% 100% 78% 3 0
1001-
5000
Non-beneficiaries 16% 0% 16% N/a N/a
Beneficiaries 24% 0% 24% 3 3
5001-
10000
Non-beneficiaries 4% 0% 4% N/a N/a
Beneficiaries 24% 0% 24% 4 2
10001
–
20000
Non-beneficiaries 0% 0% 0% N/a N/a
Beneficiaries 32% 0% 32% 2 6
20001
–
50000
Non-beneficiaries 0% 0% 0% N/a N/a
Beneficiaries 4% 0% 4% 0 1
More
than
50001
Non-beneficiaries 0% 0% 0% N/a N/a
Beneficiaries 4% 0% 4% 0 1

49
For the Monthly Income categories, 80% of non-beneficiaries and 4% of beneficiaries received
income of less than 1000,16% of non- beneficiaries and 24%the beneficiaries received income of
between 1001-5000, on income categories of between 10001 -20000, 20001 -50001 and more
than 50001, None of non- beneficiaries received, while, 32%,4% and 4% respectively of
beneficiaries received. Overall, there was a positive growth in income for both beneficiaries and
non-beneficiaries‟ overtime, but the increase was higher for beneficiaries compared to non-
beneficiaries. The beneficiaries reported a cumulative 78% increase in income compared to a
cumulative of 20% for non-beneficiaries. (Table 1.3). Refer the graph to graph 6, for more
details. See below income comparison for both beneficiaries and non -beneficiaries overtime.
As presented by graph 4.5, Overall, there was a positive growth in income for both beneficiaries
and non-beneficiaries‟ overtime, but the increase was higher for beneficiaries compared to non-
beneficiaries. The beneficiaries reported a cumulative 78% increase in income compared to a
cumulative of 20% for non-beneficiaries refer to table 4.13 above.
Below see income growth overtime for beneficiaries.
3 3 42
0 002468
Participants Participants Participants Participants Participants Participants
Less than
1001
1001-5001 5001- 10001 10001 –
20000
20001 –
50000
More than
50001
Par
tici
pan
ts n
o
INCOme
Income growth overtimeA year ago, Yes- 2 or more years
Figure 1.5: Monthly income
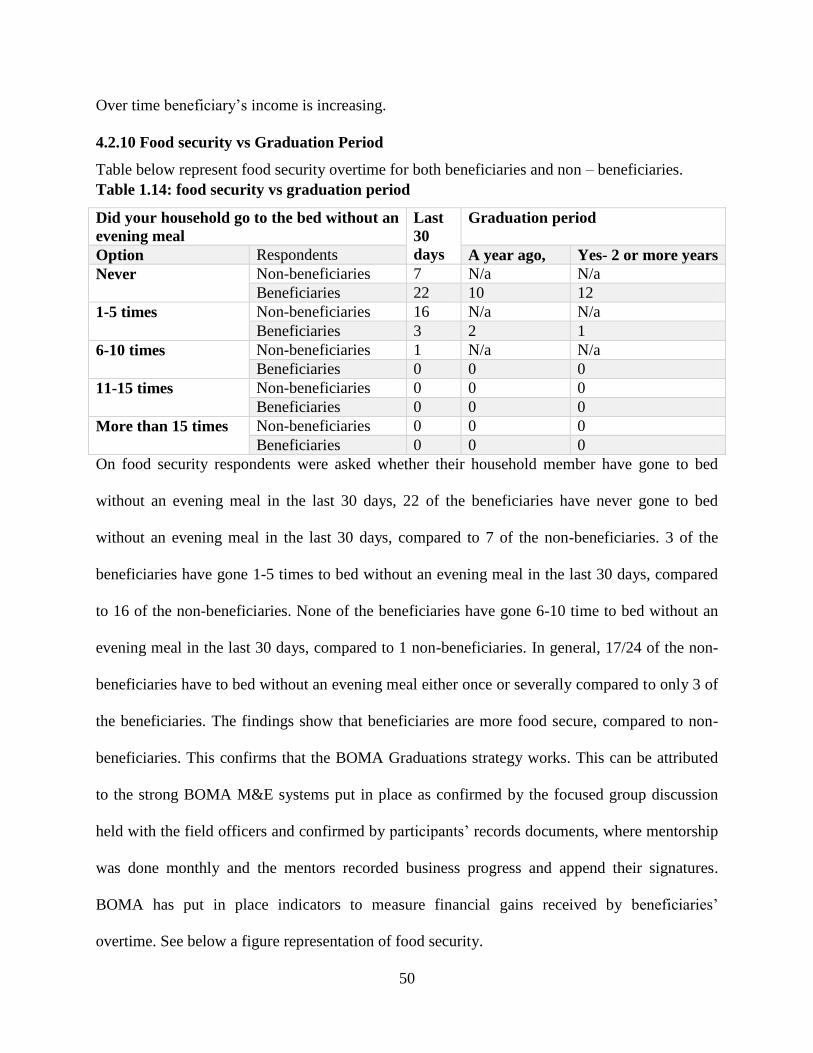
50
Over time beneficiary‟s income is increasing.
4.2.10 Food security vs Graduation Period
Table below represent food security overtime for both beneficiaries and non – beneficiaries.
Table 1.14: food security vs graduation period
Did your household go to the bed without an
evening meal
Last
30
days
Graduation period
Option Respondents A year ago, Yes- 2 or more years
Never Non-beneficiaries 7 N/a N/a
Beneficiaries 22 10 12
1-5 times Non-beneficiaries 16 N/a N/a
Beneficiaries 3 2 1
6-10 times Non-beneficiaries 1 N/a N/a
Beneficiaries 0 0 0
11-15 times Non-beneficiaries 0 0 0
Beneficiaries 0 0 0
More than 15 times Non-beneficiaries 0 0 0
Beneficiaries 0 0 0
On food security respondents were asked whether their household member have gone to bed
without an evening meal in the last 30 days, 22 of the beneficiaries have never gone to bed
without an evening meal in the last 30 days, compared to 7 of the non-beneficiaries. 3 of the
beneficiaries have gone 1-5 times to bed without an evening meal in the last 30 days, compared
to 16 of the non-beneficiaries. None of the beneficiaries have gone 6-10 time to bed without an
evening meal in the last 30 days, compared to 1 non-beneficiaries. In general, 17/24 of the non-
beneficiaries have to bed without an evening meal either once or severally compared to only 3 of
the beneficiaries. The findings show that beneficiaries are more food secure, compared to non-
beneficiaries. This confirms that the BOMA Graduations strategy works. This can be attributed
to the strong BOMA M&E systems put in place as confirmed by the focused group discussion
held with the field officers and confirmed by participants‟ records documents, where mentorship
was done monthly and the mentors recorded business progress and append their signatures.
BOMA has put in place indicators to measure financial gains received by beneficiaries‟
overtime. See below a figure representation of food security.

51
Figure 1.5: Food security
17 non -beneficiaries have missed some meals, compared to only 3 beneficiaries in the last 30
days. The findings show that beneficiaries are more food secure, compared to non-beneficiaries.
This confirms that the BOMA Graduations strategy works.
A further data analysis on food security and reasons why people missed meals showed that7of
thenon-beneficiaries, missed meals as a result of not having enough food , 6 had money to buy
food but could not get shops to buy food from around, 2 chose to sleep without eating, 2 were
lazy to do any cooking. On the other hand, 2 of the beneficiaries chose to sleep without eating
and one could not cook as a result of laziness. This further confirms that BOMA project
graduation works. See table below for more details on reasons for missing meals.
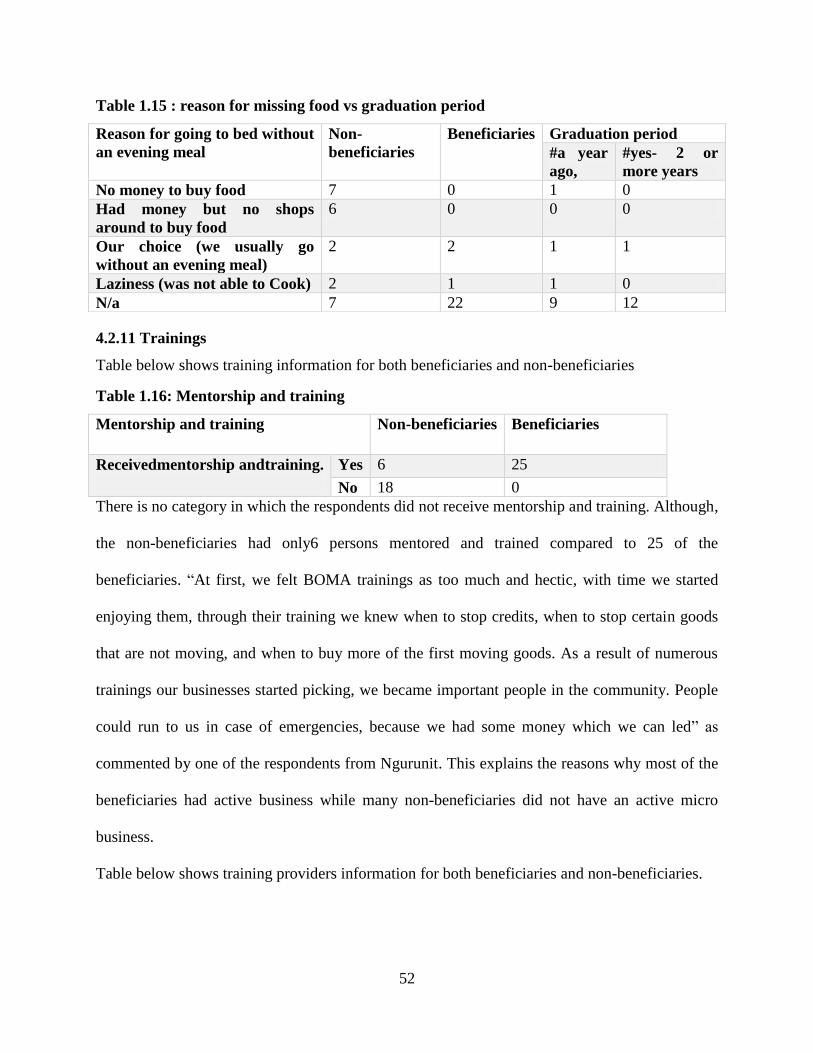
52
Table 1.15 : reason for missing food vs graduation period
4.2.11 Trainings
Table below shows training information for both beneficiaries and non-beneficiaries
Table 1.16: Mentorship and training
Mentorship and training Non-beneficiaries Beneficiaries
Receivedmentorship andtraining.
Yes 6 25
No 18 0
There is no category in which the respondents did not receive mentorship and training. Although,
the non-beneficiaries had only6 persons mentored and trained compared to 25 of the
beneficiaries. “At first, we felt BOMA trainings as too much and hectic, with time we started
enjoying them, through their training we knew when to stop credits, when to stop certain goods
that are not moving, and when to buy more of the first moving goods. As a result of numerous
trainings our businesses started picking, we became important people in the community. People
could run to us in case of emergencies, because we had some money which we can led” as
commented by one of the respondents from Ngurunit. This explains the reasons why most of the
beneficiaries had active business while many non-beneficiaries did not have an active micro
business.
Table below shows training providers information for both beneficiaries and non-beneficiaries.
Reason for going to bed without
an evening meal
Non-
beneficiaries
Beneficiaries Graduation period
#a year
ago,
#yes- 2 or
more years
No money to buy food 7 0 1 0
Had money but no shops
around to buy food
6 0 0 0
Our choice (we usually go
without an evening meal)
2 2 1 1
Laziness (was not able to Cook) 2 1 1 0
N/a 7 22 9 12

53
Table1.17: Mentorship and training
Who provided the mentorship andtraining? %Non-beneficiaries %Beneficiaries
BOMA 0 100%
OtherNGOs 21% 20%
National/county 4% 40%
Other 0 0
Different stakeholders provided mentorship and trainings, to both non-beneficiaries and
beneficiaries. BOMA beneficiaries benefited the most, 100% of them benefiting from BOMA
facilitated trainings and 20% other Godsend 40% benefiting from National/County provided
training. The non-beneficiaries received trainings from Other NGOs and National/County
government 21% and 4% respectively. BOMA went further and linked it beneficiaries with other
training opportunities, through its linkages department where beneficiaries are linked to relevant
organization or departments in the county or national governments that can help them reach their
dreams as stated by mentor Illaut in the FGD.
Table 1.18: Frequency of Mentorship and training
Option Non-beneficiaries Beneficiaries
Daily 0 0
Weekly 0 0
Monthly 0 25
Quarterly (after every 4 months) 0 0
Yearly 0 0
Was done once 6 10
All BOMA beneficiary‟s received mentorship and trainings regularly, on a monthly basis, giving
them an upper hand, compared to only 6 of non-beneficiaries whose trainings were done once
and unpredicted. As confessed, by many participants during the FGD, BOMA trainings had
helped them to be able to understand how to start, run their businesses and even be able to
distribute profits evenly without really affecting our business.

54
4.2.12 Savings
The table below present saving information for both beneficiaries and non-beneficiaries‟
overtime.
Table1.19: Savings
Do you have any savings Option Now 2 years ago,
Yes Non-beneficiaries 8% 0
Beneficiaries 100% 4%
No Non-beneficiaries 92% 0
Beneficiaries 0 0
A 100% of BOMA beneficiaries currently have savings compared to only 8% of the non-
beneficiaries.
Table 1.20: Savings place
Saving location Option Now 2 years ago, Change
At an institution (bank, Saccoetc.) Non-beneficiaries 0 0 0
Beneficiaries 3 3 3
BOMA saving group Non-beneficiaries 0 0 0
Beneficiaries 25 0 25
Other saving groups Non-beneficiaries 2 2 0
Beneficiaries 0 1 1
At home/business Non-beneficiaries 4 0 4
Beneficiaries 25 0 25
N/a- I have never saved Non-beneficiaries 19 22 3
Beneficiaries 0 22 22
On saving, none of beneficiaries or non-beneficiaries saved in a at an institution (bank or Sacco).
While all beneficiaries still save In a BOMA saving group. For other saving groups 3
beneficiaries and 2 non-beneficiaries have saving in a non-BOMA saving group. All
beneficiaries have personal saving at home compared to only 4 of the non-beneficiaries. Both
categories of respondents save, but 25/25(100%) of BOMA beneficiaries save and in more than
one place compared to only 5/24 (20%) of the non-beneficiaries.

55
Table 1.21: savings frequency
2 years ago, the saving
culture was not there, this
started recently and both
categories, nowsave
regularly, but 100% of
BOMA beneficiaries save on
a monthly basis, compared
to only 20% of non-
beneficiaries. 12% of non-beneficiaries save on a year basis, 80% of non -beneficiaries do not
save completely. The saving culture of beneficiaries is regular and consistent.
Table below shows various places where respondents can get money for their savings.
Table 1.22: Money to save
Where is saving from Respondents %
Form my BOMA business Non-beneficiaries 0%
Beneficiaries 100%
From the sale of own livestock. Non-beneficiaries 8%
Beneficiaries 0%
From relatives, cash transfers, other
business, salary etc.
Non-beneficiaries 0%
Beneficiaries 0%
Other Non-beneficiaries 0%
Beneficiaries 0%
N/a Non-beneficiaries 92%
Beneficiaries 0%
100% of BOMA beneficiaries receive their monthly saving from BOMA started micro-
businesses compared to 8% of non-beneficiaries who get their savings from sale of their own
livestock an activity which is unsustainable in the long run. The regular monthly 100% saving
habits by all BOMA beneficiaries is as a result of a regular and consistent source of income from
theBOMA started business compared to the non-beneficiaries who rely mostly on their livestock.
How do you save Option %Now %2 years ago,
Daily Non-beneficiaries 0 0
Beneficiaries 0 0
Weekly Non-beneficiaries 0 0
Beneficiaries 0 0
Monthly Non-beneficiaries 8% 4%
Beneficiaries 100% 4%
Quarterly Non-beneficiaries 0 0
Beneficiaries 0 0
Yearly Non-beneficiaries 12% 0
Beneficiaries 0 0
Never Non-beneficiaries 80% 100%
Beneficiaries 0 96%

56
Table 1.23: Borrowing and lending frequency
Both categories borrowed money, 12% of
the beneficiaries borrowed once compared
to8% of non-beneficiaries, 84% of
beneficiaries borrowed severally compared
to only 12% of non-beneficiaries. The high
confidence level in borrowing exhibited by BOMA beneficiaries is attributed to them having a
regular source of income, and them having their own saving groups, compared to non-
beneficiaries who mostly rely on their livestock‟s which cannot be sold on a regular basis.
4.2.13 Borrowing
Table below show on respondent borrowing.
Table 1.24: borrowing from?
Where borrowed Option %Frequency
BOMA saving group Non-beneficiaries 8%
Beneficiaries 80%
Other saving groups Non-beneficiaries 4%
Beneficiaries 20%
From a relative Non-beneficiaries 4%
Beneficiaries 0
From an institution (bank, Sacco e.tc.) Non-beneficiaries 0%
Beneficiaries 8%
From a businessman Non-beneficiaries 4%
Beneficiaries 4%
I have never borrowed Non-beneficiaries 88%
Beneficiaries 4%
On borrowing 80% of the beneficiaries have borrowed from a BOMA saving group compared to
only 8% of non-beneficiaries. 20% of beneficiaries have borrowed from other saving groups
compared to only 4% for the non-beneficiaries. None of the beneficiaries borrowed from
relatives compared to 4% borrowing by the non-beneficiaries. On institution 8% of the
Times borrowed Option %
Once Non-beneficiaries 8%
Beneficiaries 12%
Severally (2-4 times) Non-beneficiaries 12%
Beneficiaries 84%
Never Non-beneficiaries 88%
Beneficiaries 4%

57
beneficiaries borrowed compared to none of non-beneficiaries borrowing from institutions. 4 %
of both beneficiaries and non-beneficiaries did borrow from a relative. From the Table above we
can see that majority of non-beneficiaries 88% do not borrow compared to only 4% of
beneficiaries. Also, it seems that the beneficiaries borrowing confidence level is high compared
to non-beneficiaries.
4.2.14 Loan Repayment
Table below shows respondents loans repayment data overtime.
Table 1.25 : Loan repayment ability
Able to repay Option %Non-beneficiaries %Beneficiaries
Yes Now 8% 100%
2 years ago, 0 0
No. Now 8% 0
2 years ago, 0 100%
100% BOMA beneficiaries are now in position to repay their own loans compared to only 8% of
non-beneficiaries. The confidence of repayment has increased for both, the beneficiaries and
non-beneficiaries with an increase of 100% and 8% respectively, this shows that the confidence
level is high among the beneficiaries than the non-beneficiaries and this is attributed to good
monitoring systems put in place to monitors participants growth and progress at each level as
confirmed by the documents received from the officers.
4.2.15 Asset
Table below show respondent assets overtime.

58
Table 1.26: nonproductive asset ownership
Non-productive assets varied from Mattress, Bed, Wheelbarrow, bath Shelter, latrine, mosquito
net, mobile phone, Lantern solar lamp, radio, Television set, refrigerator, Bicycle, Motorcycle
and Motor vehicle. Both beneficiaries and non-beneficiaries have accrued more nonproductive
assets. A comparison between beneficiaries and non-beneficiaries was such that amongst those
who owned Mattresses, 60% had Mattresses while amongst non-beneficiaries only 4% had
Mattresses, amongst those who owned Beds, 40% had Beds while amongst non-beneficiaries
only 4% had Beds, amongst those who owned Wheelbarrows, 8% had Wheelbarrows while
Ownership of
nonproductive asset
Option %Now %2 years ago,
Mattress(es) Non-beneficiaries 4% 0%
Beneficiaries 60% 8%
Bed(s) Non-beneficiaries 4% 4%
Beneficiaries 40% 4%
Wheelbarrow Non-beneficiaries 0% 0%
Beneficiaries 8% 0%
Bath shelter Non-beneficiaries 0 0%
Beneficiaries 8% 0%
Latrine Non-beneficiaries 0 0%
Beneficiaries 20% 4%
Mosquito net(s) Non-beneficiaries 40% 0%
Beneficiaries 96% 20%
Mobile phone Non-beneficiaries 12% 0%
Beneficiaries 100% 8%
Lantern(s)/solar lamp(s) Non-beneficiaries 8% 0%
Beneficiaries 28% 0%
Radio Non-beneficiaries 4% 0%
Beneficiaries 60% 12%
Television set Non-beneficiaries 4% 0%
Beneficiaries 20% 0%
Refrigerator Non-beneficiaries 0% 0%
Beneficiaries 12% 0%
Bicycle Non-beneficiaries 0% 0%
Beneficiaries 0% 0%
Motorcycle Non-beneficiaries 0% 0%
Beneficiaries 4% 0%
Motor vehicle Non-beneficiaries 0% 0%
Beneficiaries 0% 0%

59
amongst non-beneficiaries only 0% had Wheelbarrows. Amongst those who owned bath Shelter,
8% had bath Shelter while amongst non-beneficiaries only 0% had bath Shelter. Amongst those
who owned latrine, 20% had latrine while amongst non-beneficiaries only 0% had latrine.
Amongst those who owned mosquito net, 96% had mosquito net while amongst non-
beneficiaries only 40% had mosquito net. Amongst those who owned had mobile phone, 100%
had had mobile phone while amongst non-beneficiaries only 12% had mobile phone. Amongst
those who owned had Lantern or Solar lamp, 28% had had Lantern or solar lamp while amongst
non-beneficiaries only 8% had Lantern or solar lamp. Amongst those who owned radio, 60% had
radio while amongst non-beneficiaries only 4% had radio. Amongst those who owned had
Television set, 20% had Television set while amongst non-beneficiaries only 4% had Television
set. Amongst those who owned had refrigerator, 12% had refrigerator while amongst non-
beneficiaries only 0% had refrigerator. Amongst those who owned had Motorcycle, 4% had
Motorcycle while amongst non-beneficiaries only 0% had Motorcycle, neither owned a Bicycle
nor Motor vehicle. Overall, the gains are higher among the BOMA beneficiaries compared to the
non-Beneficiaries.

60
Table 1.27: livestock ownership
Both beneficiaries and non-beneficiaries owned a variety of Livestock. Over 2 years, no change
was observed on ownership of cattle among non-beneficiaries, compare to 20% increase in cattle
ownership among the beneficiaries. There was a 30% increase in goats „ownership among the
beneficiaries compared to 12% increase among the non-beneficiaries. For the sheep there was a
12% increase among both the beneficiaries and the non-beneficiaries. For the Camels ownership
there was an increase of 16% among beneficiaries compared to only 4% increase among the non-
beneficiaries. On Donkey‟s ownership there was a 16% increase compared to no increase among
the non-beneficiaries. On Chicken or poultry ownership there was a 36% increase among the
beneficiaries compared to only 20% increase among the non-beneficiaries. Overtime both
beneficiaries and non-beneficiaries have added more livestock. But the accumulation is higher
with the BOMA beneficiaries compared to the non-Beneficiaries.
Option Now 2 years ago, change
Cattle Non-beneficiaries 64% 64% 0%
Beneficiaries 20% 0% 20%
Goats Non-beneficiaries 28% 16% 12%
Beneficiaries 42% 12% 30%
Sheep Non-beneficiaries 20% 8% 12%
Beneficiaries 16% 4% 12%
Camel Non-beneficiaries 8% 4% 4%
Beneficiaries 24% 8% 16%
Donkey Non-beneficiaries 32% 32% 0%
Beneficiaries 28% 12% 16%
Chicken or poultry Non-beneficiaries 32% 12% 20%
Beneficiaries 52% 16% 36%
Other (specify) Non-beneficiaries 0 0 0
Beneficiaries 0 0 0
I do not own livestock Non-beneficiaries 0 0 0
Beneficiaries 0 0 0

61
4.3 Determinants of Effectiveness of a Monitoring and Evaluation System for Projects
4.3.1 Performance of M&E
Table below represents data for M&E performance rating.
Table 1.28 : Performance rating
Options Frequency Mean Standard
Deviation
Project
activities were
delivered on
time
Strongly Disagree 0 4.1
0.54
Disagree 0
Not sure 1
Agree 7
Strongly Agree 2
Grand Total 10
All activities
promised were
implemented
Agree 0 4.1
0.94
Disagree 1
Not sure 1
Agree 4
Strongly Agree 4
Grand Total 10
Resources
availability
(M&E tools,
for tracking)
Strong disagree 0 4.3
0.90
Disagree 1
Not sure 0
Agree 4
Strongly Agree 5
Grand Total 10
General level
of satisfaction
of project M&E
performance
Strong disagree 0 4.8
0.40
Disagree 0
Not sure 0
Agree 2
Strongly Agree 8
Grand Total 10
In order to determine the objectives of the study, the researcher first needs to measure the
performance of the monitoring and evaluation systems at BOMA project. The system was
measured using different variables and five-point Likert scale whose results are shown in
Table4.28. On Lickert scale parameters, 1 means strongly disagree, 2 means disagree,3 means
not sure, 4 means agree, and 5 means strongly agree.

62
In that case then on statement on whether the Project activities were delivered on time, a mean
of 4.1 and standard deviation of 0.54 would mean that respondents agreed that Project activities
and that the respondents‟ responses were very close to the mean. Also 90% of the respondents
agreed that timely delivery of activities influences the performance of M&E. This was
confirmed by the M&E manager who stated that, “there has never been a delay of planned
activities, both in the office and in the field, even during the corona period. During this corona
period we changed our tactics a little bit, from directly visiting our groups for mentorship we
used alternate ways such as voice recorded audio in local languages for our participants
trainings, for disbursement we adopted the use of mobile services among other ways” This
show that BOMA executed it plans and activities on time and this has never been a problem for
them.
On statement on the All activities promised were implemented, a mean of 4.1 and standard
deviation of 0.94 would mean that respondents agreed that All activities promised were
implemented. On delivery of project 70% of the respondents agreed that delivery of projects
activities had influences on the performance of M&E. The M&E officer noted that, “we can
only measure if delivery has happened, any delays means delay in implementation thus
affecting monitoring of indicators, this has never been the case with BOMA activities,
implementations are always in time and documentation put in place for reference”. This
confirms that with timely delivery of activities there is smooth process from data collection,
analysis and reporting leading to timely learning and incorporation of lesson into the
programme for improvements.
On statement on Resources availability (M&E tools, for tracking), a mean of 4.3 and a standard
deviation of 0.90 would mean that respondents agreed Resources were available (M&E tools,

63
for tracking).On Resources availability 70% of the respondents agreed that resources
availability have influences on the performance of M&E. “the budget was introduced recently,
I have a data analysist and an M&E officer and enough time is dedicated for M&E activities”
BOMAM&E manager. The introduction of M&E budget confirms the influence of resources
availability in the project. BOMA realized the need to have an independent budget for M&E
activities in order to increase its efficiency and productivity
On statement on general level of satisfaction of project performance, a mean of 4.8 and a
standard deviation of 0.40 would mean that respondents agreed on the general level of
satisfaction of project performance and project delivery, with which means that the
respondents‟ responses were very close to the mean. “before I joined BOMA, I was not able to
afford the basic necessities of life, but now I am able to feed my family, take my children to
school and on top of that I have learnt to save incase of any emergencies”. Mindira a
beneficiary from Ngurunit. This confirms that people have embraced BOMA and their systems
have contributed positively into their lives.
This therefore implies that M&E influences project delivery as confirmed by beneficiary‟s
general satisfaction on project performance, on resources availability, the All activities
promised were implemented and the Project activities were delivered on time.
4.4 Influence of Monitoring and Evaluation Systems on The Performance of BOMA
Supported Micro Businesses, Saving and Lending Schemes.
In this section, the descriptive statistics used were frequencies and percentages,
Influence of Monitoring and Evaluation on Performance of BOMA Supported Micro Businesses,
Saving and Lending Schemes.

64
Table 1.29: Structure of monitoring and evaluation on performance of BOMA supported
micro business.
Frequency Mean Standard
Deviation
Top management has a
positive attitude towards
the establishment of a
self-sustaining Micro
businesses
Strongly Disagree 1 3.6 1.20
Disagree 1
Not sure 1
Agree 5
Strongly Agree 2
Total 10
The organization has
well-defined indicators of
measuring Micro business
performance
Strongly Disagree 1 3.9 1.30
Disagree 1
Not sure 0
Agree 4
Strongly Agree 4
Total 10
The organization
conducts assessment of
the overall performance
of the micro business
Strongly Disagree 0 4 0.89
Disagree 1
Not sure 1
Agree 5
Strongly Agree 3
Total 10
The roles of M&E are
well defined to support
Micro business
Strongly Disagree 0 4 0.89
Disagree 1
Not sure 1
Agree 5
Strongly Agree 3
Total 10
The organization has got
a „champion‟ for the
M&E exercises
Strongly Disagree 1 3.7 1.27
Disagree 1
Not sure 1
Agree 4
Strongly Agree 3
Total 10
All staff get feedback
after measurement of
project activities
Strongly Disagree 1 3.6 1.20
Disagree 1
Not sure 1
Agree 5
Strongly Agree 2
Total 10
The organization has
adequate capacity to
commission valuations
Strongly Disagree 0 3.9 0.83
Disagree 1
Not sure 1
Agree 6
Strongly Agree 2
Total 10

65
The first objective of the study was to determine how monitoring and evaluation influenced the
performance of BOMA supported micro businesses, saving and lending schemes. The structure
was measured using different variables and five-point Likert scale whose results are shown in
Table 31. On Likert scale parameters, 1 means strongly disagree, 2 means disagree,3 means not
sure, 4 means agree, and 5 means strongly agree.
On statement that top management has a positive attitude towards the establishment of a self-
sustaining Micro businesses, a mean of 3.6 would mean that respondents are not sure if top
management has a positive attitude towards the establishment of a self-sustaining Micro
businesses, with a standard deviation of 1.20 that means that the respondents‟ responses were
not very close to the mean. This mean respondent are not sure of leadership attitude on micro-
business. As stated by M&E officer that “Ihave weekly briefs with program, share findings on
areas that need intervention - findings are then used as the basis for decision making in the
organization”. This show that despite the management not being very active or present in the
field, they still value what is happening with their beneficiaries since the decisions they make
affects them directly, they thus rely on the data to make adjustments or decisions.
On statement that the organization conducts assessment of the overall performance of the micro
business, a mean of 4 would mean that respondents agree that organization conducts
assessment of the overall performance of the micro business, with a standard deviation of
0.89that means that the respondents‟ responses are close to the mean. This means that the
organization conducts assessments. The data analyst stated that, “ BOMA collect both
quantitative and qualitative data, analyzes and shares findings on monthly basis to the
management for further deliberations and decision making”. This confirms that data is used as
the basis of performance measure for BOMA project activities. With regular quality data

66
collection, projects can be able to stay on top of trends, provide answers to problems, analyse
insights to great effect and make timely informed decisions.
On the statement that the organization has well-defined indicators of measuring Micro business
progress towards desired goals, a mean of 4 would mean that respondents agree that the
organization has well-defined indicators of measuring Micro business progress towards desired
goals, with a standard deviation of 0.89 that means that the respondents‟ responses are close to
the mean. This means that the organization has well defined indicators to measure progress
towards the desired goals as confirmed by the data analysist, who stated that “we have
indicators, that we measure to make sure that we are achieving our goals”. Project must have
indicators that are specific, measurable, achievable, realistic, and timely (SMART). This will
help them measure their progress towards their goals and adjust accordingly if they find that
something is not going as planned.
Under statement that the organization has got a „champion‟ for the M&E exercises, a mean of
3.7 would mean that respondents are not sure if the organization has got a „champion‟ for the
M&E exercises, with a standard deviation of 2.7 that means that the respondents‟ responses
were not very close to the mean. This means that the organization lack someone to spearhead
the M&E activities. This was confirmed by M&E officer who stated that, “ An M&E Manager
was just recruited recently, the M&E department was previously incorporated with the
programme, its roles were never clearer then, as the expertise were missing, but the
management realized and solved this. Now we operate independently with close collaboration
with other departments making our work clear and visible”. This shows that M&E need to be
visible and properly coordinated for informed decision making and people should also have

67
M&E skills for better results. BOMA realized this and adjusted. Projects need to be mindful of
their systems so that they can be able to achieve their goals.
All staff get feedback after measurement of project activities a mean of 3.6 would mean that
respondents are not sure if All staff get feedback after measurement of project activities, with a
standard deviation of 1.2 that means that the respondents‟ responses were not very close to the
mean. This means the sharing of finding is not clearly defined and not everyone receives the
results findings. As stated by the data analyst, “previously finding were channeled upward
(management and donors) since the priorities were mostly focused on the heads, and a system
was more programme oriented, but having now become independent this has changed and every
one received data based on their needs”. Proper systems need to be put in place for better
results. Results from M&E always needs to be shared to everyone for consistency and
objectivity. This is something that BOMA has realized and resolve.
The organization has adequate capacity to commission valuations a mean of 3.6 would mean that
respondents are not sure if the organization has adequate capacity to commission valuations,
with a standard deviation of 0.89 that means that the respondents‟ responses are close to the
mean. This means that capacity to commission valuation is in doubt. Echoed the previous
comment by the M&E officer and data analysts M&E, BOMA M&E departments seemed not to
have been working independently, this diverted M&E priorities, but this was resolved and the
M&E is now operating smoothly. Borrowing from these projects need to make sure that their
M&E departments need to be properly functional and established for better project goals
delivery.
With these findings I can now conclude that for proper project delivery, leadership attitude on
micro-business is not clear among the respondents. Although the organization has well-defined
indicators of measuring Micro business progress towards desired goals and conducts

68
assessments, it lacks a champion with the capacity to commission valuation and share the
feedback.
4.5 Influence of Data Quality on Performance of BOMA Supported Micro Businesses,
Saving and Lending Schemes
The study was also specifically meant to determine how data quality influenced the
performance of Micro business and saving and lending schemes. The structure was also
measured using different variables and five-point Likert scale whose results are shown in Table
4.31.
Table 1.30: Data quality on performance of BOMA supported micro business and saving
and lending schemes.
DATA QUALITY &
MICRO BUSINESSES,
SAVING AND
LENDING SCHEMES
Frequency Mean Std dev
Monitoring systems on
Micro business is likely
to generate reliable
information
Strongly Disagree 0 3.90 0.94
Disagree 1
Not sure 2
Agree 4
Strongly Agree 3
Total 10
Micro business data
collected, when
measured reports on
outputs that reflect the
critical stated objectives
of the organization
Strongly Disagree 0 3.80 1.08
Disagree 2
Not sure 1
Agree 4
Strongly Agree 3
Total 10
Good system identifies Strongly Disagree 1 3.70 1.27

69
key issues as well as root
of problems that the
micro business face
Disagree 1
Not sure 1
Agree 4
Strongly Agree 3
Total 10
Data collection activities
conducted legally with
due regard to the welfare
of those affected by its
results
Strongly Disagree 1 4.00 1.18
Disagree 0
Not sure 1
Agree 4
Strongly Agree 4
Total 10
Frequently collected
data enables to truck
trends as well as
understand project
intervention
Strongly Disagree 1 3.90 1.37
Disagree 1
Not sure 1
Agree 2
Strongly Agree 5
Total 10
Data collected provides
clear indicators against
which the organization
work is being measured
Strongly Disagree 0 4.50 0.67
Disagree 0
Not sure 1
Agree 3
Strongly Agree 6
Total 10
The organization carries
out periodic data audits
Strongly Disagree 1 3.50 1.20
Disagree 1
Not sure 2
Agree 4

70
Strongly Agree 2
Total 10
All staff get feedback
after measurement of
project activities
Strongly Disagree 1 3.60 1.20
Disagree 1
Not sure 1
Agree 5
Strongly Agree 2
Total 10
On Lickert scale parameters, 1 means strongly disagree, 2 means disagree,3 means not sure, 4
means agree, and 5 means strongly agree.
Respondents were asked whether Monitoring systems on Micro business is likely to generate
reliable information a mean of 3.9 would mean that respondents are not sure if Monitoring
systems on Micro business is likely to generate reliable information, with a standard deviation of
0.94 that means that the respondents‟ responses are close to the mean. This means that
Monitoring systems on Micro business likelihood to generate reliable information is in doubt.
Asked if the Micro business data collected, when measured reports on outputs that reflect the
critical stated objectives of the organization, a mean of 3.8 would mean that respondents are not
sure if Micro business data collected, when measured reports on outputs that reflect the critical
stated objectives of the organization, with a standard deviation of 1.08 that means that the
respondents‟ responses werenot very close to the mean. This means that Micro business data
collected, when measured reports on outputs may or may not reflect the critical stated
objectives of the organization.

71
On the statement that good system identifies key issues as well as root of problems that the
micro business face, a mean of 3.7 would mean that respondents are not sure if good system
identifies key issues as well as root of problems that the micro business face, with a standard
deviation of 1.27 that means that the respondents‟ responses were not very close to the mean.
This means good system may or may not identifies key issues as well as root of problems that
the micro business face.
Data collection activities conducted legally with due regard to the welfare of those affected by
its results, a mean of 4.0 would mean that respondents agree that data collection activities are
conducted legally with due regard to the welfare of those affected by its results, with a standard
deviation of 1.07 that means that the respondents‟ responses not very close to the mean. This
means data collection activities were conducted legally with due regard to the welfare of those
affected by its results.
Respondents were also asked if frequently collected data enables to truck trends as well as
understand project intervention, a mean of 3.9 would mean that respondents are not sure if
frequently collected data enables to truck trends as well as understand project intervention, with
a standard deviation of 1.37 that means that the respondents‟ responses were not very close to
the mean. This means frequently collected data may or may not enables trucking of trends as
well as understand project intervention.
On the statement that data collected provides clear indicators against which the organization
work is being measured, a mean of 4.5 would mean that respondents agree that data collected
provides clear indicators against which the organization work is being measured, with a
standard deviation of 0.6 that means that the respondents‟ responses are very close to the mean.

72
This means that data collected provides clear indicators against which the organization work is
being measured.
On the statement that organization carries out periodic data audits, a mean of 3.5 would mean
that respondents are not sureif organization carries out periodic data audits with a standard
deviation of 1.2 that means that the respondents‟ responses are were not very close to the mean.
This means that participants are not sure if the organization carries out periodic data audits.
Another question sought to know if All staff get feedback after measurement of project
activities, a mean of 3.5 would mean that respondents are not sureif all staff get feedback after
measurement of project activities, with a standard deviation of 1.2 that means that the
respondents‟ responses are not very close to the mean. This means that participants are not sure
if all staff get feedback after measurement of project activities.
All the above were issues that come along as a result M&E management and lack of budget
“when I came in good systems were in place, data collected and analyzed regularly and findings
shared, but data was not utilized exhaustibly, based on budget availability. This has led to us
insisting for the introduction of M&E budget, which was considered, and budget allocated. This
will now boost our operation and use of the findings.”. the M&E manager. Based on this, proper
systems will not be fruitful enough without budgets put in place, M&E need to be financially
stable for it to be able to deliver and use information available for project improvements.
From these finding I can conclude that data collection activities are conducted legally with due
regard to the welfare of those affected by its results and the data collected provides clear
indicators against which the organization work is being measured. This shows that data
collection and the use of finding are the biggest influences of microbusiness and saving

73
performance, but the organization needs to have a clear way to share feedback to all staff,
conduct data frequently and make sure people understand the M&E systems put in place.
4.6 Influence of Monitoring and Evaluation Systems on Performance of Human Capacity
One of the study objectives was to assess the influence of monitoring and evaluation systems on
human capacity. Different variables were therefore used and guided by the five-point Likert
scale whose results are shown in Table4.33.
Table1.31: BOMA monitoring and evaluation Need influence on human capacity.
Frequency Mean Standard
Deviation
The organization has got
ways to establish skills
that personnel need to
gather information on the
performance of Micro
business and savings and
lending schemes
Strongly Disagree 1 3.8
1.33
Disagree 1
Not sure 1
Agree 3
Strongly Agree 4
Grand Total 10
The organization has got
systems to equip skills to
personnel to adequately
analyse data
Strongly Disagree 1 3.7
1.27
Disagree 1
Not sure 1
Agree 4
Strongly Agree 3
Grand Total 10
Analysis of micro
business data helps m&e
officers gather
information on micro -
business trends to
sufficiently advice the
programme
Strong disagree 0 4.1
0.94
Disagree 1
Not sure 1
Agree 4
Strongly Agree 4
Grand Total 10
Result-based performance Strong disagree 0 3.9 0.94
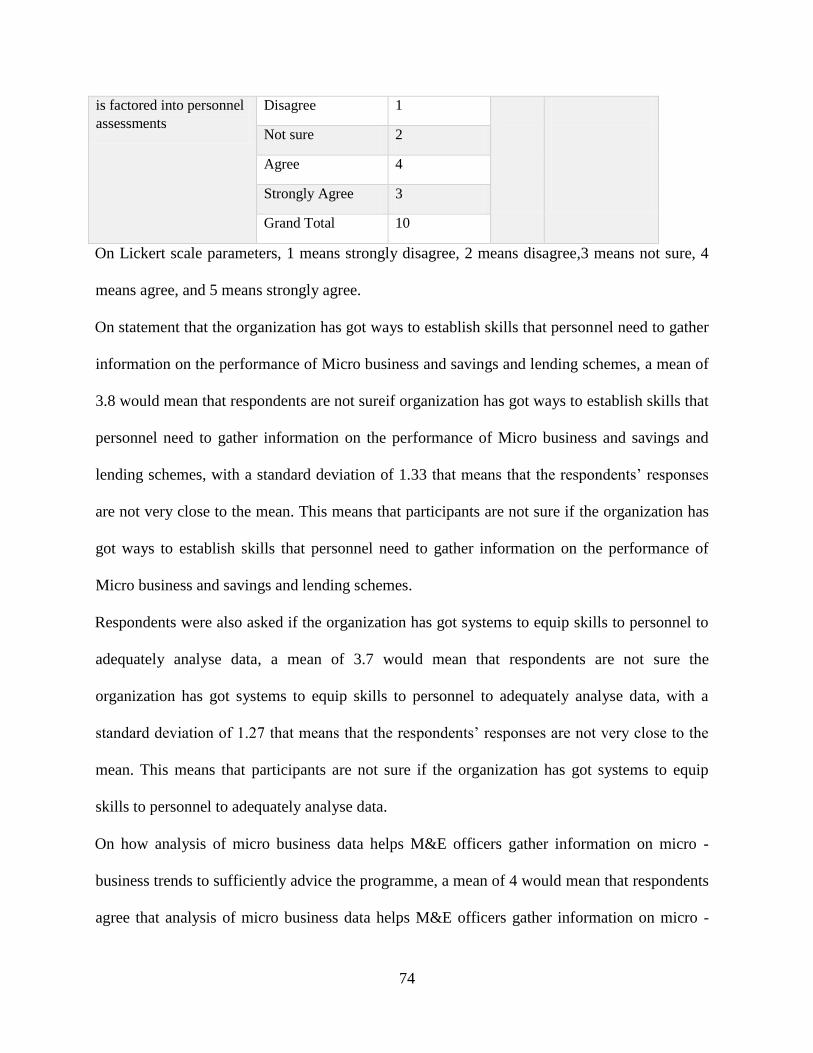
74
is factored into personnel
assessments
Disagree 1
Not sure 2
Agree 4
Strongly Agree 3
Grand Total 10
On Lickert scale parameters, 1 means strongly disagree, 2 means disagree,3 means not sure, 4
means agree, and 5 means strongly agree.
On statement that the organization has got ways to establish skills that personnel need to gather
information on the performance of Micro business and savings and lending schemes, a mean of
3.8 would mean that respondents are not sureif organization has got ways to establish skills that
personnel need to gather information on the performance of Micro business and savings and
lending schemes, with a standard deviation of 1.33 that means that the respondents‟ responses
are not very close to the mean. This means that participants are not sure if the organization has
got ways to establish skills that personnel need to gather information on the performance of
Micro business and savings and lending schemes.
Respondents were also asked if the organization has got systems to equip skills to personnel to
adequately analyse data, a mean of 3.7 would mean that respondents are not sure the
organization has got systems to equip skills to personnel to adequately analyse data, with a
standard deviation of 1.27 that means that the respondents‟ responses are not very close to the
mean. This means that participants are not sure if the organization has got systems to equip
skills to personnel to adequately analyse data.
On how analysis of micro business data helps M&E officers gather information on micro -
business trends to sufficiently advice the programme, a mean of 4 would mean that respondents
agree that analysis of micro business data helps M&E officers gather information on micro -

75
business trends to sufficiently advice the programme, with a standard deviation of 0.94 that
means that the respondents‟ responses are very close to the mean. This means that analysis of
micro business data helps M&E officers gather information on micro -business trends to
sufficiently advice the programme.
Asked about the statement that result-based performance is factored into personnel assessments,
a mean of 3.9 would mean that respondents are not sure result-based performance is factored
into personnel assessments, with a standard deviation of 0.94 that means that the respondents‟
responses are very close to the mean. This means that result-based performance may or may not
be factored into personnel assessments. This was confirmed in Naimarei by the area mentor
who stated in an FGD that “ I have never been recognized by my work, the only time I am
referred to, is when there is a mistake in my data or when the supervisor wants to use me as a
bad example, despite my good work in the field -my area has always been preferred for donors
visit because, the businesses I mentor are doing amazingly compared to other locations. The
rest of the time I am just there not knowing what is happening?” This shows that despite the
mentors amazing work, the supervisors are picking only the negative part, and this might
discourage the staffs in the long run.
It can now be concluded that data analysis on micro businesses helped M&E officers gather
sufficient data to advice the programme, but the organization needs to be clear on how
personnel assessments are done and also establish clear systems and ways to equip skills to
personnel to adequately analyze data. Also as noted earlier by the M&E team, good systems are
in place but, budget was a major issue that affected most of the M&E operations and the fact
that M&E previously was incorporated into the programme lost its relevance, but this was

76
realized in time and corrected. For better results M&E need to be proactive and independent so
that it can properly advice the programme for informed decision-making process.
Table1.32:ReliabilityStatistics
Cronbach's Alpha N of Items
.972803707
20
Reliability test was carried out to check the consistency of results amongst the
respondents using the Cronbach Alpha statistic. As the results are shown in Table35
above, the value of 0.973 was greater than the recommended 0.7, implying that
97.3% of the study finding/result was reliable.
4.7 Discussion of Findings
Findings on influence of monitoring and evaluation on the performance on BOMA supported
project reveals that BOMA has an Internal organ to oversee M&E function among the BOMA
beneficiaries, which collects, clean and analyze data on a regular basis. The department has
enough resources, although budget was only recently introduced and the persons working with
the department filled overwhelm with work, which is something that BOMA need to look at.
The unit has got work plans put in place, which defines the goals, indicators, data collection
methods and timelines. The roles are defined and plans for reports disseminations are all put in
place. The data is collected from both primary and secondary sources. Findings shows that,
BOMA understands what data each party needs for their operations. This has allowed them to
focus more clearly on the data they will use. As supported by Gebremedhin et al. (2010), the
organization has been able to document, share findings, advice the programme and incorporates
lessons, through utilization of data from a variety of sources (for validation purposes). BOMA

77
also tracks what happened between specific measurement intervals and seek timely solutions to
existing issues. In reality, the situation is not the same for all the NGOs, a study of monitoring,
evaluation and learning system on comic relief by Sam Mcpherson indicated that not all Non-
Governmental Organisation (NGO) explicitly link their Monitoring, Evaluation and Learning
(MEL) systems and their requirement in the aid chain. If they were to do this, it would support
them to think more systematically about the differing roles of commissioning, intermediate and
implementing NGOs with regards to MEL, and how MEL can be designed to help them
evaluate how well they are playing their specific role. Some NGOs projects may not be as
effective as we perceive, from little professional skills of the staff, lack of accountability of
NGOs to the grassroots, lack of well-placed strategic planning and adoption of poorly
developed M&E. (ISNAR, 2001).
In practice knowledge and skills is acquired while undertaking the job through concrete
experience. (UNDP, 1998). BOMA M&E unit has been tasked with the role to capacity build the
staffs. According to Hughues and Gibbs et al., (2002), for M&E to be adopted staff need some
unique and definite skills expertise. From the study most of the BOMA M&E personnel‟s, had
had a prior M&E experiences of between 5 to 10 years before joining BOMA. Those who joined
without any experience had to learnt on the job giving them experience of more than 5 years. The
personnel also confirmed that frequent capacity building trainings were organized by the
organization to build their skills and keep them up to date with changing M&E dynamics, but
due to the recent Covid pandemic nothing much was done. On the other hand, most NGOs, lack
the ability to get skilled personnel and this indicates that the areas which require these skills are
not undertaken. Gilliam et al., (2003) also observe that deficiency of quality data leads to making

78
decisions which are baseless and solely centered on perception not tangible data which is
resulted by insufficient M&E knowledge and skills.
As recommended, by Kelly and Magongo (2004) that there should be an individual who is solely
responsible for the M&E as a main task. BOMA has put this into practice, through its routine
programme monitoring. Mentors have been tasked to collects both qualitative and quantitative
data on a monthly basis. Also, the data is cleaned, and feedback sought from the field teams on
the trends observed. Programme strengths and weakness are shared with the management for
decision making, lesson learnt are documented for future use and recommendations shared for
incorporation into the programme regularly (monthly). The unit lack an M&E policy which calls
for the organization to work on it.
Research shows that many organisations, see project monitoring and evaluation activity as a
donor requirement rather than a management tool (Babbie & Mouton, 2006). For this reason,
organisations especially Non- Govermental Organisations (NGOs), implement project M&E
just to cope with demands and pressures from funding agencies rather than as a measure to
contribute to project performance (Kusek & Rist, 2004). Only a few organisations have faith in
M&E partly because its influence on project performance is not well understood despite many
studies having been done (Khan, 2001; Ogula, 2002; Kusek & Rist, 2004; Nyonje, Ndunge, &
Mulwa, 2012).
79
CHAPTER FIVE
SUMMARY, CONCLUSIONS AND RECOMMENDATIONS
5.1 Introduction
The study examined the influence of monitoring and evaluation systems on BOMA supported
micro-business, savings, and lending scheme performance. The study set out to determine how
performance of monitoring and evaluation influenced the performance of micro-businesses; to
assess how monitoring and evaluation systems influences human capacity building; to examine
how data quality influenced the performance of micro-business, savings, and lending‟s scheme.
This chapter, therefore, presents and discusses the summary of findings, conclusion, and
recommendations and gives suggestions for further research.
5.2 Summary of Findings
The purpose of this study was to establish the influence of monitoring and evaluation systems
on BOMA supported micro-business, savings, and lending scheme performance. The research
objectives were used to guide the collection of required data from the respondents.
5.2.1Influence of M&E structure on BOMA supported micro-business, savings, and
lending scheme performance.
There was an upward in business activities for both participants and beneficiaries, but the
increase was more with beneficiaries. The increase among beneficiaries as attributed to the
spillover effect as a result of BOMA presence in the locality motivating people to engage in
income generating activities as a result of seeing their families or neighbors who have benefited
from the BOMA. As narrated by a respondent in Namarei during an FGD discussion, that she
started her business as a result of her sister, who was supported by BOMA. Beneficiaries are
generally satisfied with, project performance, resources availability, all activities promised
were implemented and the Project activities were delivered on time. Through BOMA well-

80
defined indicators, assessments, measure micro businesses and savings and lending schemes,
progress towards desired goals. Respondents are not sure about top management attitude
towards strengthening monitoring and evaluation systems to enhance the performance of
BOMA supported micro-business, savings, and lending scheme performance. This was further
confirmed by the M&E personnel during their interviews.
5.2.2 Influence of Data Quality on The Performance on BOMA Supported Micro-Business,
Savings, and Lending Scheme Performance.
Findings shows that data collection and its use are the biggest influences of microbusiness and
saving performance. BOMA collects data regularly. Data collection activities are conducted
legally with due regard to the welfare of those affected by its results and the data collected
provides clear indicators against which the organization work is being measured. BOMA
conducts assessments and with well-defined indicators of measuring micro businesses and
savings and lending schemes progress towards desired goals. M&E functions seems to lack a
champion, thus M&E systems put in place seems not clearly understood by everyone. Its
capacity to commission valuation is also in doubt. Feedback from findings seem not to reach
everyone.
5.2.3 Influence of Monitoring and Evaluation Systems on Human Capacity Performance
Findings reveal that analysis of micro business data helps M&E officers gather information on
micro-business trends to sufficiently advice the programme but it‟s not clear if the organization
has got systems to equip skills to personnel to gather and adequately analyse data. Respondents
are not also sure if result-based performance is factored into personnel assessments.
81
5.3 Conclusion
5.3.1 Influence of M&E on BOMA Supported Micro-business, Savings and Lending
Scheme Performance
Almost all development organizations are expected to have systems that enable them to collect,
analyze, summarize, and use information. With M&E systems in place, lessons and
recommendations can be drawn. This means that M&E systems play a key role in influencing
project delivery. Although Management attitude towards strengthening monitoring and
evaluation systems is not very clear in BOMA. BOMA have indicators to measure progress
towards desired goals. Beneficiaries are satisfied with, project performance, resources
availability, activities implementation and the delivery time. Finding show that BOMA
Beneficiaries have grown their business, income, food security, assets and confidence to borrow
and repay loans overtime compared to non -beneficiaries. BOMA projects has capacity built,
their participants through trainings, to document their day to day activities for sustainability and
resilience purposes.
5.3.2 Influence of Data Quality on The Performance on BOMA Supported Micro-Business,
Savings, and Lending Scheme Performance
Routine programme monitoring is also done by mentors who collects both qualitative and
quantitative data on a monthly basis. The data cleaning is done, and feedback sought from the
field teams on the trends observed. Programme strengths and weakness are shared with the
management for decision making, lesson learnt documented for future use and recommendations
shared for incorporation into the programme. BOMA through its data, can clearly tell the
progress of their micro-businesses and saving and lending schemes. BOMA M&E uses data to
advice the programme, but it‟s not clear whether systems exist to identify gaps in personnel skills
and whether personnel performance assessment is result based.

82
5.3.3 Influence of Monitoring and Evaluation Systems on Human Capacity Performance
The unit has work plans put in place, which defines the goals, indicators, data collection methods
and timelines. The roles are defined and plans for reports disseminations are all put in place. On
the other hand, BOMA, seems to lack an M&E champion, with a capacity to commission
valuation. Interview from M&E personnel confirms issues with budgeting, the budget was only
recently introduced and the persons working with the department filled overwhelm with work,
which is something that BOMA need to look at. This has affected decision making, and sharing
of assessments findings to all relevant person, which is something that BOMA needs to work on
5.4 Recommendations
The following are recommendations based on the findings of the study:
5.4.1 Influence of M&E on the Performance of Monitoring and Evaluation Systems of
Boma
BOMA Management should take active part in designing M&E system and offer timely support
and guidance to projects‟ staff and ensure M&E activities are well executed and results and
findings communicated and used in decision making and planning.
5.4.2 Influence of Data Quality on the Performance on BOMA Supported Micro-Business,
Savings and Lending Scheme Performance
M&E functions should be looked upon as a collective responsibility in the organization,
particularly, when a separate section or person is assigned to the job to avoid internal conflict. It
would help to create a culture of conscious monitoring and evaluation, information sharing,
seeking internal assistance in case of problem and most of all, sharing credit for success and
responsibility for failure. BOMA also need to commission its valuations and share its findings to
all relevant persons for better and timely decisions.

83
5.4.2 Influence of Monitoring and Evaluation Systems on Human Capacity Performance
BOMA needs to factor in a result-based, performance assessment on its personnel, put systems in
place to identify skill gaps and to equip them with skills to gather and adequately analyse data.
5.5 Suggestions for Further Research
This study reveals many interesting areas where further research can be carried out. In
particular, the following can be considered:
1. Monitoring and evaluation the design, implementation and maintenance of an
M&E system.
2. Monitoring and evaluation strategies in Non Governmental Organisations..

84
REFERENCES Acevedo, G. L. Rivera, K. Lima., L. Hwang., H. (2010). Challenges in Monitoring and
Evaluation: An Opportunity to Institutionalize M &E Systems. Fifth Conference of
The Latin America and The Caribbean Monitoring and Evaluation Network.
Washington Dc, World Bank.
Anyango, E., Esipisu, E., Opoku, L., Johnson, S., Malkamaki, M. & Musoke, C., 2007. Village
Savings and Loan Associations - experience from Zanzibar. Small Enterprise
Development, 18(1), pp. 11-24.
Annan, J., Bundervoet, T., Seban, J. and Costigan, J., 2013. A Randomized Impact Evaluation of
Village Savings and Loans and Family-Based Associations Interventions in Burundi.
International Rescue Committee
Askari, G. R. (2011). Factors Influencing Effective Implementation of Monitoring and
Evaluation Practices in Donor Funded Projects in Kenya: A Case of Turkana District.
Unpublished MBA Research Project, Kenyatta University, 2011.
Bakewell, O. Garbutt, A. (2005). The Use and Abuse of The Logical Framework Approach. The
International Ngo Training and Research Centre (INTRAC). Retrieved from
Http://Www.Intrac.Org/Data/Files/Resources/518/The_Use_And_Abuse_Of_The_Lo
gical_Framework_Approach.Pdf
Ballard et al. (2010). Management of Behavioral and Psychological Symptoms in People
ProjectsManagement.ttps://www.nhqualitycampaign.org/files/CliveBallardPresen
tation.pdf
BARA and IPA, 2013. Final impact evaluation of the saving for change program in Mali, 2009-
2012. Oxfam America.
Barton, Tom. (1997, January). Guidelines to Monitoring and Evaluation: How Are We Doing?
Care, Uganda.
Bermudez, L. and Matuszeski, J., 2010. Ensuring continued success. Saving for change in older
program areas in Mali. Oxfam America.
BOMA Project. (2018). A Call to Action. Retrieved from Https://Bomaproject.Org/Wp-
Content/Uploads/2018/06/2017-BOMA-Annual-Report.Pdf
BOMA Project. (2018). BOMA Project 2018 Annual Report; Changing What Is Possible.
Retrieved from Https://Bomaproject.Org/Wp-Content/Uploads/2019/03/BOMA-
Project-2018-Annual-Report.Pdf
BOMA Project. (2019). The Results Are In! Midline Evaluation of BOMA‟s Pilot with The
Government of Kenya‟s Profit. Retrieved From
Https://Bomaproject.Org/2019/02/13/The-Results-Are-In-Midline-Evaluation-Of-
Bomas-Pilot-With-The-Government-Of-Kenyas-Profit/

85
Bornstein, L. (2006). Systems of Accountability, Webs of Deceit? Monitoring and Evaluation in
South African Ngos. Development, 49(2), 52-61. Doi:
10.1057/Palgrave.Development.1100261.
Brac (2017, April 22). Brac‟s Ultra-Poor Graduation Programme; An End to Extreme Poverty In
Our Lifetime. Retrieved from Https://Www.Un.Org/Development/Desa/Dspd/Wp-
Content/Uploads/Sites/22/2017/04/Lamia-Rashid-Brac-Ultrapoor-Graduation-Paper-
For-Un-Expert-Group-Meeting-May-2017-25apr17.Pdf
Brest, P. (2010). The Power of Theories of Change. Stanford Innovation Review.
British Oncology Pharmacy Association. (2006). BOPA bulletin. Birmingham: Pharmacy
Publishing Co., on behalf of BOPA.
Care (2012, March). A Guide to Monitoring and Evaluation for Result Based: Care Program
South Sudan, Juba.
Chaplowe, S. G. (2008). Monitoring and Evaluation Planning: Guiding Tools. USA: Catholic
Relief Services and American Red Cross.
Chaplowe, Scott G. (2008). Monitoring & Evaluation Planning: American Red Cross/Crs
Chesos R. (2010). Automated M&E System for NGOs, The Coordinator, Issue No. 5, P. 1.
Retrieved
Http://Www.Ngobureau.Or.Ke/Publications/Board%20newsletter%20%28issue%20n
o.%205 29. Pdf
Chesos R. (2010). Automated M&E System for Ngos. The Coordinator, Issue No. 5, P. 1.
Cheung, S.-O.; Suen, H. C. H.; Cheung, K. K. W. 2004. PPMS: a Web-based construction
project performance monitoring system, Automation in Construction 13: 361–376.
Clark, H. Taplin, D. (2012). Theory of Change Basics: A Primer on Theory of Change, New
York: Acknowledge
Clark, T. S. Kastellec. J. P. (2012). The Supreme Court and Percolation in The Lower Courts:
An Optimal Stopping Model. The Journal of Politics, Vol. 75, No. 1, January 2013,
Pp. 150– 168
Clear Mid Term Evaluation (2014). Final Evaluation Report. Universalia Management Group,
E-Pact,Oxford Policy. Itad
Cooper, D. R., & Chindler, P. S. (2008). Business Research Methods. London: Mcgraw Hill
Crawford, P., & Bryce, P. (2003). Project Monitoring and Evaluation: A Method For
Enhancing The Efficiency And Effectiveness Of Aid Project Implementation.
International Journal of Project Management, 21(5), 363-373.
Cornielje, H. Velema, J. P. Finkenkelflugel, H. (2008). Community Based Rehabilitation
Programmes: Monitoring and Evaluation in Order to Measure Results. Leprosy
86
Review DAI, 2010. Group Savings and Loans Associations Impact Study. FSD
Kenya. 9.
Degnn, E. (2018). 15 Facts About Poverty in Africa That Everyone Should Know. Retrieved
from Https://Borgenproject.Org/15-Facts-About-Poverty-In-Africa/
DISSANAYAKA, S.M. and KUMARASWAMY, M.M. (1999), "Evaluation of factors affecting
time and cost performance in Hong Kong building projects", Engineering,
Construction and Architectural Management, Vol. 6 No. 3, pp. 287-298.
https://doi.org/10.1108/eb021119
Edmunds, R. Marchant, T. (2008). Official Statistics and Monitoring and Evaluation Systems In
Developing Countries: Friends Or Foes? Partnership In Statistics For Development In
The 21st Century. Oecd‟s Development Co-Operation Directorate, The Paris21
Secretariat, France. Http://Www.Paris21.Org/Sites/Default/Files/3638.Pdf
Elliott H., (2014). An ethnographic study of local institutionalisation of Savings Groups in
Malanga, Coast Region. FSD Insights – Issue 8, October 2014.
Economic Strengthening for Vulnerable Populations. (2014, July). Protection: Savings Groups,
Retrieved from http://theliftproject.org/wp-content/uploads/2014/07/2.3-Prot-
SG_ME_Final.pdf
Fahey, A& Loiseau, J, (2018).Ending Extreme Poverty: New Evidence on The Graduation
Approach. Retrieved from Https://Www.Cgap.Org/Blog/Ending-Extreme-Poverty-
New-Evidence-Graduation-Approach
Frankel, Nina & Gage, N. (2007). “M&E Fundamentals: A Self-Guided Minicourse.” United
States Agency for International Development (USAID), Washington, Dc.
Http://Www.Cpc.Unc.Edu/Measure/Publications/Pdf/Ms-07-20.Pdf.
GAO (2012), Annual Report: Opportunities to Reduce Duplication, Overlap and Fragmentation,
Achieve Savings, and Enhance Revenue, Report to Congressional Addressees,
Washington DC
Gebremedhin, B. Getachew, A. Amha, R. (2010). Results Based Monitoring and Evaluation For
Organizations Working In Agricultural Development: A Guide For Practitioners.
International Livestock Research Institute, Nairobi, Kenya.
Gilliam A, Barrington T, Davis D, Lascon R, Uhi G & Phoenix U. 2003: Building evaluation
capacity for HIV prevention programs. Evaluation and Program Planning. 26(2)
Golafshani, N. (2003). Understanding Reliability and Validity in Qualitative Research. The
Qualitative Report, 8(4), 597-606. Government of Republic of Kenya, (2007). Kenya
Vision 2030, The Popular Version, Ministry of Planning And National Development.
Gorgens, M. Kusek, J.Z. (2010). Making Monitoring and Evaluation Systems Work: A Capacity
Development Toolkit. The International Bank for Reconstruction and Development.
The World Bank Washington D.C 1818 H Street, Nw.

87
Http://Wwwwds.Worldbank.Org/External/Default/Wdscontentserver/Wdsp/Ib/2010/0
3/05/000333037_20100305004732/Rendered/Pdf/533030pub0moni101official0use0o
nly1.Pdf
Guijt, I. (1999). Participatory Monitoring and Evaluation for Natural Resource Management and
Research. Socio-Economic Methodologies for Natural Resources Research. Chatham,
Natural Resources Institute, Uk:
Hailey, J. James, R. (2003, November). Ngo Capacity Building: The Challenge of Impact
Assessment. Paper Presented to The New Directions in Impact Assessment For
Development Methods & Practice Conference. IDPM University of Manchester.
HSNP. (2019). HSNP Delivers Second Tranche For 2018/19 Year. Retrieved from
Https://Www.HSNP.Or.Ke/Index.Php/Latest-Testing/158-HSNP-Delivers-Second-
Tranche-For-2018-19-Year
Hunter, J. (2009). Monitoring and Evaluation: Are We Making A Difference? Namibia Institute
for Democracy John Meinert Printing, Windhoek, Namibia,
Integrated Smart Survey Marsabit County Kenya, (2018). Smart Survey Final Report Conducted
in The Laisamis And Northhorr Survey Zones: Marsabit County. Retrieved from
Http://Www.Nutritionhealth.Or.Ke/Wp-Http://Www.Nutritionhealth.Or.Ke/Wp-
Content/Uploads/Smart%20survey%20reports/Marsabit%20county%20smart%20sur
vey%20report%20-%20july%202018.Pdf
Iyer, K. C.; Jha, K. N. 2005. Factors affecting cost performance: evidence from Indian
construction projects, International Journal of Project Management 23: 283–295.
J Nichols Adams Et Al. (2018). Lectionaid 4th Quarter 2018. Retrieved from
Http://Www.Lectionaid.Com/18-4/4qg.Htmlligami, C. (2018). Population Growth
Rate Is Holding Africa Down – Report. Retrieved from
Https://Www.Theeastafrican.Co.Ke/Scienceandhealth/Population-Growth-Rate-Is-
Holding-Africa-Down/3073694-4780716-10wfq3gz/Index.Html
Jacobs, A. Barnett, C. Ponsford, R. (2010). Three Approaches to Monitoring: Feedback Systems,
Participatory Monitoring and Evaluation and Logical Frameworks. Institute of
Development Studies, 41(6), 36-44
James, F.L., Beatrice, L. R., Kristin, M. H., Thomas, S, & Lisa, T. (1999). Monitoring and
Evaluation: A Guidebook for Nutrition Project Managers in Developing Countries.
International Food and Nutrition Center
Jaszczolt K., Potkanski T., Stanislaw A. (2010). Internal Project M&E System and Development
of Evaluation Capacity-Experience of The World Bank – Funded Rural Development
Program World Bank.

88
Jaszczolt, K., Potkanski, T., & Stanislaw, A. (2010). Internal Project M&E System and
Development of Evaluation Capacity – Experience Of The World Bank – Funded
Rural Development Program. World Bank
Jha, Abhas K.; Barenstein, J. D. Phelps, P. M.; Pittet, D. Sena, S. (2010). Safer Homes, Stronger
Communities: A Handbook for Reconstructing After Natural Disasters (Pp. 269-284).
World Bank.
Jody Zall Kusek, R. C. (2004). Ten Steps to A Result-Based Monitoring and Evaluation
Systems. Washington Dc: World Bank.
Kelly, K., & Magongo, B. (2004). Report on Assessment of The Monitoring And Evaluation
Capacity Of HIV/Aids Organizations In Swaziland. National Emergency Response
Council On HIV/Aids.
Kelly, L., David, R., & Roche, C. (2008, December). Guidance On M&E for Civil Society
Programs. Prepared for Aus Aid Program Managers.
Khan, K. (2003). Strengthening of Monitoring and Evaluation Systems. Pakistan Poverty
Alleviation Fund, Islambad. Http://Preval.Org/Files/B10.1.Pdf
Kimenyi, S. M. (2005). Efficiency and Efficacy of Kenya's Constituency Development Fund.
Theory and Evidence. University of Connecticut, U.S.A.
Koffi-Tessio B. (2002), Efficacy and Efficiency of Monitoring-Evaluation (MES) For Projects
Financed By The Bank Group, African Development Bank Group
Koffi-Tessio B. (2002). Efficacy and Efficiency of Monitoring-Evaluation (MES) For Projects
Financed by The Bank Group. African Development Bank Group.
Kombo, D. K. & Tromp, D. L. A. (2006). Proposal and Thesis Writing: An Introduction.
Pauline‟S Publications‟ Africa, Nairobi.
Kothari C.R (2014), Research Methodology, Methods and Techniques (Second Revised Edition),
New Delhi: New Age International Publishers.
Ksoll, C., Lilleør, H.B., Lønborg, H.J., & Rasmussen, O.D. (2013). Impact of Village Savings
and Loans Associations: Evidence from a Cluster Randomized Trial. Study Paper No.
56. Copenhagen: Rockwool Foundation Research Unit.
Kusek, J. Z., & Rist, C. R. (2004). Ten Steps to A Results-Based Monitoring and Evaluation
System. Washington Dc, World Bank.
Kusek, Jody Zall & Rist, Ray C. (2004). A Handbook for Development Practitioners: The Steps
to A Result-Based Monitoring and Evaluation System. The World Bank, Washington,
D.C
Lahey, R. (2009). Monitoring and Evaluation in The Government of Canada, „‟Lessons Learned.
From 30 Years Of M&E Development. Accessed On 5/5/2013 From

89
Http://Siteresources.Worldbank.Org/Intlacregtoappovana/Resources/Paper_Robert_L
ahey.P Df
Ligami, C. (2018). Population Growth Rate Is Holding Africa Down – Report. Retrieved from
Https://Www.Theeastafrican.Co.Ke/Scienceandhealth/Population-Growth-Rate-Is-
Holding-Africa-Down/3073694-4780716-10wfq3gz/Index.Html
M&E Module Series. American Red Cross and Catholic Relief Services (Crs), Washington, Dc
and Baltimore, Md.
Mackay, (2007). How to Build M&E Systems to Support Better Government. Washington Dc:
World Bank
Mackay, K. (2006). Institutionalization of Monitoring and Evaluation Systems to Public Sector
Management. Independent Evaluation Group, Evaluation Capacity Development
Working Paper Series No. 15
Mackay, K. (2007). How to Build M&E System to Support Better Government. Washington Dc,
World Bank
Mackay, K. (2010). The Nuts & Bolts Of M&E Systems. Washington, D.C. The World Bank
Marsabit County (2018). Smart Survey Final Report Conducted in The Laisamis And North Horr
Survey Zones: Marsabit County. http://www.nutritionhealth.or.ke/wp-
content/uploads/SMART%20Survey%20Reports/Marsabit%20County%20SMART%
20Survey%20Report%20-%20February%202018.pdf
Mayne, J. (2007). Best Practices in Results-Based Management: A Review Of Experience, A
Report For The United Nations Secretariat, Volume1: Main Report. UN Workshop on
Best Practices in Results-Based Management in Geneva.
Mebrahtu, E., Pratt, B., &Lönnqvist, L. (2007). Rethinking monitoring and evaluation:
challenges and prospects in the changing global aid environment. INTRAC.
Mmartinez, D. (2011). The Logical Framework Approach in Non-Governmental Organizations.
University of Alberta. Elsevier.Conference-Serices.Net/Resources/ Cpa2011.
0514.Paper. Pdf
Mohamed Athman Ali, W. (2018). Comparing Objective and Subjective Measures: A Case
Study of The Impact Of The BOMA Project Of Marsabit Communities Out Of
Extreme Poverty. Marsabit, Kenya. Maseno University.
Morra, L. G. I. Rist, R. C. (2009). The Road to Results: Designing and Conducting Effective
Development Evaluations, World Bank, Washington D. C.
Mugenda, O. M & Mugenda, A.G. (2003). Research Method: Qualitative and Quantitative
Approaches. Nairobi African Centre for Technology Studies
Mugenda, O. M & Mugenda, A.G. (2013). Research Method: Qualitative and Quantitative
Approaches. Nairobi African Centre for Technology Studies.

90
Mugenda, O., & Mugenda, A. (2003). Research Methods: Quantitative and Qualitative
Approaches. Nairobi, Kenya: African Centre for Technology Studies. Poverty
Eradication Commission Report, (2009). Report of Poverty in Kenya:
Munene, F, Mativo, A & Leokoe,T. (2018). Smart Survey Final Report Conducted in The
Laisamis And Northhorr Survey Zones: Marsabit County. Retrieved from
Http://Www.Nutritionhealth.Or.Ke/Wp-Http://Www.Nutritionhealth.Or.Ke/Wp-
Content/Uploads/Smart%20survey%20reports/Marsabit%20county%20smart%20sur
vey%20report%20-%20july%202018.Pdf
Nabris, K. (2002). Monitoring and Evaluation, Civil Society Empowerment, Jerusalem, Passia.
Nabris, K. (2002). Monitoring and Evaluation, Palestinian Academic Society For The Study Of
International Affairs (Passia)
NAO (2020). Local audit in England Code of Audit Practice. Draft Code of Audit Practice:
Consultation response. London: National Audit Office.
Ochieng, A. (2018, June 28). Kenya 8th On Extreme Poverty List. Retrieved from
Https://Www.Businessdailyafrica.Com/Economy/Kenya-8th-On-Extreme-Poverty-
List/3946234-4635310-79pa9rz/Index.Html
Orodho A. J. (2004). Technologies of Writing Research Proposals and Report in Education and
Social Science, Masola Publishers, Reata Prince. S. Nairobi
Odhiambo K.T. (2000) Key challenges for monitoring and evaluation practice in Africa. Nairobi,
Kenya: Ekon publishing
Patton, M. (2008). Developmental Evaluation: Applying Complexity Concepts to Enhance
Innovation and Use. New York, Ny: The Guilford Press, 2008.
Patton, M. (2008). State of The Art in Measuring Development Assistance „. Address to The
World Bank Independent Evaluation Group, 10 April, Washington, Dc
Patton, M. Q. (2008). Utilization Focused Evaluation (UFE). Utilization-Focused Evaluation for
Agricultural Innovation. Rome: International Labor Accreditation Cooperation (Ilo)
Brief No. 22, Ilac.
Republic of Kenya. (2000). Interim Poverty Strategy Paper 2000-2003. Retrieved from
Https://Www.Imf.Org/External Np/Prsp/2000/Ken/01/Index.Htm.
Republic of Kenya. (2011). Vision 2030. Retrieved From Www.Tvetcdaac.Go.Ke/Wp-Content
/Uploads/2019/1o/2030-Vision 2030.Pdf.
Republic of Kenya. (2014). Hunger Safety Net Programme 2 Communication Strategy for
Northern Kenya And Other Arid Lands. Retrieved from Www.Adaconsortium.
Org/Images/Publications/Vision 2030.Pdf.
Rist, R. C. Boily M. H. Martin F. (2011). Influencing Change: Building Evaluation Capacity to
Strengthen Governance. Washington Dc, World Bank

91
Robert, L. (2010). The Canadian M&E System: Lessons Learned From 30 Years of
Development. World Bank, Washington, Dc.
Sekaran, U. (2010). Research Method of Business: A Skill Building Approach (7th Edition).
New York, Ny: John Willey &Sons, Inc.
Shapiro, J. (2011). Monitoring and Evaluation Approaches. Johannesburg. S.A.: Civics. Sida
Report, (2014). Final Evaluation of The National Integrated Monitoring and
Evaluation System (Nimes) Capacity Development Project (CDP)
Http://Www.Sida.Se/Publications-Swedish International Development Cooperation
Agency- Report on The Nimes Situational Analysis and Needs Assessment; Sida
2014. Silverman, D. (2010). Qualitative Research. Sage Publishers.
Sharpiro, J. (2011). Monitoring and Evaluation, Civicus, Retrieved
Https://Civicus.Org/View/Medimonitoring%20and%20evaluation.Pdf
Taut, S. (2007). Studying Self-Evaluation Capacity Building in A Large International
Development Organization. American Journal of Evaluation, 28; 45 Doi:
10.1177/1098214006296430
The East African. (2019, December 24). Kenya's Arid Counties to Benefit From $3.4m Food Aid
from Us. Retrieved from Https://Www.Theeastafrican.Co.Ke/News/Ea/Kenya-
Receives-Food-Aid-From-Us/4552908-5397042-Q20qwqz/Index.Html
The World Bank. (2019). Poverty. Retrieved From
Https://Www.Worldbank.Org/En/Topic/Poverty/Overview
Unaids, (2000). A Guide to Monitoring and Evaluation. Geneva: Joint United Nations
Programme.
Unaids, (2008). A Framework for Monitoring and Evaluating HIV Prevention Programmes for
Most-At-Risk. Geneva: Who Library Cataloguing.
Unaids. (2008). Organizing Framework for A Functional National HIV Monitoring and
Evaluation System, Geneva.
UNDP, (2009). “Who Is the Question-Makers – A Participatory Evaluation Handbook”. Oesp.
United Nations. (2019). Department of Economic and Social Affairs Economic Analysis.
Retrieved from Https://Www.Un.Org/Development/Desa/Dpad/Publication/World-
Economic-Situation-And-Prospects-October-2019-Briefing-No-131/
Usaids. (2000, June), A Guide to Monitoring & Evaluation. Geneva: © Joint United Nations
Programme.
Usiad. (2019, December 19). Food Assistance Fact Sheet – Kenya. Retrieved from
Https://Www.USAID.Gov/Kenya/Food-Assistance

92
Welsh, N., Schans, M. and Dethrasaving, C. (2005). Monitoring and Evaluation Systems Manual
(M&E Principles). Publication of the Mekong Wetlands Biodiversity Conservation
and Sustainable Use Programme
World Bank, (2002). Monitoring & Evaluation: Some Tools, Methods and Approaches. The
World Bank, Washington, D.C
World Bank, (2004). Monitoring and Evaluation. Some Methods, Tools and Approaches World
Bank: Washington Dc
World bank. (2011). Conflict, Security and Development. World Development Report: Conflict,
Security and Development. The World Bank.
93
APPENDICES
Appendix I: Consent for the Respondents
You are invited to participate in a research study conducted by Mr. Jeremiah Sarunye
Lengure, from the Maseno e-learning campus in partial fulfillment of the requirements for the
award of Master of Arts degree in monitoring and evaluation, school of planning & architecture,
Maseno university. This questionnaire aims to evaluate the impact of BOMA‟s project poverty
graduation program for ultra-poor women on Ngurunit households in Marsabit county. The
questionnaire is designed to collect data that will help achieve the objectives of this study.
You were selected as a possible beneficiary in this study because of your knowledge of the
impact of poverty graduation programmes on poor people. I am kindly requesting you to
participate in this study by responding to these questions as candidly and precisely as possible.
Your honesty and co-operation in responding to the questions will highly be appreciated. All
information provided will be treated with utmost confidentiality and will be used purely for
academic purposes.
If you have any questions about the study, please feel free to contact [email protected] or
mobile 0719880626.
I would like to ask for your permission, to ask you a few questions regarding your life. This
information‟s will be confidential. Signing below indicates that you have read and understood
the information provided above, you willingly agree to participate, you may withdraw your
consent at any time and discontinue participation without penalty, that you have received this
copy, and you are not waiving any legal claims.
Signature
Date
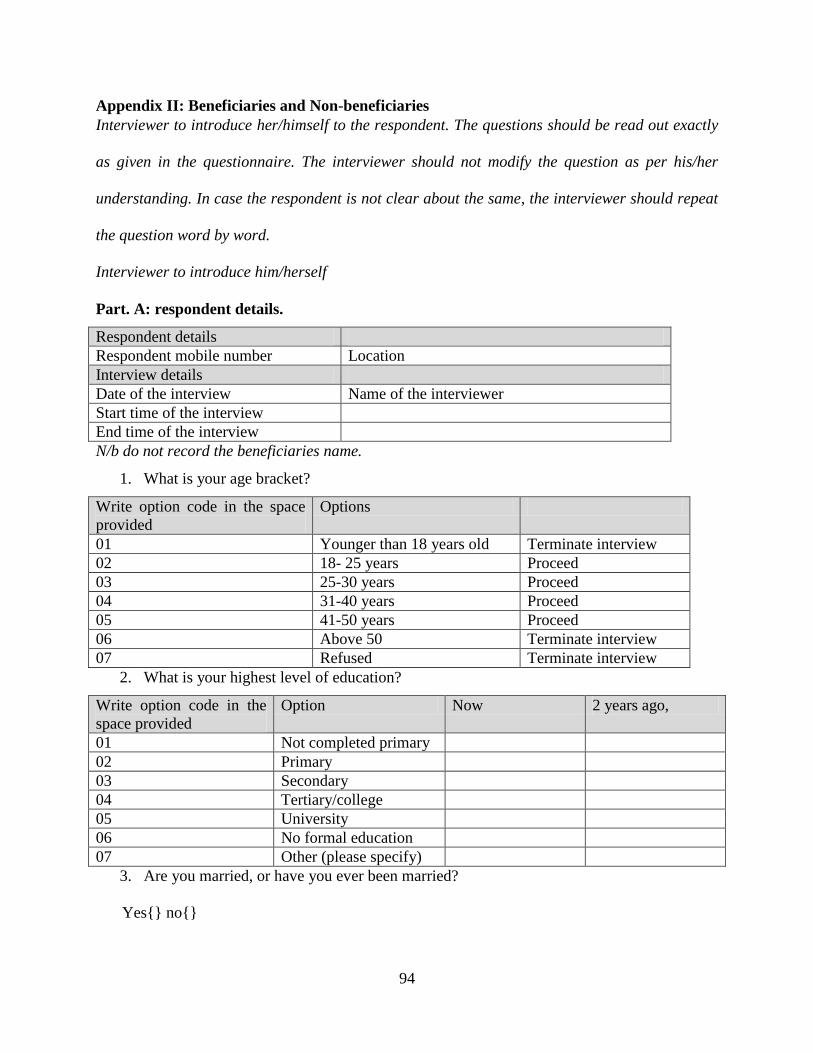
94
Appendix II: Beneficiaries and Non-beneficiaries
Interviewer to introduce her/himself to the respondent. The questions should be read out exactly
as given in the questionnaire. The interviewer should not modify the question as per his/her
understanding. In case the respondent is not clear about the same, the interviewer should repeat
the question word by word.
Interviewer to introduce him/herself
Part. A: respondent details.
Respondent details
Respondent mobile number Location
Interview details
Date of the interview Name of the interviewer
Start time of the interview
End time of the interview
N/b do not record the beneficiaries name.
1. What is your age bracket?
Write option code in the space
provided
Options
01 Younger than 18 years old Terminate interview
02 18- 25 years Proceed
03 25-30 years Proceed
04 31-40 years Proceed
05 41-50 years Proceed
06 Above 50 Terminate interview
07 Refused Terminate interview
2. What is your highest level of education?
Write option code in the
space provided
Option Now 2 years ago,
01 Not completed primary
02 Primary
03 Secondary
04 Tertiary/college
05 University
06 No formal education
07 Other (please specify)
3. Are you married, or have you ever been married?
Yes{} no{}

95
4. How many people live in your household?
a. For changes in adults an children for increase indicate with a positive for decrease
indicate with a negative.
Write option
code in the space
provided
Option Now 2 years ago, Change in
adults
Change in
children
01 Less than 5
people
02 Between 6 and 10
people
03 Between 11 and
15 people
04 More than 15
people
05 Less than 5
people
Part. B: standard of living
5. Are you employed or any member of your household?
Yes{} no{}
6. How many sources of income can your household access?
Write option code in
the space provided Option Now 2 years ago,
01 1
02 2
03 More than 3
04 N/a
7. What kind of business do you have? (if Q8is yes answer, otherwise skip)
Write option code in the
space provided
Option Now 2 years ago,
01 Kiosk/duka
02 Livestock business
03 Grocery
04 Butchery
05 Clothes
06 Other (please state)
07 No, I do not have a business
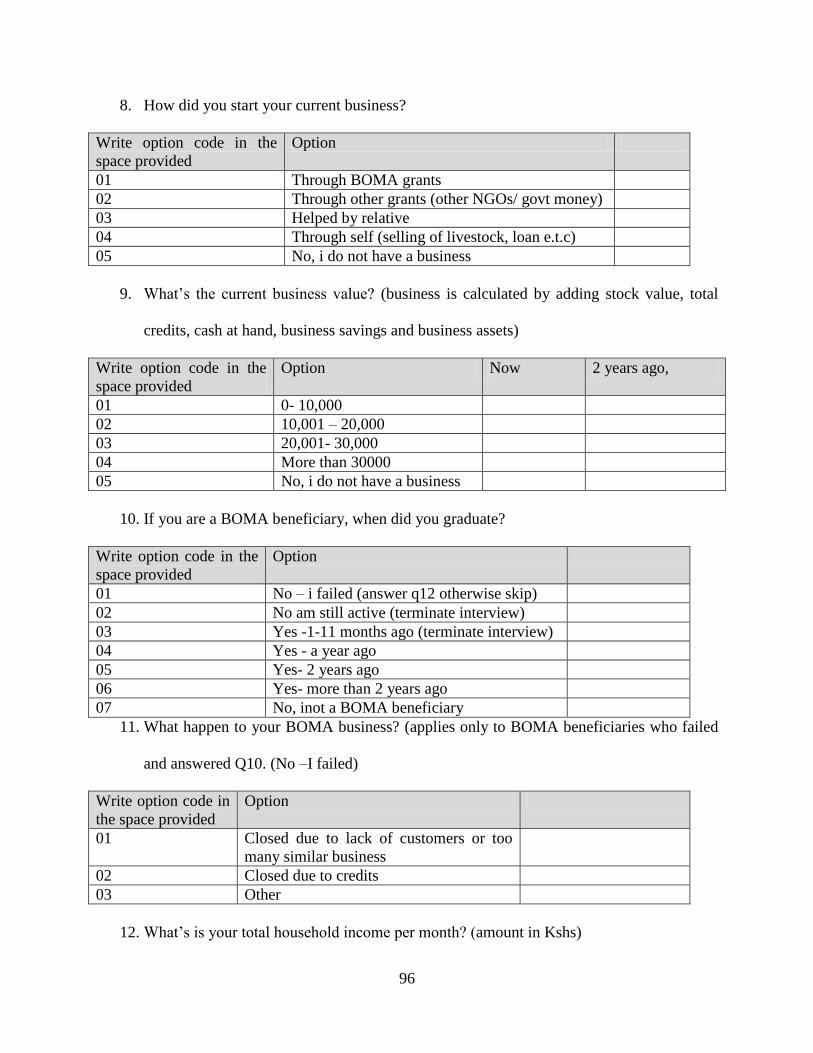
96
8. How did you start your current business?
Write option code in the
space provided
Option
01 Through BOMA grants
02 Through other grants (other NGOs/ govt money)
03 Helped by relative
04 Through self (selling of livestock, loan e.t.c)
05 No, i do not have a business
9. What‟s the current business value? (business is calculated by adding stock value, total
credits, cash at hand, business savings and business assets)
Write option code in the
space provided
Option Now 2 years ago,
01 0- 10,000
02 10,001 – 20,000
03 20,001- 30,000
04 More than 30000
05 No, i do not have a business
10. If you are a BOMA beneficiary, when did you graduate?
Write option code in the
space provided
Option
01 No – i failed (answer q12 otherwise skip)
02 No am still active (terminate interview)
03 Yes -1-11 months ago (terminate interview)
04 Yes - a year ago
05 Yes- 2 years ago
06 Yes- more than 2 years ago
07 No, inot a BOMA beneficiary
11. What happen to your BOMA business? (applies only to BOMA beneficiaries who failed
and answered Q10. (No –I failed)
Write option code in
the space provided
Option
01 Closed due to lack of customers or too
many similar business
02 Closed due to credits
03 Other
12. What‟s is your total household income per month? (amount in Kshs)

97
Write option code in the
space provided
Option Now 2 years ago,
01 Less than 1000
02 1001-5000
03 5001- 10000
04 10001 – 20000
05 20001 – 50000
06 More than 50001
13. Food security Food security Last 30 days
Did your household go to the bed without an evening
meal
Last 7 days Last 30 days
Write option code in the
space provided
Option
01 Never
02 1-5 times
03 6-10 times
04 11-15 times
05 More than 15 times
06 1-5 times
14. Why did you go to bed without an evening meal?
Write option code in
the space provided
Option
01 No money to buy food
02 Had money but no shops around to buy food
03 Our choice (we usually go without an evening
meal)
04 Laziness (was not able to Cook)
05 N/a
Part. C: Mentoring and evaluation
15. Have you ever received any business training or saving and lending?
Yes{} no{}

98
16. If yes, who provided the training?
Write option code in the space
provided
Option
01 BOMA
02 Other NGOs
03 County
04 Other
17. How regular was the training provided?
Write option code in the space
provided
Option
Daily
Weekly
Monthly
Quarterly (after every 4
months)
Yearly
18. Do you save?
Yes{} no{}
19. Where do you save?
Write option code in the
space provided
Option Now 2 years ago,
01 At an institution (bank,
Saccoetc.)
02 BOMA saving group
03 Other saving groups
04 At home/business
05 N/a- i have never saved
20. How often do you save?
Write option code in the
space provided
Option Now 2 years ago,
01 Daily
02 Weekly
03 Monthly
04 Quarterly
05 Yearly
06 Never

99
21. Do you have any savings?
Write option code in the
space provided
Option Now 2 years ago,
01 Yes
02 No
22. Where did you get the money you save?
Write option code in
the space provided
Option
01 Form my BOMA business
02 From the sale of own livestock.
03 From relatives, cash transfers, other
business, salary etc.
04 Other
05 N/a
23. How many times have you ever borrowed or loaned?
Write option code in the space
provided
Option
01 Once
02 Severally (2-4 times)
03 Never
24. If you have taken a loan, where did you get it from?
Write option code in
the space provided
Option
01 BOMA saving group
02 Other saving groups
03 From a relative
04 From an institution (bank, Sacco e.tc.)
05 From a businessman
06 I have never loaned
25. Are you able to repay the loan that you have by yourself?
Write option code in the
space provided
Option Now 2 years ago,
01 Yes
02 No.

100
Part. D: Asset Accumulation.
Nonproductive assets
Write option code in the space provided
Do you own any of those Non-productive assets? (Count the number of items)
Option code Option Now 2 years ago,
Mattress(es)
Bed(s)
Wheelbarrow
Bath shelter
Latrine
Mosquito net(s)
Mobile phone
Lantern(s)/solar lamp(s)
Radio
Television set
Refrigerator
Bicycle
Motorcycle
Motor vehicle
Livestock
Do you own any of those livestock? (Count the number of livestock)
Option Option Now 2 years ago,
Cattle
Goats
Sheep
Camel
Donkey
Chicken or poultry
Other (specify)
I do not own livestock

101
Appendix III: Mentors (officers) Questionnaire
Determinants of effectiveness of a monitoring and evaluation system for projects
This questionnaire aims at establishing; determinants of effectiveness of monitoring and
evaluation system for projects: a case of BOMA project poverty graduation programme. The
questionnaire is designed to collect data that will help achieve the objectives of this study. I am
kindly requesting you to participate in this study by responding to all the questions as candidly
and precisely as possible. Your honesty and co-operation in responding to the questions will
highly be appreciated. All information provided will be treated with utmost confidentiality and
will be used purely for academic purposes.
Part. A: demographics.
1. Gender of the respondent
female male
2. What is your age bracket?
Below 25 years ( )
25-30 years ( )
31-40 years ( )
41-50 years ( )
Above 50 ( )
3. What is your level of education?
Primary ( )

102
Secondary ( )
Tertiary/college ( )
Undergraduate ( )
Postgraduate ( )
4. How long have you worked for BOMA project?
Less than 1yr ( )
1-3 years ( )
4-6 years ( )
7-9 years ( )
9 yrs & above ( )
5. Was there a data capturing system for the project?
a. Yes
b. No
c. Don‟t know
6. Did the information system help in understanding project expectations?
d. Yes
e. No
7. On a scale of 1-10 (10 being the highest), rate how the baseline survey influenced
project performance. Enter zero for abstaining

103
Part. B: Project Performance
On a scale of 1-5 (1 being the most effective/successful and 5 least), what was the rating for
project performance in the following?
Item Rating (1 least & 5
most)
Comments
1)Project activities were delivered on time 1 2 3 4 5
2)Number of project deliverables 1 2 3 4 5
3)All activities promised were implemented 1 2 3 4 5
4)Cost of project 1 2 3 4 5
5)General level of satisfaction of project
performance
1 2 3 4 5
Part. C: influence of monitoring and evaluation system on BOMA projects.
By ticking in the space provided, indicate the extent to which you agree or disagree with the
following statements concerning M&E in relation to projects in the organization. 5 – strongly
agree 4 – agree 3 - not sure 2 - disagree 1 – strongly disagree
No
Statement
Influence of M&E on Micro Business and savings and lending
schemes Performance
SD D NS A SA
1 Top management has a positive attitude towards the establishment
of a self-sustaining Micro businesses
1 2 3 4 5
2 The organization has well-defined indicators of measuring Micro
business performance
1 2 3 4 5
3 The organization conducts assessment of the overall performance
of the micro business
1 2 3 4 5
4 The roles of M&E are well defined to support Micro business 1 2 3 4 5
5 The organization has got a „champion‟ for the
M&E exercises
1 2 3 4 5
6 All staff get feedback after measurement of project activities
7 The organization has adequate capacity to commission valuations
Influence of data quality on Micro Business and savings and lending
schemes Performance
SD D NS A SA
1 Monitoring systems on Micro business is likely to generate reliable
information
1 2 3 4 5
2 Micro business data collected, when measured reports on outputs
that reflect the critical stated objectives of the organization
1 2 3 4 5

104
3 Good system identifies key issues as well as root of problems that
the micro business face
1 2 3 4 5
4 Data collection activities conducted legally with due regard to the
welfare of those affected by its results
1 2 3 4 5
5 Frequently collected data enables to truck trends as well as
understand project intervention
1 2 3 4 5
6 Data collected provides clear indicators against which the
organization work is being measured
1 2 3 4 5
7 The organization carries out periodic data audits 1 2 3 4 5
8 All staff get feedback after measurement of project activities 1 2 3 4 5
9 Monitoring systems on Micro business is likely to generate reliable
information
1 2 3 4 5
Influence of M&E on Human capacity Performance SD D NS A SA
1 The organization has got ways to establish skills that personnel
need to gather information on the performance of Micro business
and savings and lending schemes
1 2 3 4 5
2 The organization has got systems to equip skills to personnel to
adequately analyse data
1 2 3 4 5
3 Analysis of micro business data helps m&e officers gather
information on micro -business trends to sufficiently advice the
programme
1 2 3 4 5
4 Result-based performance is factored into personnel assessments 1 2 3 4 5
End of questionnaire. Thank you

105
Appendix IV: FGD for M&E Officers and Field Officers
1. How would you describe the influence of M&E systems, on BOMA supported activities?
2. Who funds the monitoring and evaluation activities within the organization? How would you
describe the funding? Is it adequate?
3. Does monitoring and evaluation section has separate allocation in the budget? Is allocation
and provision of funds done in time?
4. Does the organization management support monitoring and evaluation of projects?
5. Is the support sufficient and if not what more should they do?
6. Does M&E contribute in the decision made in the organization? May you describe how in
your own words.
7. From your own observation how would you describe the knowledge of the organization‟s
personnel on the existing monitoring and evaluation system?
8. Does the organization engage in training of the employees on monitoring and evaluation
systems? How often?
9. Does the organization involve external expertise in setting up the monitoring and evaluation
systems and during M&E processes?
10. What factors would you rate as the main determinants of the effectiveness of a monitoring
and evaluation system for projects?
End of questionnaire. Thank you

106
Appendix V: FGD For Respondents
1. How would you describe the influence of BOMA supported micro business in your village?
2. How would you describe the influence of BOMA supported saving and lending schemes in
your village?
3. Does business mentorship and trainings have an impact to growth and business progress?
4. What changes have you noticed in your village since BOMA project has been implemented
in your location?
5. What happen when your household cannot afford an expense that is necessary?
End of questionnaire. Thank you

107
Appendix VII: Questionnaire for M&E Manager, Data Analyst and M&E Officer
A. ORGANIZATION STRUCTURE
i. Is there an Internal organ to oversee M&E function among the BOMA beneficiaries?
ii. What does the unit do(specific)?
iii. Are other departments aligned to support M&E? Yes/No
iv. Please explain your answer.
B. HUMAN CAPACITY
i. Explain the specific functions that you carry out? Monitoring and Evaluation?
ii. Did you have prior experience on M&E Before you joined BOMA? Yes/No
iii. Please explain your answer.
iv. Has BOMA organized trainings and capacity building on the M&E for you since you joined?
Yes/No
v. How many trainings were provided in a year?
vi. Please explain the content of the trainings.
C. ROUTINE PROGRAMMES MONITORING?
i. How frequently in a month do you collect data for use in monitoring performance of
the programme? Yes/No
ii. What type of the data do you collect?
iii. Are the results reintegrated back into the programme? Yes/No
iv. Please explain how you go about this
D. M&E WORK PLANS & COST
i. Which resources have been allocated to the unit?
ii. Explain
iii. Does a unit have a work plan?
iv. What are the components of the work plan?
v. How have the following been allocated to the unit?
i. Personnel
ii. Time
iii. Finances
vi. Does BOMA have an M&E Policy? Yes/No
vii. What are the contents?
viii. How often are you exposed to the contents of the policy
i. Daily
ii. Weekly
iii. Monthly
iv. Other specify
End of questionnaire. Thank you

108
Appendix VI: Questionnaire Schedule
The logistics are often the most time-consuming element of preparing to conduct a
A research. Below is my schedule:
Table 1.33. My schedule
Task Duration Start Date Finish Date Resource Names
Introduction to community
leaders and BOMA Project
1 day 28/02/2020 28/02/2020
Interviews and Questionnaire 1 week 03/202020 8/03/2020 - Interviews
- Questionnaires
Identify and reserve focus
group location
1 day 3/03/2020 3/03/2020 Room, notebook,
pen, pencils
Invite Participants 1 day 4/03/2020 4/03/2020 -Airtime
Focused group discussion 2 day 5/03/2020 6/03/2020 Note taker, sits
and facilitator
Data entry and preparation 1 week 9/03/2020 13/03/2020 Data entry clerks
Data Analysis & report writing 1Month 16/03/2020 3/04/2020

109
Appendix VI: Authorization Letter