influence of mn and ni on the microstructure and - perusion
TRANSCRIPT

W E L D I N G R E S E A R C H
SUPPLEMENT TO THE WELDING JOURNAL, MAY 1997 Sponsored by the American Welding Society and the Welding Research Council
Influence of Mn and Ni on the Microstructure and Toughness of C-Mn-Ni Weld Metals
Increasing the manganese and nickel levels changes the weld metal microstructure by promoting acicular ferrite at the expense of proeutectoid ferrite
BY Z. ZHANG and R. A. FARRAR
Abstract. A systematic investigation has been carried out to study the microstruc- ture and toughness of C-Mn-Ni low-alloy shielded metal arc (SMA) weld metals. The manganese and nickel concentra- tions were progressively changed to de- termine their influence on weld mi- crostructure and mechanical properties as well as to identify their interactions. The results obtained showed that man- ganese and nickel have considerable ef- fect on the weld metal microstructure, and both Mn and Ni affect the mi- crostructure in a similar way, i.e., pro- moting acicular ferrite at the expense of proeutectoid ferrite (grain boundary fer- rite and ferrite sideplates). The results in the top bead also showed that there is an optimum composition range that pro- duces an optimum balance of weld metal microstructures. For optimum toughness, a combination of 0.6-1.4% manganese and 1.0-3.7% nickel is suggested. Addi- tions beyond this limit promotes the for- mation of martensite and other mi- crostructural features, which may be detrimental to weld metal toughness.
Introduction
Over the past few years, more and more critical service conditions in
ZHUYAO ZHANG and R. A. FARRAR are with the Department of Mechanical Engineering, University of Southampton, Southampton, U.K.
welded structures, such as offshore plat- forms, cryogenic plants and associated pipework construction, have increased demands for alloy steel weld metals with improved mechanical properties, espe- cially low-temperature toughness. The requirements for excellent toughness have promoted a continuous develop- ment of advanced welding consumables capable of producing weld metals with optimum microstructure and mechanical properties.
From the large number of investiga- tions dealing with low-carbon low-alloy weld metals, the as-deposited mi- crostructure is commonly described as consisting of the following major mi- crostructural components: grain bound- ary ferrite (PF(G)), ferrite sideplates (or Widmanst~itten sideplates) (FS(A)), acicu- lar ferrite (AF) and, in certain circum- stances, martensite (M). It is generally be-
KEY WORDS
C-Mn-Ni Weld Metal Microstructure Acicular Ferrite Toughness Composition Balancing
lieved that a microstructure that contains a high proportion of acicular ferrite dis- plays optimum weld metal strength and toughness properties. This is attributed to its small grain size (typically 1-3 pm), in which each lath is separated by high angle grain boundaries. On the other hand, the formation of a large proportion of grain boundary ferrite, ferrite side- plates, or martensite, has been found to be detrimental to toughness, because these structures provide preferential easy crack propagation paths, which offer a low resistance during the weld metal cleavage fracture (Refs. 1-3).
There have been some systematic in- vestigations into C-Mn-Ni low-alloy weld metals. These include studies on the microstructure and mechanical prop- erties of as-deposited welds carried out by Taylor and Evans (Ref. 4) and Evans (Ref. 5), and the continuous cooling transformation kinetics of the C-Mn-Ni weld metals conducted by Harrison and Farrar (Refs. 6, 7) and the current authors (Refs. 8, 9). These previous studies paid primary attention to microstructural fea- tures of C-Mn-Ni welds and how these are influenced by different additions of nickel, and how the weld metal tough- ness changed with variations in the nickel and manganese contents (Refs. 4, 5). In the investigation of kinetics, using continuous cooling transformation dia- grams (CCT), the microstructural devel- opment in C-Mn-Ni weld metals was studied, and different factors that influ-
WELDING RESEARCH SUPPLEMENT I 183-s

Table 1 - - Chemical Composition of the Core Wlre (wt-%)
Wire C Mn Si S P
MS1 0.01 0.10 0.02 <0.015 <0.012
Ni Cr Mo Cu AI+Ti N (ppm)
<0.06 <0.06 <0.06 <0.06 <0.4 <50
Table 2 - - The Chemical Composition of the
Weld AWS Code Specification
AO A5.5/E7018-G A1 A5.5/E8016-G A2 A5.5/E8016-C1 B1 A5.5/E8018-C1 B2 A5.5/E8016-C2 B3 EC C1 EC b
(a) Design changes. (b) EC = experimental consumables. (c) nd = not determined.
Weld Me~ls (wt-%)
C Mn (a) Si S P Ni (a) Ti Mo
0.042 1.57 0.46 0 .010 0.013 0.03 0 . 0 1 6 0.007 0.048 1.68 0.50 0 .011 0.015 0.95 0 . 0 1 9 0.010 0.041 1.67 0.49 0 .009 0.013 2.48 0 .018 0.008 0.037 0.85 0.50 0 .008 0.013 2.56 0 .021 0.008 0.057 0.67 0.53 0 .008 0.013 3.32 0 .024 0.008 0.048 0.78 0.66 0 .008 0.015 5.53 0 .025 0.010 0.034 0.36 0.55 0 .013 0.008 5.58 0 .023 0.008
23
Fig. I - - Schematic diagram showing joint geometry and location of Charpy specimens (dimensions in ram).
ence this behavior were demonstrated (Refs. 6-9). There have been some other less systematic compositional works that studied C-Mn-Ni welds. For instance, Abson (Ref. 10) recently carried out in- vestigations on as-welded toughness of gas-shielded C-Mn-Ni deposits contain- ing 1.0% nickel with different types of welding wires, while Surian, et al. (Ref. 11), studied shielded metal arc C-Mn-Ni welds with 3% nickel to demonstrate the effect of oxygen content on the toughness of these welds.
Despite the level of research efforts di- rected toward C-Mn-Ni weld metals, the factors controlling strength and tough- ness are not fully understood. These in- clude a) how a wider range of nickel and manganese contents influence the weld metal microstructure and the resultant mechanical properties; b) the interaction between manganese and nickel and the correlation with an optimum microstruc- ture, and therefore, optimum toughness; and c) the effect of additions of man- ganese and nickel on the morphologies
of the microstructural components and other microstructural features, and how this can be related to weld metal tough- ness. The present work addresses these factors.
Exper imenta l Deta i ls
Electrodes
A series of C-Mn-Ni iron powder, low- hydrogen basic electrodes, coded A(0-2), B(1-3) and C(1 ), were prepared using 4.0- mm size consumables. The coating ratio of the electrodes was -1.5. Different amounts of alloying powder were added to the coatings to produce comparable levels of manganese and nickel in all weld metal samples, nominally 0.3, 0.7 and 1.6% Mn and 0, 1.0, 2.5, 3.5 and 5.5% Ni. The core wire used was MS1. Its chemical composition is listed in Table 1. The electrodes were baked at 300°C for 2 h.
1. Equivalent to AISI-SAE1022.
AI Cu O N
0.004 0.050 nd c nd 0.007 0 .050 0 .0254 0.0134 0.005 0.056 nd nd 0.005 0 . 0 6 0 0 .0310 0.0100 0.006 0.064 nd nd 0.007 0.074 nd nd 0.006 0.078 nd nd
Weld Compositions
A series of shielded metal arc C-Mn- Ni weld metals was used. Three levels of manganese content, namely 0.3%, 0.7% and 1.6%, were designed to balance with different nickel content ranges, i.e., 0-2.5%, 2.5-5.5% and 5.5%, respec- tively. The microstructures formed in the as-deposited regions and reheated re- gions were examined, and correlated with the mechanical properties, particu- larly toughness. The results were com- pared with existing data produced by other authors.
Weld Preparation
The welding was carried out on BS970-070M201 plate with a nominal chemical composition of 0.25% (max.) C, 1.0% Mn, 0.06% S and 0.06% P. The thickness of the plate was 19 mm. The joint geometry is illustrated in Fig. 1. Al- ternating current was employed. The process conditions were current: 145 A, voltage: 18 V, average travel speed: 2.42 mm/s-~ and a nominal heat input of 1.2 kJ/mm-L The interpass temperature was held at 150°C. Using three beads per layer (two beads for the first layer), the total number of runs was 23. The weld- ing was done in the downhand position.
Chemical Composition Analysis and Metallography
The chemical compositions of the as- deposited weld metals were determined by a Bausch & Lomb ARL-3560 optical emission spectrometer using samples
2. Guide to Light Microscopy Examination of Ferritic Weld Metals, I IW Doc. No. IX-1533- 88, June 1988.
184-s I MAY 1997

Fig. 2 - - Microstructure o f the as-deposited top bead welds (1.6% Mn). A - - A I weld (1.0% Ni); B - - A2 weld (2.5% Ni).
containing the full section of the weld (the actual target size was 16 mm in di- ameter) and checked by Quantovac methods. The oxygen and nitrogen con- tents of some welds (A1 and B1 ) were as- sessed by a Leco TC-136 machine.
All metallographic specimens from each weld were prepared by standard metallographic methods. The polished samples were etched in 2% Nital. Opti- cal examination was carried out on a Neophot II microscope. A JEOL JSM- T300 scanning electron microscope (SEM) was employed to assess the de- tailed morphology of the acicular ferrite produced.
Quantitative metallography using the standard Welding Institute method 2 was used to assess the proportions of the dif- ferent microstructural constituents in the as-deposited weld metal and to measure the prior austenite grain size. The prior austenite grain size was determined using the linear intercept method (Ref. 12) and the grain size (i.e., the columnar grain width) was measured using the grain boundary ferrite veins. The quanti-
tative measurement of the volume frac- tions of the various microconstituents was carried out by employing a point counting method; this used a 7 x 7 grid comprised of 1-cm squares (i.e., 49 counting points for one field) placed on the microscope projection screen at a magnification of 500. Forty fields were examined, which resulted in 1960 points being counted for each individual speci- men. The areas used for the quantifica- tion of microstructures of as-deposited top bead welds were chosen following the suggestion of Davey and Widgery (Ref. 13).
Mechanical Examinations
Charpy Impact Test
Charpy V-notch specimens (10 x 10 x 55 mm) were extracted from the welds in the manner shown in Fig. 1. A through- thickness notch was machined parallel to the centerline of the welds. To ensure the notch was located in the center of the weld beads, 4% Nital was used to outline
the welds in the Charpy specimens. The notch size of every Charpy specimen was carefully checked before testing. The im- pact tests were carried out at eight differ- ent temperatures between 20 ° and -80°C, to obtain full transition curves.
SEM was used to examine the fracture surfaces to establish the failure mode of the different weld metals.
Hardness Test
Vickers hardness tests using a 10-kg load were conducted on a full macro- section of each of the weld metals across the centerline of the welds. The space between two adjacent testing spots was 1 mm.
Results
Chemical Analysis Results
The chemical compositions of the weld metals are listed in Table 2. From the table, it can be seen that the yields of
WELDING RESEARCH SUPPLEMENT I 185-s

]
1
, J '. . ~ - ' . ' ~ F L , , a . , ~ { - , ~ . ' . . (< ; ,a / - .~ . f~ ; - .> . .~ -
Fig. 3 - - Microstructure o f the as-deposited top bead welds (0•7% Mn). A - - B I weld (2.5% Ni); B - - B2 weld (3.5% Ni) ; C - - B3 weld (5.5% Ni).
nickel, manganese and other elements were as expected, the exceptions being the B2 weld, which had a slightly lower nickel level, and the B1 weld, which had
a higher manganese content. The carbon contents were essentially within the tar- get range, namely 0.04-0.05%, although B2 contained slightly higher carbon. The
carbon content drift was generally within 0.015%. Nevertheless, these small varia- tions in chemical composition were not considered to be significant compared with the design changes in nickel and manganese concentrations.
The oxygen levels of the weld metals were examined using two of the welds
(A1 and B1), which represented either high (1.6%) or intermediate (0.7%) man- ganese level welds• The analyses showed that the oxygen contents of these welds were within the predicted oxygen level regime, typically 250-350 ppm. In the case of the other welds, as there were no obvious differences in the main deoxi-
186-s I MAY 1997

, ~ ,~ • .~ -. , ~ V~.~- ,~ , q ' - . "
..o. ,.,, . . . . ~ . , ~ ' ~ ;~.~ , ~ .~. ~ . ...
• . , . . . . ~ . - ~ . - ~ , ~ ~ . ~ ~ ~, :~,. "" ,- u ".-" ~ ,: ",~#~#, ; <= ,'; ~.,.~ i ik'.i4~ , ~.~- ~.~,~,..~,.'~:.~,.~?~ ,~ ,~.,e ~ "'
, ,~. ; . , ,, ; :'<~:,~..,~.' i ~ . ~ : ~ # :~" ~ - . ~ . C ~'~ ~.,~:~ 9'; • " ¢1 " f : ~ ' . " ' ~ - ' ~ - , d r ~ ~ , . I ~ ~7,~ @ , ' ~ . . ~ ~ , ' : I : ~ ¢ _ . , ,
i
• ~ r ' ' i < i,~, ~ " ~ : ~ i " " i ~ " i - ~ +" ~"
r , ~ : " , " r ~ , ~ . y, l l ~ '1 . " ~ ~ ~ " ~ " S ~ > ~ i S ~ ' * • " ~ ~ " "~ ~. "
, , . . , . ~ . < ~ . ~ , , . . . . , ~ , ~ . .
. K I '
L <'̀ ',, W. o
Fig. 4 - - M ic ros t ruc tu re o f the as-depos i ted top bead w e l d (CI : 0 .3% Mn , 5 .5% Ni).
dants (such as silicon), and as the welds were produced by the same welder using the same procedure, the oxygen levels were assumed to range between 250 and 350 ppm.
M i c r o s t r u c t u r e o f t h e W e l d M e t a l s
Microstructure of the As-Deposited Top Beads
The microstructures of the as-de- posited weld metals (top beads) with dif- ferent manganese levels are shown in Figs. 2-4. The volume fraction of differ- ent microconstituents and the average columnar (austenite) grain width are listed in Table 3. The microstructure of these weld metals consists mainly of aci- cular ferrite, grain boundary ferrite, fer- rite sideplates, and in some circum- stances, martensite. Typical examples of these phases are illustrated in Figs. 2-4.
The results of the optical examina- tions and the data listed in Table 3 indi- cate the significant influence of man- ganese and nickel on the microstructure of the weld metals• At a higher man- ganese level (i.e., 1.6% Mn), when the nickel content was increased from 0 to 1.0%, the acicular ferrite content in- creased considerably while grain bound- ary ferrite decreased, and the microstruc- ture became dominated by acicular ferrite; when the nickel content was in- creased to 2.5%, about 6% martensite appeared in the microstructure associ- ated with a further reduction in grain boundary ferrite. In general, with the ad- dition of nickel, the volume fraction of acicular ferrite structure increased at the expense of grain boundary ferrite. At higher nickel contents, the increase in acicular ferrite was accompanied by the
presence of the martensitic structure, while grain boundary ferrite was obviously reduced and side- plate structures de- creased slightly•
When the man- ganese level dropped to 0.7% and nickel was kept at an inter- mediate level (2.5%), grain boundary fer- rite and ferrite side- plates ini t ia l ly in- creased and were accompanied by a decrease in acicular ferrite and elimina- tion of martensite compared with the 1.6% Mn weld metal. Further additions of nickel, espe- cially when nickel content was greater than 3.5%, resulted in a considerable re- duction of grain boundary ferrite and fer- rite sideplates, and increase of acicular ferrite. When the nickel content was in- creased to 5.5%, martensite in the weld reached -30%, whi le grain boundary ferrite almost disappeared. However, by
Fig. 5 - - M o r p h o l o g y o f martensi te in h igh -n icke l -con ten t we ld (C1 w e l d ) •
reducing manganese further to 0.3%, a slight decrease in martensite and in- crease in higher temperature transforma- tion products was obtained as expected (Refs. 6-9). In the B3 and C1 welds, lath martensite was clearly present as indi- cated in both the optical (Figs. 3, 4) and the SEM photographs (Fig. 5).
With the addition of nickel, the
T a b l e 3 - - R e s u l t s o f Q u a n t i t a t i v e M e t a l l o g r a p h y f o r t h e A s - D e p o s i t e d W e l d M e t a l
M i c r o s t r u c t u r e
W e l d Microstructuralconstituents(%) Code PF(G) FS(A) AF M
A0 18 13 69 A1 11 12 77 A2 5 10 79 6 B1 21 22 57 B2 16 23 61 B3 1 6 63 30 C1 3 8 67 22
Average columnar width (IJm)
100 110 61 69 64
215 180
WELDING RESEARCH SUPPLEMENT I 187-s
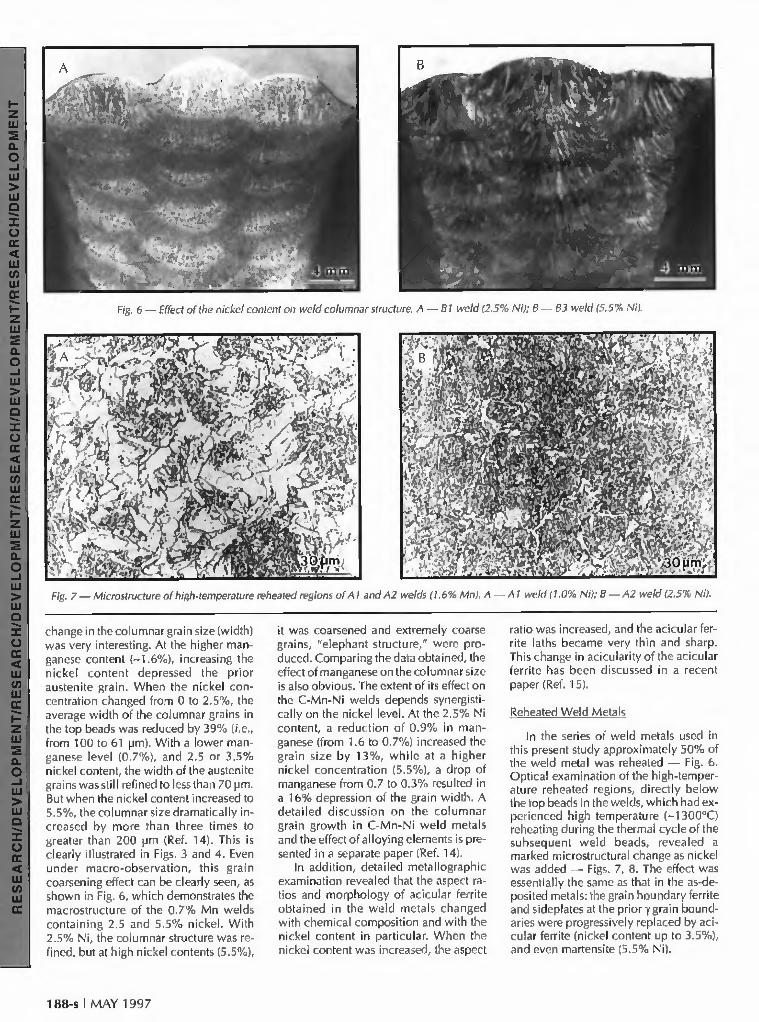
Fig. 6 - - Effect o f the nickel content on weld co lumnar structure. A - - B l weld (2.5% Ni); B - - B3 weld (5.5% Ni).
Fig. 7 - - Microstructure o f high-temperature reheated regions o f A 1 and A2 welds (1.6% Mn). A - - A 1 weld (1.0% Ni); B I A2 weld (2.5% Ni).
change in the columnar grain size (width) was very interesting. At the higher man- ganese content (-1.6%), increasing the nickel content depressed the prior austenite grain. When the nickel con- centration changed from 0 to 2.5%, the average width of the columnar grains in the top beads was reduced by 39% (i.e., from 100 to 61 him). With a lower man- ganese level (0.7%), and 2.5 or 3.5% nickel content, the width of the austenite grains was still refined to less than 70 pm. But when the nickel content increased to 5.5%, the columnar size dramatically in- creased by more than three times to greater than 200 pm (Ref. 14). This is clearly illustrated in Figs. 3 and 4. Even under macro-observation, this grain coarsening effect can be clearly seen, as shown in Fig. 6, which demonstrates the macrostructure of the 0.7% Mn welds containing 2.5 and 5.5% nickel. With 2.5% Ni, the columnar structure was re- fined, but at high nickel contents (5.5%),
it was coarsened and extremely coarse grains, "elephant structure," were pro- duced. Comparing the data obtained, the effect of manganese on the columnar size is also obvious. The extent of its effect on the C-Mn-Ni welds depends synergisti- cally on the nickel level. At the 2.5% Ni content, a reduction of 0.9% in man- ganese (from 1.6 to 0.7%) increased the grain size by 13%, while at a higher nickel concentration (5.5%), a drop of manganese from 0.7 to 0.3% resulted in a 16% depression of the grain width. A detailed discussion on the columnar grain growth in C-Mn-Ni weld metals and the effect of alloying elements is pre- sented in a separate paper (Ref. 14).
In addition, detailed metallographic examination revealed that the aspect ra- tios and morphology of acicular ferrite obtained in the weld metals changed with chemical composition and with the nickel content in particular. When the nickel content was increased, the aspect
ratio was increased, and the acicular fer- rite laths became very thin and sharp. This change in acicularity of the acicular ferrite has been discussed in a recent paper (Ref. 15).
Reheated Weld Metals
In the series of weld metals used in this present study approximately 50% of the weld metal was reheated - - Fig. 6. Optical examination of the high-temper- ature reheated regions, directly below the top beads in the welds, which had ex- perienced high temperature (-1300°C) reheating during the thermal cycle of the subsequent weld beads, revealed a marked microstructural change as nickel was added - - Figs. 7, 8. The effect was essentially the same as that in the as-de- posited metals: the grain boundary ferrite and sideplates at the prior "t' grain bound- aries were progressively replaced by aci- cular ferrite (nickel content up to 3.5%), and even martensite (5.5% Ni).
188-s I MAY 1997

~ ' . ~ . _ " ;~ ' ,~ ~ . ~ :,~, ~ . , ' x
. , " . , . -
Fig. 8 - - Microstructure o f high-temperature reheated regions o f the B I and B3 weld (0.7% Mn).
...... ~ - ~ " , . , :~ - ~ a f ~ , ~ @ ~ , ~F" ,~ l~,~ ~ . ~ . ~
A - - B I weld (2.5% Ni); B - - B3 weld (5.5%).
In the lower temperature (-900°C) re- heated regions, the effect seemed more significant, as shown in Figs. 9 and 10. The structure with high Mn-low Ni and low Mn-medium Ni contents were re- fined as usual - - Figs. 9A, 10A. With high Mn-medium Ni or low Mn-high Ni, the weld structures appeared to show dis- tinctive "structure inheritance" features, indicating that at high levels of nickel, the normal changes in grain structure due to recrystallization did not remove the pre- existing s t ructure- Figs. 9B, 10B.
At the even lower temperature (<900°C) reheated regions, large addi- tions of nickel (as in the A2, B3 and C1 welds) produced a considerable change in the microstructure; and a segregation structure was observed with the mor- phologies displaying either a network or parallel boundaries, as shown in Fig. 11. SEM energy dispersive X-ray analyses (EDS) carried out along a lateral section of the segregation structures indicated that the segregation sites were rich in nickel, manganese and si l icon-- Fig. 12. Studies (Refs. 8, 16) in parallel with the current work have revealed that the ele- mental segregation in the welds was a re- sult of sol idi f icat ion rather than the product of the lower temperature
transformations (i.e., y-~ transformation). This resulted in a locally distributed martensitic structural banding saturated with nickel, manganese, silicon and, possibly, carbon. This martensitic struc- ture would then decompose during the reheating at temperatures above 600°C, the product of the reaction then outlining the pattern of the segregation (Ref. 8). Further TEM work carried out by Zhang and Farrar (Ref. 16) identified the precip- itated particles as a type of orthorhombic carbide (MaCb).
Hardness Results
Average hardness traverses along the through-thickness centerline of the welds containing both the as-deposited and re- heated microstructures are plotted in Figs. 13 and 14 to illustrate the change of hardness with the variations in the man- ganese and nickel contents. These figures reveal that manganese and nickel have a powerful effect in increasing hardness of the deposits, manganese having a stronger effect than nickel. The major in- fluence of these elements is through changes in microstructural constituents. In general, the trend is that, hardness of the weld metals rose with the amount of
either acicular ferrite or martensite struc- ture in the microstructure.
Impact Toughness Results
Average Charpy-V data are shown in Table 4. The impact transition curves of the weld metals obtained from the aver- age of the scatter bands are plotted in Fig. 15A, B for the welds of 1.6% Mn or 0.7% Mn levels and in Fig. 16 for the welds of 5.5% Ni content, but with different man- ganese additions.
At the 1.6% manganese level, an ad- dition of 1.0% nickel increased the toughness of the weld, i.e., increased both upper shelf and lower shelf, hence reducing the transition temperature by about 5°C. When the nickel content was increased to 2.5%, however, the whole impact curve was depressed, which is not surprising as the yield strength would rise with increasing hardenability. With a lower manganese level (0.7%), the addi- tion of a medium amount of nickel (2.5%) resulted in excellent toughness, but a slight decrease in the upper shelf. Increasing the nickel content to 3.5%, the properties were still satisfactory; however, the upper shelf was depressed further and there was indication that the
Table 4 - - Results of Charpy V-Notch Impact Testing (Average of Three Specimens)
Weld Average absorbed energy ~) Code 20°C 0°C -20°C -40°C -50°C
A0 206 168 158 126 92 A1 194 202 162 141 89 A2 141 107 81 69 34 B1 203 174 164 153 127 B2 174 169 155 124 118 B3 91 81 43 40 31 Cl 116 115 105 85 55
(a) nd = n ~ determin~
-60°C -70oc -80oc
42 21 nd (a) 65 nd 40 nd 25 nd 77 nd 34 76 52 38 33 20 nd 55 nd 33
WELDING RESEARCH SUPPLEMENT I 189-s

C C'/,~
Fig. 9 - - Microstructure o f low-temperature rehea ted regions of the A 1 and A2 welds (1.6 % Mn). A - - A I weld ( 1.0% Ni); B - - A2 weld (2.5% Ni).
Fig. 10 - - Microstructure of low-temperature reheated regions of the B1 and B3 welds (0.7% Mn). A - -B1 weld (2.5% Ni); B - - B3 weld (5.5% Ni).
toughness had begun to decrease. With a nickel content of 5.5%, the toughness dropped considerably. Reducing the manganese to 0.3%, the toughness was obviously improved, but because the basic structure was similar to that of the B3 weld, the toughness was still unsatisfactory.
Discussion
Influence of Manganese and Nickel on the As-Deposited Weld Metal Microstructure
The results of both metallographic observation and quantitative measure- ments indicated that the microstructure of the C-Mn-Ni weld metals consisted mainly of grain boundary ferrite, ferrite sideplates, acicular ferrite and, in some circumstances, martensitic structures. The volume fractions of these phases were, to very large extent, dependent
upon the chemical composition of the welds, namely the nickel and man- ganese contents.
The results obtained show that, gener- ally, the addition of nickel to weld metals effectively promotes the formation of aci- cular ferrite while significantly reducing the amount of grain boundary ferrite, both at the higher and lower manganese lev- els, in the as-deposited regions (Table 3). This confirms the previous results re- ported by Evans (Ref. 5). In the case of the sideplate structures, the effect of nickel varied with its concentration in combina- tion with manganese, as summarized in Table 5. At the 1.6% Mn level, increasing nickel from 0 to 2.5% did not significantly change the percentage of ferrite side- plates while it progressively reduced the amount of grain boundary ferrite. With a lower manganese level (0.7%), varying the nickel content within the intermediate range (from 2.5 to 3.5%), similarly did not
influence the formation of the sideplate structures, but significantly reduced the grain boundary ferrite. Nevertheless, when the nickel content was increased to its highest level, i.e., 5.5%, the volume fraction of both grain boundary ferrite and sideplates was substantially decreased and a considerable amount of martensite was formed (30%). A similar case was ob- served in the C1 weld. Plotting the quan- titative data of Table 3 clearly reveals the trend as illustrated in Fig. 17. It is consid- ered that, because changes in grain size will affect the y-~ transformation behav- ior (Ref. 17), the latter findings are a result of the combination of the increasing ma- trix hardenability and the massive in- crease of the columnar grain size with large nickel additions.
It i,s well known that nickel is an austenite stabilizer like manganese (Ref. 2). The addition of nickel will increase the matrix hardenability of the weld met-
190-s I MAY 1997

l '~+ +~ ~ " 1 " ~ ' ~ r + ̧ • +
R!'I
m!-- s ¢ + + g ~ + +
Fig. 11 - - The segregation structure in the B3 weld metal.
als and delay the transformation of ferrite (Refs. 6-9). It should therefore be noted that the level of nickel addition needs to be closely balanced with the manganese content. The microstructures obtained in the A2, B3 and C1 welds indicate that for a given manganese concentration, nickel additions beyond certain limits will result in martensitic structures being promoted. For example, in the B3 weld (manganese content, 0.7%), a nickel content of 5.5% produced 30% martensite. Similarly, Evans (Ref. 5) obtained ~30% martensite in his 1.8% Mn-3.5% Ni low carbon weld metal (carbon level: 0.05%).
In the reheated regions, the effect of nickel was obvious. In the high-tempera- ture reheated regions, the microstructural variation as a result of increasing the nickel content, mentioned in the previ- ous section, was essentially the same as that in the as-deposited weld metals, i.e., grain boundary ferrite formed at the prior y grain boundaries was progressively re- placed by acicular ferrite and even martensite (when the nickel content was sufficiently high). The variation in the amount of sideplates could also be ob- served but to a lesser extent. In the lower- temperature reheated regions, however, the metallographic observations showed a different situation. The structure with high Mn-medium Ni (i.e., 1.6% Mn, 2.5% Ni) or low Mn-high Ni (i.e., 0.7 or 0.3% Mn, 5.5% Ni) exhibited a distinc- tive "structure inheritance" feature and the normal changes in grain structure due to recrystallization did not completely re- move the preexisting columnar structure. The microstructure produced in these re- gions consisted mainly of ferrite side- plates, acicular ferrite, martensite and a few grain boundary ferrite rather than the usual well-refined equiaxed ferrite
grains. The change vl~ ' was particularly pro- s nounced in the case of the B3 weld (Fig. 8B), where the pres- ~4[ ence of martensite in the lower-tempera- ~-3 / ture reheated region
2 1 - w a s obvious. A simi- - / lar effect was ob- served by Evans (Ref. ' ~ 5) in a 1.8% Mn- o' 3.5% Ni low carbon 0 C-Mn weld, although in that case he found the ordinary refined ferrite grains were re- placed by sideplate- type colonies.
Considering the corresponding as-de- posited microstructures of the A2 and B3 welds in which the low-temperature re- heated regions were not refined, it was noted that both these microstructures contained a certain amount of martensite (6% in A2 and 30% in B3). It is consid- ered possible that this martensite existed prior to the reheating procedures and in- fluenced the reaustenitization character- istics of the weld metals at very rapid heating rate conditions of welding and resulted in "g grains with a larger grain size. During the subsequent cooling process, these large austenite grains then
Table 5 - - Influence of the Nickel Content on the Ferrite Sideplates in the Top Bead ($ = decrease)
Mn level Ni level
1.6% 1.0% 2.5% 2.5%
0.7% 3.5% 5.5%
0.3% 5.5%
NI
Mn SI
1 2 3 4 5 6 7 8 9 1 1
Distance ( / 5 0 0 mm )
12
Fig. 12 - - Mn, Ni and Si content distribution along the lateral sec- tion of the segregation structures in the B3 weld metal. A - - The an- alyzing line and corresponding microstructure; B - - EDS results.
generated microstructural constituents that would normally develop from larger "y grains. This "structure inheritance" ef- fect has been previously observed in multi-reheated HAZ region of a quenched-tempered alloy steel (Ref. 18). Evans (Refs. 5, 19, 20) has also reported a similar incomplete refinement in the low-temperature reheated regions of some high hardenability Cr-, Mo- and Ni- bearing C-Mn welds and called it a "memory" effect (Ref. 5). Further investi- gation, however, is obviously required to clarify the matter in detail. For example, studies of the lower temperature (e.g.,
Formation of Grain Boundary Ferrite and
Effect on PF(G) Effect on FS(A)
large $ very smallS large $ small $ large $ very small $ large $ very small $ large ,[, large $ large $ large $
WELDING RESEARCH SUPPLEMENT I 191-s
'ool A i u , ~ ,
t , . - , - ,~- .~ u , , . '~" - - - .o • i ~ •
I 2J~
loo ~
401
B 1.4~ u -
°..o, .o,. --.o .... . .. \
01 i i L ~ ~ ~ ~ ll6 1L8 L K L 0 2 4 6 8 10 12 14 20 22 24 2 4 6 8 10 12 14 16 18 20 22 24
Distance from the top of we lds ( mm ) Diata l~e ~ 1he top Of w e l d s ( mm )
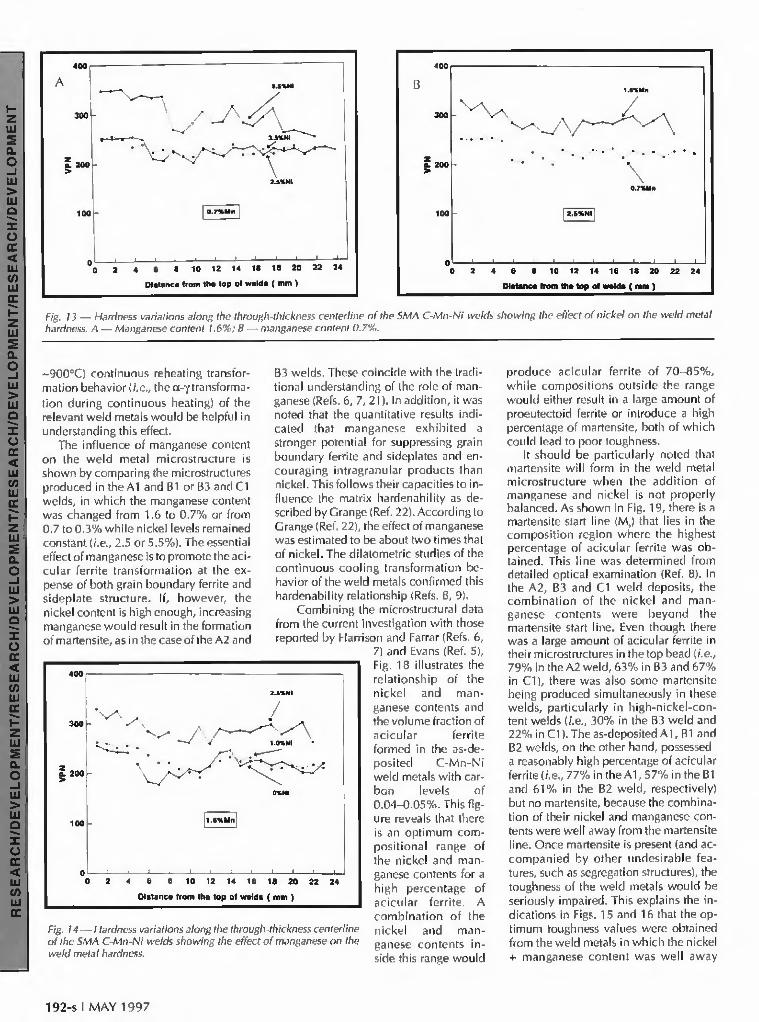
Fig. 13 - - Hardness variations along the through-thickness centerline of the SMA C-Mn-Ni welds showing the effect o f nickel on the weld metal hardness. A - - Manganese content 1.6%; B - - manganese content 0.7%.
-900°C) continuous reheating transfor- mation behavior (i.e., the 0~-ytransforma- tion during continuous heating) of the relevant weld metals would be helpful in understanding this effect.
The influence of manganese content on the weld metal microstructure is shown by comparing the microstructures produced in the A1 and B1 or B3 and C1 welds, in which the manganese content was changed from 1.6 to 0.7% or from 0.7 to 0.3% while nickel levels remained constant (i.e., 2.5 or 5.5%). The essential effect of manganese is to promote the aci- cular ferrite transformation at the ex- pense of both grain boundary ferrite and sideplate structure. If, however, the nickel content is high enough, increasing manganese would result in the formation of martensite, as in the case of the A2 and
4oo[
t U u i
3oo k " ,k.~/. ~//~"L ~ ~
~ ..o
O~NI
z 2 0 0
100
I i i I I . 4 . , . ' 0 . ; ,, , ; , ; ;0 2. ;4
Dis tance f rom the top of w e l d s ( mm )
B3 welds. These coincide with the tradi- tional understanding of the role of man- ganese (Refs. 6, 7, 21). In addition, itwas noted that the quantitative results indi- cated that manganese exhibited a stronger potential for suppressing grain boundary ferrite and sideplates and en- couraging intragranular products than nickel. This follows their capacities to in- fluence the matrix hardenability as de- scribed by Grange (Ref. 22). According to Grange (Ref. 22), the effect of manganese was estimated to be about two times that of nickel. The dilatometric studies of the continuous cooling transformation be- havior of the weld metals confirmed this hardenability relationship (Refs. 8, 9).
Combining the microstructural data from the current investigation with those reported by Harrison and Farrar (Refs. 6,
7) and Evans (Ref. 5), Fig. 18 illustrates the relationship of the
Fig. 14 - - Hardness variations along the through-thickness centerline of the SMA C-Mn-Ni welds showing the effect of manganese on the weld metal hardness.
nickel and man- ganese contents and the volume fraction of acicular ferrite formed in the as-de- posited C-Mn-Ni weld metals with car- bon levels of 0.04-0.05%. This fig- ure reveals that there is an optimum com- positional range of the nickel and man- ganese contents for a high percentage of acicular ferrite. A combination of the nickel and man- ganese contents in- side this range would
produce acicular ferrite of 70-85%, while compositions outside the range would either result in a large amount of proeutectoid ferrite or introduce a high percentage of martensite, both of which could lead to poor toughness.
It should be particularly noted that martensite will form in the weld metal microstructure when the addition of manganese and nickel is not properly balanced. As shown in Fig. 19, there is a martensite start line (M~) that lies in the composition region where the highest percentage of acicular ferrite was ob- tained. This line was determined from detailed optical examination (Ref. 8). In the A2, B3 and C1 weld deposits, the combination of the nickel and man- ganese contents were beyond the martensite start line. Even though there was a large amount of acicular ferrite in their microstructures in the top bead (i.e., 79% in the A2 weld, 63% in B3 and 67% in C1), there was also some martensite being produced simultaneously in these welds, particularly in high-nickel-con- tent welds (i.e., 30% in the B3 weld and 22% in C1 ). The as-deposited A1, B1 and B2 welds, on the other hand, possessed a reasonably high percentage of acicular ferrite (i.e., 77% in the A1,57% in the B1 and 61% in the B2 weld, respectively) but no martensite, because the combina- tion of their nickel and manganese con- tents were well away from the martensite line. Once martensite is present (and ac- companied by other undesirable fea- tures, such as segregation structures), the toughness of the weld metals would be seriously impaired. This explains the in- dications in Figs. 15 and 16 that the op- timum toughness values were obtained from the weld metals in which the nickel + manganese content was well away
192-s I MAY 1997

25O
~200
1501'-
~ 50;-
T "0 " .4,0 w i l d / 1 . 0 % N i
-6- At weld J A2 weld A~ •
0 -I00 -80 -60 -40 -20 0 20 40
Testtempereture ( 'C)
250r i
- ,k- B1 w e l d I i 2.5%Ni
B2 weld I ~ I a, 2001 -e- B3 weld I •
~5ot- |
i 1ool-
0 I I I I I I / - 1 0 0 -80 -60 -40 -20 0 20
Test temperature ( °C )
Fig. 15 - - Effect o f nickel on the Charpy impact curves. A - - Manganese content 1.6%; B - - manganese content 0.7%.
40
250,
200
c e 150
"~1oo & .t
~ 50
i -~ CI weld / -e- B3 weld
0.3%Mn
/
~ M n
0 I I I I I
-100 -80 -60 -40 -20 0 20 40 Test temperature ( "C )
Fig. 16 - - Effect o f manganese on the Charpy impact curves (5.5% NiL
v
1
t " S
t40
@ 0 0
A F
M
1 2
AF
3 4 8 The nk~k~ m In me m (v~%)
Fig. 17 - - Influence o f nickel content on weld metal microstructure (PF(G): grain boundary ferrite; FS(A): ferrite sideplates; AF: acicular fer- rite; M: Martens#e).
from the M~ line and beyond the proeu- tectoid ferrite-rich area.
Toughness of the CoMn-Ni Weld Metals and the Effect of Nickel and Manganese
From the data shown in Table 4 and Figs. 15 and 16, it can be seen that at a high manganese level (1.6% Mn), an ad- dition of 1.0% nickel provided the best toughness throughout the range from 20 to -80°C, while a 2.5% Ni content sub- stantially depressed toughness. With a lower manganese level (0.7% Mn), the addition of a medium amount of nickel (2.5-3.5%) displayed satisfactory tough- ness, and particularly improved the toughness at low temperatures (e.g., at ~ 0 ° C to N-60°C). When the nickel con- tent was increased to 5.5%, however, the toughness dropped dramatically. These results can be understood by considering the microstructural variations with the
change in chemical composition. For ex- ample, in the B3 and C1 welds, the ad- dition of 5.5% Ni resulted in a consider- able amount of martensite being introduced into the weld metals, the re- heated regions were not refined as usual, a severe segregation structure appeared, and very large columnar grains were ob- tained. All these would have a deleteri- ous effect on the weld metal toughness. The reasons for the poor performance of the A2 weld were similar to the above but did not depend on the columnar grain size effect.
The effects of columnar grain size and the segregation structures were clearly observed from the SEM examination of the fracture surface of the impact speci- mens, as shown by Figs. 20-22 (speci- mens were tested at -50°C). With the B1 weld, the fractures normally went across the columnar grains and were dominated by quasi-cleavage - - Fig. 20. In the case
of the B3 (or C1) weld, however, most fractures were intercolumnar and linked by both quasi-cleavage and microvoid coalescence (Fig. 21 ), reflecting the dele- terious effect of larger columnar grains on weld metal toughness. In addition, some parallel features were observed on the fracture surface of the B3 and C1 specimens, as illustrated by Fig. 22, and the width of these features matched that of the segregation pattern. Moreover, EDS analyses demonstrated that the frac- ture surfaces were rich in the main alloy- ing elements, i.e., nickel, manganese and silicon (Ref. 8). These suggest a relation- ship between the segregation structures and the crack path of the fracture during the impact testing. The morphology changes in acicular ferrite, particularly in the A2, B3 and C1 welds, could also con- tribute a deleterious effect on the weld metal toughness as has been discussed previously (Ref. 15).
WELDING RESEARCH SUPPLEMENT I 193-s

i i i
E |
a |
1 ; I m , i
. |
B:I
J I
I 1 1 m !
I
I I
I 1 |
i n | r
UI I n : : l
L I I
|:1 i
~i l l l
U:I
U I
N:: :1 I'.! 1
g : : l
i i
mp i i i
U : I
i
; l l ; i
!
h ;;
2.5[ ~ . . . . M A R T E N S I T E
~ 1 . 5 ~ AF>70% ~ : , , A,F<40%
~ O . S
0 1 2 3 4 5 6
Nicke l c o n t e n t in w e l d ( w t % )
Fig. 18 - - Influence of the manganese and nickel contents on the vol- ume fraction of acicular ferrite in weld metal (carbon level: 0.04-0.05%) ( • current results; • after Harrison and Farrar (Refs. 6, 7); • after Evans (Ref. 5).
2.51 i . : i i i " - . M A R T E N S r r E
- ~ I M s t a r t li11~ " " ~ ' - ~ ' I d ' " : : : ' " " ' . ~c'~:
: I . . . . . . . . . , - , , ~ \ " : ' . ' . ' ~ < ~
zZ:I u 1 . . . . . . . . . . . • "- " . " " . .
~ 30 " - . .
AF<40% " " " - . " " • . 22
0 1 2 3 4 5 6
N icke l c o n t e n t in w @ d ( w t % )
Fig. 19 - - Figure 18 with the martensite start l ine (values are volume fraction of martensite) ( • current results; • after Harrison and Farrar (Refs. 6, 7); • after Evans (Ref. 5)).
Fig. 20 - - Fractograph showing a high density of quasi-cleavage fracture on the BI weld impact specimen (-50°C).
The toughness results again indicate that the addition of nickel and man- ganese should be carefully balanced. Different manganese levels require dif- ferent nickel contents. For the best low- temperature impact toughness (i.e., >120 J at -50°C), the following combinations of the manganese and nickel contents are suggested, i.e., 0.6-1.4% Mn and 1.0-3.7% Ni. This is illustrated by Fig. 23, which shows the relationship be- tween the nickel and manganese con- tents and weld metal toughness at-50°C. The figure is based on the current studies and data reported by Evans (Ref. 5). If the addition of nickel exceeds these limits, i.e., 2.5% Ni for 1.6% Mn or 5.5% Ni for 0.7% Mn, the properties will be consid- erably impaired because of the introduc- tion of martensite and a microsegrega-
tion effect in the microstructure (Ref. 14) coupled with the additional possibility of coarsened austenite grains.
It is generally believed that 80-90% acicular ferrite content in an as-de- posited weld is necessary to obtain satis- factory toughness at low temperatures (e.g. -50 to --60°C) (Ref. 23). However, comparing the weld low-temperature toughness variations shown in Fig. 23 with the microstructural changes corre- sponding to the manganese and nickel contents (Fig. 18), it was noted that the best toughness (i.e., impact energy >120 J a t -50°C) was associated with mi- crostructures consisting of 50-75% acic- ular ferrite with other proeutectoid ferrite components. The microstructures con- taining higher acicular ferrite (e.g., >75%), on the other hand, did not pro-
vide expected properties. This indicates that a finer microstructure may not be al- ways beneficial to weld metal toughness when the deposits are overalloyed, as re- ported by Munning Schmidt-Van Derr Burg, et al. (Ref. 24), and more recently by Svensson and Gretoft (Ref. 23). Some- times, a simultaneous increase in hard- ness and strength, and other microstruc- tural changes, such as the presence of segregation structures and/or martensite (as discussed above) could offset the pos- itive effects of fine-grained acicular fer- rite, although acicular ferrite might be produced in an increased amount. Therefore, care should be taken when trying to obtain a high proportion of aci- cular ferrite by increasing alloy contents. In their review, Farrar and Harrison (Ref. 3) have concluded that the best combi-
194-s I MAY 1997

Fig. 21 - - Fractograph showing intercolumnar t?acture linked by both quasi-cleavage and microvoid coalescence (as indicated by arrows) on the B3 weld impact specimen (-50°C).
nickel contents at two distinct levels of manganese, namely 1.6 and 0.7 wt-% (i.e., the weld series A O - A 2 a n d s e r i e s
B1-B3), reveals that as the tensile strength rises in the two series, the Charpy V-notch impact energies (at -50°C) decrease by ~70% in both cases.
nation of properties of low-alloy weld metals could be obtained when there was more than 65% acicular ferrite. Svensson and Gretoft (Ref. 23) further pointed out the positive effect of only 50% acicular ferrite. This requirement for the optimum acicular ferrite content is consistent with the value range suggested by the results of the current work. It can be concluded that in the alloying prac- tice of low-alloy weld consumables, the essential principle should be an optimum microstructural combination dominated by acicular ferrite rather than merely the highest level of acicular ferrite content, i.e., achieving high enough proportion of acicular ferrite and, at the same time, en- suring the least presence of microsegre- gation structures and martensite, and without too high matrix hardness and strength.
Nevertheless, it should be noted that for an ideal weld, it is desirable to achieve both excellent low-temperature toughness and adequate yield strength, a combination required for critical indus- trial structures. To further evaluate the impact results and the effect of nickel and manganese from the point of view of a combination of strength and toughness, the average hardness of the microstruc- ture that was sampled by the notch in the Charpy specimens was measured, and the approximate tensile strength of the area was determined from the Vickers Pyramidal hardness number (VPN), as shown in Table 6.
Considering the impact test results shown in Table 4, together with the ten- sile strengths (and by implication, the yield strengths) shown in Table 6, it is ev- ident that both the strength and the im- pact properties are a function of alloying content. The effects of increasing the
This suggests that high strength and high toughness weld metals can be achieved at high nickel concentra- tions only if the manganese level is re- duced below 0.7 wt-%.
Conclusions
Fig. 22 - - Fractograph showing fracture with parallel features on the C1 weld impact specimen ( -50°0.
A systematic study of the microstruc- ture and mechanical properties of the SMA C-Mn-Ni all-deposited weld metals has been carried out, and the following conclusions can be drawn:
1) The microstructure of the C-Mn-Ni
weld metals consisted mainly of grain boundary ferrite, ferrite sideplates and fine-grained acicular ferrite, and is dom- inated by acicular ferrite, the proportions being dependent upon the chemical composition (e.g., manganese and nickel) of the welds.
2) The effect of manganese was to pro- mote acicular ferrite at the expense of proeutectoid ferrite. It was noted that manganese has a stronger potential in suppressing the formation of sideplate
Table 6 - - Average Hardness of Microstructure sampled by the Charpy Notch and the Corresponding Tensile Strength of the Same Area
Weld VPN Tensile Strength ca~ Code (Load: 10 kg) (MPa)
A0 210 675 A1 219 720 A2 281 931 B1 219 720 B2 224 745 B3 298 985 C1 271 904
(a) The tensile strength values were determined using the Vickers hardness numbers according to the ASM Metals Handbook(Ref.25).
WELDING RESEARCH SUPPLEMENT I 195°S

1.5f " '0 •
0 . 0 1 t t t t 0 1 2 3 4
i
5
Nickel content In weld ( wt% )
toughness was associ- ated with welds of 1 .6%Mn-1.0%Ni and 0.7%Mn-2.5 to ~3.5%Ni. Weld metals with higher nickel con- tents (i.e., 2.5% for 1.6% Mn level and 5.5% for 0.7-0.3% Mn levels) ex- hibited poor toughness due to the formation of martensite, the presence of the coarsened colum- nar grains, a segregation structure and possibly an inherited structure in the
s reheated regions. 7) A combinat ion of
50-75% acicular ferrite with grain boundary proeutectoid ferrite structures provided the best toughness, whilst a very high proportion of
acicular ferrite, but which was associated with other microstructural features, such as martensite and segregation structures, (and hence high matrix hardness/ strength) produced poor properties.
Fig. 23 - - Influence of weld metal nickel and manganese contents on Charpy energy (J) at -50°C. ( • current results; • after Evans (Ref. 5).
structures compared to nickel. 3) With increasing nickel content the
amount of grain boundary ferrite de- creased and acicular ferrite increased as observed with increases in manganese content. At high nickel content, some martensite was formed.
4) Nickel also influences weld mi- crostructure through changing the columnar grain size. The addi t ion of nickel initially refined the prior austenite grain size but further additions caused it to rapidly coarsen.
5) A high nickel content, thus high matrix hardenability, induced a "struc- ture inheritance" effect in the reheated regions that inhibited further refinement. High nickel content also encouraged a "microsegregat ion" structure that ap- peared as a martensitic structural band- ing in the as-deposited weld and hence precipitated a network or parallel mor- phologies of carbides in the lower-tem- perature reheated regions.
6) The toughness and hardness of the C-Mn-Ni weld deposits varied according to the alloying contents (i.e., the nickel and manganese concentrations), and re- sultant weld metal microstructure. An ex- cel lent combinat ion of strength and
Acknowledgments
The authors wish to thank Metrode Products Limited, Chertsey, Surrey, Eng- land, for sponsoring the project. Sincere thanks are extended to Dr. J. C. Farrar, Dr. G. S. Barritte and Mr. P. Stubbington for assistance in preparing welds and many helpful discussions during the progress of this work.
References
1. Abson, D. J., and Pargeter, R. J. 1986. Inter. Metal Rev., 31 :I 41-194.
2. Grong, O., and Matlock, D. K. 1986. Inter. Metal Rev., 31 : 27-48.
3. Farrar, R. A., and Harrison, P. L. 1987. J. Mater. Sci., 22: pp. 239-244.
4. Taylor, D. S., and Evans, G. M. 1983. Metal Constr., 15: pp. 438-443.
5. Evans, G. M. 1991. Joining Sciences, 1 : pp. 2-13.
6. Harrison, P. L., and Farrar, R. A. 1987. Metal Constr., 19: pp. 392R-399R and
447R450R. 7. Harrison, P. L. 1983. Ph.D. thesis, Uni-
versity of Southampton, Southampton, U.K. 8. Zhang, Z. 1994. Ph.D. thesis, University
of Southampton, Southampton, U.K. 9. Farrar, R. A., and Zhang, Z. 1993. Proc.
of The 6th International Conference of JOM, April 4-6, 1993. European Institute of Joining of Materials, Helsingor, Denmark, pp. 397-404.
10. Abson, D. J. 1993. Welding Journal, 72(5): 173-s to 187-s.
11. Surian, E. S., Trotti, J. L., and Bon- iszewski, T. 1992. Welding Journal, 71(7): 263-s to 268-s.
12. Pickering, F. B. 1975. Paper presented at conference on Quantitative and Qualitative Metallurgy, Sheffield, U.K., July 17-18, 1975, The Institute of Metallurgical Technicians.
13. Davey, T. G., and Widgery, D. J. 1976. The Welding Institute, Abington, England, DOC. II-A-389-76, 1976.
14. Zhang, Z., and Farrar, R. A. 1995. Columnar grain development in C-Mn-Ni low alloy weld metals and the influence of nickel. J. Mater. Sci., 30: pp. 5581-5588.
15. Farrar, R. A., and Zhang, Z. 1995. As- pect ratios of acicular ferrite in Ni bearing weld metals. Mat. Sci. Tech. 11 : pp. 759-764.
16. Zhang, Q., and Farrar, R. A. 1994. A study of the precipitation structures in C-Mn- Ni SMA weld metals. Research Report, Uni- versity of Southampton, Southampton, U.K. M E/94/13.
17. Farrar, R. A., Zhang, Z., Bannister, S. R., and Barritte, G. S., 1993. J. Mater. Sci., 28: pp. 1385-1390.
18. Zhang, Z., and Li, Z., etal. 1989. Proc. of The 4th International Conference of JOM, March 19-22, 1989. European Institute of Joining and Materials, Helsingor, Denmark, pp. 397-404.
19. Evans, G. M. 1988. Joining and Mate- rials, 1 : pp. 239s-246s.
20. Evans, G. M. 1989. Weld. Metal Fabr., Aug./Sep., pp. 346-358.
21. Evans, G. M. 1986. Metal Constr., 18: pp. 438R-444R.
22. Grange, R. A. 1973. Metall. Trans., 4: pp. 2231-2244.
23. Svensson, L.-E., and Gretoft, B. 1990. Welding Journal, 69(12): 454-s to 461-s.
24. Munning Schmidt-Van Derr Burg, M. A., Hoekstra, S., and Den Ouden, G. 1985. Welding Journal, 64(3): 63-s to 70-s.
25. Boyer, H. E., and Gall, T. L. 1984. ASM Metals Handbook, Desk Edition, ASM, Mate- rials Park, Ohio.
196-s I MAY 1997