influence of melanosome dynamics on melanoma drug sensitivity
TRANSCRIPT

jnci.oxfordjournals.org JNCI | Articles 1259
Malignant melanomas, responsible for more than 8000 deaths each year in the United States (see www . cancer . gov ), are intrinsically resis-tant to treatments such as radiation and conventional chemother-apy. Despite promising new therapeutic approaches such as immunochemotherapy, biochemotherapy, and targeting of mela-noma stem cells ( 1 – 6 ), the precise causes that underlie therapeutic resistance in melanomas remain elusive ( 7 ). Proposed mechanisms involve drug-detoxifying properties of melanosomes ( 8 ), energy-dependent drug efflux pumps ( 9 – 13 ), overexpression of inhibitors of apoptosis ( 14 – 16 ), altered expression of oncogenes or tumor suppressors ( 14 – 16 ), and endogenous nitric oxide ( 17 ). Clearly, determining the predominant drug-resistance mechanisms and how to reverse or circumvent them would be key steps in develop-ing effective new therapies and improving therapeutic outcomes for melanoma patients.
In terms of cell structure, the major difference between mela-noma and nonmelanoma cancer cells lies in the production of melanosomes, which are unique membrane-bound organelles
adapted for melanin synthesis by pigment-producing cells ( 18 – 20 ). Based on morphological characteristics, melanosomes can be classi-fi ed into four distinct stages (I, II, III, and IV) along their biogenesis pathway ( 18 , 19 ). Stage I melanosomes are lysosome-like spherical organelles with an undefi ned internal matrix, whereas stage II mel-anosomes are typically elongated and contain a distinctive fi brillar
Affiliations of authors: Laboratory of Cell Biology, National Cancer Institute (KGC, JCV, COC, WDV, VJH, MMG), and Laboratory of Bioengineering and Physical Science, National Institute of Biomedical Imaging and Bioengineering (RDL, GZ), National Institutes of Health, Bethesda, MD; Advanced Photon Source , Argonne National Laboratory, Argonne, IL (BL) .
Correspondence to: Michael M. Gottesman, MD, Laboratory of Cell Biology, National Cancer Institute, National Institutes of Health, Bldg 37, Rm 2108, Bethesda, MD 20892 (e-mail: [email protected] ).
See “Funding” and “Notes” following “References.”
DOI: 10.1093/jnci/djp259
Published by Oxford University Press 2009.
ARTICLE
Influence of Melanosome Dynamics on Melanoma Drug Sensitivity Kevin G. Chen , Richard D. Leapman , Guofeng Zhang , Barry Lai , Julio C. Valencia , Carol O. Cardarelli , Wilfred D. Vieira , Vincent J. Hearing , Michael M. Gottesman
Background Malignant melanomas are intrinsically resistant to many conventional treatments, such as radiation and chemotherapy, for reasons that are poorly understood. Here we propose and test a model that explains drug resistance or sensitivity in terms of melanosome dynamics.
Methods The growth and sensitivity to cisplatin of MNT-1 cells, which are melanotic and enriched with mature stage III and IV melanosomes, and SK-MEL-28 cells, which have only immature stage I and II melanosomes, were compared using clonogenic assays. Differences in pigmentation, melanosome stages, melanosome number, and cellular structures in different cell lines in response to various treatments were examined by electron microscopy. The relative numbers of melanosomes of different stages were compared after treat-ment with 1-phenyl-2-thiourea. The relationship between drug transporter function and endogenous mela-nogenic toxicity was assessed by treating cells with the cyclosporin analog PSC-833 and by assessing vacuole formation and cell growth inhibition. All statistical tests were two-sided.
Results Endogenous melanogenic cytotoxicity, produced by damaged melanosomes, resulted in pronounced cell growth inhibition in MNT-1 cells compared with amelanotic SK-MEL-28 cells. The sensitivity to CDDP of MNT-1 cells was 3.8-fold higher than that of SK-MEL-28 cells (mean IC 50 for SK-MEL-28 and MNT-1 = 2.13 μ M and 0.56 μ M, respectively; difference = 1.57 μ M, 95% confidence interval = 1.45 to 1.69; P = .0017). After treatment with 6.7 μ M CDDP for 72 hours, the number of stage II-III melanosomes in surviving MNT-1 cells was 6.8-fold that of untreated cells. Modulation of MNT-1 cells to earlier-stage (II, II-III, III) melanosomes by treatment with the tyrosinase inhibitor 1-phenyl-2-thiourea dramatically increased CDDP resistance. Furthermore, PSC-833 principally suppressed MNT-1 melanotic cell growth via an elevation of autophagosome-like vacuolar structures, possibly by inhibiting melanosome membrane transporters.
Conclusions Melanosome dynamics (including their biogenesis, density, status, and structural integrity) regulate the drug resistance of melanoma cells. Manipulation of melanosome functions may be an effective way to enhance the therapeutic activity of anticancer drugs against melanoma.
J Natl Cancer Inst 2009;101:1259–1271
Downloaded from https://academic.oup.com/jnci/article-abstract/101/18/1259/2515657by gueston 25 March 2018

1260 Articles | JNCI Vol. 101, Issue 18 | September 16, 2009
matrix. Both stage I and II melanosomes are also known as early melanosomes or premelanosomes because they have not initiated melanin synthesis. In contrast, stage III melanosomes are character-ized by the active synthesis of melanin, which results in the deposi-tion of black electron-dense pigment on the fi brillar matrix. Finally, stage IV melanosomes are fully mature and little internal structure is visible because they are completely packed with melanin. In this study, stage IV* denotes damaged or disintegrated melanosomes.
During melanin synthesis, intermediates such as 5,6-dihydroxy-indole, 5,6-dihydroxyindole-2-carboxylic acid and other cytotoxic metabolites are also produced. Leakage of these toxic substances from melanosomes into the cytoplasm leads to cytotoxic effects that are referred to as endogenous melanogenic cytotoxicity (EMC). Thus, melanosomes are also involved in scavenging endogenous cytotoxic metabolites generated during melanogenesis and storing these waste products ( 8 , 19 ). Previous research suggests that these organelles are also important in the development of drug resistance. A melanogenic enzyme, tyrosinase-related protein-2 (TYRP2), has been implicated in cisplatin (cis-diaminedichloro-platinum II, CDDP) resistance in melanoma ( 21 , 22 ). We have recently demonstrated that both melanosomal trapping and export of cytotoxic drugs such as CDDP are involved in drug resistance in melanomas ( 8 ), and these fi ndings suggest possible therapeutic approaches to circumvent this resistance by inhibiting the intra-cellular trapping of cytotoxic drugs in melanoma cells. It would be important to verify whether manipulating melanosome functions
and dynamics could be a practical approach to enhance chemosen-sitivity in melanoma cells.
In this study, to understand the cellular principles underlying drug sensitivity and resistance in melanoma, we focused on the role of melanosome dynamics (including the biogenesis of premelano-somes, changes in melanosome numbers, melanosome status, and the integrity of melanosome structures) in determining drug sensitivity in melanoma cells. Our aim was to develop rational experimental approaches to targeting melanomas by altering mela-nogenic pathways using various chemicals or anticancer drugs, some of which have already been used in clinical practice or are now in clinical trials.
Materials and Methods Chemicals and Drugs
CDDP, doxorubicin, verapamil, vinblastine, 1-phenyl-2-thiourea (PTU), and 3-(4,5-dimethylthiazol-2-yl)-2,5-diphenyl tetrazolium bromide (MTT) were obtained from Sigma-Aldrich (St. Louis, MO). The cyclosporin analog SDZ PSC-833 (PSC), also known as valspodar, was provided by Dr B. I. Sikic (Stanford University, CA).
Cells and Cell Culture
Cancer cell lines used in this study include three human melanotic melanoma cell lines (MNT-1, FEMX, and UACC-257), three human amelanotic melanoma cell lines (SK-MEL-28, SK-MEL-24, and M14), one melanotic mouse melanoma cell line B16F10 (American Type Culture Collection, Manassas, VA), and one non-melanoma control cell line KB-3-1 (derived from the HeLa cervi-cal adenocarcinoma and maintained in our laboratory) ( 8 , 11 ). MNT-1 is a highly pigmented melanotic cell line frequently used for pigmentation research, as previously described ( 8 , 23 – 25 ). SK-MEL-24 was obtained from American Type Culture Collection, whereas FEMX was from our laboratory. SK-MEL-28, UACC-257, and M14 were obtained from the National Cancer Institute (Frederick, MD). MNT-1 cells contain melanosomes in all stages (ie, stages I – IV), whereas SK-MEL-28 cells (American Type Culture Collection HTB-72) have only stage I and II melanosomes ( 8 , 25 ). To facilitate comparative study, all cancer cell lines were maintained in Dulbecco’s Modified Eagle Medium (Invitrogen Inc, Carlsbad, CA) containing high glucose, pyridoxine HCl, and 110 mg/L sodium pyruvate, 10% fetal bovine serum, 100 U/mL penicillin G, 100 μ g/mL streptomycin sulfate, and 2 mM glutamine. The cells were incubated at 37°C with 5% CO 2 . Regularly cultivated MNT-1 cells were passaged at a 1:8 dilution when cultures were 80% confluent in a 75-cm 2 culture flask. Variation of the pigmentation was occasionally observed. These cells were mainly used as controls in clonogenic assays in this study. Alternatively, MNT-1 cells were stably maintained in a highly pigmented status (melanin content ≥ 120 μ g/10 6 cells, Supplementary Figure 1 , A , available online) by continuous passage of the cells under higher density culture conditions (ie, cells passaged at a 1:4 dilution). These cells were used in all experiments in this study. The immortal melanocyte cell lines melan-a and melan-c, derived from wild-type (a/a, Uw/Uw, Tyr/Tyr) and albino (a/a, Uw/Uw, tyrc/tyrc) C57BL/6J mice, respectively ( 26 ), were cultured as previously described ( 27 ). The altered pigmentation
CONTEXT AND CAVEATS
Prior knowledge
Melanoma is intrinsically resistant to treatments such as radiation and conventional chemotherapy. In addition to cytotoxic effects from by-products of melanin synthesis, melanosomes are involved in drug trapping and export.
Study design
The relationship between melanosome dynamics and drug resistance was studied using microscopy methods and growth assays in a variety of melanoma cell lines. Numbers of melano-somes and their distribution according to stage were altered pharmacologically.
Contribution
This work suggested that stage IV melanosomes increase drug sensitivity through cytotoxic effects and that melanosomes at stages II and III may decrease sensitivity to a chemotherapy drug used to treat melanoma. The results raise the possibility that inter-ventions that alter melanosome numbers and stages could provide a means to increase cellular sensitivity to chemotherapy drugs.
Implications
The usefulness of interventions to increase chemotherapy drug sensitivity by altering melanosome dynamics should be investigated.
Limitations
The results reported in this study were based on in vitro studies using immortalized cell lines. Further validation in animal models is needed.
From the Editors
Downloaded from https://academic.oup.com/jnci/article-abstract/101/18/1259/2515657by gueston 25 March 2018

jnci.oxfordjournals.org JNCI | Articles 1261
and melanosome status were monitored by comparative electron microscopic analysis.
Measurement of Melanin Content
The cell pellets were dissolved in 1 M sodium hydroxide and the melanin content was determined by measuring the absorbance between 405 and 490 nm and compared with melanin standards (Sigma-Aldrich). The melanin content was normalized to protein input as described ( 8 ) or to total cell numbers ( Supplementary Table 1 , Supplementary Figure 1 , A , available online).
Electron Microscopy (EM)
MNT-1 melanoma cells treated with different drugs were prepared for EM analysis by the methods as previously described ( 8 ). Briefly, cultured cells were detached from culture dishes by incubation in Trypsin – EDTA and washed in Dulbecco ’ s Phosphate-Buffered Saline (Invitrogen Inc). The cells were processed by high-pressure freezing and freeze substitution in acetone and glutaraldehyde and embedded in LR White or Lowicryl HM20 resin (Electron Microscopy Sciences, Hatfield, PA). A 300-nm section of sample, stained with 2% uranyl acetate and lead citrate, was analyzed by using an FEI CM120 transmission electron microscope equipped with a Gatan GIF100 image filter (Hillsboro , OR). This EM method is referred to as conventional EM in this study. Unstained images were used for determining the stages of melanosomes according to the intensity of melanin pigments, because melanin-containing melanosomes are well displayed in these unstained EM (UEM) images. To determine melanosome numbers, an intact 300-mm sectional image was obtained by montage of several indi-vidual EM images, and melanosome numbers were directly counted from the montaged images. This EM method is referred to as quantitative EM in this study.
X-ray Microprobe Mapping
Unstained sections obtained as described above were also imaged in a 300-kV transmission electron microscope and then further analyzed using the 2-ID-D fluorescence X-ray microprobe at the Advanced Photon Source (Argonne National Laboratory, Argonne, IL) as previously reported ( 8 ).
Indirect Immunofluorescence and Confocal Microscopy
Immunofluorescence microscopic analysis of expression and local-ization of stage II melanosomes was performed using the Axiovert 200 microscope and an LSM 510 confocal microscope (Carl Zeiss Inc, Munich, Germany) ( 8 , 25 ). Images were analyzed by colocal-ization software (Carl Zeiss Inc).
Clonogenic Assay of Cellular Drug Sensitivity
Clonogenic assays of drug sensitivity were performed by two investigators using slightly different protocols in melanoma cells, their derivatives, and control cells. Approximately 1000 cells were seeded in 60-mm cell culture dishes. The cells were treated with freshly made cytotoxic drugs for 3 days, and surviving colonies were stained with 0.5% methylene blue and counted on days 10 to 14 after removal of the drug-containing medium. Alternatively, 300 cells were seeded in 60-mm cell culture dishes, treated with drugs for 8 – 12 days, stained, and counted as above. Cytotoxic
dose – response curves or bar graphs were generated by Microsoft Excel (Microsoft Corporation, Bellevue, WA ). The two protocols generated similar IC 50 values (ie, drug concentrations that inhibit 50% of cell growth) for melanoma cells (eg, 2.1 μ M and 2.4 μ M CDDP for SK-MEL-28 cells, respectively, in Figure 3, B , Supplementary Figure 1 , B , available online).
MTT Assays for Cellular Drug Sensitivity
Cellular drug sensitivity was evaluated in both melan-a and melan-c cells by the MTT assay in quadruplicate as previously described ( 28 ).
Statistical Analysis
Mean, SDs, variance, Pearson correlation ( r ), and unpaired t test (with two-tail and two-sample unequal variance) were generated from Microsoft Excel 2004 version 11.3.7 (Microsoft Corporation). Error bars correspond to 95% confidence intervals (CIs). All statistical tests were two-sided and the threshold for statistical significance was .05.
Results Melanogenesis and Endogenous Melanogenic Cytotoxicity
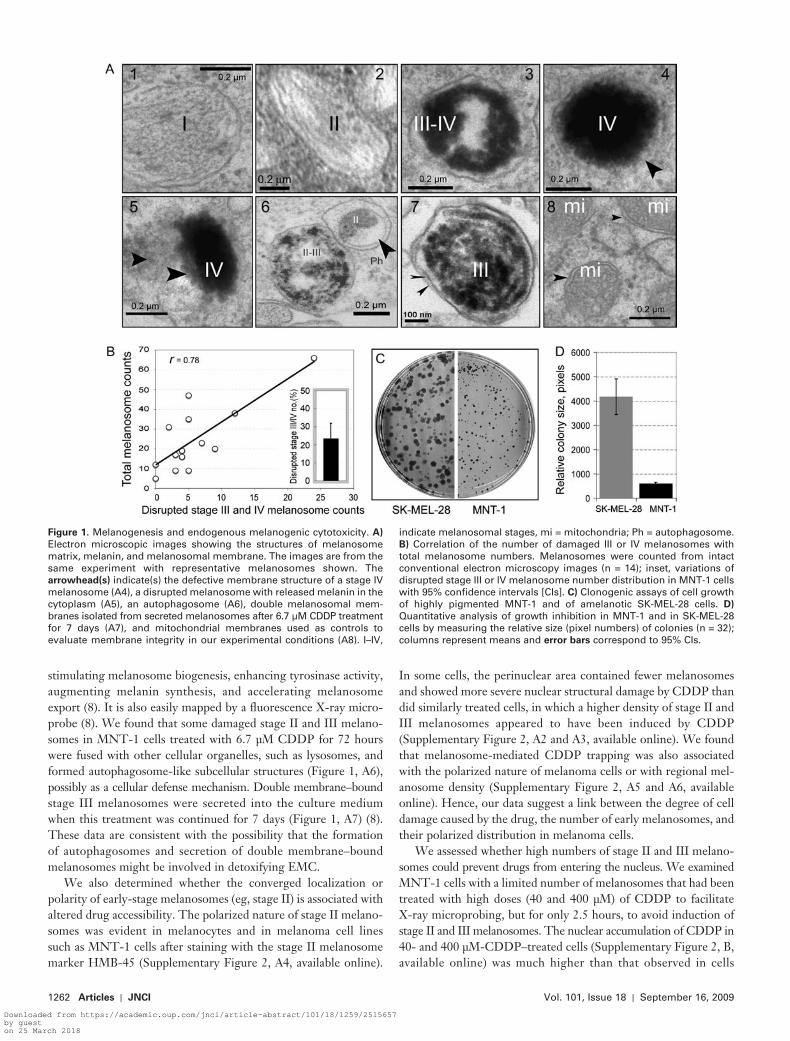
To explore the role of melanosome stages and numbers in contrib-uting to EMC in melanotic melanoma cells, we used quantitative EM to examine melanosome dynamics in melanotic MNT-1 cells. These cells had an intact melanosome biogenesis pathway, as evi-dent by the presence of different stages of melanosomes ( Figure 1, A1 – 4 ). Highly pigmented melanosomes (eg, stage IV) frequently exhibited defective membrane structures ( Figure 1, A4 ) compared with the membranes of stage I and II melanosomes and with mito-chondrial membranes (used as a membrane control) ( Figure 1, A , 1, 2, 8). In untreated MNT-1 cells, some melanosomes with defec-tive membranes released melanin or melanin-containing struc-tures into the cytoplasm ( Figure 1, A5 ), an indicator of EMC. In MNT-1 cells, the melanin content ranged from 120 to 160 μ g melanin/10 6 cells ( Supplementary Figure 1 , A , available online). Approximately 23% of melanosomes in MNT-1 cells were dam-aged (95% CI = 15% to 32%) as determined by quantitative analy-sis of EM images (n = 14), and the number of damaged stage III or IV melanosomes in MNT-1 cells correlated with their total melanosome counts ( r = .78) ( Figure 1, B ). Furthermore, in MNT-1 cells, damaged melanosome – mediated cytotoxicity was associated with an approximate 6.7-fold cell growth inhibition compared with amelanotic SK-MEL-28 cells, as determined by measuring the relative size (numbers of pixels in field) of imaged colonies (mean number of pixels for SK-MEL-28 and MNT-1 = 4178 and 609, respectively; difference = 3569, 95% CI = 2897 to 4240; P < .001) ( Figure 1, C and D ). These results suggest that late-stage melano-somes (eg, stage IV), but not stage II or III melanosome numbers, are associated with the development of EMC in melanotic melanoma cells.
We next examined whether certain melanosomes with altered structures are involved in detoxifying EMC in the presence of cytotoxic drugs. We chose CDDP, a potent anticancer drug used to treat many types of malignant tumors including melanomas ( 1 – 3 , 5 ), because it affects the entire melanogenic pathway by
Downloaded from https://academic.oup.com/jnci/article-abstract/101/18/1259/2515657by gueston 25 March 2018
1262 Articles | JNCI Vol. 101, Issue 18 | September 16, 2009
stimulating melanosome biogenesis, enhancing tyrosinase activity, augmenting melanin synthesis, and accelerating melanosome export ( 8 ). It is also easily mapped by a fl uorescence X-ray micro-probe ( 8 ). We found that some damaged stage II and III melano-somes in MNT-1 cells treated with 6.7 μ M CDDP for 72 hours were fused with other cellular organelles, such as lysosomes, and formed autophagosome-like subcellular structures ( Figure 1, A6 ), possibly as a cellular defense mechanism. Double membrane – bound stage III melanosomes were secreted into the culture medium when this treatment was continued for 7 days ( Figure 1, A7 ) ( 8 ). These data are consistent with the possibility that the formation of autophagosomes and secretion of double membrane – bound melanosomes might be involved in detoxifying EMC.
We also determined whether the converged localization or polarity of early-stage melanosomes (eg, stage II) is associated with altered drug accessibility. The polarized nature of stage II melano-somes was evident in melanocytes and in melanoma cell lines such as MNT-1 cells after staining with the stage II melanosome marker HMB-45 ( Supplementary Figure 2 , A4 , available online).
In some cells, the perinuclear area contained fewer melanosomes and showed more severe nuclear structural damage by CDDP than did similarly treated cells, in which a higher density of stage II and III melanosomes appeared to have been induced by CDDP ( Supplementary Figure 2 , A2 and A3 , available online). We found that melanosome-mediated CDDP trapping was also associated with the polarized nature of melanoma cells or with regional mel-anosome density ( Supplementary Figure 2 , A5 and A6 , available online). Hence, our data suggest a link between the degree of cell damage caused by the drug, the number of early melanosomes, and their polarized distribution in melanoma cells.
We assessed whether high numbers of stage II and III melano-somes could prevent drugs from entering the nucleus. We examined MNT-1 cells with a limited number of melanosomes that had been treated with high doses (40 and 400 μ M) of CDDP to facilitate X-ray microprobing, but for only 2.5 hours, to avoid induction of stage II and III melanosomes. The nuclear accumulation of CDDP in 40- and 400 μ M-CDDP – treated cells ( Supplementary Figure 2 , B , available online) was much higher than that observed in cells
Figure 1 . Melanogenesis and endogenous melanogenic cytotoxicity. A ) Electron microscopic images showing the structures of melanosome matrix, melanin, and melanosomal membrane. The images are from the same experiment with representative melanosomes shown. The arrowhead(s) indicate(s) the defective membrane structure of a stage IV melanosome (A4), a disrupted melanosome with released melanin in the cytoplasm (A5), an autophagosome (A6), double melanosomal mem-branes isolated from secreted melanosomes after 6.7 μ M CDDP treatment for 7 days (A7), and mitochondrial membranes used as controls to evaluate membrane integrity in our experimental conditions (A8). I – IV,
indicate melanosomal stages, mi = mitochondria; Ph = autophagosome. B ) Correlation of the number of damaged III or IV melanosomes with total melanosome numbers. Melanosomes were counted from intact conventional electron microscopy images (n = 14); inset, variations of disrupted stage III or IV melanosome number distribution in MNT-1 cells with 95% confi dence intervals [CIs]. C ) Clonogenic assays of cell growth of highly pigmented MNT-1 and of amelanotic SK-MEL-28 cells. D ) Quantitative analysis of growth inhibition in MNT-1 and in SK-MEL-28 cells by measuring the relative size (pixel numbers) of colonies (n = 32); columns represent means and error bars correspond to 95% CIs.
Downloaded from https://academic.oup.com/jnci/article-abstract/101/18/1259/2515657by gueston 25 March 2018

jnci.oxfordjournals.org JNCI | Articles 1263
treated with 6.7 μ M CDDP for 72 hours ( Supplementary Figure 2 , A6 , available online), confi rming that CDDP can accumulate in the nuclei of melanotic melanoma cells that lack suffi cient numbers of stage II or III melanosomes. Hence, the biogenesis and presence of stage II or III melanosomes in the cytosol might serve as a buffer system that prevents some cytotoxic drugs from entering the nucleus.
These preliminary data revealed some fundamental differences among melanosomes of different stages (I – IV) in terms of their response to EMC and to cytotoxic drugs. The late-stage (ie, stage IV) melanosomes appeared to be associated with the development of EMC and growth inhibition in melanotic melanoma cells, whereas the earlier-stage melanosomes (eg, stage II) and their polarized distribution in melanoma cells appeared to be associated with detoxifying EMC via melanosome export and inhibiting the nuclear import of cytotoxic drugs. Therefore, we hypothesized that melanosome dynamics and their relationship to EMC might play a role in the regulation of cell growth and drug sensitivity.
A Hypothetical Model That Elucidates Melanosome
Dynamics and Drug Sensitivity
Based on the observations described above and our previous study ( 8 ), we developed a mechanistic cellular model that describes altera-tions of drug sensitivity with progression through the melanogenic pathway ( Figure 2 ). According to this model, the entire melano-genic pathway, which is classified into three phases, is involved in the regulation of drug sensitivity. The first phase includes the biogenesis of premelanosomes (ie, stages I and II) and the initia-tion of pigmentation on the melanosomal matrix (stages II-III).
In this phase, melanosomal function is activated to trap chemicals for melanin synthesis as well as to scavenge cytoplasmic melanin intermediates that are leaked from late-stage melanosomes. The earlier-stage melanosomes might have a protective role in normal pigment-producing cells, whereas in the context of melanoma, they would render the cells drug resistant ( 8 ). The middle transi-tion phase would be characterized by melanosomes transitioning between stages II and III, those at stage III, and those transitioning between stages III and IV; stabilization of melanosomes at this stage may be important to maintain homeostasis both in melanoma cells and in pigment-producing cells. In this phase, most mela-noma cells are likely to be drug resistant ( Figure 2, A ). During the last phase, in which melanosomes are at stages III-IV, IV, and IV* ( Figure 2, A ), the melanosome maturation process leads to the maximal EMC, which the cells must overcome to survive. One way to overcome the EMC is to export the melanosomes. Export of melanosomes occurs naturally in normal pigment-producing cells , but this process may be impaired in melanoma cells. At the last phase, the melanoma cells are more sensitive to cytotoxic drugs. Thus, in our model, the entire melanosome biogenic pathway is involved in the regulation of drug resistance in pigment-producing cells.
Stages of Melanosomes, Melanin Content, and CDDP
Sensitivity
To test our model regarding the role of early-stage (I and II) and late-stage (III and IV) melanosomes in conferring drug resistance or sensitivity, we compared the CDDP sensitivity between amel-anotic SK-MEL-28 cells (that possess only stage I and II melano-somes without producing melanin) and highly pigmented MNT-1
Figure 2 . Schema of melanosomal pathway – -based cellular drug-resistance mechanisms. A ) A mechanistic cellular model that delin-eates alterations of endogenous cytotoxicity and drug resistance or sensitivity in three major phases ( color-coded areas ) of the mel-anosomal pathway. The melanosome stages are further divided into stages I, II, II-III, III, III-IV, IV, and IV* (ie, damaged or disrupted stage IV). Arrows indicate the directionality of the cellular progress (ie, progression of mel-anogenesis, development of drug resistance or sensitivity , alterations of endogenous melanogenic cytotoxicity [EMC]). B ) Therapeutic strategies based on melanosome biogenesis for both melanotic melanomas (MM) and amelanotic melanomas (AM). The molecular intervention points correspond to the melanogenic pathway presented in (A).
Downloaded from https://academic.oup.com/jnci/article-abstract/101/18/1259/2515657by gueston 25 March 2018

1264 Articles | JNCI Vol. 101, Issue 18 | September 16, 2009
cells (enriched with stage III and IV melanosomes) by single cell – based clonogenic assays. The amelanotic MNT-1 cells displayed 2.1-fold greater CDDP resistance than melanotic MNT-1 cells (mean IC 50 of amelanotic and MNT-1 cells = 2.25 μ M and 1.06 μ M, respectively; difference = 1.19 μ M, 95% CI = 0.84 to 1.55; P = .007) ( Figure 3, A ). The large variation in CDDP sensitivity in MNT-1 cells, but not in SK-MEL-28 cells, may be associated with alterations of melanosomal dynamics (eg, changes in late-stage melanosome numbers) in these cells. As reflected by percent colony formation, the amelanotic SK-MEL-28 cells displayed 3.8-fold greater CDDP resistance than the highly pigmented MNT-1 cells under higher density culture conditions (mean IC 50 for SK-MEL-28 and MNT-1 = 2.13 μ M and 0.56 μ M, respectively; difference = 1.57 μ M, 95% CI = 1.45 to 1.69; P = .0017) ( Figure 3, B , Supplementary Figure 3 , A , available online). These observations are consistent with a model in which alterations of melanosome dynamics are associated with the regulation of cytotoxic drug sensitivity in melanotic cells.
We next examined CDDP sensitivity in two immortal melano-cyte lines (melan-a and melan-c). Melan-a melanocytes, estab-lished from pigmented C57BL/6 mice, are moderately pigmented cells. Melan-c melanocytes were derived from mice of the same strain with a point mutation in the gene encoding Tyr that inacti-vates tyrosinase ( 27 ). Drug sensitivity was assessed using the MTT assay because these melanocytes, unlike melanoma cells, do not grow as colonies. The resistance to CDDP of hypopigmented
melan-c cells was twofold that of melan-a cells (mean IC 50 value for melan-a and melan-c = 9.6 μ M and 19.0 μ M, respectively; difference = 9.4 μ M, 95% CI = 8.8 to 9.9; P < .001) ( Figure 3, C ). We further examined the relationship between drug sensitivity and the melanin content in MNT-1 and in B16F10 melanoma sub-clones, which varied in degree of pigmentation. No obvious asso-ciation between CDDP resistance and melanin content was found among these subclones ( Figure 3, D , Supplementary Table 1 , Supplementary Figure 4 , available online). However, we found that amelanotic SK-MEL-28 cells expressed the stage II melano-some marker HMB-45 at levels comparable with MNT-1 cells, as determined by immunohistochemistry and confocal microscopy ( Supplementary Figures 2 , A4 and 5 , B , available online). Melan-c melanocytes also retained substantial amounts of stage II melano-somes ( 27 ). Thus, these data do not support a simple relationship between melanin content and drug sensitivity, consistent with our previous hypothesis that functional melanosomes, rather than melanin content, are associated with drug resistance in melanoma cells ( 8 ).
Excessive melanin synthesis and its associated EMC in highly pigmented MNT-1 cells may enhance sensitivity to certain drugs, such as CDDP ( Figures 1, A5, B – D and 3, A – C ). To confi rm that melanogenesis-associated drug sensitivity is not specifi c to MNT-1 cells, we examined six melanoma lines in parallel: MNT-1, two moderately pigmented melanoma cell lines (UACC-257 and FEMX), and three amelanotic melanoma lines (SK-MEL-24,
Figure 3 . Melanosome stages, melanin content, and cisplatin (CDDP) sensitivity. A) CDDP resis-tance of SK-MEL-28 (containing stage I and II mel-anosomes) and of MNT-1 cells (enriched with stage III and IV melanosomes). IC 50 values were deter-mined from multiple independent experiments as indicated. Columns represent mean IC 50 values and error bars 95% confi dence intervals (CIs). B) Clonogenic assays of CDDP sensitivity in SK-MEL-28 and in MNT-1 cells maintained in high-density cul-ture conditions. Approximately 1000 highly pig-mented cells were seeded in 60-mm cell culture dishes. The cells were treated on the 3rd day (to ensure proper plating effi ciency and vitality of the cells) with CDDP for 3 days. We counted cells in all dishes on day 12 after removal of the drug-contain-ing medium in this experiment. Representatives of triplicate dishes of each treatment are shown in Supplementary Figure 3 , A (available online). Cytotoxic dose – response curves were plotted, with each point corresponding to the mean value and error bars indicating 95% CIs. One of two similar experiments is shown. C) Drug sensitivity in immor-tal mouse melanocytes (melan-a, wild type) and their hypopigmented mutant (melan-c, albino). Approximately 5000 cells per well were seeded in 96-well plates. The cells were treated on the 3rd day (to ensure proper plating effi ciency and vital-ity) with CDDP for 72 – 96 hours. Cytotoxicity was measured using the 3-(4,5-dimethylthiazol-2-yl)-2-,5-diphenyl tetrazolium assay as previously described ( 28 ); each point corresponds to the mean value of quadruplicate determinations in each independent experiment and error bars indicate 95% CIs. One of two similar experiments is shown. D) Clonogenic assays of CDDP sensitivity in MNT-1 subclones. KB-3-1 cells (derived from the HeLa cervical adenocarcinoma cell line) were used as a nonmelanoma control. Approximately 300 cells were seeded in
60-mm cell culture dishes. The cells were treated with CDDP for 10 days. Cytotoxic dose – response curves were determined as described in (B) . One of two similar experiments is shown. A comprehensive analysis of cytotoxic drug sensitivity and its association with melanin content is pro-vided in Supplementary Table 1 (available online).
Downloaded from https://academic.oup.com/jnci/article-abstract/101/18/1259/2515657by gueston 25 March 2018

jnci.oxfordjournals.org JNCI | Articles 1265
SK-MEL-28, and M14). All these melanoma lines were consis-tently more resistant to CDDP than the nonmelanoma control (KB-3-1 cells) ( Supplementary Figure 1 , B , available online). Furthermore, the three amelanotic lines were more resistant to CDDP than the pigmented melanotic lines (ie, UACC-257, FEMX, and MNT-1, Supplementary Figure 1 , B , available online). Again, total melanin content was not consistently associ-ated with the IC 50 values of CDDP in these cells ( r = � .17). These data are consistent with the idea that some anticancer drugs may be selectively cytotoxic to subsets of highly or moderately pig-mented cells that predominantly contain late-stage or dysfunc-tional melanosomes and have a greater potential to generate EMC ( Figure 1 ).
CDDP Treatment and Cell Death in Melanoma Cells with
Late-Stage Melanosomes
To confirm that the cytotoxicity of anticancer drugs to mela-noma cells depends on the stage of melanosomes they contain, we performed a comprehensive analysis of melanosomal stages and their numbers from images of sectioned cells that were visualized by conventional EM after staining with heavy metal and by UEM. The latter method allows one to quantitatively analyze both the density and melanin intensity of melanosomes at stages II-III, III, and IV, but not stage II. Alternatively, the presence of stage II melanosomes can be evaluated by conventional EM graphs and by HMB-45 immunostaining ( Supplementary Figure 5 , available online).
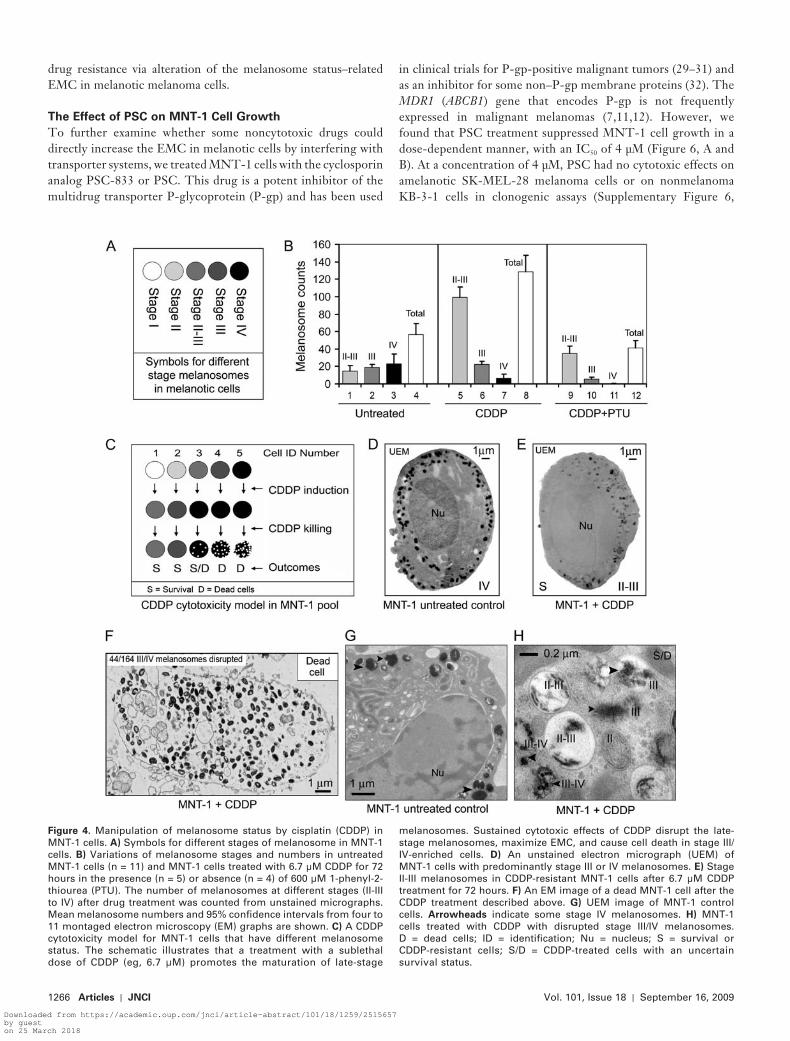
Untreated MNT-1 cells had a relatively even distribution of melanosomes according to stage (II-III to IV) and contained an average of 56 (SD = 21) melanosomes per 300-mm section, as determined from UEM images (n = 11) ( Figure 4, B ). In melan-otic MNT-1 cells, the biogenesis of stage I melanosomes, their maturation to stage IV, and subsequent extracellular export is the default unidirectional process ( 8 , 18 , 19 ). The relatively even dis-tribution of melanosomes according to these stages (codomi-nance) refl ects the equilibrium between biogenesis and export of melanosomes. The variability in the numbers of stage IV melano-somes is much higher than that of stage II-III or stage III mel-anosomes (variance of melanosomes per section = 362, 111, and 35, respectively). The variance in the numbers of stage IV mel-anosomes was 16-fold higher than the mean (23 per section), indicating a non-Poisson distribution of stage IV melanosomes in individual melanoma cells ( Figure 4, B , columns 1 – 4). Thus, these data provide a statistical basis for selection or induction of drug-resistant melanoma cells that are enriched with a subset of stage II and II-III melanosomes in the presence of a sublethal dose of drug.
After treatment with a sublethal dose of CDDP (6.7 μ M) for 72 hours, the surviving cells showed a 6.8-fold increase in stage II-III melanosomes (mean numbers of stage II-III melanosomes for con-trol and CDDP-treated cells = 15 and 100, respectively; difference = 85, 95% CI = 80 to 90; P < .001) ( Figure 4, B , columns 1 and 5), a 3.7-fold decrease in stage IV melanosomes (mean number for control and CDDP-treated cells = 22 and 6, respectively; differ-ence = 16, 95% CI = 10 to 29; P = .022) ( Figure 4, B , columns 3 and 7), and no obvious changes in the numbers of stage III mel-anosomes ( Figure 4, B , columns 2 and 6). These data are consis-
tent with the development of CDDP-resistant cells from a subset of MNT-1 cells that contain the smallest amount of stage III and IV or IV melanosomes (fi ve per 300-nm UEM section). Although UEM was unable to detect stage I and II premelanosomes because of the lack of melanin synthesis in these organelles, we deduced that the increased numbers of stage II-III melanosomes in CDDP-resistant cells were derived from the biogenesis of pre-melanosomes after CDDP selection ( Figure 4, B , columns 1 and 5; C – H). MNT-1 cells having a large number (maximal melano-some number = 67 per 300-nm UEM section) of stage III-IV and IV melanosomes (eg, Figure 4, D ) were rare in the CDDP-resistant population, suggesting that these cells belong to a CDDP-sensitive subset and were damaged or destroyed by the drug ( Figure 4, C ). When we visualized the damaged cells at inter-mediate stages, we observed that CDDP preferentially disrupted cells with more stage III-IV and IV melanosomes ( Figure 4, F ), but not those having mostly stage II-III melanosomes ( Figure 4, E ). Dead MNT-1 cells usually had excessive amounts of melanin, resulting in the accumulation of more pigmented (stage III-IV and IV) melanosomes inside the cytoplasm, indicating a defect in melanosome export ( Figure 4, F ). Collectively, these data reveal a subcellular mechanism for the development of resistance to CDDP and differences in resistance to the drug among subpopu-lations of cells that are unexposed to cytotoxic drugs ( Figure 4, C ). These data suggest that the drug-resistance mechanisms in melanoma cells involve induction of stage II-III melanosomes and the trapping by these organelles of cytotoxic drugs. Drug sensitiv-ity might be increased, however, by the presence of damaged stage IV melanosomes ( Figure 2, A ).
Prevalence of Early-Stage Melanosomes and Resistance to
CDDP
To test directly the role of excessive melanogenesis or increased biogenesis of stage II and II-III melanosomes in drug resistance, we used a well-characterized tyrosinase inhibitor, PTU, to inhibit melanin synthesis without affecting the biogenesis of stage I and II melanosomes. Over the course of 72 hours, 100 μ M PTU did not inhibit melanin synthesis, whereas 600 μ M PTU decreased melanin content to the background levels ( Figure 5, B ). Using EM, we confirmed that treatment with 600 μ M PTU and 6.7 μ M CDDP inhibited the formation of stage III and IV melanosomes and increased the density of stage II-III melanosomes (by 2.4-fold) compared with untreated control cells (mean number of stage II-III melanosomes for control and CDDP + PTU – treated group = 15 and 35, respectively; difference = 20, 95% CI = 18 to 22; P = .0039) ( Figures 4, B , columns 1 and 9, and 5, C – E). As evidenced by HMB-45 staining, 600 μ M PTU did not decrease stage II melanosome expression. However, we found that 300 μ M PTU slightly increased HMB-45 expression in MNT-1 cells (mean fluorescence intensity, arbitrary units, for control and PTU-treated cells = 473 and 634, respectively; difference = 161, 95% CI = 143 to 181; P = .081), although the increase was not statistically significant. As determined by clonogenic assays, PTU at 100, 300, and 600 μ M increased the mean IC 50 values of CDDP in MNT-1 cells by 3-, 5-, and 11.5-fold, respectively ( Figure 5, F ; Supplementary Figure 3 , B , available online). Thus, our data demonstrate the feasibility of manipulating cytotoxic
Downloaded from https://academic.oup.com/jnci/article-abstract/101/18/1259/2515657by gueston 25 March 2018
1266 Articles | JNCI Vol. 101, Issue 18 | September 16, 2009
drug resistance via alteration of the melanosome status – related EMC in melanotic melanoma cells.
The Effect of PSC on MNT-1 Cell Growth
To further examine whether some noncytotoxic drugs could directly increase the EMC in melanotic cells by interfering with transporter systems, we treated MNT-1 cells with the cyclosporin analog PSC-833 or PSC. This drug is a potent inhibitor of the multidrug transporter P-glycoprotein (P-gp) and has been used
in clinical trials for P-gp-positive malignant tumors ( 29 – 31 ) and as an inhibitor for some non – P-gp membrane proteins ( 32 ). The MDR1 ( ABCB1 ) gene that encodes P-gp is not frequently expressed in malignant melanomas ( 7 , 11 , 12 ). However, we found that PSC treatment suppressed MNT-1 cell growth in a dose-dependent manner, with an IC 50 of 4 μ M ( Figure 6, A and B ). At a concen tration of 4 μ M, PSC had no cytotoxic effects on amelanotic SK-MEL-28 melanoma cells or on nonmelanoma KB-3-1 cells in clonogenic assays ( Supplementary Figure 6 ,
Figure 4 . Manipulation of melanosome status by cisplatin (CDDP) in MNT-1 cells. A) Symbols for different stages of melanosome in MNT-1 cells. B) Variations of melanosome stages and numbers in untreated MNT-1 cells (n = 11) and MNT-1 cells treated with 6.7 μ M CDDP for 72 hours in the presence (n = 5) or absence (n = 4) of 600 μ M 1-phenyl-2-thiourea (PTU). The number of melanosomes at different stages (II-III to IV) after drug treatment was counted from unstained micrographs. Mean melanosome numbers and 95% confi dence intervals from four to 11 montaged electron microscopy (EM) graphs are shown. C ) A CDDP cytotoxicity model for MNT-1 cells that have different melanosome status. The schematic illustrates that a treatment with a sublethal dose of CDDP (eg, 6.7 μ M) promotes the maturation of late-stage
melanosomes. Sustained cytotoxic effects of CDDP disrupt the late-stage melanosomes, maximize EMC, and cause cell death in stage III/IV-enriched cells. D ) An unstained electron micrograph (UEM) of MNT-1 cells with predominantly stage III or IV melanosomes. E ) Stage II-III melanosomes in CDDP-resistant MNT-1 cells after 6.7 μ M CDDP treatment for 72 hours. F ) An EM image of a dead MNT-1 cell after the CDDP treatment described above. G ) UEM image of MNT-1 control cells. Arrowheads indicate some stage IV melanosomes. H ) MNT-1 cells treated with CDDP with disrupted stage III/IV melanosomes. D = dead cells; ID = identifi cation; Nu = nucleus; S = survival or CDDP-resistant cells; S/D = CDDP-treated cells with an uncertain survival status.
Downloaded from https://academic.oup.com/jnci/article-abstract/101/18/1259/2515657by gueston 25 March 2018

jnci.oxfordjournals.org JNCI | Articles 1267
available online), whereas PSC dramatically inhibited growth of MNT-1 and SK-MEL-28 cells when those cells were plated at high density ( Supplementary Figure 7 , available online). EM revealed that PSC induced cell degeneration by accelerating the formation of vacuolar structures in the cytoplasm ( Figure 6, C ). Counting of vacuolar structures in randomly selected EM images (n ≥ 13 for each experimental condition, Figure 6, D ) revealed that PSC produced a 5.8-fold increase in the number of vacuolar vesicles compared with the untreated MNT-1 control cells (mean number for control and PSC group = 17 and 97, respectively; difference = 80, 95% CI = 52 to 108; P < .001) ( Figure 6, D ). However, CDDP produced only a 1.4-fold increase in formation of vacuoles ( Figure 6, D ), which was fur-ther suppressed in the presence of 600 μ M PTU. These data suggest that the mechanism by which PSC suppresses melanoma cell growth differs from that of cytotoxic drugs (such as CDDP) in these cells. Furthermore, the variance in vacuole numbers in the PSC-treated group (variance = 5695) was 15-fold higher
than that of the control (variance = 390), suggesting that the PSC-induced vacuole formation in melanotic cells may be selec-tive for susceptible cells. Nonetheless, the suppression of CDDP-induced vacuolar vesicle formation by PTU provides evidence that PTU-mediated drug resistance is achieved in part by preventing EMC.
To gain more insight into the effects of PSC on cellular struc-tures, we analyzed the vacuolar structures induced by PSC by EM. We found that some vacuolar structures contained damaged melanosomes ( Figure 6, E ) and could thus be defi ned as auto-phagosomes ( 33 ) or melano-autophagosomes. The autophagosome-like vacuoles also contained other damaged subcellular organelles, confi rming a broad effect of PSC on membrane transporters of other subcellular organelles.
The effect of PSC on melanosomal transporter systems was further monitored by X-ray microprobe analysis of intramelano-somal accumulation of elemental sulfur and potassium, because their distribution is always associated with transporter activity.
Figure 5 . Manipulation of melanosome status by 1-phenyl-2-thiourea (PTU) and cisplatin (CDDP) in MNT-1 cells. A ) A hypothetical model of PTU-induced drug resistance in MNT-1 cells. Symbols, the same as in Figure 4, A , represent different stages of melanosomes (stage I – IV) in fi ve individual MNT-1 cells, which illustrate melanosome stage transi-tions that occur in response to treatment with the drug. A clonal expan-sion of individual cells (eg, from cell numbers 2 and 3) enriched with stage II (ie, in cell 2a and 2b) and stage III (ie, in cell 3a and 3b) melano-somes would lead to increased cellular resistance to the drug. Cells at stage I (ie, cell number 1) or IV (eg, cell number 5) would be induced to have predominant stage II and III melanosomes by PTU, respectively. Cells that have predominant stage II and III melanosomes would be survivors (S) of CDDP treatment. B ) Melanin content in untreated MNT-1 cells (column 1) and in MNT-1 cells treated for 72 hours with 100 μ M (column 2) or 600 μ M (column 3) PTU. KB-3-1 cells (column 4) were
used as a nonmelanoma control. Columns represent the mean values of triplicate determinants and error bars correspond to 95% confi dence intervals (CIs). C and D ) Unstained electron microscopy (UEM) and conventional electron microscopy (CEM) images of MNT-1 cells simul-taneously treated with PTU (600 μ M) and CDDP (6.7 μ M). E ) Enlarged areas of an MNT-1 CEM micrograph, with arrowheads indicating stage II and stage II-III melanosomes induced by simultaneous treatment with PTU and CDDP. Scale bar = 0.2 μ m. F ) CDDP sensitivity in MNT-1 cells in the presence of PTU. Approximately 1000 MNT-1 cells were seeded in 60-mm cell culture dishes. Clonogenic assays were performed as described in Figure 3, B . Cytotoxicity curves were determined by counting surviving colonies (presented in Supplementary Figure 3 , B , available online) with each point corresponding to the mean number of colonies and error bars indicating 95% CIs. One of two similar experiments is shown. mi = mitochondria; Nu = nucleus.
Downloaded from https://academic.oup.com/jnci/article-abstract/101/18/1259/2515657by gueston 25 March 2018

1268 Articles | JNCI Vol. 101, Issue 18 | September 16, 2009
Elemental potassium colocalized with sulfur ( Figure 6, F , upper panel), indicating that the melanosome membrane effi ciently transports potassium inside the organelle. In PSC-treated cells, the accumulation of sulfur was apparently decreased in some melanosomes, accompanied by a statistically signifi cant decrease in potassium accumulation (mean potassium content in control [n = 14] and PSC-treated [n = 32] melanosomes = 0.095 and 0.019 fg, respectively; difference = 0.076 fg, 95% CI = 0.07 to 0.08 fg; P < .001) ( Figure 6, F ). These data suggest that the PSC-induced cell death was due, in part, to interference with melanosomal transporter systems. Thus, in principle, inhibiting melanosomal transporter systems could be a new strategy to reverse the intractability of melanoma to chemotherapy. These data also suggest that a combination of melanosomal transporter inhibitors (such as PSC) with existing clinical chemotherapeutic
agents (such as CDDP and vinblastine) would elevate the level of EMC, which might enhance or synergize the therapeutic effects in melanotic melanomas.
Discussion
Based on the MNT-1 cellular model, we have outlined a model that relates melanosome dynamics to drug sensitivity and addresses the complicated drug-resistance mechanisms underlying the intracta-bility of melanoma ( Figure 2 ). Our results demonstrate that altered EMC, which correlates with the development of late-stage melano-somes, is involved in the regulation of drug sensitivity in melanotic melanoma cells. This conclusion was further confirmed by treat-ment of melanotic cells with CDDP, which preferentially killed cells with stage IV melanosomes. Consistently, the prevalence of
Figure 6 . The effects of cyclosporin analog PSC-833 (PSC) on melanotic cell growth and EMC-related autophagy. A ) Clonogenic assays of the effect of PSC on MNT-1 cell growth. The procedures were the same as described in Figure 3, B . Representatives of triplicate dishes of each treatment are shown. B ) Quantitative analysis was based on clonogenic assays shown in (A) . Columns represent mean colony number of three culture dishes; error bars correspond to 95% confi dence intervals [CIs]. One of two similar experiments is shown. C ) An electron microscopy (EM) image of a 4- μ M PSC-treated cell after 72 hours. D ) Autophagosome-like vacuolar structures in untreated MNT-1 cells and in MNT-1 cells treated with cisplatin (CDDP), CDDP and 1-phenyl-2-thiourea (PTU), and
PSC. Columns represent mean vacuolar numbers from more than 13 EM images (or cells) of each treatment. Error bars correspond to 95% CIs. E ) High-magnifi cation image of untreated MNT-1 cells and PSC-treated MNT-1 cells. Arrowheads in the upper panel indicate two melanosomes with disorganized melanosomal matrices, whereas arrowheads in the lower panel point to a melanosome-containing autophagosome. F ) X-ray mapping of potassium (K) in untreated MNT-1 cells or in cells treated with 4 μ M PSC for 72 hours; Sulfur (S) was used as a melano-somal marker for MNT-1 cells because of its specifi c melanosomal accumulation, which has been previously described ( 8 ). Arrowheads point to melanosomes. Scale bars = 2 μ m. Nu = nucleus.
Downloaded from https://academic.oup.com/jnci/article-abstract/101/18/1259/2515657by gueston 25 March 2018

jnci.oxfordjournals.org JNCI | Articles 1269
stage II-III or III melanosomes rendered the cells resistant to cyto-toxic drugs. Finally, we showed that the melanosome stages or dynamics can be manipulated (by an inhibitor of melanogenesis or by an inhibitor of membrane transporters) to regulate cell growth and drug sensitivity.
Existing genetic evidence also supports our model. For exam-ple, a recent study revealed that several mutations that affect stage II melanosome formation (because of a lack of the melanosomal component gp100/Pmel17) increase sensitivity to several anti-cancer drugs including CDDP ( 34 ). Thus, this result appears to support the fi rst phase of the three-phase melanosomal dynamic model, in which we propose that the defi ciency in generating stage II and II-III melanosomes would render cells more sensitive to cytotoxic drugs ( Figure 2, A ). Enforced expression of the mela-nogenic enzyme TYRP2 via transfection confers CDDP resis-tance in melanoma ( 21 , 22 ) and TYRP2, in cooperation with TYRP1, suppresses the EMC that is related to overexpression of tyrosinase ( 35 ). These studies are consistent with the increased drug resistance that accompanies increased melanogenesis at the fi rst phase of our model. Furthermore, Chen et al. ( 36 ) demon-strated that the pink-eyed dilution protein (p protein) rescues tyrosinase-containing melanosomes in Melan-p1 hypopigmented melanocytes (that lack p gene transcripts) by stable transfection of that gene. The stably p -transfected cells (Melan-p1 � P ) were highly pigmented and more sensitive to both arsenic and CDDP than were Melan-p1 melanocytes ( 37 ). These data are consistent with the prediction of greater drug sensitivity via increased melano-genesis in the later stages of melanosome biogenesis in our model. Clearly, melanogenesis may result in differential drug sensitivity in distinct melanosomal stages. Nevertheless, our model provides insight into cellular principles that underlie drug-resistant or sensitive phenotypes as well as strategies for therapy of melanoma.
There are a few critical points in melanosome development that could be exploited for therapy. First, inhibiting the development of premelanosomes in melanotic and amelanotic melanoma cells could prevent the development of melanosome-mediated drug resistance ( 34 ). Second, prevention or inhibition of melanosomal trapping of cytotoxic drugs could be used to target stage II and II-III – dominant melanoma cells ( 8 ). It has been shown that in lysosomes (organelles related to melanosomes), direct inhibition of lysosomal vacuolar-H � -ATPase activity by proton pump inhibitors alters intracellular pH and markedly increases cytoplasmic reten-tion and nuclear import of cytotoxic drugs, thus dramatically sen-sitizing tumor cells to the effects of CDDP, 5-fl uorouracil, and vinblastine ( 38 ). In this study, we observed that K � localizes within melanosomes, and treatment with PSC prevented this localization, suggesting that the inhibitory effect of PSC on melanotic melanoma cells may be via the inhibition of ion exchangers in melanosomal membranes.
It is also possible that PSC could inhibit multiple non – -P-gp transporters in melanoma cells, including a cluster of ABC transporters (ABCA9, ABCB5, ABCC2, and ABCD1) ( 11 , 12 ), and particularly ABCB5, which has 60% – 70% homol-ogy to P-gp ( 10 , 11 ). Our preliminary data (not shown) revealed that PSC or verapamil increases vinblastine-induced cytotoxicity in MNT-1 cells, possibly reflecting the inhibition
of those P-gp-like transporters that are associated with melano-genesis. In addition, PSC at a concentration of 2 or 4 μ M was noncytotoxic to nonmelanoma MES-SA sarcoma cells ( 39 ) and KB-3-1 cells, suggesting that PSC-mediated autophagy is mel-anotic melanoma dependent. Taken together, these data suggest that inhibition of the melanosomal transporter system by its inhibitors may be a rational approach to the therapy of mela-noma patients.
In theory, by choosing agents to enhance late-stage melano-some formation without provoking the biogenesis of stage I and II melanosomes, all of the key components involved in melano-some export could be targeted. Ideally, EMC could be increased by combining the formation of stage IV melanosomes and disrup-tion of melanosomal membranes in the absence of melanosome export. Clinically, a 5- μ M plasma CDDP concentration can be achieved 24 hours after infusion of a clinically tolerated dose (80 – 100 mg/m 2 ) ( 40 ), which is 2.5- to 10-fold higher than the IC 50 for MNT-1 cells that we observed (ie, 95% CI for the IC 50 values of MNT-1 = 0.5 to 1.62 μ M). The success of cancer chemother-apy frequently depends on toxic-to-therapeutic ratios as low as two to three, and 2.5- to 10-fold differences between sensitive and resistant cells are substantial. Thus, modulation of melanoma cells by CDDP to an EMC state that is sensitive to chemotherapy would be of potential clinical signifi cance. Furthermore, accord-ing to our model, some previous and current therapeutic regi-mens used in clinical trials need to be reevaluated based on the melanosome status of patients. For example, we have demon-strated the complexity of CDDP-mediated cytotoxicity in mela-noma cells and its dependence on melanosome status. Hence, CDDP may be suitable for treating melanotic melanoma patients whose tumors contain preexisting melanosomes at stage IV, but not patients with amelanotic melanoma or those whose tumors contain predominantly stage II or II-III melanosomes. Unfortunately, no clinical studies have linked melanosome-medi-ated drug trapping, export, or EMC to the drug resistance of melanomas. We believe that these would be fruitful areas for future clinical investigation.
Finally, there are certain limitations to our study. The majority of the data in this study were derived from several melanoma cell lines in cell culture systems. The drug-resistant phenotypes asso-ciated with melanosomal dynamics have quite complex genetic traits, which should be further validated in an in vivo model. Moreover, our study does not provide direct evidence that there is a treatment benefi t for melanoma patients, but only implies the possibility of such a therapeutic benefi t by showing that differen-tial subsets of melanoma cells respond differently to CDDP in vitro. The “prognosis” might be inferred from CDDP sensitivity assays. To further evaluate the benefi t of CDDP to subsets of melanoma patients, their melanosomal status would need to be evaluated in the context of well-designed randomized clinical tri-als. In this respect, our study could conceptually or strategically infl uence the design of future clinical trials for melanoma patients.
In conclusion, the development of both drug resistance and sensitivity in melanomas and in pigment-producing cells involves the melanosome biogenesis pathway. The three distinct phases in that pathway can be differentially targeted for therapy of
Downloaded from https://academic.oup.com/jnci/article-abstract/101/18/1259/2515657by gueston 25 March 2018

1270 Articles | JNCI Vol. 101, Issue 18 | September 16, 2009
malignant melanoma. In principle, the components of the entire melanogenic pathway could be molecular targets for the therapy of melanoma patients. We believe that manipulation of melanosome status either by cytotoxic or by noncytotoxic drugs opens thera-peutic avenues and raises the prospect of successfully treating pigment-producing cell-related diseases and, in particular, highly intractable malignant melanomas.
References 1. Atkins MB , Buzaid AC , Houghton AN . Chemotherapy and biochemo-
therapy . In: Balch C , Houghton A , Sober A , Soong S , eds. Cutaneous Melanoma, 4th Edition . St. Louis, MO : Quality Medical Publishing ; 2003 : 589 – 604 .
2. Quan WDY . Melanoma and other skin malignancies . In: Skeel RT , ed. Handbook of Cancer Chemotherapy , 6th Edition . Philadelphia, PA : Lippincott Williams and Wilkins ; 2003 : 360 – 377 .
3. Tsao H , Atkins MB , Sober AJ . Management of cutaneous melanoma . N Engl J Med . 2004 ; 351 ( 10 ): 998 – 1012 .
4. Morgan RA , Dudley ME , Wunderlich JR , et al . Cancer regression in patients after transfer of genetically engineered lymphocytes . Science . 2006 ; 314 ( 5796 ): 126 – 129 .
5. Lewis KD , Robinson WA , McCarter M , et al . Phase II multicenter study of neoadjuvant biochemotherapy for patients with stage III malignant melanoma . J Clin Oncol . 2006 ; 24 ( 19 ): 3157 – 3163 .
6. Fang D , Nguyen TK , Leishear K , et al . A tumorigenic subpopulation with stem cell properties in melanomas . Cancer Res. 2005 ; 65 ( 20 ): 9328 – 9337 .
7. Chen KG , Gottesman MM . How melanoma cells evade chemotherapy: role of transporter-dependent and -independent resistance mechanisms . In: Hearing VJ , Leong SPL , eds. From Melanocytes to Melanoma: The Progression to Malignancy . Totowa, NJ : Humana Press Inc ; 2005 ; 93 – 606 .
8. Chen KG , Valencia JC , Lai B , et al . Melanosomal sequestration of cyto-toxic drugs contributes to the intractability of malignant melanomas . Proc Natl Acad Sci U S A . 2006 ; 103 ( 26 ): 9903 – 9907 .
9. Liedert B , Materna V , Schadendorf D , Thomale J , Lage H . Overexpression of cMOAT (MRP2/ABCC2) is associated with decreased formation of platinum-DNA adducts and decreased G2-arrest in melanoma cells resis-tant to cisplatin . J Invest Dermatol . 2003 ; 121 ( 1 ): 172 – 176 .
10. Frank NY , Pendse SS , Lapchak PH , et al . Regulation of progenitor cell fusion by ABCB5 P-glycoprotein, a novel human ATP-binding cassette transporter . J Biol Chem. 2003 ; 278 ( 47 ): 47156 – 47165 .
11. Chen KG , Szakács G , Annereau JP , et al . Principal expression of two mRNA isoforms ( ABCB5 � and ABCB5 � ) of the ATP-binding cassette transporter gene ABCB5 in melanoma cells and melanocytes . Pigment Cell Res. 2005 ; 18 ( 2 ): 102 – 112 .
12. Szakács G , Annereau JP , Lababidi S , et al . Predicting drug sensitivity and resistance: profi ling ABC transporter genes in cancer cells . Cancer Cell. 2004 ; 6 ( 2 ): 129 – 137 .
13. Szakács G , Paterson JK , Ludwig JA , Booth-Genthe C , Gottesman MM . Targeting multidrug resistance in cancer . Nat Rev Drug Discov . 2006 ; 5 ( 3 ): 219 – 234 .
14. Soengas MS , Lowe SW . Apoptosis and melanoma chemoresistance . Oncogene . 2003 ; 22 ( 20 ): 3138 – 3151 .
15. Helmbach H , Kern MA , Rossmann E , et al . Drug resistance towards etoposide and cisplatin in human melanoma cells is associated with drug-dependent apoptosis defi ciency . J Invest Dermatol . 2002 ; 118 ( 6 ): 923 – 932 .
16. Chin L , Garraway LA , Fisher DE . Malignant melanoma: genetics and therapeutics in the genomic era . Genes Dev. 2006 ; 20 ( 16 ): 2149 – 2182 .
17. Tang CH , Grimm EA . Depletion of endogenous nitric oxide enhances cisplatin-induced apoptosis in a p53-dependent manner in melanoma cell lines . J Biol Chem. 2004 ; 279 ( 1 ): 288 – 298 .
18. Raposo G , Marks MS . The dark side of lysosome-related organelles: spe-cialization of the endocytic pathway for melanosome biogenesis . Traffi c . 2002 ; 3 ( 4 ): 237 – 248 .
19. Hearing VJ . Biogenesis of pigment granules: a sensitive way to regulate melanocyte function . J Dermatol Sci. 2005 ; 37 ( 1 ): 3 – 14 .
20. Kadekaro AL , Wakamatsu K , Ito S , Abdel-Malek ZA . Cutaneous photo-protection and melanoma susceptibility: reaching beyond melanin content to the frontiers of DNA repair . Front Biosci . 2006 ; 11 : 2157 – 2173 .
21. Pak BJ , Li Q , Kerbel RS , Ben-David Y . TYRP2-mediated resistance to cis-diamminedichloroplatinum (II) in human melanoma cells is indepen-dent of tyrosinase and TYRP1 expression and melanin content . Melanoma Res. 2000 ; 10 ( 5 ): 499 – 505 .
22. Pak BJ , Lee J , Thai BL , et al . Radiation resistance of human melanoma analysed by retroviral insertional mutagenesis reveals a possible role for dopachrome tautomerase . Oncogene . 2004 ; 23 ( 1 ): 30 – 38 .
23. Piantelli M , Tatone D , Castrilli G , et al . Quercetin and tamoxifen sensi-tize human melanoma cells to hyperthermia . Melanoma Res. 2001 ; 11 ( 5 ): 469 – 476 .
24. Kushimoto T , Basrur V , Valencia J , et al . A model for melanosome bio-genesis based on the purifi cation and analysis of early melanosomes . Proc Natl Acad Sci U S A . 2001 ; 98 ( 19 ): 10698 – 10703 .
25. Valencia JC , Rouzaud F , Julien S , et al . Sialylated core 1 O-glycans infl u-ence the sorting of Pmel17/gp100 and determine its capacity to form fi brils . J Biol Chem. 2007 ; 282 ( 15 ): 11266 – 11280 .
26. Tamura A , Halaban R , Moellmann G , Cowan JM , Lerner MR , Lerner AB . Normal human melanocytes in culture . In Vitro Cell Dev Biol. 1987 ; 23 ( 7 ): 519 – 522 .
27. Toyofuku K , Wada I , Valencia JC , Kushimoto T , Ferrans VJ , Hearing VJ . Oculocutaneous albinism types 1 and 3 are ER retention diseases: mutation of tyrosinase or Tyrp1 can affect the processing of both mutant and wild-type proteins . FASEB J . 2001 ; 15 ( 12 ): 2149 – 2161 .
28. Chen G , Jaffrézou JP , Fleming WH , Durán GE , Sikic BI . Prevalence of multidrug resistance related to activation of the mdr1 gene in human sar-coma mutants derived by single-step doxorubicin selection . Cancer Res. 1994 ; 54 ( 18 ): 4980 – 4987 .
29. Sikic BI , Fisher GA , Lum BL , Halsey J , Beketic-Oreskovic L , Chen G . Modulation and prevention of multidrug resistance by inhibitors of P-glycoprotein . Cancer Chemother Pharmacol . 1997 ; 40 (Suppl) : S13 – S19 .
30. List AF , Kopecky KJ , Willman CL , et al . Benefi t of cyclosporine modulation of drug resistance in patients with poor-risk acute myeloid leukemia: a Southwest Oncology Group study . Blood . 2001 ; 98 ( 12 ): 3212 – 3220 .
31. Bates SE , Bakke S , Kang M , et al . A phase I/II study of infusional vinblas-tine with the P-glycoprotein antagonist valspodar (PSC 833) in renal cell carcinoma . Clin Cancer Res. 2004 ; 10 ( 14 ): 4724 – 4733 .
32. Kimchi-Sarfaty C , Kasir J , Ambudkar SV , Rahamimoff H . Transport activity and surface expression of the Na � -Ca 2 � exchanger NCX1 are inhibited by the immunosuppressive agent cyclosporin A and by the nonimmunosuppressive agent PSC833 . J Biol Chem. 2002 ; 277 ( 4 ): 2505 – 2510 .
33. Levine B . Cell biology: autophagy and cancer . Nature . 2007 ; 446 ( 7137 ): 745 – 747 .
34. Xie T , Nguyen T , Hupe M , Wei ML . Multidrug resistance decreases with mutations of melanosomal regulatory genes . Cancer Res. 2009 ; 69 ( 3 ): 992 – 999 .
35. Rad HH , Yamashita T , Jin HY , et al . Tyrosinase-related proteins suppress tyrosinase-mediated cell death of melanocytes and melanoma cells . Exp Cell Res. 2004 ; 298 ( 2 ): 317 – 328 .
36. Chen K , Manga P , Orlow SJ . Pink-eyed dilution protein controls the processing of tyrosinase . Mol Biol Cell. 2002 ; 13 ( 6 ): 1953 – 1964 .
37. Staleva L , Manga P , Orlow SJ . Pink-eyed dilution protein modulates arsenic sensitivity and intracellular glutathione metabolism . Mol Biol Cell. 2002 ; 13 ( 12 ): 4206 – 4220 .
38. Luciani F , Spada M , De Milito A , et al . Effect of proton pump inhibitor pretreatment on resistance of solid tumors to cytotoxic drugs . J Natl Cancer Inst . 2004 ; 96 ( 22 ): 1702 – 1713 .
39. Chen G , Durán GE , Steger KA , et al . Multidrug-resistant human sarcoma cells with a mutant P-glycoprotein, altered phenotype, and resistance to cyclosporins . J Biol Chem. 1997 ; 272 ( 9 ): 5974 – 5982 .
Downloaded from https://academic.oup.com/jnci/article-abstract/101/18/1259/2515657by gueston 25 March 2018

jnci.oxfordjournals.org JNCI | Articles 1271
40. Sunderman FW , Sporn J , Hopfer SM , Sweeney KR , Chakraborty NG , Greenberg B . Platinum in blood mononuclear cells from patients after cisplatin therapy . Ann Clin Lab Sci. 1990 ; 20 ( 6 ): 379 – 384 .
Funding Intramural Research Program of the National Institutes of Health , National Cancer Institute , Center for Cancer Research . Use of the Advanced Photon Source at the Argonne National Laboratory was supported by the U.S. Department of Energy, Offi ce of Science, Basic Energy Sciences, under Contract No. DE-AC02-06CH11357.
Notes The authors had full responsibility for the design of the study, analysis and interpretation of data, the decision to submit the manuscript, and the writing of the manuscript.
We thank Dr B. I. Sikic (Stanford University, California) for providing the cyclosporin PSC-833 used in this study, Drs T. Fojo and F. Rouzaud for critical discussion and comments, and Mr G. Leiman for his assistance in preparing the manuscript.
Manuscript received October 23 , 2008 ; revised June 9 , 2009 ; accepted July 14 , 2009 .
Downloaded from https://academic.oup.com/jnci/article-abstract/101/18/1259/2515657by gueston 25 March 2018