influence of geometrical parameters on the strength of
TRANSCRIPT
Delft University of Technology
Influence of geometrical parameters on the strength of Hybrid CFRP-aluminium tubularadhesive joints
Lavalette, Nicolas P.; Bergsma, Otto K.; Zarouchas, Dimitrios; Benedictus, Rinze
DOI10.1016/j.compstruct.2020.112077Publication date2020Document VersionFinal published versionPublished inComposite Structures
Citation (APA)Lavalette, N. P., Bergsma, O. K., Zarouchas, D., & Benedictus, R. (2020). Influence of geometricalparameters on the strength of Hybrid CFRP-aluminium tubular adhesive joints. Composite Structures, 240,[112077]. https://doi.org/10.1016/j.compstruct.2020.112077
Important noteTo cite this publication, please use the final published version (if applicable).Please check the document version above.
CopyrightOther than for strictly personal use, it is not permitted to download, forward or distribute the text or part of it, without the consentof the author(s) and/or copyright holder(s), unless the work is under an open content license such as Creative Commons.
Takedown policyPlease contact us and provide details if you believe this document breaches copyrights.We will remove access to the work immediately and investigate your claim.
This work is downloaded from Delft University of Technology.For technical reasons the number of authors shown on this cover page is limited to a maximum of 10.

Contents lists available at ScienceDirect
Composite Structures
journal homepage: www.elsevier.com/locate/compstruct
Influence of geometrical parameters on the strength of Hybrid CFRP-aluminium tubular adhesive joints
Nicolas P. Lavalette⁎, Otto K. Bergsma, Dimitrios Zarouchas, Rinze BenedictusDepartment of Aerospace Structures and Materials, Faculty of Aerospace Engineering, Delft University of Technology, Kluyverweg 1, 2629HS Delft, The Netherlands
A R T I C L E I N F O
Keywords:Adhesive jointsTubular jointsHybrid jointsDuctile adhesivesCohesive zone modellingMechanical testing
A B S T R A C T
Tubular adhesive joints, used in truss structures to join pultruded carbon fibre-reinforced polymer members toaluminium nodes, are modelled with varying dimensions. The numerical model uses a Cohesive Zone Modellingformulation with a trapezoidal traction-separation law for the adhesive layer, and experimental tests are carriedto validate it. The results showed that the joint strength increases significantly with the bonding area, with alimit on the overlap length above which it stops increasing. This upper limit is affected by the thickness andtapering angle of the adherends, due to their influence on the shear stress distribution along the overlap. On theother hand, the adhesive thickness has only a marginal influence on the joint strength.
1. Introduction
Composite materials are increasingly used in transportation in-dustries, due to their low weight and high mechanical properties. Trussstructures, which consist of straight members loaded axially and con-nected together by nodes, are a suitable application for the high axialstrength of unidirectional composite materials, such as carbon fibre-reinforced polymer (CFRP) pultrusions, and several applications ofCFRP used in truss structures are being developed in the form of woundtrusses and lattices [1–3]. A limitation to such structures is the loadtransfer between the members, therefore designing the nodes is animportant step in designing the overall structure. The efficiency of anode is defined as the ratio of the load it can transfer to the load themembers can carry. Mechanical fastening, such as riveting, provides ahigh efficiency but damages composite materials. In addition, it is dif-ficult to apply to small-scale structures without significantly increasingtheir total weight. A solution is to adhesively bond the ends of themembers to the nodes, as it can provide strengths comparable to orhigher than mechanical fastening [4–6]. In a previous work, the authorssimulated the strength of different node configurations and concludedthat tubular joints, consisting of aluminium sockets overlapping thetruss members, provided the best strength-to-weight ratio [7].
The dimensions of adhesive joints play a crucial role in theirstrength. Increasing the bonding area, i.e. the overlap length and width,greatly contributes to increasing the joint strength [8–12]. To a lowerextent, an increase of the joint strength can be obtained by increasing
the adherends thickness, which causes a higher bending stiffness[9,13]. Tapering the ends of the adherends also results in an increase ofthe joint strength by making the stress distribution in the adhesive moreuniform [14], although this effect is marginal on tubular joints [15,16].Additionally, tubular joints present a good robustness to manufacturingdefects, such as bondline contamination or misalignment of the tubesrelative to each other [17,18]. Increasing the adhesive bondlinethickness can cause a reduction of the joint strength, although nogeneralized trend has been observed due to the numerous factors thatcan influence it [19,20]. The joint strength also depends on the type ofadhesive used. Brittle adhesives generally have a higher strength thanductile adhesives, but their sensitivity to peak stresses limits this ad-vantage to short overlaps, for which the stress distributions are moreuniform [21,22]. Ductile adhesives plasticize when their peak strengthis reached, and thereby redistribute the stresses in the less loaded partsof the overlap, which results in a higher performance than brittle ad-hesives for longer overlaps [23,24]. Knowing the influence of thegeometrical parameters on the strength and weight of a joint is neces-sary to design and optimize it, since strength and weight objectives inthis case are often of conflicting nature [15]. In particular, it is im-portant to determine the design limits of each parameter, outside whichno further strength or weight improvement is possible.
In order to determine these limits, a model able to predict thestrength of the adhesive joint is required. Analytical models exist toanalyse the stress distribution and predict the failure of adhesive joints,but they are not reliable for the modelling of adhesive displaying a
https://doi.org/10.1016/j.compstruct.2020.112077Received 4 December 2019; Received in revised form 5 February 2020; Accepted 14 February 2020
⁎ Corresponding author.E-mail addresses: [email protected] (N.P. Lavalette), [email protected] (O.K. Bergsma), [email protected] (D. Zarouchas),
[email protected] (R. Benedictus).
Composite Structures 240 (2020) 112077
Available online 17 February 20200263-8223/ © 2020 The Authors. Published by Elsevier Ltd. This is an open access article under the CC BY license (http://creativecommons.org/licenses/BY/4.0/).
T

highly non-linear behaviour, in which case numerical models are pre-ferred [25,26]. Finite Element Modelling (FEM) has been used ex-tensively to analyse adhesive bonds and predict their strength, using avariety of criteria to determine the failure of the joint. The criteria to beused depend on the geometry of the joint (lap, scarf, etc.), and on thetype of adhesive used, with local stress-strain criteria being generallymore suitable for brittle adhesives and global yielding criteria givingmore accurate results for ductile adhesives [24,27–29]. With the in-crease in computational power, more advanced modelling techniquesare now being used, such as fracture mechanics and damage modelling,which comprise Cohesive Zone Modelling (CZM) and Extended FiniteElement Method (XFEM) [30,31,32]. In the case of ductile adhesives,fracture mechanics are not suitable because the initial crack size andposition is difficult to determine, and would require a large amount ofcomputing time [29]. CZM combines the advantages of fracture andcontinuum mechanics to model the damage initiation and propagationthrough the adhesive layer until failure, and has been successfully usedin the literature to predict the strength of adhesive joints. Even thoughXFEM shows satisfactory results compared to standard FEM, it hasshown limited and less accurate results in the strength prediction ofadhesive joints compared to CZM [20,21,33]. The choice of the trac-tion-separation law to be used for the CZM depends on the adhesive. Atriangular law, which models the stiffness degradation of the materialimmediately after damage initiation, shows more accurate results forbrittle adhesives, while a trapezoidal law, by representing the plasti-cization of the material, is more suited to ductile adhesives [22].
The objective of the present work is to study the influence of severalgeometrical parameters on the strength of CFRP-aluminium tubularjoints, in order to determine the limits of each parameter in improvingthe joint strength and weight and assess their relevance for a futureoptimization process. The parameters considered are the overlap length(Lo), adhesive thickness (tadh), inner tube diameter (din), inner and outertubes thickness (tin and tout, respectively), and inner and outer tubestaper lengths (lin and lout, respectively), as their influence on the jointstrength and weight is expected to be significant. Considering the rangeof overlap length values, a ductile adhesive (Araldite 2015-1) is chosen,since a brittle adhesive is expected to result in lower strengths in mostcases. A numerical model using CZM with a trapezoidal traction-se-paration law is built to predict the joint strength for varying parametervalues. Tubular joints specimens are manufactured and tested in ten-sion until failure for a selection of geometrical parameters, and vali-dation of the numerical model is made by comparing the failure loadpredictions with those obtained experimentally. In addition, ComputedTomography (CT) scan images of a selection of specimens are made, inorder to assess the importance of manufacturing defects on the jointstrength and adapt the numerical model if necessary.
2. Methodology
2.1. Material properties
The inner tubes of the joints are unidirectional pultruded tubescomposed of TORAYCA® T700 fibres and epoxy resin. The outer tubesare made of aluminium 6086-T6. The properties of the CFRP and alu-minium, to be implemented in the numerical model, were calculatedfrom the manufacturers’ data. They are disclosed in Tables 1 and 2,respectively.
In order for the numerical models to predict the behaviour of theadhesive joint accurately using CZM, the elastic moduli, failure
strengths and fracture toughness of the adhesive, in tension and shear,are needed. The adhesive used in this work is the Araldite® 2015-1, atwo-component (resin and hardener) ductile epoxy adhesive. It is a newversion of the discontinued Araldite® 2015. As reported by the manu-facturer (Huntsman International LLC), it shows slightly better perfor-mances than its predecessor did. The properties of the Araldite® 2015-1to be used for the CZM are not expected to vary significantly from thoseof the Araldite® 2015, which has previously been characterized in theliterature [34]. However, Campilho et al. [22] have shown that varia-tions of the adhesive failure strength have a substantial impact on thefailure load of the joint predicted by the CZM (up to 20% for a strengthvariation of 20%), while variations of the fracture toughness only havea marginal impact (up to 5% for a toughness variation of 20%). In orderto increase the reliability of the model predictions, the elastic moduliand failure strengths of the Araldite® 2015-1, in tension and shear, aredetermined experimentally in this work, while its fracture toughness intension and shear are considered identical to those previously de-termined for the Araldite® 2015.
Bulk adhesive specimens were tested to determine the tensileproperties and Thick Adherend Shear Tests (TAST) were carried out todetermine the shear properties. The bulk adhesive specimens weremanufactured according to the ISO 15166-1 standard. The adhesive wascured at room temperature for five days between two plates coated witha release agent, with 2 mm thick spacers ensuring a constant adhesivethickness. The resulting adhesive plates were then machined to achievethe dogbone shape specified in the standard, as shown in Fig. 1a. Sevenspecimens were tested and the tensile properties of the adhesive weredetermined according to the ISO 527-2 standard. The TAST specimenswere manufactured according to the ISO 11003-2:201 standard. Twosteel plates were degreased with acetone, manually abraded usingsandpaper and bonded together, with spacers guaranteeing an overlapthickness of 0.5 mm. After curing at room temperature for five days, thebonded assembly was machined to obtain specimens as specified in thestandard, as shown in Fig. 1b. Instead of using an extensometer assuggested in the standard, Digital Image Correlation (DIC) was used tomeasure the displacement of the adherends relative to each other at thelocation of the overlap (Fig. 2). Seven specimens were tested with fouryielding valid results, the remaining three having failed prematurelydue to a misalignment in the testing apparatus. Fig. 3 shows the ex-perimental stress-strain curves obtained from the bulk adhesive andTAST specimens. The properties of the Araldite® 2015-1 are summar-ized in Table 3, with the yield strengths in tension and shear calculatedfor a respective plastic strain of 0.2%.
2.2. Numerical model
The tubular joints are modelled for different values of overlaplength (Lo), adhesive thickness (tadh), inner tube diameter (din), innerand outer tubes thickness (tin and tout, respectively), and inner and outertubes taper lengths (lin and lout, respectively). These parameters, shownin Fig. 4, are independent (the value of each parameter can be varied
Table 1Properties of the CFRP.
E11 [MPa] E22 [MPa] E33 [MPa] ν12 ν13 ν23 G12 [MPa] G13 [MPa] G23 [MPa]
146,066 8320 8320 0.248 0.248 0.234 3135 3135 3371
Table 2Properties of the aluminium 6086-T6.
Young’s modulus, Eal [GPa] 69Yield strength, σyal [MPa] 270Failure strength, σfal [MPa] 330Failure strain, εfal [%] 9.8Poisson’s ratio, νal 0.33
N.P. Lavalette, et al. Composite Structures 240 (2020) 112077
2

without affecting the others). In order to represent the specimens usedto validate the model as closely as possible, the centring hole and drilltips are also modelled (details about the purpose of the centring holecan be found in Section 2.4).
The numerical model was built and analysed using the FiniteElement software Abaqus (Dassault Systèmes). Given the tubular natureof the joints studied, an axisymmetric model was created, as it yieldsthe same results as would a 3D model but with a lower computing time[12]. The adherends were modelled with 4-node axisymmetric quad-rilateral elements (CAX4 in Abaqus), using the material propertiespresented in Tables 1 and 2. CZM can be applied to model the adhesivelayer following two different approaches: the “continuum” or the“local” approach. In the continuum approach, the entire adhesive layeris modelled as a single row of cohesive elements acting as an interfaceof finite thickness between the two adherends. In the local approach,the adhesive is modelled using solid elements, while zero-thicknesscohesive elements are inserted at the adhesive-adherends interfaces andwithin the adhesive layer to simulate different failure paths. For more
details on the two approaches, the readers are referred to Da Silva &Campilho [29]. The continuum approach is used to predict the adhesivebond failure on a macroscopic level and requires a low computationalcost, while the local approach allows for a more detailed analysis of thebond failure, for a higher computational cost. Since the objective of thiswork is limited to predicting the failure load of the tubular joints, thecontinuum approach was chosen. The adhesive layer was thereforemodelled as a single row of 4-node axisymmetric cohesive elements(COHAX4 in Abaqus). A trapezoidal traction-separation law, detailed inSection 2.3, was implemented to model the damage initiation andpropagation in the adhesive layer. A convergence study was carried outto determine suitable mesh sizes along the different dimensions, withbias effects applied to create smaller sized elements near the locationsof stress concentrations, as shown in Fig. 5. The minimum size for theelements was set to 0.05 mm, and the maximum size to 1 mm. Theboundary conditions shown in Fig. 4 were applied to the model to re-produce the testing conditions.
Fig. 1. Examples of bulk adhesive (a) and TAST (b) specimens, manufactured following the ISO 15166-1 and ISO 11003-2:201 standards, respectively.
Fig. 2. Vertical displacement measured by DIC around the bonding area of a TAST specimen, before loading (a) and just before failure (b).
N.P. Lavalette, et al. Composite Structures 240 (2020) 112077
3

2.3. CZM implementation
Using the continuum approach, CZM simulates the elastic loading ofan adhesive layer followed by local damage initiation and propagationuntil failure. It is formulated by a traction-separation law, which relatesthe stresses t and displacements δ between the paired nodes of a co-hesive element, in tension and shear. The exact shape of a traction-separation law can be determined experimentally, but requires an ex-tensive testing campaign [35,36]. Approximate laws, such as the tri-angular and trapezoidal laws shown in Fig. 6, have been shown to givesatisfactory results [22,34]. Therefore, the authors decided that usingan approximate law was suitable for the purpose of this work. The
choice of a shape to be used for the CZM depends on the adhesive type.Triangular and exponential laws, which model the stiffness degradationof the material immediately after damage initiation, show more accu-rate results for brittle adhesives, while a trapezoidal law, by re-presenting the plasticization of the material, is more suited to ductileadhesives [22]. In this work, a trapezoidal law is used to represent thebehaviour of the Araldite® 2015-1, using the material properties pre-sented in
Table 3 (with t0 in tension and shear taken as equal to σf and τf,respectively).
The initial linear elastic behaviour of the adhesive is defined by Eq.(1), where n and s represent tension and shear, respectively.
⎧⎨⎩
⎫⎬⎭
= ⎡⎣
⎤⎦
⎧⎨⎩
⎫⎬⎭
tt
KK
δδ
00
n
s
n
s
n
s (1)
Kn and Ks are calculated as the ratios between the elastic stiffness ofthe adhesive in tension and shear, respectively, and the characteristiclength of the adhesive layer, its thickness tadh [37]. The elastic loadingof the adhesive is coupled between tension and shear, and damage in-itiation is considered when the quadratic nominal stress criterion,shown in Eq. (2), is fulfilled. The brackets ⟨⟩ indicate that the value ismade equal to zero if negative, which prevents compressive stressesfrom initiating damage.
⎧⎨⎩
⟨ ⟩ ⎫⎬⎭
+ ⎧⎨⎩
⎫⎬⎭
=tt
tt
1n
n0
2s
s0
2
(2)
After damage initiation, the adhesive undergoes progressive de-gradation, characterized by the increase of a damage variable d defined
Fig. 3. Experimental stress-strain curves in tension (a) and shear (b) for Araldite 2015-1, obtained from bulk adhesive and TAST specimens, respectively.
Table 3Properties of the Araldite 2015–1.
Property Araldite 2015–1
Young's modulus, E [GPa] 1.64 ± 0.22Tensile yield strength, σy [MPa] 15.90 ± 1.19Tensile failure strength, σf [MPa] 21.56 ± 0.51Tensile failure strain, εf [%] 3.29 ± 0.53Shear modulus, G [GPa] 0.67 ± 0.12Shear yield strength, τy [MPa] 6.44 ± 1.03Shear failure strength, τf [MPa] 16.52 ± 0.42Shear failure strain, γf [%] 20.90 ± 3.23Toughness in tensiona, Gc
n [N/mm] 0.43 ± 0.02Toughness in sheara, Gc
s [N/mm] 4.70 ± 0.34Poisson’s ratiob, ν 0.33
a Values determined for Araldite 2015 in reference [34].b Manufacturer’s data.
Fig. 4. Dimensions of the tubular joint and boundary conditions.
N.P. Lavalette, et al. Composite Structures 240 (2020) 112077
4

by Eq. (3), where tund is the cohesive traction that would have beenreached without degradation.
= −t d t(1 ) und (3)
Damage progresses until failure at δf, whose value in tension andshear is calculated by considering the area under the respective curve tobe equal to its respective fracture toughness Gc. In the case of the tra-pezoidal law, a stress softening displacement δs is introduced. Afterdamage initiation, the adhesive maintains its peak strength despite theincrease of d, and the softening up to failure starts at δs. A simple pre-defined ratio of 0.8 was used between δs and δf, since the exact shape ofthe trapezoidal law has been shown to have a marginal impact on thejoint strength [38,39]. It should be noted that Abaqus only provides theimplementation of coupled degradation for the triangular and ex-ponential laws. Consequently, when using a trapezoidal law, the tensileand shear behaviours of the cohesive elements are independent fromdamage initiation to failure. The values of the damage variable d withrespect to the separation δ, in the constant stress and softening regions,were calculated from Eq. (4).
= − < <
= − < <−−
d δ δ δ
d t δ δ δ
1 if
1 if
δδ
s
δ δK δ δ δ
s f
0
( )0f
n s f s
0
, (4)
Since Kn and Ks depend on the value of tadh, new damage variablevalues must be calculated and implemented every time tadh is modifiedin the model, which increases the total computational cost.
2.4. Specimens manufacturing and testing
In order to validate the numerical model, specimens were fabricatedfor different values of Lo, tadh, tout and din. The values considered wereLo = 5, 10, 15 and 20 mm, tadh = 0.1, 0.2, 0.3 and 0.4 mm, tout = 2, 4,6 and 8 mm, and din = 2, 3, 4 and 5 mm. Each parameter was variedwhile the others were kept at constant “reference” values (Lo = 10 mm,tadh = 0.2 mm, tout = 6 mm and din = 3 mm, chosen arbitrarily amongthe two middle values of each parameter), resulting in 13 differentconfigurations. No tapering was done on either adherend, and tin waskept constant (0.5 mm). Five specimens were fabricated and tested foreach configuration.
Due to the CFRP tubes having a relatively small diameter, it is dif-ficult to grip them in the tensile machine without crushing them. Each
specimen therefore consisted of one CFRP tube bonded at both ends toaluminium tubes enlarged at their extremities to be properly set in thetensile machine, as seen on Fig. 7. The specimens were fabricated viathe following steps: (1) the adherends were degreased with acetone andmanually abraded using sandpaper, (2) the CFRP tubes were inserted inthe aluminium tubes and (3) the adhesive was injected in the overlapthrough an injection hole. A constant adhesive thickness and centring ofthe CFRP tube in the aluminium tube was ensured by a centring hole atthe bottom of the overlap, drilled at a diameter equal to the CFRP tube’sdiameter. To ensure a proper curing of the adhesive, the joined as-sembly was left for one week at room temperature. Testing of thespecimens was carried out until failure in a tensile testing machineequipped with a load cell of 20 kN, with a controlled displacement rateof 1 mm/min and at room temperature.
During the tensile tests, the machine measured the crosshead dis-placement, which comprises the deformation of the specimen as well asthe displacement induced by the deformation of the testing apparatus.The latter was measured by testing, in the same conditions, a shortspecimen made of steel (for a high stiffness resulting in negligiblespecimen deformations). The deformation of each joint specimen wasthen calculated by subtracting the deformation of the apparatus fromthe crosshead displacement. Furthermore, the deformation of the alu-minium between the grip and the section analysed by the FE model (seeFig. 5) is assumed negligible.
3. Results and discussions
3.1. Numerical model validation
3.1.1. Joint strength predictionAll specimens were tested in tension failure, which was considered
when the applied load reached a peak (Pf). In the sets of specimens withLo = 15 mm and 20 mm, a high standard deviation between the failureloads is observed (550 N and 380 N from the average failure load, re-spectively). CT scan images of the specimens with Lo = 15 mm weretaken after failure occurred (with the CFRP tubes still bonded to thealuminium tubes), in order to observe the adhesive layer and to try to
Fig. 5. Detail of the mesh for the FE model (withouttapering of the adherends).
Fig. 6. Representation of triangular and trapezoidal traction-separation lawshapes approximating the real behaviour of an adhesive.
Fig. 7. Example of tubular joint specimen (tout = 2 mm) in the testing appa-ratus.
N.P. Lavalette, et al. Composite Structures 240 (2020) 112077
5

understand the cause for this high failure load deviation. Fig. 8 showsthe three-dimensional images of each failed joint, reconstructed fromthe CT scan images, along with two-dimensional images of the corre-sponding midsections. The 3D images have been set to show only thematerial with the lowest density (air), so that air bubbles in the ad-hesive can be easily visualized. Thus, the grey column visible in eachimage represents the air inside the CFRP tube, and the clearer “masses”show the air trapped within the adhesive layer. The 2D images depictthe adhesive layer in white, the adherends in shades of grey and the airin black. Fig. 9 shows the CFRP tubes after they were completely pulledout from the aluminium tubes. The surface of a non-bonded CFRP tubeis provided as a reference, to be compared with the surfaces of the
pulled-out tubes. Fig. 10 shows the respective failure loads of the spe-cimens shown in Figs. 8 and 9.
The pulled-out CFRP tubes shown in Fig. 9 reveal that the specimenswith the lowest failure loads (specimens 4 and 5) are still entirelycovered by the adhesive layer, suggesting that the failure did nothappen within the adhesive but at the interface between the adhesiveand the aluminium. Conversely, the specimens with the highest failureloads (specimens 1 and 3) show adhesive only at the loaded end of theoverlap, suggesting a cohesive failure originating from this location. Itcan be concluded that one cause for the high deviation in failure loadsis an improper pre-treatment of the aluminium adherends. The bottomof the aluminium tubes was difficult to reach, which might have led toan insufficient abrasion in this area, with a higher risk of improperabrasion the higher the overlap length. It explains why the highestdeviations were observed for the specimen sets with the highest overlaplengths. On specimen 2, an important amount of adhesive is still pre-sent, and the surface of the CFRP tube looks like it was not properlybonded, suggesting an improper pre-treatment of the CFRP tube at thislocation. For future similar tests, the use of a more homogeneous pre-treatment technique on the aluminium adherends, such as chemicaletching, is advised.
Another possible cause for the high deviation is a misalignment ofthe adherends. The 2D images in Fig. 8 show that, despite the speci-mens being assembled in a fixture designed to keep the tubes centred,the CFRP tubes are off-centre close to the open end of the overlap, re-sulting in an uneven adhesive thickness in this area. This misalignmentbeing present in all of the five specimens scanned, it is difficult to gaugeits impact on the failure load of the joints. Although previous studieshave shown the robustness of tubular joints to manufacturing defects[17,18], the authors advise the use of a different centring method, suchas inserting nylon threads as spacers between the adherends. Similarly,air bubbles of various sizes can be observed in the 3D images of the
Fig. 8. CT scan images of the failed specimens with Lo = 15 mm: the 3D images show the air by making the other materials invisible, the 2D images show allmaterials (adhesive in white).
Fig. 9. CFRP tubes pulled out from the specimens with Lo = 15 mm.
Fig. 10. Experimental failure loads Pf for the specimens with Lo = 15 mm.
N.P. Lavalette, et al. Composite Structures 240 (2020) 112077
6
specimens with no apparent relationship between the size of the bub-bles and the failure loads of the specimens.
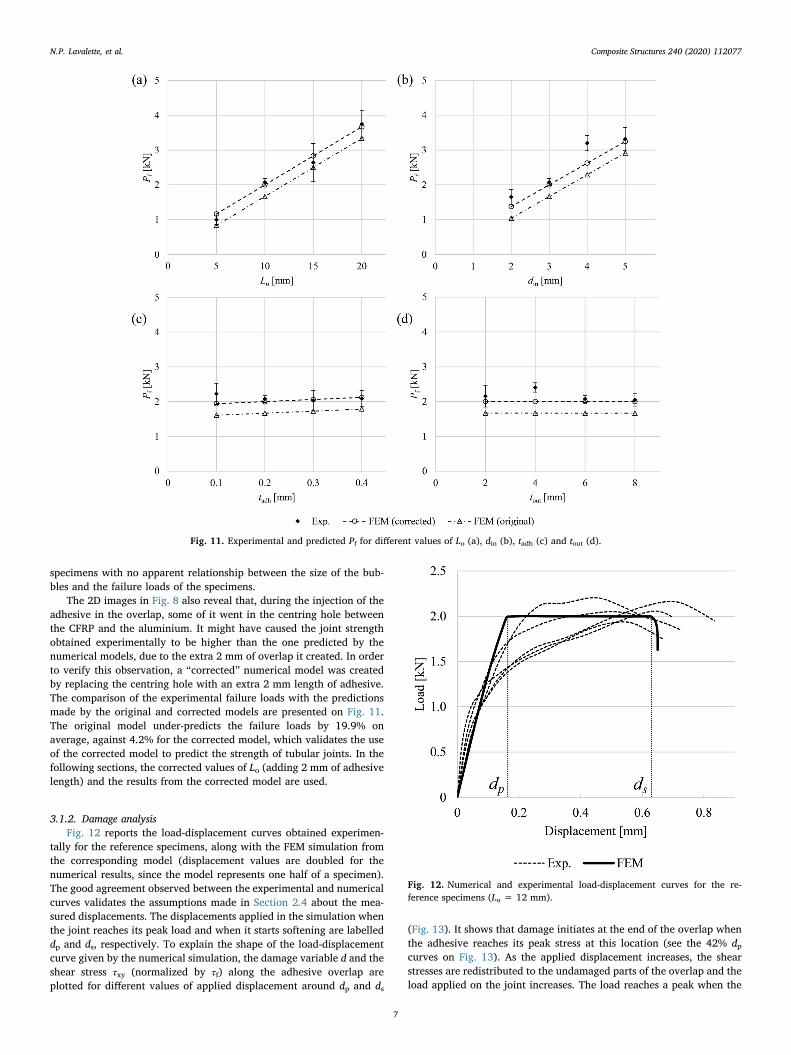
The 2D images in Fig. 8 also reveal that, during the injection of theadhesive in the overlap, some of it went in the centring hole betweenthe CFRP and the aluminium. It might have caused the joint strengthobtained experimentally to be higher than the one predicted by thenumerical models, due to the extra 2 mm of overlap it created. In orderto verify this observation, a “corrected” numerical model was createdby replacing the centring hole with an extra 2 mm length of adhesive.The comparison of the experimental failure loads with the predictionsmade by the original and corrected models are presented on Fig. 11.The original model under-predicts the failure loads by 19.9% onaverage, against 4.2% for the corrected model, which validates the useof the corrected model to predict the strength of tubular joints. In thefollowing sections, the corrected values of Lo (adding 2 mm of adhesivelength) and the results from the corrected model are used.
3.1.2. Damage analysisFig. 12 reports the load-displacement curves obtained experimen-
tally for the reference specimens, along with the FEM simulation fromthe corresponding model (displacement values are doubled for thenumerical results, since the model represents one half of a specimen).The good agreement observed between the experimental and numericalcurves validates the assumptions made in Section 2.4 about the mea-sured displacements. The displacements applied in the simulation whenthe joint reaches its peak load and when it starts softening are labelleddp and ds, respectively. To explain the shape of the load-displacementcurve given by the numerical simulation, the damage variable d and theshear stress τxy (normalized by τf) along the adhesive overlap areplotted for different values of applied displacement around dp and ds
(Fig. 13). It shows that damage initiates at the end of the overlap whenthe adhesive reaches its peak stress at this location (see the 42% dpcurves on Fig. 13). As the applied displacement increases, the shearstresses are redistributed to the undamaged parts of the overlap and theload applied on the joint increases. The load reaches a peak when the
Fig. 11. Experimental and predicted Pf for different values of Lo (a), din (b), tadh (c) and tout (d).
Fig. 12. Numerical and experimental load-displacement curves for the re-ference specimens (Lo = 12 mm).
N.P. Lavalette, et al. Composite Structures 240 (2020) 112077
7

entire overlap has initiated damage (97% dp and 103% dp curves) andthe stresses cannot be redistributed anymore. The applied load stays atthis peak value when the applied displacement increases further, andstarts dropping when the adhesive starts softening (102% ds curves), i.e.when d= 0.981 (calculated using the equations defined in Section 2.3).
The distinct separation values δ0 and δs of the trapezoidal law resultin a load–displacement curve with similarly distinct displacements dpand ds when the peak load is reached and when the load starts drop-ping. In contrast, the real traction-separation law for an adhesive is non-linear, i.e. it does not feature such distinct points delimitating linearzones, as shown in Fig. 6. It explains why the load–displacement curvesobtained experimentally have a continuous shape instead of the tra-pezoidal one obtained numerically. This is a limitation inherent to theapproximation of the traction-separation law, but given the good ac-curacy of the strength predictions obtained numerically, this approx-imation is judged acceptable for the purpose of this work.
3.2. Influence of the design parameters
3.2.1. Overlap length and inner tube diameterAs observed in Fig. 11, the overlap length (Lo) and inner tube dia-
meter (din) are the parameters with the highest influence on the jointstrength. The corrected model was used to predict the strength of jointswith several combinations of Lo and din, and the results are presented inFig. 14. The results show that a limit value of Lo exists after which Pf
does not increase further, and that this limit slightly increases with din.On the other hand, no limit value of din was observed. Fig. 15 shows theload-displacement curves obtained numerically for din = 3 mm anddifferent values of Lo.
The part of the curve where the joint maintains its peak load (theflat part) becomes shorter as Lo increases, and grows longer again afterthe limit value of Lo is reached. In order to explain this behaviour, adamage analysis similar to the one made in Section 3.1.2 is made for themodel with Lo = 62 mm (Fig. 16). Similarly to the joint withLo = 12 mm, after damage has initiated at the end of the overlap (seethe 8% dp curves on Fig. 16), the stresses are redistributed and the loadapplied to the joint keeps increasing. However, when the adhesivestarts failing at the end of the overlap and the peak stress zone stopsgrowing longer (89% dp and 101% dp curves), the load reaches Pf, eventhough the rest of the overlap has not initiated damage yet. The loadstarts dropping when damage has been initiated in the entire overlap(99% ds and 101% ds curves) and the peak stress zone becomes shorterdue to the adhesive gradually failing. In summary, before a certain limitvalue of Lo (around 47 mm in this case) there is a proportional increaseof Pf with Lo, due to the applied load reaching Pf only when the entireoverlap has initiated damage. Above this limit value of Lo, the appliedload reaches Pf when the peak stress zone cannot get any longer and theadhesive starts failing at one end of the overlap. The length of the peakstress zone being independent from Lo, further increasing Lo does notcause Pf to increase anymore.
3.2.2. Adhesive and adherends thicknessFig. 11c shows that the adhesive thickness (tadh) has no significant
Fig. 13. Damage variable (a) and normalized shear stress (b) along the adhesive overlap of the joint with Lo = 12 mm, where dp and ds are the displacements appliedwhen the joint reaches its peak load and when it starts softening, respectively.
Fig. 14. Failure load for different values of Lo and din.
Fig. 15. Load-displacement curves for different values of Lo, where dp and ds areindicated for Lo = 62 mm.
N.P. Lavalette, et al. Composite Structures 240 (2020) 112077
8

influence on the failure load of the joint, compared to the influence ofLo and din. Variations of tadh also have a marginal influence on the totalweight of the joint, and require extra computational time since a newtraction-separation law must be computed for each new value of tadh.Therefore considering the adhesive thickness as an optimization vari-able in the future is judged unnecessary, and the choice of a constantvalue is preferred.
Variations of the inner and outer tubes thickness (tin and tout, re-spectively) have an influence on Pf for high overlap lengths. Fig. 17shows the failure loads obtained numerically for different values of Lo,tin and tout. Reducing tout results in an increase of Pf for higher overlaplengths, while reducing tin results in a decrease of Pf. This is due to theinfluence of the adherends geometry on the shear stress distributionalong the adhesive overlap (see Fig. 18 for the case of Lo = 62 mm).Reducing tout contributes to reducing the stiffness imbalance betweenthe adherends, causing a better shear stress and damage distribution. Adifferent distribution has no influence on Pf for short overlap lengths,since in that case Pf is reached when the entire overlap has initiateddamage. However, for higher overlap lengths, Pf is reached when oneend of the overlap (the one with the highest peak stresses) starts failing,regardless of the amount of damage in the rest of the overlap. Lowershear stresses at this location cause the load required for the adhesive tofail to be higher, which results in a higher Pf plateau (as seen in Fig. 17).Conversely, reducing tin contributes to increasing the stiffness im-balance, which results in a lower Pf plateau. Additionally, there arelower limits on tout and tin, under which the applied load causes the
adherend to fail before the adhesive layer.
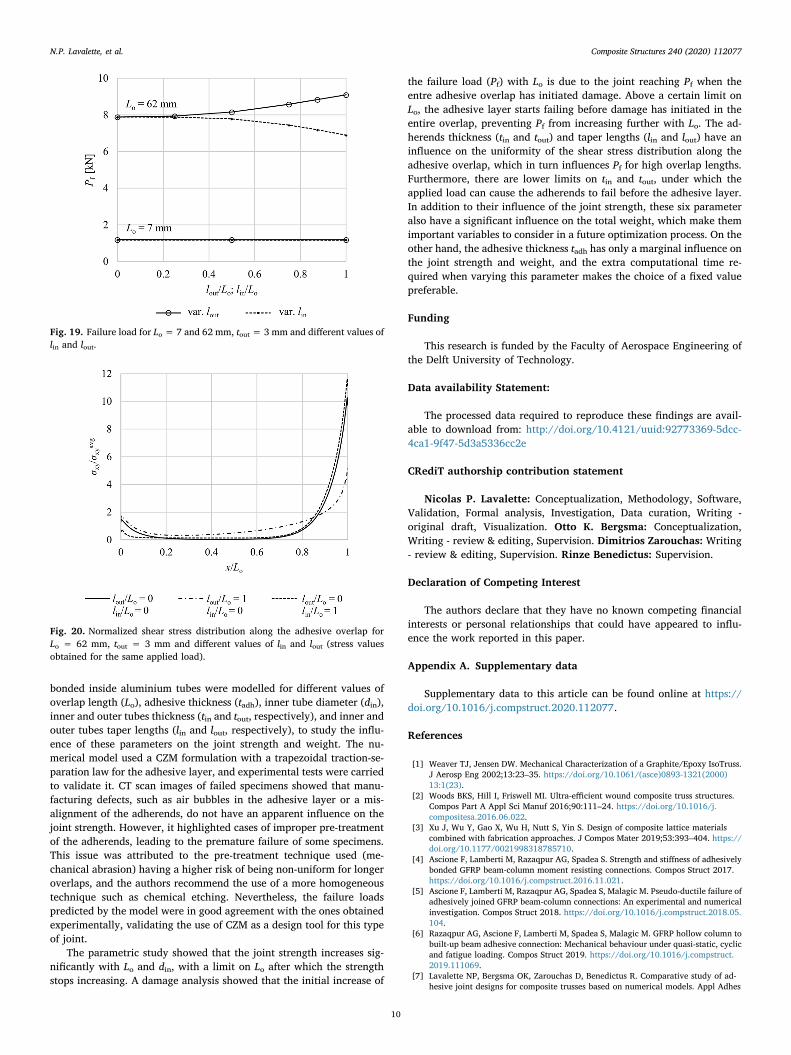
3.2.3. Taper lengthAs with the adherends thickness, the inner and outer tubes taper
lengths (lin and lout, respectively) have an influence on Pf for highoverlap lengths. Fig. 19 shows the failure loads obtained numericallyfor different values of lin and lout, for Lo = 7 and 62 mm. To ensure thatthe tapering of an adherend does not reduce its thickness (given by tinor tout), its length cannot exceed Lo. An outer tube thickness oftout = 3 mm was used for the results shown in Fig. 19. The results forLo = 7 mm show no influence of the tapering on Pf. For Lo = 62 mm,high values of lout result in a higher Pf, while high values of lin result in alower Pf. As explained in Section 3.2.2, the variation of the stiffnessimbalance between the adherends, here caused by the tapering, resultsin a variation of the stress distribution (shown in Fig. 20 forLo = 62 mm). Strength improvements are obtained when the taperlength of the stiffest adherend is increased, as shown with the increasein Pf obtained with a high lout. On the other hand, tapering the least stiffadherend further increases the stiffness imbalance, resulting in a de-crease of Pf.
4. Conclusions
In this work, tubular joints consisting of CFRP tubes adhesively
Fig. 16. Damage variable (a) and normalized shear stress (b) along the adhesive overlap of the joint with Lo = 62 mm, where dp and ds are the displacements appliedwhen the joint reaches its peak load and when it starts softening, respectively.
Fig. 17. Failure load for different values of Lo, tin and tout.
Fig. 18. Normalized shear stress distribution along the adhesive overlap forLo = 62 mm and different values of tin and tout (stress values obtained for thesame applied load).
N.P. Lavalette, et al. Composite Structures 240 (2020) 112077
9
bonded inside aluminium tubes were modelled for different values ofoverlap length (Lo), adhesive thickness (tadh), inner tube diameter (din),inner and outer tubes thickness (tin and tout, respectively), and inner andouter tubes taper lengths (lin and lout, respectively), to study the influ-ence of these parameters on the joint strength and weight. The nu-merical model used a CZM formulation with a trapezoidal traction-se-paration law for the adhesive layer, and experimental tests were carriedto validate it. CT scan images of failed specimens showed that manu-facturing defects, such as air bubbles in the adhesive layer or a mis-alignment of the adherends, do not have an apparent influence on thejoint strength. However, it highlighted cases of improper pre-treatmentof the adherends, leading to the premature failure of some specimens.This issue was attributed to the pre-treatment technique used (me-chanical abrasion) having a higher risk of being non-uniform for longeroverlaps, and the authors recommend the use of a more homogeneoustechnique such as chemical etching. Nevertheless, the failure loadspredicted by the model were in good agreement with the ones obtainedexperimentally, validating the use of CZM as a design tool for this typeof joint.
The parametric study showed that the joint strength increases sig-nificantly with Lo and din, with a limit on Lo after which the strengthstops increasing. A damage analysis showed that the initial increase of
the failure load (Pf) with Lo is due to the joint reaching Pf when theentre adhesive overlap has initiated damage. Above a certain limit onLo, the adhesive layer starts failing before damage has initiated in theentire overlap, preventing Pf from increasing further with Lo. The ad-herends thickness (tin and tout) and taper lengths (lin and lout) have aninfluence on the uniformity of the shear stress distribution along theadhesive overlap, which in turn influences Pf for high overlap lengths.Furthermore, there are lower limits on tin and tout, under which theapplied load can cause the adherends to fail before the adhesive layer.In addition to their influence of the joint strength, these six parameteralso have a significant influence on the total weight, which make themimportant variables to consider in a future optimization process. On theother hand, the adhesive thickness tadh has only a marginal influence onthe joint strength and weight, and the extra computational time re-quired when varying this parameter makes the choice of a fixed valuepreferable.
Funding
This research is funded by the Faculty of Aerospace Engineering ofthe Delft University of Technology.
Data availability Statement:
The processed data required to reproduce these findings are avail-able to download from: http://doi.org/10.4121/uuid:92773369-5dcc-4ca1-9f47-5d3a5336cc2e
CRediT authorship contribution statement
Nicolas P. Lavalette: Conceptualization, Methodology, Software,Validation, Formal analysis, Investigation, Data curation, Writing -original draft, Visualization. Otto K. Bergsma: Conceptualization,Writing - review & editing, Supervision. Dimitrios Zarouchas: Writing- review & editing, Supervision. Rinze Benedictus: Supervision.
Declaration of Competing Interest
The authors declare that they have no known competing financialinterests or personal relationships that could have appeared to influ-ence the work reported in this paper.
Appendix A. Supplementary data
Supplementary data to this article can be found online at https://doi.org/10.1016/j.compstruct.2020.112077.
References
[1] Weaver TJ, Jensen DW. Mechanical Characterization of a Graphite/Epoxy IsoTruss.J Aerosp Eng 2002;13:23–35. https://doi.org/10.1061/(asce)0893-1321(2000)13:1(23).
[2] Woods BKS, Hill I, Friswell MI. Ultra-efficient wound composite truss structures.Compos Part A Appl Sci Manuf 2016;90:111–24. https://doi.org/10.1016/j.compositesa.2016.06.022.
[3] Xu J, Wu Y, Gao X, Wu H, Nutt S, Yin S. Design of composite lattice materialscombined with fabrication approaches. J Compos Mater 2019;53:393–404. https://doi.org/10.1177/0021998318785710.
[4] Ascione F, Lamberti M, Razaqpur AG, Spadea S. Strength and stiffness of adhesivelybonded GFRP beam-column moment resisting connections. Compos Struct 2017.https://doi.org/10.1016/j.compstruct.2016.11.021.
[5] Ascione F, Lamberti M, Razaqpur AG, Spadea S, Malagic M. Pseudo-ductile failure ofadhesively joined GFRP beam-column connections: An experimental and numericalinvestigation. Compos Struct 2018. https://doi.org/10.1016/j.compstruct.2018.05.104.
[6] Razaqpur AG, Ascione F, Lamberti M, Spadea S, Malagic M. GFRP hollow column tobuilt-up beam adhesive connection: Mechanical behaviour under quasi-static, cyclicand fatigue loading. Compos Struct 2019. https://doi.org/10.1016/j.compstruct.2019.111069.
[7] Lavalette NP, Bergsma OK, Zarouchas D, Benedictus R. Comparative study of ad-hesive joint designs for composite trusses based on numerical models. Appl Adhes
Fig. 19. Failure load for Lo = 7 and 62 mm, tout = 3 mm and different values oflin and lout.
Fig. 20. Normalized shear stress distribution along the adhesive overlap forLo = 62 mm, tout = 3 mm and different values of lin and lout (stress valuesobtained for the same applied load).
N.P. Lavalette, et al. Composite Structures 240 (2020) 112077
10

Sci 2017;5:20. https://doi.org/10.1186/s40563-017-0100-1.[8] Neto JABP, Campilho RDSG, da Silva LFM. Parametric study of adhesive joints with
composites. Int J Adhes Adhes 2012;37:96–101. https://doi.org/10.1016/j.ijadhadh.2012.01.019.
[9] Ozel A, Yazici B, Akpinar S, Aydin MD, Temiz Ş. A study on the strength of adhe-sively bonded joints with different adherends. Compos Part B Eng 2014. https://doi.org/10.1016/j.compositesb.2014.03.001.
[10] Gültekin K, Akpinar S, Özel A. The effect of the adherend width on the strength ofadhesively bonded single-lap joint: Experimental and numerical analysis. ComposPart B Eng 2014. https://doi.org/10.1016/j.compositesb.2014.01.022.
[11] Banea MD, da Silva LFM, Carbas R, Campilho RDSG. Effect of material on themechanical behaviour of adhesive joints for the automotive industry. J Adhes SciTechnol 2016;31:663–76. https://doi.org/10.1080/01694243.2016.1229842.
[12] Barbosa DR, Campilho RDSG, Rocha RJB, Ferreira LRF. Experimental and numer-ical assessment of tensile loaded tubular adhesive joints. Proc Inst Mech Eng Part L JMater Des Appl 2018:1–13. https://doi.org/10.1177/1464420718808543.
[13] Li J, Yan Y, Zhang T, Liang Z. Experimental study of adhesively bonded CFRP jointssubjected to tensile loads. Int J Adhes Adhes 2015. https://doi.org/10.1016/j.ijadhadh.2014.11.001.
[14] Bouchikhi AS, Megueni A, Gouasmi S, Boukoulda FB. Effect of mixed adhesive jointsand tapered plate on stresses in retrofitted beams bonded with a fiber-reinforcedpolymer plate. Mater Des 2013. https://doi.org/10.1016/j.matdes.2013.03.052.
[15] Labbé S, Drouet JM. A multi-objective optimization procedure for bonded tubular-lap joints subjected to axial loading. Int J Adhes Adhes 2012. https://doi.org/10.1016/j.ijadhadh.2011.09.005.
[16] Ferreira LRF, Campilho RDSG, Rocha RJB, Barbosa DR. Geometrical and materialoptimization of tensile loaded tubular adhesive joints using cohesive zone model-ling. J Adhes 2019;00:1–25. https://doi.org/10.1080/00218464.2018.1551136.
[17] Kohl D, Ratsch N, Böhm S, Voß M, Kaufmann M, Vallée T. Influence of manu-facturing methods and imperfections on the load capacity of glued-in rods. J Adhes2018;00:1–22. https://doi.org/10.1080/00218464.2018.1508351.
[18] Gonzales E, Tannert T, Vallee T. The impact of defects on the capacity of timberjoints with glued-in rods. Int J Adhes Adhes 2016. https://doi.org/10.1016/j.ijadhadh.2015.11.002.
[19] Castagnetti D, Spaggiari A, Dragoni E. Effect of bondline thickness on the staticstrength of structural adhesives under nearly-homogeneous shear stresses. J Adhes2011;87:780–803. https://doi.org/10.1080/00218464.2011.597309.
[20] Budhe S, Banea MD, de Barros S, da Silva LFM. An updated review of adhesivelybonded joints in composite materials. Int J Adhes Adhes 2016;72:50. https://doi.org/10.1016/j.ijadhadh.2016.10.010.
[21] Fernandes TAB, Campilho RDSG, Banea MD, da Silva LFM. Adhesive Selection forSingle Lap Bonded Joints: Experimentation and Advanced Techniques for StrengthPrediction. J Adhes 2015;91:841–62. https://doi.org/10.1080/00218464.2014.994703.
[22] Campilho RDSG, Banea MD, Neto JABP, da Silva LFM. Modelling adhesive jointswith cohesive zone models: Effect of the cohesive law shape of the adhesive layer.Int J Adhes Adhes 2013;44:48–56. https://doi.org/10.1016/j.ijadhadh.2013.02.006.
[23] Ribeiro TEA, Campilho RDSG, da Silva LFM, Goglio L. Damage analysis of com-posite-aluminium adhesively-bonded single-lap joints. Compos Struct
2016;136:25–33. https://doi.org/10.1016/j.compstruct.2015.09.054.[24] Campilho RDSG, Pinto AMG, Banea MD, Silva RF, da Silva LFM. Strength im-
provement of adhesively-bonded joints using a reverse-bent geometry. J Adhes SciTechnol 2011;25:2351–68. https://doi.org/10.1163/016942411X580081.
[25] Dragoni E, Goglio L. Adhesive stresses in axially-loaded tubular bonded joints - PartI: Critical review and finite element assessment of published models. Int J AdhesAdhes 2013. https://doi.org/10.1016/j.ijadhadh.2013.09.009.
[26] Nunes SLS, Campilho RDSG, Da Silva FJG, De Sousa CCRG, Fernandes TAB, BaneaMD, et al. Comparative failure assessment of single and double lap joints withvarying adhesive systems. J Adhes 2016. https://doi.org/10.1080/00218464.2015.1103227.
[27] Harris JA, Adams RA. Strength prediction of bonded single lap joints by non-linearfinite element methods. Int J Adhes Adhes 1984;4:65–78. https://doi.org/10.1016/0143-7496(84)90103-9.
[28] Crocombe AD. Global yielding as a failure criterion for bonded joints. Int J AdhesAdhes 1989;9:145–53. https://doi.org/10.1016/0143-7496(89)90110-3.
[29] da Silva LFM. Campilho RDSG. Advances in numerical modelling of adhesive joints.SpringerBriefs Appl. Sci. Technol. 2012:1–93. https://doi.org/10.1007/978-3-642-23608-2_1.
[30] Hu XF, Chen BY, Tirvaudey M, Tan VBC, Tay TE. Integrated XFEM-CE analysis ofdelamination migration in multi-directional composite laminates. Compos Part AAppl Sci Manuf 2016. https://doi.org/10.1016/j.compositesa.2016.07.007.
[31] van Dongen B, van Oostrum A, Zarouchas D. A blended continuum damage andfracture mechanics method for progressive damage analysis of composite structuresusing XFEM. Compos Struct 2018. https://doi.org/10.1016/j.compstruct.2017.10.007.
[32] Lamberti M, Maurel-Pantel A, Ascione F, Lebon F. Influence of web/flange re-inforcement on the GFRP bonded beams mechanical response: A comparison withexperimental results and a numerical prediction. Compos Struct 2016. https://doi.org/10.1016/j.compstruct.2016.03.043.
[33] Campilho RDSG, Banea MD, Pinto AMG, da Silva LFM, de Jesus AMP. Strengthprediction of single- and double-lap joints by standard and extended finite elementmodelling. Int J Adhes Adhes 2011;31:363–72. https://doi.org/10.1016/j.ijadhadh.2010.09.008.
[34] Campilho RDSG, de Moura MFSF, Ramantani DA, Morais JJL, Domingues JJMS.Buckling Behaviour of Carbon-Epoxy Adhesively-Bonded Scarf Repairs. J Adhes SciTechnol 2009;23:1493–513. https://doi.org/10.1163/156856109X433045.
[35] Carlberger T, Stigh U. Influence of layer thickness on cohesive properties of anepoxy-based adhesive-an experimental study. J Adhes 2010;86:814–33. https://doi.org/10.1080/00218464.2010.498718.
[36] de Barros S, Champaney L, Valoroso N. Numerical simulations of crack propagationtests in adhesive bonded joints. Lat Am J Solids Struct 2012;9:339–51. https://doi.org/10.1590/s1679-78252012000300002.
[37] Dassault Systemes. Abaqus 2017 Documentation n.d.[38] Tvergaard V, Hutchinson JW. The relation between crack growth resistance and
fracture process parameters in elastic-plastic solids. J Mech Phys Solids 1992.https://doi.org/10.1016/0022-5096(92)90020-3.
[39] Yang QD, Thouless MD, Ward SM. Numerical simulations of adhesively-bondedbeams failing with extensive plastic deformation. J Mech Phys Solids 1999. https://doi.org/10.1016/S0022-5096(98)00101-X.
N.P. Lavalette, et al. Composite Structures 240 (2020) 112077
11