influence of fuel hydrogen fraction on syngas fueled si...
TRANSCRIPT

ww.sciencedirect.com
i n t e rn a t i o n a l j o u r n a l o f h y d r o g e n en e r g y 4 0 ( 2 0 1 5 ) 1 0 3 0 8e1 0 3 2 8
Available online at w
ScienceDirect
journal homepage: www.elsevier .com/locate/he
Influence of fuel hydrogen fraction on syngasfueled SI engine: Fuel thermo-physical propertyanalysis and in-cylinder experimentalinvestigations
Anand M. Shivapuji 1, S. Dasappa*
Center for Sustainable Technologies, Indian Institute of Science, Bangalore 560012, India
a r t i c l e i n f o
Article history:
Received 20 March 2015
Received in revised form
11 June 2015
Accepted 12 June 2015
Available online 9 July 2015
Keywords:
Syngas
Hydrogen
Conductivity
Diffusivity
Convective cooling
* Corresponding author. Tel.: þ91 984559820E-mail address: [email protected]
1 Tel.: þ91 9448775050.http://dx.doi.org/10.1016/j.ijhydene.2015.06.00360-3199/Copyright © 2015, Hydrogen Energ
a b s t r a c t
Hydrogen, either in pure form or as a gaseous fuel mixture specie enhances the fuel
conversion efficiency and reduce emissions in an internal combustion engine. This is due
to the reduction in combustion duration attributed to higher laminar flame speeds.
Hydrogen is also expected to increase the engine convective heat flux, attributed (directly
or indirectly) to parameters like higher adiabatic flame temperature, laminar flame speed,
thermal conductivity and diffusivity and lower flame quenching distance. These factors
(adversely) affect the thermo-kinematic response and offset some of the benefits.
The current work addresses the influence of mixture hydrogen fraction in syngas on the
engine energy balance and the thermo-kinematic response for close to stoichiometric
operating conditions. Four different bio-derived syngas compositions with fuel calorific
value varying from 3.14 MJ/kg to 7.55 MJ/kg and air fuel mixture hydrogen fraction varying
from 7.1% to 14.2% by volume are used. The analysis comprises of (a) use of chemical ki-
netics simulation package CHEMKIN for quantifying the thermo-physical properties (b) 0-D
model for engine in-cylinder analysis and (c) in-cylinder investigations on a two-cylinder
engine in open loop cooling mode for quantifying the thermo-kinematic response and
engine energy balance.
With lower adiabatic flame temperature for Syngas, the in-cylinder heat transfer
analysis suggests that temperature has little effect in terms of increasing the heat flux. For
typical engine like conditions (700 K and 25 bar at CR of 10), the laminar flame speed for
syngas exceeds that of methane (55.5 cm/s) beyond mixture hydrogen fraction of 11% and
is attributed to the increase in H based radicals. This leads to a reduction in the effective
Lewis number and laminar flame thickness, potentially inducing flame instability and
cellularity.
Use of a thermodynamic model to assess the isolated influence of thermal conductivity
and diffusivity on heat flux suggests an increase in the peak heat flux between 2% and 15%
for the lowest (0.420 MW/m2) and highest (0.480 MW/m2) hydrogen containing syngas over
methane (0.415 MW/m2) fueled operation. Experimental investigations indicate the engine
cooling load for syngas fueled engine is higher by about 7% and 12% as compared to
methane fueled operation; the losses are seen to increase with increasing mixture
hydrogen fraction. Increase in the gas to electricity efficiency is observed from 18% to 24%
3.n (S. Dasappa).
62y Publications, LLC. Published by Elsevier Ltd. All rights reserved.

i n t e r n a t i o n a l j o u r n a l o f h y d r o g e n en e r g y 4 0 ( 2 0 1 5 ) 1 0 3 0 8e1 0 3 2 8 10309
Table 1 e Thermo-physical properties oother fuels.
HydrogenH2
GaC
Stoichiometric A/F (kg/kg) 34.20 1
Flammability limit (f) [1,2] 0.1e7.1 0
Lower heating value (MJ/kg)
[19]
119.93 4
Minimum ignition energy
(mJ) [1,2]
0.02 0
Density (NTP conditions)
(kg/m3)
0.0831 4
Carbon to Hydrogen ratio
(mol/mol)
0.0 0
Laminar flame speed (m/s)
[19,20]
265e325 3
Adiabatic flame temperature
(K) [19]
2318 2
Flame quenching distance
(cm) [19,20]
0.064 0
Thermal conductivity
(W/mK) [3]
0.182 0
Diffusion coefficient (cm2/s)
[3,20]
0.61 0
Numbers in square brackets indicate referenc
properties.
as the mixture hydrogen fraction increases from 7.1% to 9.5%. Further increase in mixture
hydrogen fraction to 14.2% results in the reduction of efficiency to 23%; argued due to the
changes in the initial and terminal stages of combustion. On doubling of mixture hydrogen
fraction, the flame kernel development and fast burn phase duration decrease by about 7%
and 10% respectively and the terminal combustion duration, corresponding to 90%e98%
mass burn, increases by about 23%. This increase in combustion duration arises from the
cooling of the near wall mixture in the boundary layer attributed to the presence of
hydrogen. The enhancement in engine cooling load and subsequent reduction in the brake
thermal efficiency with increasing hydrogen fraction is evident from the engine energy
balance along with the cumulative heat release profiles.
Copyright © 2015, Hydrogen Energy Publications, LLC. Published by Elsevier Ltd. All rights
reserved.
Introduction
The primary focus of global research in the field of internal
combustion (IC) engines is towards maximizing thermal effi-
ciency and minimizing carbon emissions. Hydrogen as a fuel
source, can potentially meet both the objectives. Being a zero
carbon fuel, H2 combustion generates carbon free exhaust.
With higher laminar flame speed/adiabatic flame temperature
compared to other fuels (refer Table 1) engines fueled with H2
are expected to have superior thermal efficiency. Towards
this, research is being directed at fuelling spark ignited (SI)
engines with H2/H2 containing mixtures (combustible com-
pounds with H2 as a constituent) [1e5], the latter being the
preferred choice considering the challenges associated with
direct H2 fueled operation like pre-ignition, inlet manifold
f hydrogen and
soline
8H18
MethaneCH4
7.19 15.08
.7e4.0 0.5e1.67
4.50 50.02
.28 0.24
.4 0.665
.44 0.25
7e43 37e45
470 2148
.20 0.20
.011 0.034
.05 0.16
es for the respective
backfire [4,6], high pressure rise rates [5,7] and NOx formation
[8,9] etc. The basic philosophy is to blendH2 with other fuels to
improve the combustion characteristics, specifically to
extend/improve the lean limit operation [9e11] and as a fuel
specie as in syngas [12e15]. The use ofH2 with CH4 (designated
hythane), especially under lean operating conditions, is one of
the key areas begin exhaustively explored under this philos-
ophy [16e18].
While fuelling engines with H2 containing mixtures may
seem well aligned to satisfy the mandatory requirement of
curtailing carbon emissions, either directly through fuel sub-
stitution or indirectly by efficiency improvement, analysis of
the thermo-physical properties of H2 containing mixtures
suggest challenges towards realization of some of the envis-
aged benefits. Interestingly, the same thermo-physical char-
acteristics of H2 that support combustion characteristics also
tend to pose challenges in realizing the benefits, especially in
the close to stoichiometric operation regime.
The challenges
Certain key thermo-physical properties of H2 containing
mixtures that directly and indirectly enhance the engine ef-
ficiency also increase the engine cooling load, potentially
offsetting the benefits sought to be derived. The laminar flame
speed, adiabatic flame temperature, mixture thermal con-
ductivity/diffusivity (all of which increase with H2 fraction)
and flame quenching distance (which decreases with H2
fraction) are some of the key thermo-physical properties that
potentially have dual influence. While higher laminar flame
speed and adiabatic flame temperature influence both the
efficiency and heat transfer, the flame quenching distance
and mixture thermal conductivity/diffusivity directly influ-
ence the convective heat transfer between the working fluid
and the containing surface(s). The relevant thermophysical
properties of H2, gasoline and CH4 are consolidated for com-
parison in Table 1.While the effect of laminar flame speed and
adiabatic flame temperature on the thermal efficiency is well
established [9,21,22], the influence of described parameters on
engine heat transfer is briefly described as below.
1. Flame speed: Hydrogen increases the mixture laminar (and
hence turbulent) flame speed [23,24], leading to shorter

i n t e rn a t i o n a l j o u r n a l o f h y d r o g e n en e r g y 4 0 ( 2 0 1 5 ) 1 0 3 0 8e1 0 3 2 810310
combustion duration and a greater degree of constant
volume combustion. Reduced combustion duration causes
higher in-cylinder temperature (high heat release rate)
thereby higher temperature gradient, enhancing the heat
flux across the wall. Higher flame speeds further enhance
the convective heat flux by increasing the fluid turbulence
just ahead of the propagating front.
2. Adiabatic flame temperature: The adiabatic flame tempera-
ture ofH2 is significantly higher as compared to other fuels,
leading to higher in-cylinder temperature and temperature
gradients, enhancing the wall heat flux.
3. Flame quenching distance: Flames with H2 mixtures have a
smaller quenching distance compared to their corre-
sponding hydrocarbon flames. A smaller quenching dis-
tance means the flame front is positioned closer to the
wall. This increases the spatial temperature gradient and
enhances the fluidmotion between the flame front and the
wall (flame front driven charge motion) consequentially
enhancing the heat flux.
4. Thermal conductivity and diffusivity: Higher thermal con-
ductivity/diffusivity enhances the engine heat flux through
enhanced convective heat transfer coefficient, especially
from the un-burned segment of the in-cylinder gases.
It is evident from the foregone discussion that the pres-
ence of H2 in the working fluid has the potential to enhance
convective heat loss from the engine. The increase in
convective heat flux unfavorably skews the energy balance
and negatively influences the engine power rating and
emissions. This is evident from the analysis of the engine
power rating expression as in equation (1). For a given set of
engine parameters (like speed and swept volume), the peak
supported load by an engine frame is primarily governed by
the fuel thermo-physical properties and the brake thermal
efficiency. While the influence of density and calorific value
are explicit (refer Table 1), the concern sought to be
addressed in the current investigation pertains to the in-
fluence of the identified parameters on the brake thermal
efficiency and consequently on the power rating and
emissions.
P ¼�hv�Vs� N
60n
�|fflfflfflfflfflfflfflfflfflfflffl{zfflfflfflfflfflfflfflfflfflfflffl}Engine parameters
� ½rmix�a�Qmix�lcv�|fflfflfflfflfflfflfflfflfflfflfflfflffl{zfflfflfflfflfflfflfflfflfflfflfflfflffl}Thermophysical properties
�ht (1)
ht Thermal efficiency
hv Volumetric efficiency
rmix�a Mixture density
N Engine speed
P Power
Qmix�lcv Mixture calorific value
Vs Swept volume
CR Compression ratio
IC Internal combustion
MBT Maximum brake torque
NG Natural gas
PG Producer gas
SI Spark ignited
TDC Top dead center
Earlier studies
The previous discussion suggests potential enhanced cooling
load on fuelling engines with H2 containing mixtures. Docu-
mented operational experience with producer gas (PG), a bio-
derived gaseous fuel with composition of about 20% H2 and
CO, 2% CH4, 12% CO2 and balanceN2 [25] confirms the same. In
the operation of a six-cylinder natural gas (NG) engine fueled
with PG, the authors observed enhanced cooling load by about
5.5 ± 0.5% compared to typical values for conventional fuels
[26e28]. Similar observations have also been made by Sridhar
[29] in operating an SI engine with PG over a range of
compression ratios (CR) on a three cylinder engine of different
geometric configuration. A consequential drop in the fuel
conversion efficiency was also observed. The observations
were corroborated by comparing the wide open throttle
maximum brake torque (MBT) apparent heat release profiles
for PG and NG fulled operation as in Fig. 1. The combustion
duration for PG fueled operation, especially the second half, is
significantly larger than the corresponding NG combustion
duration, suggesting slow burning of the mixture. With PG
having higher reference burning velocity as compared to NG,
the increase in combustion duration can only be attributed to
the reduced flame speed due to cooling of the mixture [24].
The interpretation is further corroborated by the fact that the
exhaust gas temperature for PG fueled operation was about
75 K higher as compared to NG exhaust gas temperature
[26,29,30] (higher exhaust gas temperature is indicative of late
burning [21]). The inset data in Fig. 1 qualifies some of the
observations.
Review of literature
Limited literature is available addressing H2/H2 containing
mixtures fueled engine operation with reference to the influ-
ence on engine cooling load. The key findings of the available
literature are consolidated as below.
Shudo et al. [31,32] have compared the wall heat flux for
engine operation with CH4 and H2. For stoichiometric engine
operation at fixed volumetric efficiency and MBT ignition
timing (corresponding to each fuel) Shudo et al. report the heat
flux for H2 fueled engine operation to be 7 ± 0.5 J/m2�degCA as
compared to 4.5 ± 0.5 J/m2�degCA for CH4 fueled operation.
Fig. 1 e Heat release profile and duration for producer gas
and natural gas.

i n t e r n a t i o n a l j o u r n a l o f h y d r o g e n en e r g y 4 0 ( 2 0 1 5 ) 1 0 3 0 8e1 0 3 2 8 10311
Further, in a spark sweep test covering 45� before the top dead
center (TDC) to 9� before the TDC for CH4 and 18� before the
TDC to 18� after the TDC for H2, it was observed that the peak
heat flux with H2 as the fuel was 8 J/m2�degCA (72 kW/m2 at
1500 rpm) higher than that for CH4 fueled engine operation.
The increase in convective flux for H2 fueled operation is
explicitly evident. Having established higher heat loss from H2
fueled engines as compared to CH4 fueled engines, Shudo et al.
have explored options to curtail the convective losses and
have suggested stratified charge injection [33] as one of the
most optimal strategies. In stratified charge injection a lean
but ignitable H2eair mixture is inhaled by the engine during
the suction stroke and is compressed. Subsequently, H2 is
injected, mostly into the adiabatic core, just before ignition to
raise the overall stoichiometry to the desired levels. This
broadly isolates the H2 dominant region from the convective
heat transfer regime. Adopting this strategy, close to 15%
reduction in cooling load has been observed. Extending the
analysis to simulation studies, Shudo et al. have suggested
that the heat flux in the case of H2 fueled operation cannot be
accurately estimated using conventional heat transfer co-
efficients (like Annand's, Woschni's etc) and have proposed a
new convective heat transfer correlation [34]. Similarly,
Demuynck et al. [35], based on wall temperature and flux
measurement establish that conventional coefficients are not
suitable for capturing convective heat transfer for H2 and H2
containing fuels. Along similar lines, Ma et al. [9] have
observed an increase in the cooling load as H2 fraction in
H2eCNG blend increased. It is reported that the ratio of engine
cooling load to the cycle energy input increases from around
23% for pure CH4 operation to about 26% for hythane operation
with 50% hydrogen fraction by volume, leading to a reduction
in the stoichiometric operation brake thermal efficiency by
about 2% points. Knop et al. [36] highlight the need for adopt-
ing various sub modules particularly the heat transfer and
heat release module when H2 appears as a fuel component in
engines.
Scope and approach of the current work
Analysis of the thermo-physical properties, operational
experience with PG as a fuel and review of literature clearly
suggest an increase in the heat loss from the engine with
subsequent influence on the overall engine performance.
While the authors own experience with PG and the work by
Shudo et al. attempts to quantify the heat loss, detailed
corroborative evidence based on engine energy balance and
heat release profile over a range of H2 fractions is virtually non
existent in combustion literature. Towards bridging this gap,
the current work addresses the influence of H2 fraction in
syngas on the performance of an NG engine fueled with syn-
gas. In addressing the influence of syngas H2 fraction on the
engine performance, the explicit focus is on;
1. identifying the key thermo-physical properties of syngas/
syngaseair mixture that explicitly influence the engine
performance and address their sensitivity to syngas H2
fraction using the chemical kinetics package CHEMKIN
[37].
2. using the identified properties in a thermodynamic engine
simulation model to quantify their consolidated influence.
3. operating an engine with different syngas compositions,
varying in mixture H2 fraction, in open loop engine cooling
mode to quantify the influence of mixture H2 fraction on
the wall heat flux.
4. acquisition and analysis of in-cylinder pressure and heat
release profile(s) to quantify the influence of mixture H2
fraction on in-cylinder apparent heat release and thermo-
kinematic response. Special emphasis is on discretizing
the heat release profile towards analyzing the influence of
mixture H2 fraction.
While points 3 and 4 explicitly establish and quantify the
influence ofmixtureH2 fraction on the energy balance, point 1
and 2 provide the scientific justification for the observed
behavior. The authors believe that the current study is critical
considering that significant emphasis is on fuelling engines
with syngas and/or using H2 as an additive to improve the
combustion characteristics.
Materials and methods
The influence of H2 fraction in syngas on engine performance
is addressed through numerical simulations and parametric
investigation (including in-cylinder pressure trace acquisi-
tion) on a two cylinder four stroke SI engine fueled with four
different syngas compositions. The details pertaining to syn-
gas generation, gas composition, engine and instrumentation
specification along with the experimental and numerical
investigationmethodology are presented in the following sub-
sections.
Syngas: generation and composition
Syngas gas used in the current investigation is generated
in-situ from a down-draft gasifier that can be operated with
air or oxy-steam mixture as the gasifying agent depending on
the syngas composition required. Gasification of biomasswith
air as the gasifying agent generally results in syngas with
typical composition of 20% CO and H2, 2% CH4, 12% CO2 and
balance 46% N2. Replacing air with a mixture of oxygen and
steam (Oxy-steam) as the gasifying agent effectively elimi-
nating the inerts (N2) while introducing additional source ofH2
(steam) resulting in an enhancement in the fraction of
combustible components. The required H2 to CO ratio in the
syngas can be achieved by controlling the steam to biomass
ratio. Using air and oxy-steam gasification, four different
syngas compositions, designated C1 to C4, as listed in Table 2
are generated. The reader is referred to Dasappa et al. [25,38]
for further details including construction and operation
of air gasification system and Sandeep and Dasappa for
Oxy-Steam gasification [39,40].
Assessment of data consolidated in Table 2 indicates a
general increase in combustibles fraction, with H2 experi-
encing close to threefold increase. However, analysis of the
mixture composition, which is more relevant from an engine
perspective indicates that, while CO and CH4 fractions in the
mixture remain almost invariant, a near two fold increase in

Table 2 e Syngas and stoichiometric mixturecomposition in volume %.
Designation CO H2 CH4 CO2 N2 O2
Fuel gas (%)
C1 11.5 12.8 02.3 10.8 62.6 00.0
C2 13.0 19.4 02.8 11.3 53.5 00.0
C3 14.4 25.9 02.9 19.0 37.8 00.0
C4 16.4 37.2 03.6 24.7 18.1 00.0
Stoichiometric mixture (%)
C1 06.4 07.1 01.3 06.0 69.9 09.3
C2 06.4 09.5 01.4 05.5 66.5 10.7
C3 06.4 11.6 01.3 08.5 60.6 11.6
C4 06.3 14.2 01.4 09.4 55.7 13.0
Table 3 e Specifications of the engine.
Cylinders 2
Bore/Stroke/Displacement 91.44 (mm)/127 (mm)/1.67 (L)
Aspiration Natural
Engine speed 1500 rpm
Cooling Water cooled
Specific to diesel mode
Compression ratio 18.5:1
Rated output 15 kWe
Specific to gas mode
Compression ratio 11.0:1
Expected output with PGa about 7.8 kWe at f ¼ 1
a For composition of 20% CO and H2 and 2% CH4, balance
incombustibles.
i n t e rn a t i o n a l j o u r n a l o f h y d r o g e n en e r g y 4 0 ( 2 0 1 5 ) 1 0 3 0 8e1 0 3 2 810312
theH2 fraction is observed. As such, performance variations, if
any, on fuelling the engine with the four different composi-
tions can broadly be attributed to variation in H2 fraction.
Investigation methodology
Experimental investigations towards addressing the influence
of syngas composition on the engine performance were car-
ried out in two stages. The first stage involved the identifica-
tion of MBT ignition timing and the corresponding peak load
for the four gas compositions. The engine operation was
characterized at the respective peak load at MBT, representing
the wide open throttle condition. The second stage involved
engine operation and characterization at respective MBT
timing and at a fixed load (the least of peak loads of the four
different gas compositions has been chosen). The peak and
common load operation correspond and cater to two different
baseline scenarios. The choice of the mixture quality is pri-
marily based on review of literature which suggests that for
various H2 containing gases the brake thermal efficiency
peaks at mixture quality around f ¼ 0.85 [9,19,41,42]. Thus,
with mixture quality of f ¼ 0.85, the engine performance
corresponding to maximum brake thermal efficiency was
sought to be quantified.
For both peak and part load operation, the air and gas flow
rates, engine cooling jacket water flow rate along with the
inlet and exit temperature (to quantify cooling load) and in-
cylinder pressure traces for 250 consecutive cycles are
acquired.
Table 4 e Range and accuracy of the instruments used.
Instrument Range Accuracy
Fuel gas analyzer
CO 0�100% ±0.05%H2 0�100% ±0.05%CH4 0�100% ±0.05%CO2 0�100% ±0.05%O2 0�025% ±0.005%Cylinder pressure sensor 0�150 bar ±0.5 bar
Angle encoder ±0.25�
Venturi (Cd) ±1.0% (full scale)
Manometer ±1.00 mm
Optical speed sensor 0�20,000 rpm ±10 rpm
Thermocouple (K) �200 to 1250 �C >of 2.2 �C/0.75%Watt-meter 0�100 kW ±1.0%
Engine and instrumentation specification
The engine used in the current investigation is a NG engine
derived from a diesel frame. The baseline diesel and SI oper-
ation specifications of the engine are as listed in Table 3. The
engine, rated at 15 kWe under diesel mode is expected to
deliver about 7.8 kWe under standard composition PG (20% CO
andH2, 2% CH4, 12% CO2 and balance 46%N2) fueled operation.
This assessment is based on previous experience with PG
fueled operation wherein it has been observed that under
naturally aspirated and stoichiometric operation, the peak
load delivered by the engine is limited to about 4.65 kWe per
litre of swept volume. The factors contributing to power de-
rating and the corresponding recovery options have been
discussed by Dasappa [43] and the authors [27] elsewhere.
The in-cylinder pressure is measured using an AVL make
spark plug adapted, un-cooled, piezo-electric, differential
pressure sensor (GH13Z) at an acquisition frequency of 90 kHz.
Differential to absolute conversion is by using a manifold
pressure sensorwith a reference pressure supplement. Data is
acquired using an eight channel acquisition module (AVL
IndiModul) while real time processing and display is bymeans
of a graphical user interface (AVL IndiCom). The electrical
power delivered by the engine ismeasured using aWattmeter
while the temperature and flow measurement is through
thermocouples and venturi-manometer assembly respec-
tively. Fuel and flue gas composition are measured using SICK
MAIHAK and KANE QUINTOX gas analyzers. The range and
accuracy of the instruments used in the current analysis are
listed in Table 4 below.
Syngas thermo-physical properties
The chemical tomechanical energy conversion in an SI engine,
through phased heat release in the combustion chamber, is
significantly influenced by the mixture thermo-physical prop-
erties. As such, to gauge the potential engine response and
intervention required for stable/optimal operation, the thermo-
physical properties of the four syngas compositions and their
constituent components are discussed in the current section.
The thermo-physical properties are segregated into two groups,
the first group addresses the basic properties arrived at based

i n t e r n a t i o n a l j o u r n a l o f h y d r o g e n en e r g y 4 0 ( 2 0 1 5 ) 1 0 3 0 8e1 0 3 2 8 10313
on gas composition and in-cylinder process conditions while
the second group concentrates exclusively on the properties
associated with the premixed mixture laminar flame.
Evaluation of calorific value, specific heat, thermalconductivity and diffusivity
The key thermo-physical properties of the four gas composi-
tions and corresponding stoichiometric mixtures are evalu-
ated and consolidated in Table 5. The properties like specific
heat, thermal conductivity and viscosity are arrived at onmole
fractionweighted average basis and curve fit coefficients based
on molecular kinetic theory (for process conditions indicated
in Table foot note). The specie thermal conductivity (k) and
specie dynamic viscosity (m) as a function of temperature (T)
are estimated using the NASA curve fit expression and co-
efficients (Ak, Bk, Ck, Dk and Am, Bm, Cm, Dm) as in equation (2).
lnðkÞ ¼ Ak lnðTÞ þ Bk
Tþ Ck
T2þ Dk lnðmÞ ¼ Am lnðTÞ þ Bm
Tþ Cm
T2þ Dm
(2)
The individual specie viscosity data is used in the formu-
lation proposed byWilke [44], as in equation (3), for estimating
the mixture viscosity (mmix) while the mixture thermal con-
ductivity (lmix) is estimated using a combination averaging
formula proposed by Mathur et al. [45] as in equation (4).
mmix ¼Xi¼n
i¼1
mi
1xi
Pj¼nj¼1 xjfij
fij ¼
�1þ
�mimj
�1=2�Mj
Mi
�1=4�2
�4ffiffi2
p��
1þ�MiMj
��1=2 (3)
lmix ¼ 12
264Xi¼n
i¼1
xili þ 1Pi¼ni¼1
xili
375 (4)
Table 5 e Thermo-physical properties of syngas andstoichiometric mixtures.
Property Units C1 C2 C3 C4
Fuel properties
Molecular weight (kg/kMole) 26.12 24.98 23.96 21.85
Density (NTPa) (kg/m3) 1.09 1.04 1.00 0.91
Calorific value (MJ/kg) 3.14 4.17 5.28 7.55
(MJ/m3) 3.24 4.12 5.00 6.52
Specific heat (kJ/kg�K) 1.15 1.20 1.28 1.43
Thermal conductivity (mW/m�K) 35.9 40.2 46.7 56.3
Thermal diffusivity (cm2/s) 0.302 0.339 0.383 0.455
Stoichiometric airefuel
ratio
(kg/kg) 0.88 1.12 1.49 2.14
Fueleair mixture properties corresponding to f ¼ 1.00
Molecular weight (kg/kMole) 27.33 26.88 26.66 26.17
Density (NTPa) (kg/m3) 1.08 1.06 1.05 1.03
Calorific value (MJ/kg) 1.67 1.97 2.12 2.41
(MJ/m3) 1.80 2.09 2.24 2.49
Specific heat (kJ/kg�K) 0.99 0.99 0.99 1.00
Thermal conductivity (mW/m�K) 31.57 33.27 35.29 37.56
Thermal diffusivity (cm2/s) 0.296 0.317 0.337 0.363
a Temperature 298.15 K and Pressure 1.01325 bar.
The constant pressure specie specific heat (Cp) andmixture
specific heat (Cpmix) are evaluated from the expression as in
equation (5).
Cpi
Ru¼ a1 þ a2Tþ a3T
2 þ a4T3 þ a5T
4 Cpmix¼
Xi¼n
i¼1
xiCpi (5)
Among the properties listed in Table 5, the mixture prop-
erties are of interest considering that the in-cylinder ther-
modynamic response depends on the fueleair mixture rather
than the fuel alone. The mixture calorific value, both on mass
and volume basis, increases from C1 to C4. The highest calo-
rific value at 2.41 MJ/kg is however lower than NG calorific
value of 2.5 MJ/kg (conservative estimate based on 45 MJ/kg
fuel calorific value and 17:1 air to fuel ratio). The reduced
mixture energy density coupled with lower CR results in en-
gine power de-rating [27,43]. Hydrogen with high thermal
conductivity/diffusivity adds significantly to the mixture
conductivity/diffusivity, potentially enhancing the convective
heat losses from the engine. This aspect is dealt with in
greater details in a subsequent section. The twin effects of de-
rated engine operation (effectively part load operation for the
available infrastructure) and higher convective heat losses are
expected to adversely affect the engine performance in terms
of its overall fuel conversion efficiency.
Laminar flame properties e temperature and structure
The fluid and thermodynamic conditions prevailing inside the
engine cylinder are such that, the laminar flame thickness of
the mixture is generally of the same order of magnitude or
slightly higher than the prevalent Kolmogorov scale
�dLlk� 1
[24]. As such, the structure of the turbulent flame in the cyl-
inder is essentially one of highly wrinkled laminar flame
(wrinkled laminar flame regime) [46]. Thus, analysis of
laminar flame characteristics gives insight into the nature of
combustion in the engine and allows assessing the influence
on combustion phasing and hence on the ignition timing.
Similarly, the adiabatic flame temperature permits establish-
ing the upper limit of the thermodynamic efficiency.
In the current investigation, laminar flame characteristics
for the four gas compositions are determined using the
chemical kinetics package CHEMKIN [47] which simulates the
detailed structure of a freely propagating one dimensional
laminar flame in double infinity domain by solving for the
relevant conservation equations. The GRI-Mech 3.0 reaction
mechanism [48] involving 325 reactions (with 3 duplicates)
and 53 species is used for the reaction kinetics. Different as-
pects related to the laminar flame characteristics are consol-
idated as below.
Adiabatic flame temperatureThe variation of AFT with equivalence ratio at ambient
(1 bar/300 K) and engine like (25 bar/700 K) conditions (typical
motoring temperature and pressure for the considered en-
gine configuration) are presented Fig. 2(a) and (b) respec-
tively. The equivalence ratio at which the adiabatic flame
temperature peaks and the corresponding temperature are
explicitly indicated.

i n t e rn a t i o n a l j o u r n a l o f h y d r o g e n en e r g y 4 0 ( 2 0 1 5 ) 1 0 3 0 8e1 0 3 2 810314
Some of the key findings from the AFT parametric analysis
are presented below;
1. The AFT for the syngas compositions under consideration
is lower than individual specie values. This is attributed
to the presence of diluents CO2 and N2 in syngas, ranging
from approximately 75% for C1 to about 40% for C4 (refer
Table 2), influencing the gas calorific value (refer Table 5)
and hence the AFT. Comparing the AFT among the syngas
compositions, the dependence on calorific value is evident.
2. From ambient to engine like conditions (temperature and
pressure increase of 400 K and 24 bar) the increase in the
adiabatic flame temperature is in the range of 305 ± 10 K. A
simple analysis for composition C4 indicates that at 1 bar
pressure, an increase of unburned mixture temperature
from 300 K to 700 K increases the adiabatic flame temper-
ature by 218 K while at 300 K, increasing the unburned
mixture pressure from 1 bar to 25 bar leads to a modest
adiabatic flame temperature increase of only 32 K. Thus,
the increase in adiabatic flame temperature from ambient
to engine like conditions is primarily attributed to the in-
crease in unburned gas temperature with pressure having
very nominal effect, restricted only to suppression of
dissociation of the gaseous species.
3. In the operating equivalence ratio regime of interest i.e.,
1.0 ± 0.2, it can be observed that for both ambient and en-
gine like operating conditions, the difference in adiabatic
flame temperature between the considered compositions
broadly remains constant. No particular fuel specific
sensitivity to equivalence ratio is observed.
Summarizing the above results, it is evident that
the adiabatic flame temperature(s) being lower than the
constituent component temperature(s) over a range of ther-
modynamic conditions and equivalence ratio, any (potential)
Fig. 2 e Variation of adiabatic flame temperature with
equivalence ratio for syngas and constituent species.
higher cooling load observed during experimental in-
vestigations, cannot be attributed to the peak cylinder tem-
perature for the range of compositions considered in this
study.
Flame structureThe detailed laminar flame structure for stoichiometric
mixture under 1 bar pressure and 300 K temperature (ambient
condition) is consolidated in Fig. 3(a)e(d) for the four syngas
compositions used in the current investigation. The flame
structure is described based on the variation of temperature,
net heat release from the gas phase reactions and heat release
from the four highest heat release contributing reactions
against the reference linear coordinate. The flame structure
under engine like conditions (representative conditions;
25 bar pressure and 700 K temperature) has also been
considered for analysis as in Fig. 4.
The key feature explicitly evident from Figs. 3 and 4 is the
increase in flame temperature for gas compositions C1 to C4
and higher temperatures under engine like conditions. From
the heat generation rate profiles, the influence of fuel
composition (especially H2) on the reaction kinetics is clearly
evident. From Figs. 3 and 4 it can be observed that the net heat
generation rate from the gas phase reactions increases by an
order of magnitude from C1 to C4 resulting in AFT increase by
about 400 K for both ambient and engine like conditions. Be-
tween engine and ambient conditions, AFT temperature dif-
ference of about 250 K is observed. The increase in net heat
generation rate with increasing H2 fraction is attributed to the
significant increase in the overall reactivity. This is evident
from the comparison of forward rate of OH þ H2 4 H þ H2O
reaction for stoichiometric mixture of the four syngas com-
positions under ambient and engine like conditions as
consolidated in Table 6.
Increase in mixture H2 fraction, apart from enhancing the
heat generation rate, also reduces the thickness over which
the heat release take place, suggesting flame thickness
reduction. Evaluating the total flame thickness as the ratio of
temperature rise in the flame to the peak temperature
gradient [49,50]; about 50% reduction in the overall flame
thickness is observed from C1 to C4. Similarly, comparing the
flame thickness for ambient and engine like conditions, an
order of magnitude reduction is evident (flame thickness
magnitudes indicated as inset data of Figs. 3 and 4). The
observed behavior is explained from the flame thickness hy-
pothesis proposed by Glassman [51] as in equation (6). It is
observed that, with an increase in H2 or change in the condi-
tions from ambient to engine like conditions, the increase in
the product of density and thermal diffusivity (ra) is nominal
(refer Table 5) as compared to the increase in overall rate of
reaction, hence the reduction in flame thickness.
dflame ¼ffiffiffiffiffiffiffiffiffira
RoR
r(6)
While the reduction in the overall flame thickness is
explicitly evident, a simple analysis of the temperature and
net heat release profile suggests significant influence of H2
on the laminar flame pre-heat zone. Comparing the heat
release and temperature profiles, it is evident that, with

Fig. 3 e Laminar flame structure under ambient conditions for stoichiometric mixtures.
i n t e r n a t i o n a l j o u r n a l o f h y d r o g e n en e r g y 4 0 ( 2 0 1 5 ) 1 0 3 0 8e1 0 3 2 8 10315
increasing H2 fraction, the heat release starts at tempera-
tures much closer to un-burned gas temperature, suggesting
a reduction in the preheat zone thickness. Comparison of
the flame temperature at net heat release rate of 0.1 MW/m3
for the four compositions indicates the temperature to be
449 K for C1 reducing to 322 K for C4, confirming the
reduction of preheat zone thickness. This reduction is
directly attributed to the lower than unity Lewis number for
H2 and some of the key radicals associated with H2 com-
bustion (refer Table 7). Lower than unity Lewis number
results in preferential specie/radicals diffusion into the un-
burned mixture [52,53] and with some of the species having
very high reactivity, reaction of the mixture is initiated at
much lower temperatures very early into thermal heating.
With increasing mixture H2 fraction, rapid buildup of reac-
tive species ahead of the flame ensures initiation of heat
release at lower temperatures.
Analyzing the key participating reactions, it is observed
that reaction 84 (OHþH2¼HþH2O), basically a chain reaction
and the primary source of H radical generation, is the key
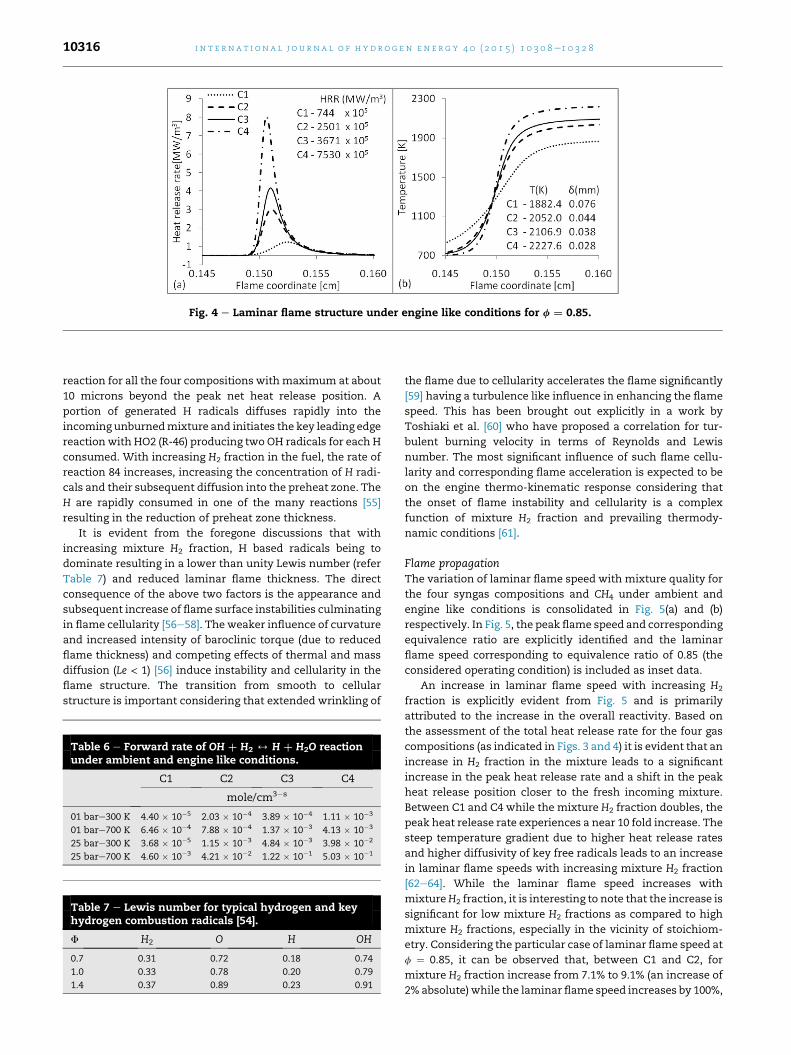
Fig. 4 e Laminar flame structure under engine like conditions for f ¼ 0.85.
i n t e rn a t i o n a l j o u r n a l o f h y d r o g e n en e r g y 4 0 ( 2 0 1 5 ) 1 0 3 0 8e1 0 3 2 810316
reaction for all the four compositions withmaximum at about
10 microns beyond the peak net heat release position. A
portion of generated H radicals diffuses rapidly into the
incoming unburnedmixture and initiates the key leading edge
reaction with HO2 (R-46) producing two OH radicals for each H
consumed. With increasing H2 fraction in the fuel, the rate of
reaction 84 increases, increasing the concentration of H radi-
cals and their subsequent diffusion into the preheat zone. The
H are rapidly consumed in one of the many reactions [55]
resulting in the reduction of preheat zone thickness.
It is evident from the foregone discussions that with
increasing mixture H2 fraction, H based radicals being to
dominate resulting in a lower than unity Lewis number (refer
Table 7) and reduced laminar flame thickness. The direct
consequence of the above two factors is the appearance and
subsequent increase of flame surface instabilities culminating
in flame cellularity [56e58]. The weaker influence of curvature
and increased intensity of baroclinic torque (due to reduced
flame thickness) and competing effects of thermal and mass
diffusion (Le < 1) [56] induce instability and cellularity in the
flame structure. The transition from smooth to cellular
structure is important considering that extended wrinkling of
Table 6 e Forward rate of OH þ H2 4 H þ H2O reactionunder ambient and engine like conditions.
C1 C2 C3 C4
mole/cm3�s
01 bare300 K 4.40 � 10�5 2.03 � 10�4 3.89 � 10�4 1.11 � 10�3
01 bare700 K 6.46 � 10�4 7.88 � 10�4 1.37 � 10�3 4.13 � 10�3
25 bare300 K 3.68 � 10�5 1.15 � 10�3 4.84 � 10�3 3.98 � 10�2
25 bare700 K 4.60 � 10�3 4.21 � 10�2 1.22 � 10�1 5.03 � 10�1
Table 7 e Lewis number for typical hydrogen and keyhydrogen combustion radicals [54].
F H2 O H OH
0.7 0.31 0.72 0.18 0.74
1.0 0.33 0.78 0.20 0.79
1.4 0.37 0.89 0.23 0.91
the flame due to cellularity accelerates the flame significantly
[59] having a turbulence like influence in enhancing the flame
speed. This has been brought out explicitly in a work by
Toshiaki et al. [60] who have proposed a correlation for tur-
bulent burning velocity in terms of Reynolds and Lewis
number. The most significant influence of such flame cellu-
larity and corresponding flame acceleration is expected to be
on the engine thermo-kinematic response considering that
the onset of flame instability and cellularity is a complex
function of mixture H2 fraction and prevailing thermody-
namic conditions [61].
Flame propagationThe variation of laminar flame speed with mixture quality for
the four syngas compositions and CH4 under ambient and
engine like conditions is consolidated in Fig. 5(a) and (b)
respectively. In Fig. 5, the peak flame speed and corresponding
equivalence ratio are explicitly identified and the laminar
flame speed corresponding to equivalence ratio of 0.85 (the
considered operating condition) is included as inset data.
An increase in laminar flame speed with increasing H2
fraction is explicitly evident from Fig. 5 and is primarily
attributed to the increase in the overall reactivity. Based on
the assessment of the total heat release rate for the four gas
compositions (as indicated in Figs. 3 and 4) it is evident that an
increase in H2 fraction in the mixture leads to a significant
increase in the peak heat release rate and a shift in the peak
heat release position closer to the fresh incoming mixture.
Between C1 and C4 while the mixture H2 fraction doubles, the
peak heat release rate experiences a near 10 fold increase. The
steep temperature gradient due to higher heat release rates
and higher diffusivity of key free radicals leads to an increase
in laminar flame speeds with increasing mixture H2 fraction
[62e64]. While the laminar flame speed increases with
mixtureH2 fraction, it is interesting to note that the increase is
significant for low mixture H2 fractions as compared to high
mixture H2 fractions, especially in the vicinity of stoichiom-
etry. Considering the particular case of laminar flame speed at
f ¼ 0.85, it can be observed that, between C1 and C2, for
mixture H2 fraction increase from 7.1% to 9.1% (an increase of
2% absolute) while the laminar flame speed increases by 100%,
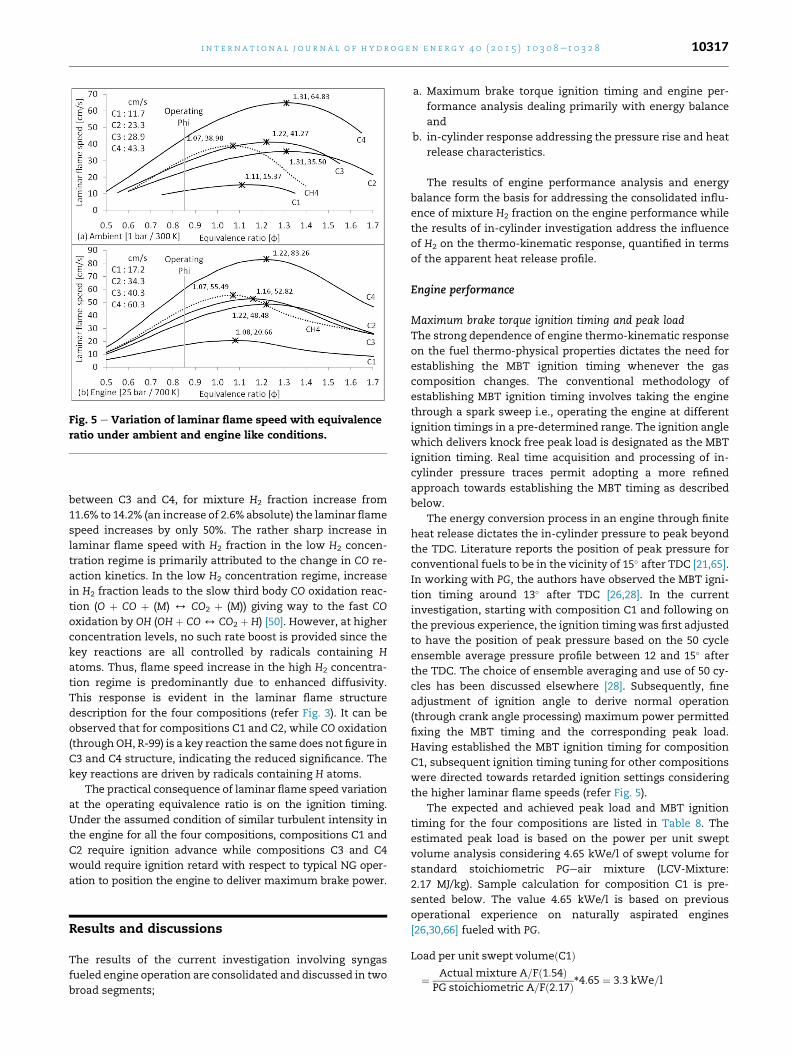
Fig. 5 e Variation of laminar flame speed with equivalence
ratio under ambient and engine like conditions.
i n t e r n a t i o n a l j o u r n a l o f h y d r o g e n en e r g y 4 0 ( 2 0 1 5 ) 1 0 3 0 8e1 0 3 2 8 10317
between C3 and C4, for mixture H2 fraction increase from
11.6% to 14.2% (an increase of 2.6% absolute) the laminar flame
speed increases by only 50%. The rather sharp increase in
laminar flame speed with H2 fraction in the low H2 concen-
tration regime is primarily attributed to the change in CO re-
action kinetics. In the low H2 concentration regime, increase
in H2 fraction leads to the slow third body CO oxidation reac-
tion (O þ CO þ (M) 4 CO2 þ (M)) giving way to the fast CO
oxidation by OH (OH þ CO 4 CO2 þ H) [50]. However, at higher
concentration levels, no such rate boost is provided since the
key reactions are all controlled by radicals containing H
atoms. Thus, flame speed increase in the high H2 concentra-
tion regime is predominantly due to enhanced diffusivity.
This response is evident in the laminar flame structure
description for the four compositions (refer Fig. 3). It can be
observed that for compositions C1 and C2, while CO oxidation
(throughOH, R-99) is a key reaction the same does not figure in
C3 and C4 structure, indicating the reduced significance. The
key reactions are driven by radicals containing H atoms.
The practical consequence of laminar flame speed variation
at the operating equivalence ratio is on the ignition timing.
Under the assumed condition of similar turbulent intensity in
the engine for all the four compositions, compositions C1 and
C2 require ignition advance while compositions C3 and C4
would require ignition retard with respect to typical NG oper-
ation to position the engine to deliver maximum brake power.
Results and discussions
The results of the current investigation involving syngas
fueled engine operation are consolidated and discussed in two
broad segments;
a. Maximum brake torque ignition timing and engine per-
formance analysis dealing primarily with energy balance
and
b. in-cylinder response addressing the pressure rise and heat
release characteristics.
The results of engine performance analysis and energy
balance form the basis for addressing the consolidated influ-
ence of mixture H2 fraction on the engine performance while
the results of in-cylinder investigation address the influence
of H2 on the thermo-kinematic response, quantified in terms
of the apparent heat release profile.
Engine performance
Maximum brake torque ignition timing and peak loadThe strong dependence of engine thermo-kinematic response
on the fuel thermo-physical properties dictates the need for
establishing the MBT ignition timing whenever the gas
composition changes. The conventional methodology of
establishing MBT ignition timing involves taking the engine
through a spark sweep i.e., operating the engine at different
ignition timings in a pre-determined range. The ignition angle
which delivers knock free peak load is designated as the MBT
ignition timing. Real time acquisition and processing of in-
cylinder pressure traces permit adopting a more refined
approach towards establishing the MBT timing as described
below.
The energy conversion process in an engine through finite
heat release dictates the in-cylinder pressure to peak beyond
the TDC. Literature reports the position of peak pressure for
conventional fuels to be in the vicinity of 15� after TDC [21,65].
In working with PG, the authors have observed the MBT igni-
tion timing around 13� after TDC [26,28]. In the current
investigation, starting with composition C1 and following on
the previous experience, the ignition timing was first adjusted
to have the position of peak pressure based on the 50 cycle
ensemble average pressure profile between 12 and 15� after
the TDC. The choice of ensemble averaging and use of 50 cy-
cles has been discussed elsewhere [28]. Subsequently, fine
adjustment of ignition angle to derive normal operation
(through crank angle processing) maximum power permitted
fixing the MBT timing and the corresponding peak load.
Having established the MBT ignition timing for composition
C1, subsequent ignition timing tuning for other compositions
were directed towards retarded ignition settings considering
the higher laminar flame speeds (refer Fig. 5).
The expected and achieved peak load and MBT ignition
timing for the four compositions are listed in Table 8. The
estimated peak load is based on the power per unit swept
volume analysis considering 4.65 kWe/l of swept volume for
standard stoichiometric PGeair mixture (LCV-Mixture:
2.17 MJ/kg). Sample calculation for composition C1 is pre-
sented below. The value 4.65 kWe/l is based on previous
operational experience on naturally aspirated engines
[26,30,66] fueled with PG.
Load per unit swept volumeðC1Þ
¼ Actual mixture A=Fð1:54ÞPG stoichiometric A=Fð2:17Þ*4:65 ¼ 3:3 kWe=l
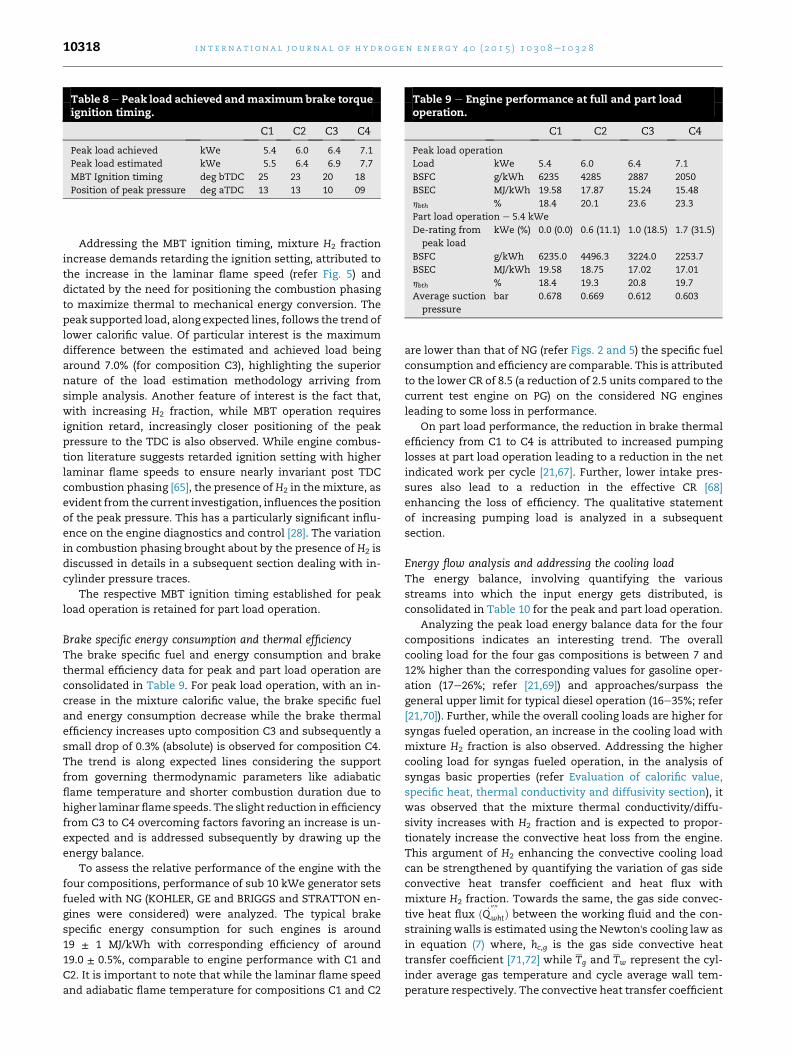
Table 9 e Engine performance at full and part loadoperation.
C1 C2 C3 C4
Peak load operation
Load kWe 5.4 6.0 6.4 7.1
BSFC g/kWh 6235 4285 2887 2050
BSEC MJ/kWh 19.58 17.87 15.24 15.48
hbth % 18.4 20.1 23.6 23.3
Part load operation e 5.4 kWe
De-rating from
peak load
kWe (%) 0.0 (0.0) 0.6 (11.1) 1.0 (18.5) 1.7 (31.5)
BSFC g/kWh 6235.0 4496.3 3224.0 2253.7
BSEC MJ/kWh 19.58 18.75 17.02 17.01
hbth % 18.4 19.3 20.8 19.7
Average suction
pressure
bar 0.678 0.669 0.612 0.603
Table 8 e Peak load achieved andmaximumbrake torqueignition timing.
C1 C2 C3 C4
Peak load achieved kWe 5.4 6.0 6.4 7.1
Peak load estimated kWe 5.5 6.4 6.9 7.7
MBT Ignition timing deg bTDC 25 23 20 18
Position of peak pressure deg aTDC 13 13 10 09
i n t e rn a t i o n a l j o u r n a l o f h y d r o g e n en e r g y 4 0 ( 2 0 1 5 ) 1 0 3 0 8e1 0 3 2 810318
Addressing the MBT ignition timing, mixture H2 fraction
increase demands retarding the ignition setting, attributed to
the increase in the laminar flame speed (refer Fig. 5) and
dictated by the need for positioning the combustion phasing
to maximize thermal to mechanical energy conversion. The
peak supported load, along expected lines, follows the trend of
lower calorific value. Of particular interest is the maximum
difference between the estimated and achieved load being
around 7.0% (for composition C3), highlighting the superior
nature of the load estimation methodology arriving from
simple analysis. Another feature of interest is the fact that,
with increasing H2 fraction, while MBT operation requires
ignition retard, increasingly closer positioning of the peak
pressure to the TDC is also observed. While engine combus-
tion literature suggests retarded ignition setting with higher
laminar flame speeds to ensure nearly invariant post TDC
combustion phasing [65], the presence of H2 in the mixture, as
evident from the current investigation, influences the position
of the peak pressure. This has a particularly significant influ-
ence on the engine diagnostics and control [28]. The variation
in combustion phasing brought about by the presence of H2 is
discussed in details in a subsequent section dealing with in-
cylinder pressure traces.
The respective MBT ignition timing established for peak
load operation is retained for part load operation.
Brake specific energy consumption and thermal efficiencyThe brake specific fuel and energy consumption and brake
thermal efficiency data for peak and part load operation are
consolidated in Table 9. For peak load operation, with an in-
crease in the mixture calorific value, the brake specific fuel
and energy consumption decrease while the brake thermal
efficiency increases upto composition C3 and subsequently a
small drop of 0.3% (absolute) is observed for composition C4.
The trend is along expected lines considering the support
from governing thermodynamic parameters like adiabatic
flame temperature and shorter combustion duration due to
higher laminar flame speeds. The slight reduction in efficiency
from C3 to C4 overcoming factors favoring an increase is un-
expected and is addressed subsequently by drawing up the
energy balance.
To assess the relative performance of the engine with the
four compositions, performance of sub 10 kWe generator sets
fueled with NG (KOHLER, GE and BRIGGS and STRATTON en-
gines were considered) were analyzed. The typical brake
specific energy consumption for such engines is around
19 ± 1 MJ/kWh with corresponding efficiency of around
19.0 ± 0.5%, comparable to engine performance with C1 and
C2. It is important to note that while the laminar flame speed
and adiabatic flame temperature for compositions C1 and C2
are lower than that of NG (refer Figs. 2 and 5) the specific fuel
consumption and efficiency are comparable. This is attributed
to the lower CR of 8.5 (a reduction of 2.5 units compared to the
current test engine on PG) on the considered NG engines
leading to some loss in performance.
On part load performance, the reduction in brake thermal
efficiency from C1 to C4 is attributed to increased pumping
losses at part load operation leading to a reduction in the net
indicated work per cycle [21,67]. Further, lower intake pres-
sures also lead to a reduction in the effective CR [68]
enhancing the loss of efficiency. The qualitative statement
of increasing pumping load is analyzed in a subsequent
section.
Energy flow analysis and addressing the cooling loadThe energy balance, involving quantifying the various
streams into which the input energy gets distributed, is
consolidated in Table 10 for the peak and part load operation.
Analyzing the peak load energy balance data for the four
compositions indicates an interesting trend. The overall
cooling load for the four gas compositions is between 7 and
12% higher than the corresponding values for gasoline oper-
ation (17e26%; refer [21,69]) and approaches/surpass the
general upper limit for typical diesel operation (16e35%; refer
[21,70]). Further, while the overall cooling loads are higher for
syngas fueled operation, an increase in the cooling load with
mixture H2 fraction is also observed. Addressing the higher
cooling load for syngas fueled operation, in the analysis of
syngas basic properties (refer Evaluation of calorific value,
specific heat, thermal conductivity and diffusivity section), it
was observed that the mixture thermal conductivity/diffu-
sivity increases with H2 fraction and is expected to propor-
tionately increase the convective heat loss from the engine.
This argument of H2 enhancing the convective cooling load
can be strengthened by quantifying the variation of gas side
convective heat transfer coefficient and heat flux with
mixture H2 fraction. Towards the same, the gas side convec-
tive heat flux ð _Q00 00
whtÞ between the working fluid and the con-
straining walls is estimated using the Newton's cooling law as
in equation (7) where, hc,g is the gas side convective heat
transfer coefficient [71,72] while Tg and Tw represent the cyl-
inder average gas temperature and cycle average wall tem-
perature respectively. The convective heat transfer coefficient

Table 10 e Engine energy balance and supporting information.
C1 C2 C3 C4
Peak load energy balance
Input energy kW (%) 29.37 (100) 29.78 (100) 27.09 (100) 30.53 (100)
Electrical output kW (%) 5.40 (18.4) 6.00 (20.1) 6.40 (23.6) 7.10 (23.3)
Cooling load kW (%) 9.85 (33.5) 10.35 (34.8) 9.95 (36.7) 11.50 (37.7)
Exhaust thermal enthalpy kW (%) 9.51 (32.4) 8.73 (29.3) 7.30 (27.0) 7.75 (25.4)
Supplementary energy balance data
Exhaust gas temperature �C 441 455 457 485
Exhaust flow rate kg/h 68.55 60.28 51.22 50.86
Part load energy balance
Input energy kW (%) 29.37 (100) 28.0 (100) 25.9 (100) 27.35 (100)
Electrical output kW (%) 5.40 (18.4) 5.40 (19.3) 5.40 (20.8) 5.40 (19.7)
Cooling load kW (%) 9.85 (33.5) 9.62 (34.4) 8.90 (34.3) 10.0 (36.6)
Exhaust thermal enthalpy kW (%) 9.46 (32.2) 7.98 (27.2) 6.56 (22.3) 5.90 (20.1)
Supplementary energy balance data
Exhaust gas temperature �C 441 450 438 440
Exhaust flow rate kg/h 68.55 56.31 47.88 42.77
i n t e r n a t i o n a l j o u r n a l o f h y d r o g e n en e r g y 4 0 ( 2 0 1 5 ) 1 0 3 0 8e1 0 3 2 8 10319
is estimated based on the empirical correlation relating the
Nusselt (Nu) number to the Reynolds (Re) and Prandtl number
(Pr) as in equation (8) [73] (relevant parameters described in
Table 11).
_Q00
wht ¼ hc;g
Tg � Tw
�(7)
Nu ¼ aReaPrb ¼ xRea ; hc;g ¼ xkBRea ¼ x
kB
�rVBm
�a(8)
The compression process heat flux as a function of crank
angle for stoichiometricmixtures of the four gas compositions
is consolidated in Fig. 6(a) while the same for three stoichio-
metric CH4�H2 mixtures is consolidated in Fig. 6(b). The per-
centage contribution ofH2 to themixture inmass, volume and
energy fraction is included as inset data.
An increase in H2 fraction from 25% to 75% in the CH4�H2
mixture leads to about 20% increase in the peak convective
heat flux (from 0.437 MW/m2 to 0.521 MW/m2) as indicated in
Fig. 6(a). Extending the analysis to the four syngas composi-
tions used in the present study (refer Fig. 6(b)), an increase in
the convective heat flux with H2 fraction is observed. The heat
flux at 0.420 MW/m2 for syngas composition C1 increases to
0.478 MW/m2 for composition C4, an increase of about 15%.
This manifests as an increase in the cooling load from
composition C1 to C4, attributed to the increase in mixture H2
fraction. This aspect has also been addressed by Saleel et al.
[74] based on the second low analysis of an H2 fueled engine.
It may also be noted that from C1 to C4, while the peak
supported load and exhaust gas temperature increase (refer
Table 10), the fraction of energy discharged as exhaust
Table 11 e Heat transfer coefficient estimation e parameter de
Parameter
Thermal conductivity, k
Dynamic viscosity, m
Characteristic length, B
Characteristic speed, V
Working fluid density, r
Coefficients a and x
enthalpy decreases. This response can be addressed based on
the analysis of the governing mathematical expression
(equation (9)) used for estimating the exhaust enthalpy.
_Qexh ¼ _mexhCp�exhðTexh � TambÞ (9)
Using the data from Table 10 it can be observed that
the exhaust gas flow rate and temperature have opposite
trends from composition C1 to C4 and the reduction in
exhaust flow rate is significantly higher (26%) as compared to
the increase in the temperature (16%). This leads to a reduc-
tion in the exhaust enthalpy from composition C1 to C4 (refer
equation (9)).
Engine cooling load e a side noteWhile the foregone discussion on energy balance explicitly
establishes the influence of H2 in enhancing the cooling load
which is also supported by the analysis of syngas thermo-
physical properties (refer Syngas thermo-physical properties
section), two pertinent features, as identified below require
particular attention.
1. The calculated convective heat transfer coefficient and
peak heat flux (at TDC) for pure CH4 and syngas C1 are very
similar (C1 heat flux is higher only by 0.005 MW/m2 as
compared to CH4). This suggests that for similar in-cylinder
conditions, the convective heat losses for C1 fueled oper-
ation would be only slightly higher than that due to CH4
fueled operation.
2. Considering the actual engine operation, with the adiabatic
flame temperature and energy density for C1 being
scription and magnitudes.
Remarks
f(T); Estimated from kinetic theory curve-fit coefficients
f(T); Estimated from kinetic theory curve-fit coefficients
Engine bore diameter (0.102 m)
Mean piston speed (6 m/s)
f(q); Ratio of mass to volume
0.7 and 0.5 respectively; 0.35 � x � 0.80; refer [21]

Fig. 6 e Influence of gas composition on the engine
convective heat flux.
i n t e rn a t i o n a l j o u r n a l o f h y d r o g e n en e r g y 4 0 ( 2 0 1 5 ) 1 0 3 0 8e1 0 3 2 810320
significantly lower than CH4 (refer Table 2) and the engine
operating lean, the in-cylinder thermal conditions for C1
operation are expected to be significantly dilute as
compared to CH4 fueled operating.
Considering the divergent conditions prevailing in the en-
gine pertaining to convective heat transfer as brought out by
the listed points, theoretically, the heat losses for typical CH4
operation and Syngas C1 should be very similar, to say the
least. Measurements however reveal significantly higher
cooling loads for syngas fueled operation (refer Table 10). It is
apparent from the above analysis that the convective heat flux
and hence the engine cooling load are influenced by more
than one parameters. While the current work addresses the
influence of thermo-physical properties on the heat flux, both
qualitatively and quantitatively, preliminary analysis based
on equation (8) (necessitated by the above observation) in-
dicates to the potential influence of turbulence. Considering
that syngas fueled experience has always been with diesel
adopted engines, as also in the current case, the potential role
of adopted in-cylinder geometry in enhancing the heat flux,
through higher in-cylinder turbulence, requires a detailed
analysis, not in the scope of the current work.
Table 12e Part load pressure trace derivedmean effectivepressure parameters.
C1 C2 C3 C4
IMEP-Gross bar 4.177 4.235 4.457 4.500
IMEP-Pumping bar 0.284 0.278 0.302 0.319
IMEP-Nett bar 3.893 3.957 4.155 4.181
Mechanical efficiency % 66.35 65.45 62.33 61.94
Throttle work J/cycle 24.27 25.52 27.69 29.94
Peak cylinder pressure Bar 24.27 25.25 27.16 30.35
In-cylinder investigations
Acquisition of in-cylinder pressure data permits (a) extending
the generic performance analysis to include the indicated/
pumping response and (b) the analysis of engine thermo-
kinematic response, one of the key mandates of the current
investigation. These two aspects are discussed in the
following sections.
Indicated and pumping load analysisIn the analysis of brake thermal performance of the engine
for the four compositions (refer Brake specific energy
consumption and thermal efficiency section) it was observed
that, with increasing H2 fraction (moving from C1 to C4), while
the brake thermal efficiency increased for full load operation,
it decreased for part load operation. The part load behavior is
sought to be analyzed through the indicated parameters
derived from in-cylinder pressure traces as quantified in Table
12. One of the key features of the indicated data is the sig-
nificant reduction inmechanical efficiency onmoving fromC1
to C4, the maximum being 66.35% against typical values of
around 90%. The under 70% efficiency is typical of engine
operation in the sub 30% operational load regime [21]. The
reduction in mechanical efficiency causes a commensurate
reduction in the brake thermal efficiency.
The reduction in mechanical efficiency (from C1 to C4) for
the fixed load of 5.4 kWe is primarily attributed to the increase
in pumping losses caused by higher throttle work ([Pe � Pi]Vd,
restriction experienced external to the cylinder), due to
reduced throttle opening as evident from Fig. 7(a). The in-
crease in throttle work is significant to overcome the reduc-
tion in valve flow work (restriction attributed to the flow
through the valves) at part load, with the net effect being an
increase in the pumping losses. The other key factor contrib-
uting to in-cylinder losses is the higher in-cylinder pressure
for compositions with higher H2 fraction (at the same load of
5.4 kWe) as evident from Fig. 7(b) and quantified in Table 12.
Higher in-cylinder pressures lead to enhancement in the
rubbing friction [75,76] leading to enhanced losses. With
respect to the rubbing friction, it is important to note that the
baseline diesel piston having three piston rings is adapted for
gasoline operation as against two piston rings typical for SI
operation (refer Fig. 8). The increasing in-cylinder pressures
coupled with more number of piston rings effectively am-
plifies the frictional losses. Thus, the increase in throttle work
and rubbing friction leads to a reduction in the mechanical
and hence brake thermal efficiency from composition C1 to C4
under part load conditions.
Thermo-kinematic responseMaximum brake torque combustion phasing. A review of
literature pertaining to MBT combustion phasing for engine
operation with conventional fuels indicates invariance of
certain geometric inflection characteristics (known as com-
bustion descriptors) corresponding to pressure-crank angle
and heat release-crank angle traces [21]. The (ensemble
average) position of peak pressure andmaximumheat release
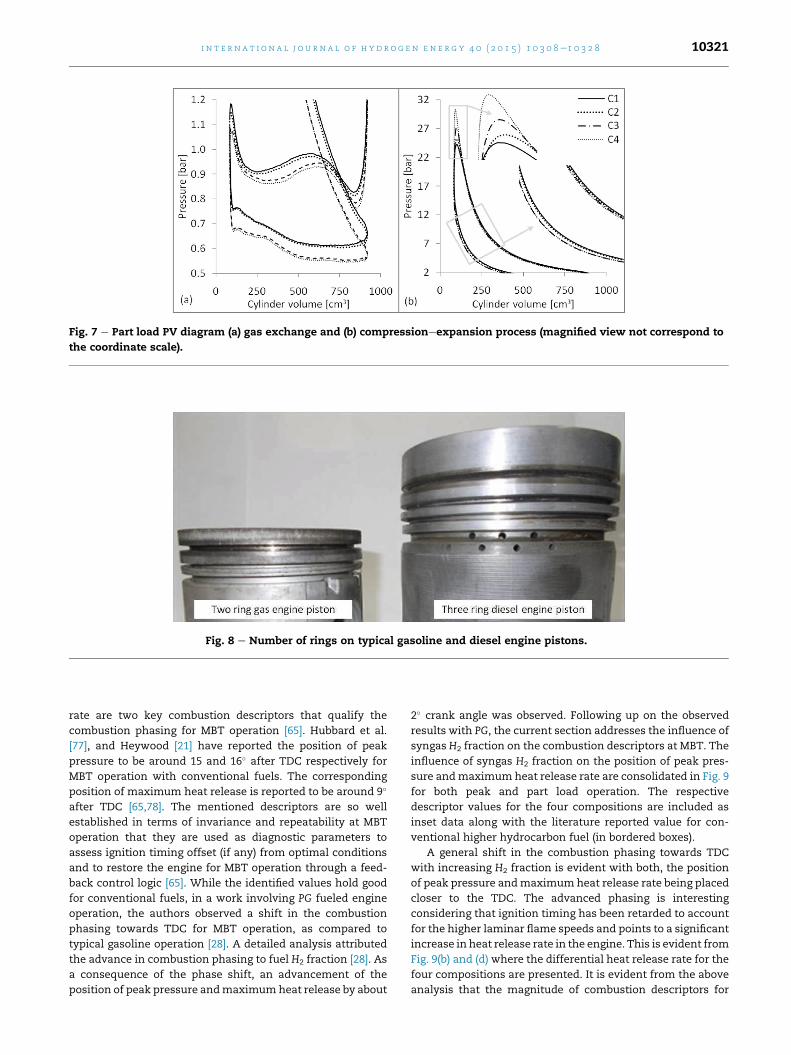
Fig. 7 e Part load PV diagram (a) gas exchange and (b) compressioneexpansion process (magnified view not correspond to
the coordinate scale).
Fig. 8 e Number of rings on typical gasoline and diesel engine pistons.
i n t e r n a t i o n a l j o u r n a l o f h y d r o g e n en e r g y 4 0 ( 2 0 1 5 ) 1 0 3 0 8e1 0 3 2 8 10321
rate are two key combustion descriptors that qualify the
combustion phasing for MBT operation [65]. Hubbard et al.
[77], and Heywood [21] have reported the position of peak
pressure to be around 15 and 16� after TDC respectively for
MBT operation with conventional fuels. The corresponding
position of maximum heat release is reported to be around 9�
after TDC [65,78]. The mentioned descriptors are so well
established in terms of invariance and repeatability at MBT
operation that they are used as diagnostic parameters to
assess ignition timing offset (if any) from optimal conditions
and to restore the engine for MBT operation through a feed-
back control logic [65]. While the identified values hold good
for conventional fuels, in a work involving PG fueled engine
operation, the authors observed a shift in the combustion
phasing towards TDC for MBT operation, as compared to
typical gasoline operation [28]. A detailed analysis attributed
the advance in combustion phasing to fuel H2 fraction [28]. As
a consequence of the phase shift, an advancement of the
position of peak pressure andmaximumheat release by about
2� crank angle was observed. Following up on the observed
results with PG, the current section addresses the influence of
syngas H2 fraction on the combustion descriptors at MBT. The
influence of syngas H2 fraction on the position of peak pres-
sure andmaximumheat release rate are consolidated in Fig. 9
for both peak and part load operation. The respective
descriptor values for the four compositions are included as
inset data along with the literature reported value for con-
ventional higher hydrocarbon fuel (in bordered boxes).
A general shift in the combustion phasing towards TDC
with increasing H2 fraction is evident with both, the position
of peak pressure andmaximumheat release rate being placed
closer to the TDC. The advanced phasing is interesting
considering that ignition timing has been retarded to account
for the higher laminar flame speeds and points to a significant
increase in heat release rate in the engine. This is evident from
Fig. 9(b) and (d) where the differential heat release rate for the
four compositions are presented. It is evident from the above
analysis that the magnitude of combustion descriptors for
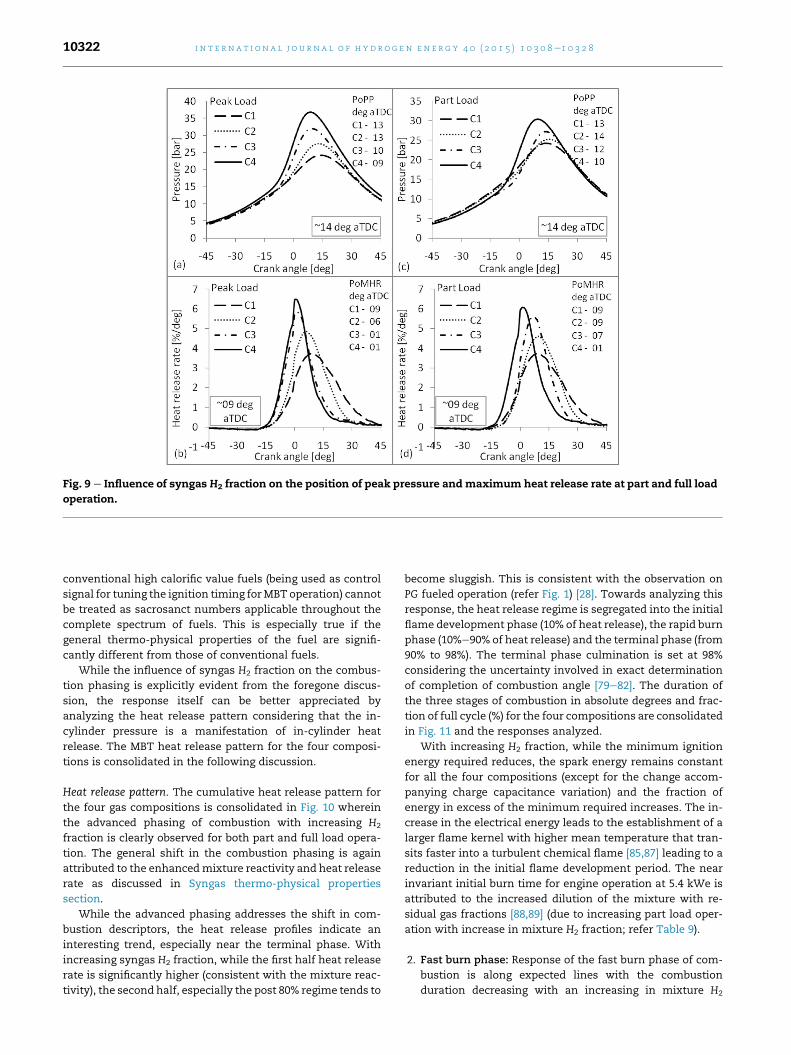
Fig. 9 e Influence of syngas H2 fraction on the position of peak pressure andmaximum heat release rate at part and full load
operation.
i n t e rn a t i o n a l j o u r n a l o f h y d r o g e n en e r g y 4 0 ( 2 0 1 5 ) 1 0 3 0 8e1 0 3 2 810322
conventional high calorific value fuels (being used as control
signal for tuning the ignition timing forMBT operation) cannot
be treated as sacrosanct numbers applicable throughout the
complete spectrum of fuels. This is especially true if the
general thermo-physical properties of the fuel are signifi-
cantly different from those of conventional fuels.
While the influence of syngas H2 fraction on the combus-
tion phasing is explicitly evident from the foregone discus-
sion, the response itself can be better appreciated by
analyzing the heat release pattern considering that the in-
cylinder pressure is a manifestation of in-cylinder heat
release. The MBT heat release pattern for the four composi-
tions is consolidated in the following discussion.
Heat release pattern. The cumulative heat release pattern for
the four gas compositions is consolidated in Fig. 10 wherein
the advanced phasing of combustion with increasing H2
fraction is clearly observed for both part and full load opera-
tion. The general shift in the combustion phasing is again
attributed to the enhancedmixture reactivity and heat release
rate as discussed in Syngas thermo-physical properties
section.
While the advanced phasing addresses the shift in com-
bustion descriptors, the heat release profiles indicate an
interesting trend, especially near the terminal phase. With
increasing syngas H2 fraction, while the first half heat release
rate is significantly higher (consistent with the mixture reac-
tivity), the second half, especially the post 80% regime tends to
become sluggish. This is consistent with the observation on
PG fueled operation (refer Fig. 1) [28]. Towards analyzing this
response, the heat release regime is segregated into the initial
flame development phase (10% of heat release), the rapid burn
phase (10%e90% of heat release) and the terminal phase (from
90% to 98%). The terminal phase culmination is set at 98%
considering the uncertainty involved in exact determination
of completion of combustion angle [79e82]. The duration of
the three stages of combustion in absolute degrees and frac-
tion of full cycle (%) for the four compositions are consolidated
in Fig. 11 and the responses analyzed.
With increasing H2 fraction, while the minimum ignition
energy required reduces, the spark energy remains constant
for all the four compositions (except for the change accom-
panying charge capacitance variation) and the fraction of
energy in excess of the minimum required increases. The in-
crease in the electrical energy leads to the establishment of a
larger flame kernel with higher mean temperature that tran-
sits faster into a turbulent chemical flame [85,87] leading to a
reduction in the initial flame development period. The near
invariant initial burn time for engine operation at 5.4 kWe is
attributed to the increased dilution of the mixture with re-
sidual gas fractions [88,89] (due to increasing part load oper-
ation with increase in mixture H2 fraction; refer Table 9).
2. Fast burn phase: Response of the fast burn phase of com-
bustion is along expected lines with the combustion
duration decreasing with an increasing in mixture H2

Fig. 10 e MBT cumulative heat release for the four syngas compositions at peak and part load operation.
i n t e r n a t i o n a l j o u r n a l o f h y d r o g e n en e r g y 4 0 ( 2 0 1 5 ) 1 0 3 0 8e1 0 3 2 8 10323
fraction. The reduction is significant (~17%) for full load
operation as compared to part load operation (~7%). Anal-
ysis of the nature of premixed turbulent combustion
prevalent in typical engine like environments is useful to
describe the observed trend. Photographic evidence based
on schlieren/shadowgraphy techniques [90], laser scat-
tering techniques [91,92] and comparison of laminar flame
thickness e Kolmogorov scale as in BorghiePeters dia-
grams [93,94] indicates the combustion in SI IC engines to
be mostly being in the flamelet (wrinkled laminar flame)
regime and some times extending to flamelet in eddies
regime [24,46] depending on the operating condition. In the
flamelet regime, while the eddies wrinkle the thin flame
front, the combustion itself is at the characteristic laminar
flame speed. Wrinkling of the flame front leads to the for-
mation of islands or peninsular regions of unburned
mixture [21,23,91,95,96] increasing the flame area and the
unburned mixture consumption rate. As such the the in-
fluence of turbulence is reduced to wrinkling the flame
front with the actual burning still governed by the mixture
thermo-physical properties. The essence of the flamelet
regime has been captured by various researchers as below
(Damkohler model [24]), (Clavin and Williams model [24]),
(Klimov model [24]).
St ¼ SL þ Vrms (11)
St ¼ SL þ SLV2rms (12)
St ¼ 3:5S0:3L V0:7
rms (13)
As evident from the above argument, for similar turbu-
lence conditions in the engine cylinder, the burning rate
directly depends on the laminar flame speed. Thus, the
reduction in fast burning duration from C1 to C4 can be
attributed to the increasing H2 fraction and higher peak in-
cylinder temperature (due to increasing peak supported
loads) both of which increase the laminar flame speed. As for
the part load operation, due to increasing levels of mixture
dilutionwith residual gases, the influence ofH2 is significantly
offset leading to near equal combustion duration.
3. Terminal phase: The terminal phase response of the en-
gine, at both part and full load operation is interesting
considering that doubling of mixture H2 fraction (from C1
to C4) also leads to doubling of the combustion duration,
both in absolute degrees and fraction of full cycle terms.
Towards addressing this response, some aspects pertain-
ing to the thermal boundary layers and flame position in
the vicinity of the position of peak pressure are reviewed.
Under typical SI engine like conditions, the boundary layer
thickness is reported to be of the order of about amillimeter in
the immediate vicinity of TDC for typical hydrocarbon fuels
[97]. The boundary layer grows as per the equation (14).
dT ¼ 0:6ðatÞ12Re15 (14)
It is evident from equation (14) that the boundary layer
thickness grows as the square root of thermal diffusivity.
Thus, with increasing H2 fraction, the boundary layer thick-
ness also increases and an increasing portion of mixture is
present in the boundary layer. Considering the fact that
higherH2 fraction also entails enhanced convective losses (as
discussed in Energy flow analysis and addressing the cooling
load section) a greater fraction of mixture runs increasingly
cooler as the mixture H2 fraction increases. On the flame
position in the vicinity of the position of peak pressure,
simultaneous analysis of flame development (photographic)
and in-cylinder pressure evolution suggests that the turbu-
lent flame touches the wall farthest from the spark plug just
after the position of peak pressure [21,91,98] and at this
stage, another 20e25% of the mixture is yet to burn. This is
also evident from simultaneous comparison of Figs. 9 and 10.
The combustion of this 20e25% of the mixture constitutes
the terminal phase. It is evident from the foregone discus-
sion that with increasing mixture H2 content, increasing
fraction of relatively cooler mixture is burned in the terminal
phase of combustion leading to an increase in the corre-
sponding combustion duration. Based on the observations,
the laminar flame propagation retard caused by the
temperature drop is significant enough to overcome the
laminar flame speed increase associatedwith highermixture
H2 fractions (from C1 to C4). This is verified from the
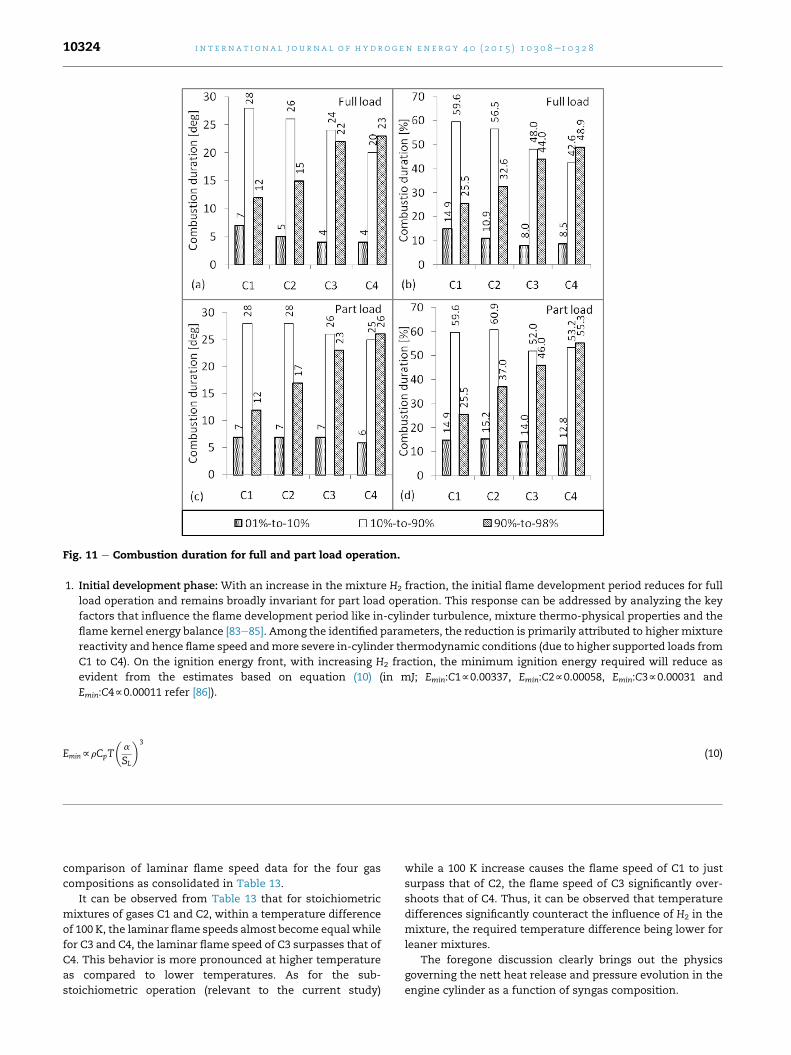
Fig. 11 e Combustion duration for full and part load operation.
1. Initial development phase: With an increase in the mixture H2 fraction, the initial flame development period reduces for full
load operation and remains broadly invariant for part load operation. This response can be addressed by analyzing the key
factors that influence the flame development period like in-cylinder turbulence, mixture thermo-physical properties and the
flame kernel energy balance [83e85]. Among the identified parameters, the reduction is primarily attributed to higher mixture
reactivity and hence flame speed andmore severe in-cylinder thermodynamic conditions (due to higher supported loads from
C1 to C4). On the ignition energy front, with increasing H2 fraction, the minimum ignition energy required will reduce as
evident from the estimates based on equation (10) (in mJ; Emin:C1f0.00337, Emin:C2f0.00058, Emin:C3f0.00031 and
Emin:C4f0.00011 refer [86]).
EminfrCpT
�a
SL
3
(10)
i n t e rn a t i o n a l j o u r n a l o f h y d r o g e n en e r g y 4 0 ( 2 0 1 5 ) 1 0 3 0 8e1 0 3 2 810324
comparison of laminar flame speed data for the four gas
compositions as consolidated in Table 13.
It can be observed from Table 13 that for stoichiometric
mixtures of gases C1 and C2, within a temperature difference
of 100 K, the laminar flame speeds almost become equal while
for C3 and C4, the laminar flame speed of C3 surpasses that of
C4. This behavior is more pronounced at higher temperature
as compared to lower temperatures. As for the sub-
stoichiometric operation (relevant to the current study)
while a 100 K increase causes the flame speed of C1 to just
surpass that of C2, the flame speed of C3 significantly over-
shoots that of C4. Thus, it can be observed that temperature
differences significantly counteract the influence of H2 in the
mixture, the required temperature difference being lower for
leaner mixtures.
The foregone discussion clearly brings out the physics
governing the nett heat release and pressure evolution in the
engine cylinder as a function of syngas composition.

Table 13 e Laminar flame speed variation withtemperature at stoichiometry.
C1 C2 C3 C4 C1 C2 C3 C4
Laminar flame speed (cm/s)
f ¼ 1.00 f ¼ 0.85
400 K 27 52 63 93 23 42 52 75
450 K 37 68 83 120 31 57 68 99
500 K 48 88 106 152 42 73 90 126
550 K 64 113 135 191 56 97 116 162
600 K 83 144 172 236 74 124 149 204
650 K 108 185 215 292 97 159 189 256
700 K 140 230 268 359 127 204 e 319
i n t e r n a t i o n a l j o u r n a l o f h y d r o g e n en e r g y 4 0 ( 2 0 1 5 ) 1 0 3 0 8e1 0 3 2 8 10325
Conclusions
The influence of key thermo-physical properties of H2
containing gaseous mixture on an SI engine is addressed. A
multi-pronged approach involving the analysis of mixture
thermo-physical properties and flame structure based on
established zero and one-dimensional chemical kinetics rou-
tines, thermodynamic engine simulation module and experi-
mental investigations involving in-cylinder data acquisition is
adopted. The results establish an increase in the engine
cooling load with increasing Syngas H2 fraction. The salient
features of the investigation are summarized as below;
1. Preliminary thermodynamic and convective heat transfer
analysis suggests direct influence of adiabatic flame tem-
perature and convective heat transfer on the energy bal-
ance with laminar flame speed and flame quenching
distance having a secondary influence.
2. The presence of H2 in the mixture increases the adiabatic
flame temperature and laminar flame speed attributed to a
significant increase in temperature and radical (especially
H and OH) gradient across the flame due to enhanced re-
action rates.
3. The adiabatic flame temperature for the four syngas com-
positions considered is lower than the corresponding in-
dividual constituent flame temperature (attributed to
diluents like CO2 and N2) and hence cannot be regarded as
causative factors of higher convective heat flux.
4. Reduction of flame thickness and H specie domination
results in lower than unity Lewis number. The two fac-
tors coupled with thermodynamic conditions (especially
pressure) induce turbulence like influence on the flame
propagation speed and potentially alter the engine thermo-
kinematic response.
5. Peak load energy balance suggests an increase in the en-
gine load with H2 fraction. Over the entire range of
composition, the cooling load is about 10 ± 3% higher than
the typical higher hydrocarbon cooling load. While the
higher cooling load is the consolidated influence of (iden-
tified) thermo-physical properties, the specific influence of
thermal conductivity and diffusivity has been quantified
using simulation studies.
6. As a consequence of increasing engine cooling loadwithH2
fraction, the brake thermal efficiency that initially in-
creases with H2 fraction reduces at higher H2 levels.
7. The general notion of post TDC combustion phasing being
largely invariant for MBT operation, as established for
conventional high hydrocarbon fuels, no longer holds for
syngas fueled operation. The MBT operation position of
peak pressure advances towards the TDC as theH2 fraction
in the syngas mixture increases, suggesting potential
alteration of flame speed in the vicinity of TDC. While
beyond the scope of the current investigation, the onset of
flame instability and cellularity is suggested as a strong
factor bringing about such a change.
8. Analysis of the heat release profile indicates a reduction in
flame kernel development and fast burn phase duration
with increase in the mixture H2 fraction while the terminal
phase duration increases.
9. The reduction of combustion duration for the first two
phases of combustion is attributed to (a) reduced ignition
energy requirement and (b) overall improvement in the
mixture reactivity. The increase in the terminal phase of
combustion is attributed to enhanced cooling (due to
higher thermal conductivity/diffusivity) of the un-burned
mixture, mostly in the boundary layer. The cooling effect
is significant enough to overcome the flame propagation
increase due to higher H2 fraction.
r e f e r e n c e s
[1] White CM, Steeper RR, Lutz AE. The hydrogen-fueled internalcombustion engine: a technical review. Int J HydrogenEnergy 2006;31(10):1292e305.
[2] Verhelst Sebastian, Wallner Thomas. Hydrogen-fueledinternal combustion engines. Prog Energy Combust Sci2009;35(6):490e527.
[3] Karim Ghazi A. Hydrogen as a spark ignition engine fuel. Int JHydrogen Energy 2003;28(5):569e77.
[4] Hari Ganesh R, Subramanian V, Balasubramanian V,Mallikarjuna JM, Ramesh A, Sharma RP. Hydrogen fueledspark ignition engine with electronically controlled manifoldinjection: an experimental study. Renew Energy2008;33(6):1324e33.
[5] Lee SJ, Yi HS, Kim ES. Combustion characteristics of intakeport injection type hydrogen fueled engine. Int J HydrogenEnergy 1995;20(4):317e22.
[6] Liu Xing hua, Liu Fu shui, Zhou Lei, Sun Bai gang,Schock Harold J. Backfire prediction in a manifold injectionhydrogen internal combustion engine. Int J Hydrogen Energy2008;33(14):3847e55.
[7] Das LM. Hydrogen engine: research and development (r andd) programmes in Indian Institute of Technology (IIT), Delhi.Int J Hydrogen Energy 2002;27(9):953e65.
[8] Heffel James W. {NOx} emission and performance data for ahydrogen fueled internal combustion engine at 1500 rpmusing exhaust gas recirculation. Int J Hydrogen Energy2003;28(8):901e8.
[9] Ma Fanhua, Wang Yu, Liu Haiquan, Li Yong, Wang Junjun,Zhao Shuli. Experimental study on thermal efficiency andemission characteristics of a lean burn hydrogen enrichednatural gas engine. Int J Hydrogen Energy2007;32(18):5067e75.
[10] Allenby S, Chang WC, Megaritis A, Wyszy�nski ML. Hydrogenenrichment: a way to maintain combustion stability in anatural gas fuelled engine with exhaust gas recirculation, the

i n t e rn a t i o n a l j o u r n a l o f h y d r o g e n en e r g y 4 0 ( 2 0 1 5 ) 1 0 3 0 8e1 0 3 2 810326
potential of fuel reforming. Proc Inst Mech Eng Part D JAutomob Eng 2001;215(3):405e18.
[11] Ma Fanhua, Wang Yu. Study on the extension of leanoperation limit through hydrogen enrichment in a naturalgas spark-ignition engine. Int J Hydrogen Energy2008;33(4):1416e24.
[12] Papagiannakis RG, Rakopoulos CD, Hountalas DT,Giakoumis EG. Study of the performance and exhaustemissions of a spark-ignited engine operating on syngas fuel.Int J Altern Propuls 2007;1(2):190e215.
[13] Boehman Andr�e L, Corre Olivier Le. Combustion of syngas ininternal combustion engines. Combust Sci Technol2008;180(6):1193e206.
[14] Baratieri M, Baggio P, Bosio B, Grigiante M, Longo GA. The useof biomass syngas in IC engines and CCGT plants: acomparative analysis. Appl Therm Eng 2009;29(16):3309e18.
[15] Martınez Juan Daniel, Mahkamov Khamid,Andrade Rubenildo V, Silva Lora Electo E. Syngas productionin downdraft biomass gasifiers and its application usinginternal combustion engines. Renew Energy 2012;38(1):1e9.
[16] Karim GA, Wierzba I, Al-Alousi Y. Methaneehydrogenmixtures as fuels. Int J Hydrogen Energy 1996;21(7):625e31.
[17] Schefer RW. Hydrogen enrichment for improved lean flamestability. Int J Hydrogen Energy 2003;28(10):1131e41.
[18] Munshi SR, Nedelcu Costi, Harris Jonathan, Edwards Tommy,Williams J, Lynch Franklin, et al. Hydrogen blended naturalgas operation of a heavy duty turbocharged lean burn sparkignition engine. Technical report, SAE Technical Paper. 2004.
[19] Bauer CG, Forest TW. Effect of hydrogen addition on theperformance of methane-fueled vehicles. Part I: effect on SIengine performance. Int J Hydrogen Energy 2001;26(1):55e70.
[20] D'Andrea T, Henshaw PF, Ting DS-K. The addition ofhydrogen to a gasoline-fuelled SI engine. Int J HydrogenEnergy 2004;29(14):1541e52.
[21] Heywood John B. Fundamentals of internal combustionengines. NY: McGraw Hill; 1988. p. 619.
[22] Nabi Md Nurun. Theoretical investigation of engine thermalefficiency, adiabatic flame temperature, NOx emission andcombustion-related parameters for different oxygenatedfuels. Appl Therm Eng 2010;30(8):839e44.
[23] Peters Norbert. Turbulent combustion. Cambridge UniversityPress; 2000.
[24] Turns Stephen R. An introduction to combustion: conceptsand applications. McGrw-Hill Companies, Inc; 2000.
[25] Dasappa S, Paul PJ, Mukunda HS, Rajan NKS, Sridhar G,Sridhar HV. Biomass gasification technology e a route tomeet energy needs. Curr Sci 2004;87(7):908e16.
[26] Shivapuji Anand M, Dasappa S. Experiments and zero Dmodeling studies using specific Wiebe coefficients forproducer gas as fuel in spark-ignited engines. Proc Inst MechEng Part C J Mech Eng Sci 2013;227(3):504e19.
[27] Shivapuji Anand M, Dasappa S. Selection andthermodynamic analysis of a turbocharger for a producergas-fuelled multi-cylinder engine. Proc Inst Mech Eng Part A JPower Energy 2014;228(3):340e56.
[28] Shivapuji Anand M, Dasappa S. In-cylinder investigationsand analysis of a SI gas engine fuelled with H2 and CO richsyngas fuel: sensitivity analysis of combustion descriptorsfor engine diagnostics and control. Int J Hydrogen Energy2014;39(28):15786e802.
[29] Sridhar G, Paul PJ, Mukunda HS. Biomass derived producergas as a reciprocating engine fuel e an experimentalanalysis. Biomass Bioenergy 2001;21(1):61e72.
[30] Shivapuji AM, Dasappa S. Experimental studies on multi-cylinder natural gas engine fueled with producer gas. In:Proceedings of 19th European biomass conference andexhibition from research to industry and markets; 2011.p. 974e80.
[31] Shudo Toshio, Nakajima Yasuo, Futakuchi Takayuki.Thermal efficiency analysis in a hydrogen premixedcombustion engine. JSAE Rev 2000;21(2):177e82.
[32] Shudo T, Nabetani S, Nakajima Y. Analysis of the degree ofconstant volume and cooling loss in a spark ignition enginefuelled with hydrogen. Int J Eng Res 2001;2(1):81e92.
[33] Shudo Toshio. Improving thermal efficiency by reducingcooling losses in hydrogen combustion engines. Int JHydrogen Energy 2007;32(17):4285e93.
[34] Shudo Toshio, Suzuki Hiroyuki. Applicability of heat transferequations to hydrogen combustion. JSAE Rev2002;23(3):303e8.
[35] Demuynck Joachim, De Paepe Michel, Huisseune Henk,Sierens Roger, Vancoillie Jeroen, Verhelst Sebastian. On theapplicability of empirical heat transfer models for hydrogencombustion engines. Int J Hydrogen Energy2011;36(1):975e84.
[36] Knop Vincent, Benkenida Adl�ene, Jay St�ephane, Colin Olivier.Modelling of combustion and nitrogen oxide formation inhydrogen-fuelled internal combustion engines within a 3DCFD code. Int J Hydrogen Energy 2008;33(19):5083e97.
[37] Kee Robert J, Rupley Fran M, Miller James A. The chemkinthermodynamic data base, vol. 1; 1990.
[38] Dasappa S, Sridhar HV, Sridhar G, Paul PJ, Mukunda HS.Biomass gasification e a substitute to fossil fuel for heatapplication. Biomass Bioenergy 2003;25(6):637e49.
[39] Sandeep K, Dasappa S. Oxy-steam gasification of biomass forhydrogen rich syngas production using downdraft reactorconfiguration. Int J Energy Res 2014;38(2):174e88.
[40] Sandeep K, Dasappa S. First and second law thermodynamicanalysis of air and oxy-steam biomass gasification. Int JHydrogen Energy 2014;39(34):19474e84.
[41] Orhan Akansu S, Dulger Zafer, Kahraman Nafiz, NejatVeziroglu T. Internal combustion engines fueled by naturalgasehydrogen mixtures. Int J Hydrogen Energy2004;29(14):1527e39.
[42] Orhan Akansu S, Kahraman Nafiz, Ceper Bilge. Experimentalstudy on a spark ignition engine fuelled bymethaneehydrogen mixtures. Int J Hydrogen Energy2007;32(17):4279e84.
[43] Dasappa S. On the estimation of power from a diesel engineconverted for gas operationea simple analysis. Power2005;1:2.
[44] Wilke CR. A viscosity equation for gas mixtures. J Chem Phys2004;18(4):517e9.
[45] Mathur S, Tondon PK, Saxena SC. Thermal conductivity ofbinary, ternary and quaternary mixtures of rare gases. MolPhys 1967;12(6):569e79.
[46] Abraham John, Williams Forman A, Bracco Frediano V. Adiscussion of turbulent flame structure in premixed charges.Technical report, SAE Technical Paper. 1985.
[47] Kee Robert J, Rupley Fran M, Meeks Ellen, Miller James A,Chemkin III A. A fortran chemical kinetics package for theanalysis of gas phase chemical and plasma kinetics. SandiaNational Laboratories; 1996.
[48] Smith Gregory P, Golden David M, Frenklach Michael,Moriarty Nigel W, Eiteneer Boris, Goldenberg Mikhail, et al.Gri-mech 3.0. 1999.
[49] Law CK, Sung CJ. Structure, aerodynamics, and geometry ofpremixed flamelets. Prog Energy Combust Sci2000;26(4):459e505.
[50] Lieuwen Tim, Yang Vigor, Yetter Richard. Synthesis gascombustion: fundamentals and applications. CRC Press;2009.
[51] Glassman Irvin. Combustion. Academic Press; 1997.[52] Im Hong G, Chen Jacqueline H. Preferential diffusion effects
on the burning rate of interacting turbulent premixedhydrogeneair flames. Combust Flame 2002;131(3):246e58.
i n t e r n a t i o n a l j o u r n a l o f h y d r o g e n en e r g y 4 0 ( 2 0 1 5 ) 1 0 3 0 8e1 0 3 2 8 10327
[53] Dinkelacker F, Manickam B, Muppala SPR. Modelling andsimulation of lean premixed turbulent methane/hydrogen/air flames with an effective Lewis number approach.Combust Flame 2011;158(9):1742e9.
[54] Gelfand Boris E, Silnikov Mikhail V, Medvedev Sergey P,Khomik Sergey V. Thermo-Gas dynamics of hydrogencombustion and explosion. Springer; 2012.
[55] Liu Fengshan, Gulder €Omer L. Effects of H2 and H preferentialdiffusion and unity Lewis number on superadiabatic flametemperatures in rich premixed methane flames. CombustFlame 2005;143(3):264e81.
[56] Kwon OC, Rozenchan G, Law CK. Cellular instabilities andself-acceleration of outwardly propagating spherical flames.Proceed Combust Inst 2002;29(2):1775e83.
[57] Li Hong-Meng, Li Guo-Xiu, Sun Zuo-Yu, Zhai Yue, Zhou Zi-Hang. Research on cellular instabilities of lean premixedsyngas flames under various hydrogen fractions using aconstant volume vessel. Energies 2014;7(7):4710e26.
[58] Moccia Vincenzo, D'Alessio Jacopo. Burning behaviour ofhigh-pressure CH4eH2eair mixtures. Energies2013;6(1):97e116.
[59] Bradley Derek, Sheppart CGW, Woolley R, Greenhalgh DA,Lockett RD. The development and structure of flameinstabilities and cellularity at low Markstein numbers inexplosions. Combust Flame 2000;122(1):195e209.
[60] Kitagawa Toshiaki, Nakahara Takashi, Maruyama Kosuke,Kado Kunihiro, Hayakawa Akihiro, Kobayashi Shoichi.Turbulent burning velocity of hydrogeneair premixedpropagating flames at elevated pressures. Int J HydrogenEnergy 2008;33(20):5842e9.
[61] Jomaas Grunde, Law CK, Bechtold JK. On transition tocellularity in expanding spherical flames. J Fluid Mech2007;583:1e26.
[62] Frassoldati A, Faravelli T, Ranzi E. The ignition, combustionand flame structure of carbon monoxide/hydrogen mixtures.Note 1: detailed kinetic modeling of syngas combustion alsoin presence of nitrogen compounds. Int J Hydrogen Energy2007;32(15):3471e85.
[63] Cuoci A, Frassoldati A, Buzzi Ferraris G, Faravelli T, Ranzi E.The ignition, combustion and flame structure of carbonmonoxide/hydrogen mixtures. note 2: fluid dynamics andkinetic aspects of syngas combustion. Int J Hydrogen Energy2007;32(15):3486e500.
[64] Burbano Hugo J, Pareja Jhon, Amell Andr�es A. Laminarburning velocities and flame stability analysis of H2/CO/airmixtures with dilution of N2 and CO2. Int J Hydrogen Energy2011;36(4):3232e42.
[65] Pipitone Emiliano. A comparison between combustion phaseindicators for optimal spark timing. J Eng Gas Turb Power2008;130(5):052808.
[66] Dasappa S, Sridhar G, Paul PJ. Adaptation of small capacitynatural gas engine for producer gas operation. Proceed InstMech Eng Part C J Mech Eng Sci 2011. http://dx.doi.org/10.1177/0954406211424678.
[67] Kutlar Osman Akin, Arslan Hikmet, Calik Alper Tolga.Methods to improve efficiency of four stroke, spark ignitionengines at part load. Energy Convers Manag2005;46(20):3202e20.
[68] Sch€afer Fred, Van Basshuysen Richard. Reduced emissionsand fuel consumption in automobile engines. Springer; 1995.
[69] Yuksel F, Ceviz MA. Thermal balance of a four stroke SIengine operating on hydrogen as a supplementary fuel.Energy 2003;28(11):1069e80.
[70] Wallace Scott J, Kremer Gregory G. Diesel engine energybalance study operating on diesel and biodiesel fuels. In:ASME 2008 International mechanical engineering congressand exposition. American Society of Mechanical Engineers;2008. p. 337e43.
[71] Annand WJD. Heat transfer in the cylinders of reciprocatinginternal combustion engines. Proceed Inst Mech Eng1963;177(1):973e96.
[72] Borman Gary, Nishiwaki Kazuie. Internal-combustionengine heat transfer. Prog Energy Combust Sci1987;13(1):1e46.
[73] Incropera Frank P. Introduction to heat transfer. John Wiley& Sons; 2011.
[74] Ismail Saleel, Mehta Pramod S. Second law analysis ofhydrogeneair combustion in a spark ignition engine. Int JHydrogen Energy 2011;36(1):931e46.
[75] Kouremenos DA, Rakopoulos CD, Hountalas DT,Zannis TK. Development of a detailed friction model topredict mechanical losses at elevated maximumcombustion pressures. Technical report, SAE TechnicalPaper. 2001.
[76] Sandoval Daniel, Heywood John B. An improved frictionmodel for spark-ignition engines. Technical report, SAETechnical paper. 2003.
[77] Hubbard M, Dobson PD, Powell JD. Closed loop control ofspark advance using a cylinder pressure sensor. J Dyn SystMeas Control 1976;98:414.
[78] Beccari A, Pipitone E. Proportional integral spark timingcontrol by means of in-cylinder pressure analysis. In: FISITA2004 World Automotive Congress; 2004.
[79] Shayler PJ, Wiseman MW, Ma T. Improving thedetermination of mass fraction burnt. 1990. Technical report,SAE Technical Paper.
[80] Brunt Michael FJ, Emtage Andrew L. Evaluation of burn rateroutines and analysis errors. Technical report, SAE TechnicalPaper. 1997.
[81] Brunt Michael FJ, Rai Harjit, Emtage Andrew L. Thecalculation of heat release energy from engine cylinderpressure data. Technical report, SAE Technical Paper. 1998.
[82] Baratta Mirko, d'Ambrosio Stefano, Spessa Ezio,Vassallo Alberto. Cycle-resolved detection of combustionstart in SI engines by means of different in-cylinder pressuredata reduction techniques. In: ASME 2006 internalcombustion engine division spring technical conference.American Society of Mechanical Engineers; 2006. p. 303e16.
[83] Pischinger Stefan, Heywood John B. A model for flame kerneldevelopment in a spark-ignition engine. In: Symposium(International) on Combustion, vol. 23. Elsevier; 1991.p. 1033e40.
[84] Shen Huixian, Hinze Peter C, Heywood John B. A model forflame initiation and early development in SI engine and itsapplication to cycle-to-cycle variations. Technical report,SAE Technical Paper. 1994.
[85] Eisazadeh-Far Kian, Parsinejad Farzan,Metghalchi Hameed, Keck James C. On flame kernelformation and propagation in premixed gases. CombustFlame 2010;157(12):2211e21.
[86] Kurdyumov V, Blasco J, S�anchez AL, Linan A. On thecalculation of the minimum ignition energy. Combust Flame2004;136(3):394e7.
[87] Maly Rudolf. Spark ignition: its physics and effect on theinternal combustion engine. In: Fuel economy. Springer;1984. p. 91e148.
[88] Cho Hanseong, Lee Kwiyoung, Lee Jonghwa, Yoo Jaisuk,Min Kyoungdoug. Measurements and modeling of residualgas fraction in SI engines. Technical report, SAE TechnicalPaper. 2001.
[89] Giansetti Pascal, Colin Guillaume, Higelin Pascal,Chamaillard Yann. Residual gas fraction measurement andcomputation. Int J Eng Res 2007;8(4):347e64.
[90] Gatowski Jan A, Heywood John B, Deleplace Christian. Flamephotographs in a spark-ignition engine. Combust Flame1984;56(1):71e81.

i n t e rn a t i o n a l j o u r n a l o f h y d r o g e n en e r g y 4 0 ( 2 0 1 5 ) 1 0 3 0 8e1 0 3 2 810328
[91] Keck James C. Turbulent flame structure and speed in spark-ignition engines. In: Symposium (International) onCombustion, vol. 19. Elsevier; 1982. p. 1451e66.
[92] Mounaım-Rousselle Christine, Landry Ludovic,Halter Fabien, Foucher Fabrice. Experimental characteristicsof turbulent premixed flame in a boosted spark-ignitionengine. Proceed Combust Inst 2013;34(2):2941e9.
[93] Peters N. Length and time scales in turbulent combustion. In:Turbulent reactive flows. Springer; 1989. p. 242e56.
[94] Peters N. The turbulent burning velocity for large-scale andsmall-scale turbulence. J Fluid Mech 1999;384:107e32.
[95] Borghi R. On the structure and morphology of turbulentpremixed flames. In: Recent advances in the aerospacesciences. Springer; 1985. p. 117e38.
[96] Pope SB. Turbulent premixed flames. Ann Rev Fluid Mech1987;19(1):237e70.
[97] Lyford-Pike Edward J, Heywood John B. Thermal boundarylayer thickness in the cylinder of a spark-ignition engine. IntJ Heat Mass Transfer 1984;27(10):1873e8.
[98] Beretta GP, Rashidi M, Keck JC. Turbulent flame propagationand combustion in spark ignition engines. Combust Flame1983;52:217e45.