influence of crosslinking on the mechanical properties of high tg
TRANSCRIPT

AFM L-TR-76-124
A D3 3o,7 OFFICIAL FILE CO•t
INFLUENCE OF CROSSLINKING ON THE MECHANICALPROPERTIES OF HIGH TG POLYMERS
MATERIALS RESEARCH CENTERLEHIGH UNIVERSITYBETHLEHEM, PENNSYLVANIA 18015
JULY 1976
TECHNICAL REPORT AFML-TR-76-124FINAL REPORT FOR PERIOD MAY 1975 - APRIL 1976
Approved for public release; distribution unlimited
AIR FORCE MATERIALS LABORATORYAIR FORCE WRIGHT AERONAUTICAL LABORATORIESAIR FORCE SYSTEMS COMMANDWRIGHT-PATTERSON AIR FORCE BASE, OHIO 45433 Best Available Copy

NOTICE
When Government drawings, specifications, or other data are usedfor any purpose other than in connection with a definitely relatedGovernment procurement operation, the United States Government therebyincurs no responsibility nor any obligation whatsoever; and the factthat the Government may have formulated, furnished, or in any waysupplied the said drawings, specifications, or other data, is not to beregarded by implication or otherwise as in any manner licensing theholder or any other person or corporation, or conveying any rights orpermission to manufacture, use, or sell any patented invention that mayin any way be related hereto.
Copies of this report should not be returned to the Air ForceMaterials Laboratory unless return is required by security considerations,contractual obligations, or notice on a specific document.
CAPT. .ANTtO ,WERETA, JR.Project Scientist
FOR THE COMMANDER
Chief, Polymer BranchNonmetallic Materials Division
AIP rs`OK - 22 NOVE11BEP 76 - 100
': ¶ft

I INCI ASSIFIF F.SECURITY CLASSIFICATION OF THIS PAGE (When Data Entered) _
REPORT DOCUMENTATION PAGE READ INSTRUCTIONSBEFORE COMPLETING FORM1. REPORT NUMBER 2. GOVT ACCESSION NO. 3. RECIPIENT'S CATALOG NUMBER
AFIML-TR-76-124
4. TITLE (and Subtitle) S. TYPE OF REPORT & PERIOD COVERED
INFLUENCE OF CROSSLINKING ON THE MECHANICAL Final Report for PeriodPROPERTIES OF HIGH T POLYMERS May 1975 - April 1976
G 6. PERFORMING ORG. REPORT NUMBER
7. AUTHOR(a) S. CONTRACT OR GRANT NUMBER(s)
John A. Manson Soojaa L. Kim F33615-75-C-5167Leslie H. Sperling
9. PERFORMING ORGANIZATION NAME AND ADDRESS 10. PROGRAM ELEMENT. PROJECT, TASKAREA ~~ •OKUIT NUMBFR '.Materials Research Center AREA& WORK N RS
Lehigh University 73420307Bethlehem, Pa. 18015
I,. CONTROLLING OFFICE NAME AND ADDRESS 12. REPORT DATE
Air Force Materials Laboratory July 1976
Wright-Patterson AFB, Ohio 45433 13. NUMBEROF PAGES102
14. MONITORING AGENCY NAME & ADDRESS(if different from Controlling Office) 15. SECURITY CLASS. (of this report)
Unclassified
15o. DECLASSIFICATION/DOWNGRADINGSCHEDULE
16. DISTRIBUTION STATEMENT (of this Report)
Approved for Public Release; Distribution Unlimited
"7. DISTRIBUTION STATEMENT (of the abstract entered in Block 20, it different from Report)
IS. SUPPLEMENTARY NOTES
19. KEY WORDS (Continue on rtevere side if necessary and identify by block number)
Bamford networks, Crosslinked networks, Decrosslinking, Density and Distributionof crosslinks, Epoxy resins, Fatigue, Fracture mechanics, Glass transitiontemperature, High Tg resins, Labile crosslinks, Mechanical properties, Modelnetworks, Swelling behavior, Viscoelastic behavior.
20. ABSTRACT (Continue on reverse aide if nece ry and identify by block number)
Research was begun on the effects of crosslinking on the mechanicalproperties of high-Tg9 polymers, with particular emphasis on the role of cross-link density, yariations in the distribution of crosslink segment lengths, andthe role of network imperfections. Two systems were selected: one based on theuse of the Bamford synthesis to provide model, well defined networks, and theother based on the use of bisphenol-A-type epoxy/methylene dianiline resinssynthesized to provide control led variations in network properties.
RjAN73 1473 EDITION OFI NOV 6S IS OBSOLETE SECURI3UNCLASSI IF I EDSECURITY CLASSIFICATION OF THIS PAGE (When Data -Entered)

UNCLASSIFIEDSECURITY CLASSIFICATION OF THIS PAGE(t'en Data Entered)
20. ABSTRACT - cont'd
To date, the feasibility of varying network characteristics in a modelsystem by introducing hydrolyzable or permanent crosslinks has been demons-trated using copolymers of styrene or ethyl acrylate with acrylic acidanhydride. The creep-and stress relaxation behavior was found to r-flectthe characteristics of the networks.
SSeveral series of fully cured epoxy resins were prepared having (1)varying values of I~c, (2) varying distributions of crosslink chain lengthsat constant Mc, and (3) varying stoichiometries at constant Mc. Characteri-zation of swelling, dynamic mechanical behavior, fracture toughness, andfatigue crack growth was performed. It was shown that the viscoelasticbehavior was determined by Mc, regardless of how the given value of Mc wasattained. Fracture toughness and fatigue crack growth rates both variedwith the amine/epoxy ratio. Effects of the distribution at crosslinklengths on viscoelastic behavior were negligible, but broad distributionscaused modest increases in the swell ratio and possibly in fracturetoughness.
UNCLASSIFIEDSECURITY CLASSIFICATION OF THIS PAGE(W1hen Data Entered)

FOREWORD
The Lehigh Project Co-Directors were Dr. John A. Manson, Professorof Chemistry and Director of the Polymer Laboratory, Materials ResearchCenter, and Dr. Leslie H. Sperling, Associate Professor of ChemicalEngineering, and Senior Staff member, the Polymer Laboratory. TheFaculty Associates were: Dr. Richard W. Hertzberg, Professor ofMetallurgy and Materials Science and Director of the Mechanical BehaviorLaboratory, and Dr. John W. Vanderhoff, Professor of Chemistry andAssociate Director - Coatings, Center for Surface and Coatings Research.Special advice on synthesis was provided by Professor N. D. Heindel,Professor of Chemistry. Also contributing to the project were ResearchAssociate Dr. S. L. Kim, Visiting Scientist S. Yamoda, and GraduateStudents Subodh C. Misra, Michael Skibo, Carol M. Vasold, and DaveSiegfried.
iii

TABLE OF CONTENTS
Page
SECTION
I SUMMARY 1
A. General 1B. Model Networks 1C. Epoxy Networks 2
II INTRODUCTION 4
A. Statement of the Problem 4B. Objective and Scope of the Program 4C. General Discussion 5
III TECHNICAL APPROACH 10
IV SYNTHESIS OF MODEL NETWORKS 12
A. Introduction 12B. Experimental Details, Results, and Discussion 15
V PROPERTIES OF MODEL SYSTEMS 20
A. Introduction 20B. Experimental Details, Results, and Discussion 20
VI SYNTHESIS OF EPOXY NETWORKS 35
A. Structure and Stoichiometry 36B. Experimental Details, Results, and Discussion 39
VII CHARACTERIZATION OF EPOXY NETWORKS 45
A. Introduction 45B. Experimental Details, Results, and Discussion 48
VIII FRACTURE TOUGHNESS, STRENGTH, AND FATIGUE 67CRACK PROPAGATION (FCP) OF EPOXY NETWORKS
A. Introduction 67B. Experimental Data, Results, and Discussion 71
IX CONCLUSIONS AND RECOMMENDATIONS 82
A. Model Networks 82B. Epoxy Networks 83Best Available Copy

Page
APPENDIX 87
LIST OF SPECIAL CHEMICAL STRUCTURES 87
REFERENCES 88
vi

LIST OF TABLES
Table Page
I M for PS-AAA Crosslinked Networks. 21c
2 Characterization of Crosslinked PEA Networks. 22
3 Characterization of PEA Networks with 0.68% 1- 23Dodecanethiol.
4 Characterization of PEA Networks Capable of Complete 23Hydrolysis.
5 Characteristics of Epoxy Prepolymers. 37
6 Compositions of Series A Epoxy Resins. 41
7 Compositions of Series B (Blends) Epoxy Resins. 42
8 Compositions of Series C Resins. 43
9 Compositions of Series D (Versamid-cured) Epoxy Resins. 43
10 Swelling Behavior of Series B Epoxy Resins. 52
11 Dynamic Mechanical Data for Series A Epoxy Resins 56(Variable Stoichiometry).
12 0 Transition of Series A Epoxy Resins (Variable 56Stoichiometry).
13 Molecular Weight Between Crosslinks, Mc, for Series A 60Epoxy Resins.
14 Dynamic Mechanical Data of Series B. 61
15 Viscoelastic Parameters for Series E Epoxy Resins 62(Homopolymers).
16 Stress Relaxation of Series A Epoxy Resins at 150 0C. 64
17 Fracture Toughness and Fatigue Characteristics of Epoxy 73Resins.
vii

LIST OF ILLUSTRATIONS
Figure Page
1 Schema showing typical variations in nature and composition 7of cross-linked polymer networks (after reference 2).
2 Values of Mc(E) as a function of AAA and 1-Doth levels, 25before and after hydrolysis.
-a-0.68% 1-Doth before hydrolysis-o-0.68% 1-Doth after hydrolysis-.- 1.3% 1-Doth before hydrolysis-e-1.3% 1-Doth after hydrolysis.
3 Values of log 3G vs. time in the glass transition tempera- 26ture range of PEA.
4 Values of log 3G vs. time for a series of temperatures for 27a material containing 0.68% 1-Doth.
5 Log 3G vs temperature for PEA, after hydrolysis, for a 28PEA containing 1.2 ml of AAA and 0.68% 1-Doth.
6 Stress relaxation of PEA networks before and after 29hydrolysis.
7 Stress relaxation of PEA networks containing both 30permanent and temporary crosslink sites.
8 Stress relaxation of PEA networks as a function of 32hydrolysis time.
9 Tensile creep modulus of several PEA samples, after 33hydrolysis for 24 hours at 250 C.
10 Creep modulus of samples having little or no network 34properties after hydrolysis for 24 hours at 250C in 28%NH 4OH.
11 Schemata showing (a) effects of crosslinking stoichiometry 47on molecular structure, and (b) effects of crosslinking onmodulus-temperature behavior.
12 Comparison of Mc data from swelling tests: Series B (point 50includes all specimens).
13 Solvent-induced cracking during swelling of a Series A 51epoxy resin (A-16), as observed by optical microscopy(66.5X).
viii

Figure Page
14 Dynamic mechanical data for A-20 epoxy resin, f 110 Hz. 54
15 Dynamic mechanical properties of Series A epoxy resins as 57functions of Mc: o, amine in excess; e, epoxy in excess;ai, specimen A-1OA.
16 Dynamic mechanical properties of Series A epoxy resins as 58
functions of stoichiometry: 0, A-1IA; 0, Series B.
17 0 transition of Series A epoxy resin: AA-10A. 59
18 Electron micrograph of polyamide-cured epoxy resin, sample 64D-2, etched in acetone 7 days, 130,OOOX (1000 A 0.77 cm).
19 Fracture toughness, Kc, and FCP parameters AK4 (AK at 3x10- 4 74mm/cyc), and slope of the da/dN curve as a function of thestress intensity factor range, AK, as function of stoichiome-try: Circles and triangles for Series A, open correspondingto A-1OA; shaded area for Series B.
20 Fracture toughness, K , and FCP parameters AK4 (AK at 3x10⁻⁴mm/cycl), and slope of the da/dN curve as a function ofthe stress intensity factor range, AK, as function of Pr:open circle amine excess in Series A, closed circle epoxyexcess, shaded area for Series B.
21 Typical FCP behavior as a function of AK,Specimen, A-18; 76f=10 Hz.
22 FCP behavior of Series A epoxy resins; f 10 Hz. 77
23 Fracture toughness and impact strength (in arbitrary units) 78of Epon 828/MDA epoxy resins as a function of amine/epoxyratio: o, data of Selby and Miller (17) from 3 differentmeasurements of toughness; A, data of Bell (36) for impactstrength.
24 FCP behavior of Series B (broad distribution) epoxy resins: 79rate of crack growth per cycle as a function of AK; f10 Hz.
25 FCP behavior of Series D (polyamide-cured) epoxy resins: 80Only the first and last points shown; f 10 Hz.
ix

SECTION I
SUMMARY
A. General
In order to gain more understanding of the effects of crosslinkingon the mechanical properties of high T polymers a fundamental study ofthe role of crosslink density, distribution of segment lengths betweencrosslinks, and network imperfections was begun. A dual approach wasselected: the preparation and study of novel networks based on the useof syntheses developed by Bamford et al. (initiation of polymeriza-tion at chlorine containing comonomer sites, using a molybdenum carbonylinitiator), and the preparation and study of epoxy/diamine networks.The former was selected because the system, while not of inherent in-terest as a material, offers the possibility of preparing well definednovel networks. The latter was selected because resins of this type areof practical interest, though the networks are susceptible to somewhatless control than in the former case.
B. Model Networks
To test the feasibility of cleaving crosslinks based on anhydridegroups, crosslinked networks were synthesized by the copolymerizationof styrene and acrylic acid anhydride. Techniques were developed forcleavage of the anhydride linkages using ethylene diamine. It wasshown that complete hydrolysis could be effected; on hydrolysis themolecular behavior reverted to a value characteristic of uncrosslinkedpolymer. Thus, when the Bamford networks are synthesized using themixed anhydride of acrylic acid and trichloroacetic acid, it will bepossible to selectively cleave some of the crosslinks and examine theeffects of the imperfect networks thus created.
In another variation, crosslinked networks were synthesized byfirst copolymerizing ethyl acrylate with tetraethylene glycol dimethacry-late and acrylic acid anhydride in various proportions. It was foundthat addition of a mercaptan made it possible to avoid parasitic cross-linking. Since these networks contain both stable and hydrolyzablecrosslinks, the possibility of constructing and modifying networks inadditional ways was established. Measurements of creep and stressrelaxation as a function of the degree of hydrolysis reflected thestate of the network (uncleaved, partially cleaved, or wholly cleaved).
While optimum conditions for the Bamford synthesis have not yetbeen worked out with a chlorine-containing comonomer, polymerization ofstyrene was demonstrated using carbon tetrachloride as co-initiator withmolybdenum carbonyl.

The principal difficulty has been to obtain a comonomer containingchlorine (to serve as an initiating site) a vinyl group, and an anhydridegroup (to permit easy cleavage) to obtain a variety of network structures.Since suitable monomers containing all three reactive sites had neverbeen synthesized, it was decided to attempt the synthesis of the mixedanhydride of trichloroacetic acid and acrylic acid in the laboratory.While what is believed to be a crude product has been obtained by thereaction of acryloyl chloride with trichloroacetic acid in pyridine(other approaches having been unsuccessful), optimum conditions need tobe determined. The reaction liberates hydrochloric acid, and removalof all of the pyridine hydrochloride byproduct is difficult.
Work is continuing with the synthesis of the mixed anhydride,and, pending resolution of the synthetic problems, the preparation ofnetworks using other methods such as those mentioned above, as wellas methods not involving hydrolyzable linkages, are planned.
C. Epoxy Networks
Several series of bisphenol-A-based epoxy resins were preparedusing methylene dianiline as curing agent. Essentially complete curingwas attained, as shown by measurements of dynamic mechanical response.In series A, the average molecular weight between crosslinks, Mc , wasvaried by altering the stoichiometry, with amine excess varying from -30percent to +100 percent. In series B, M was held constant, while thedistribution of M was varied by blending epoxy prepolymers havingdifferent molecular weights. In series C, M was again held constant,but the amine content was varied. In seriesCD, several resins were pre-pared using polyamide curing agents. In series E, M was varied at1:1 stoichiometry by use of epoxy prepolymers having different molecularweights.
Characterization of the following properties was begun: Mc, byswelling and measurements of rubbery modulus; the state of cure, bydifferential scanning calorimetry (DSC) and dynamic mechanical spectro-scopy (DMS); viscoelastic response per se by DMS; stress-strainresponse; stress-relaxation; fracture toughness and fatigue crack propa-gation (FCP) behavior; and morphology, by electron microscopy.
The following characterizations were completed: preliminarystudy of M by swelling and DMS for series A; M by swelling and DMSfor series B; the state of cure by DMS for seriss A; the viscoelasticresponse for series A, B, and E; preliminary study of stress relaxationfor series A; fracture toughness and FCP behavior for series A, B, and D;and preliminary study of morphology for series A and D.
So far, a rather precise baseline of viscoelastic behavior,fracture toughness, and FCP response has been established for series A(varying stoichiometry) and a similar baseline of viscoelastic behavior
2

for series E (varying molecular weight of the epoxy). This baseline nowserves as a standard against which the effects of other network varia-tions may be compared with confidence.
As expected, an increase in the degree of crosslinking (or adecrease in M c) causes an increase in T (Ta), Tý (the temperatureof a lower-lying transition),the breadt of the transitions, the rubberymodulus, and the swelling ratio. However, absolute values of T werehigher than expected based on the experiences of others with th@ samesystem. Increased crosslinking also caused a decreast in the magnitude oftan Smax near the T , the extent of stress relaxation, and the slopeof the modulus-tempgrature curve at Tg. In most cases, the dependenceof viscoelastic parameters on M was similar for specimens having anexcess or deficit of amine; the one exception was the transition slope,which varied differently depending on whether amine or epoxy was inexcess.
One apparently new quantitative observation was made: that thedependence of a given viscoelastic parameter on M is essentially thesame whether a given value of M9 was attained by varying the stoichiometry
cor by varying the molecular weight of the prepolymer. This fact shouldfacilitate the comparison of effects of other network variations.
In contrast to results reported by others, the fracture toughness,Kc, was found to depend in an almost linear fashion on the amine/epoxyratio. In comparison with even brittle linear polymers, all resins arequite brittle. FCP response was also studied using a special notchingtechnique, which permits e amination of brittle specimens. The stressintensity factor range, AKP, required to drive a crack at constantvelocity was found to behave in a manner generally similar to thatof Kc , while the slope of the essentially linear curves of crack growthper cycle vs AK also appears to be independent of stoichiometry.
So far, effects of the distribution of segment lengths betweencrosslinks have been minimal. While no clear effect on dynamic mechani-cal parameters has been observed, there appears to be a tendency, atconstant M , for solubility, swelling, and possibly Kc , to be higher,the greater the proportion of longer chains between crosslinks.
Preliminary examination of specimens using electron microscopy(in transmission and scanning modes, as well as using replication) re-vealed considerable variation in features seen. While some results wereconsistent with the existence of a 2-phase microstructure, confirmationwill require further study. Similarly, preliminary examination offracture surfaces by optical microscopy revealed variations in surfacefeatures, depending on stoichiometry and AK level; these variationsare yet to be interpreted.
Completion of the studies begun but not finished is in progress,and the synthesis and characterization of broader-distribution specimensand specimens containing imperfections such as network diluents, areplanned.
3

SECTION II
INTRODUCTION
A. Statement of the Problem
Crosslinked poiymer networks comprise some of the oldest and mostuseful polymers in modern technology. Because of their good dimensionalstability, resistance to viscous flow at elevated temperatures, andresistance to water and solvents, resins based on such materials asepoxies, phenolics, polyesters, and aminoplasts find many applications,for example as components for mechanical and electrical uses, ascomposite matrices, and as protective coatings. Similarly, curedelastomers fill many common engineering needs.
Although such crosslinked or "thermoset" networks can often bemade easily, with relatively little technical expertise, knowledge ofstructure-property relationships is in a much less satisfactory statethan with thermoplastics (1-3).
Reasons include inherent complexity of the chemistry involved,sensitivity to processing conditions (often poorly controlled),intractability and difficulty of characterization, and a frequent lackof attention because many ordinary service demands can be met withoutsophisticated technical knowledge. However, as technology moves towardsmore and more demanding technical specifications, as in the case ofaerospace materials, and towards more precise and demanding balancesbetween costs, benefits, and materials conservation, much more must belearned about these materials. At present, the engineer would stilllike more information (in comparison to other materials) to use as abasis for materials selection or component design.
Thus, relatively little is known about such basic parameters asthe degree and distribution of crosslinking as a function of composition,morphology and processing conditions, on the one hand, and as related tomechanical behavior such as creep, stress-strain behavior, and fracture,on the other.
B. Objective and Scope of the Program
a. Objective
The principal objective of this program is to determine theinfluence of crosslinking and network structure, in particular variations inthe distribution of chain lengths between crosslinks, on the mechanicalproperties of polymers exhibiting high glass transition temperatures,Tgt S, above the temperature of use.
4

b. Scope
The scope of the program includes the study of both model andpractical high-Tg resins, as follows:
1. Development of syntheses for, and characterization of, modelcrosslinked systems which permit control of the degree and distributionof crosslinks.
2. Synthesis and characterization of high-Tg epoxy resins havingcontrolled degrees and distributions of crosslinks.
3. Characterization of viscoelastic behavior, including stress-strain response at high and low rates of loading, and creep or stressrelaxation to reflect both short-term and long-term response.
4. Determination of static and cyclic (fatigue) fracture behavior.
5. Determination of typical morphologies by optical, electronand scanning electron microscopy.
6. Correlation of fundamental properties, especially compositionand degree and distribution of crosslinking, with engineering behaviorunder static and cyclic loading.
B. General Discussion
As discussed in section A, the increasing use of crosslinkedpolymers for critical and demanding engineering applications requiresmuch better fundamental knowledge about the molecular networks concerned,and the relationships between the network characteristics, synthesis orprocessing, and mechanical and other properties. A major reason for thedeficiency in our knowledge is the complexity and variety of networkstructures which may be encountered (1,2). This complexity leads toseveral difficulties in experimental studies of the type concerned inthis discussion.
First, it is difficult to characterize important characteristicsof crosslink density (or Mc, the average molecular weight between cross-links), the distribution in the length of chains between crosslinks, andthe amount of material not incorporated in the network. Second, suchcharacteristics are sensitive to process variables such as stoichiometry,temperature, and additives (2,5-22). A third problem is the tendencyfor the curing of many systems such as epoxy resins to be often complexwith respect to both a multiplicity of simultaneous reactions and tomorphology (2,7-9). From the simplest chemical point of view, an idealpolymeric network may be conceived of as a three dimensional system ofconnected chains forming a single macroscopic molecule (Figures la, Ib).
5

A "single molecule" is formed, because a Maxwell's demon may traverse theentire system, stepping only upon regular covalent bonds. Clearly, thebehavior must depend on the tightness of the network with such a model;a network such as shown in Figure la would exhibit less swelling than thenetwork in Figure Ib, which has a larger Mc. Even with such models for an"ideal" homogeneous unimolecular network, however, a problem arises, forin many real cases (Figures 1c, Id) the lengths of chains between crosslinksmay vary depending on the structure of the monomers or prepolymers, or onthe vagaries of reaction kinetics. Of particular interest to this studyis the effect of a distribution in Mc.
Furthermore, as shown in Figures le to lh, a real polymer networkis usually quite different from the ideal in structure. Not only do loopsand dangling chain ends detract from the effectiveness of the structure,but shorter chains, either linear or branched, may exist without directchemical connection to the network. Also in some cases reactive diluentssuch as styrene oxide may be added reacting at one end of the moleculeand leaving the other dangling. Such entities largely serve to dilutethe network, and tend to adversely affect physical and mechanicalproperties (1).
Finally, the topology and morphology of the networks may vary stillmore from the picture presented (2). Considerable evidence suggests thatat least in some cases composition may be quite heterogeneous, even tothe point that distinct phases may coexist, especially in the neighbor-hood of interfaces (1,8,9,13,22,23). Indeed, in such cases a better modelmight be an inverted version of, for example, Figure Ig, with highlybranched or crosslinked domains embedded in a lower molecular weightmatrix; Figure lh illustrates such a domain model, as well as the generalcase of compositional heterogeneity (noting that phase boundaries neednot be sharp). Variations may also exist if one of the multifunctionalreactants has itself a distribution of molecular weight between itsfunctional groups (Figure 2); such variations are characteristic of epoxyresins.
Typical methods for study of networks have been directed primarilyat determining an average value for Mc, and have been mainly based onstoichiometric predictions, swelling, elastic moduli, creep, mechanicaldamping, and glass transition behavior (1,2; see also section B.b). Thus,classical theories developed by Flory (24, chapter IX) and others (1,2)have served to predict gelation and crosslinking in a statistical way,albeit to an approximation which may or may not be a good one_(2). Inthe case of vulcanized rubbers, which exhibit high values of Mc (say,5000), much understanding of elastomeric networks has already beenachieved. While our knowledge remains incomplete, the theory of rubberelasticity (1, chapter XI), the Flory-Rehner swelling theory (1, chapterIX), and the theory of viscoelasticity (25) provide guideposts fordetermining not only chemical properties such as crosslink density, but
6

m m
:C T(A) (B)
M (1)
CC
(E) (F)
(H) (G) I q
'-'
FIGURE 1: SCHEMA SHOWING TYPICAL VARIATIONS IN NATURE AND
COMPOSITION OF CROSS-LINKED POLYMER NETWORKS
(AFTER REFERENCE 2).
7

also a practical basis for estimating modulus, creep, stress-strainbehavior, and fracture (26-33). However, treatment of the distributionof crosslinks has constituted one of the unsolved problems of polymerscience. Nevertheless, it should be possible (see section III below)to measure the distribution of crosslinks by tagging them with heavyatoms and obtaining the low-angle X-ray scattering function, as hasbeen done with linear polymers to find mean end-to-end lengths (34,25).
At room temperature, all such elastomers, of course, are abovetheir glass transition temperature, Tg. If the crosslinked polymer isbelow its glass transition temperature, its molecular chains are in-capable of long range coordinated motion, and the material becomes stiffand glassy. Such "thermoset" resins are typified by a variety ofcommercial materials, including phenolformaldehyde resins, melamine resins,crosslinked polyesters, and epoxy resins. Unfortunately, with materialsof this type, which exhibit high degrees of crosslinking and greatchemical complexity (Mc << 5,000, '300 for some common epoxies),equations useful for elastomers tend to fail and require empiricalmodification (2), and in addition many characterization parameters inthe glassy state are insensitive to the nature of the crosslinking.Moreover, as pointed out cogently by Nielsen (1,2), there is surprisinglylittle fundamental study of mechanical behavior using materials charac-terized to the limits of the state-of-the-art. To be sure, there areexceptions, for example, recent studies of epoxy behavior by a numberof authors (6,7,14-19,36-38), but studies correlating fundamental andengineering behavior are not as common as might be supposed.
Another difficulty with gelling or thermosetting systems is that,as pointed out long ago by Nielsen (8) and others (2), and more recentlyby Gillham (5), the temperature of cure plays a role far beyond that ofsimply altering reaction rates in a chemical sense. As curing proceedsat a given nominal temperature, the network develops and its Tincreases. However, when the T of the network reaches ambient temperature(which may exceed the nominal temperature due to adiabatic self-heating),the rate of further crosslinking is drastically reduced due to slowingof reactant diffusion by the stiffening of the network. Thus, if thespecimen is heated to above its curing temperature, as might well be thecase in a modulus-temperature study, additional curing may occur duringthe test itself. Information about the network deduced from such testsis relevant only to the material subjected to the additional thermalhistory of the test, not to the original specimen as cured. Clearly, thecuring temperature must be higher than the maximum test temperature ifone is to achieve a network which will be stable during testing.
In summary, because of the importance of thermoset resins topresent and future technology, we need much better experimental andtheoretical understanding of the relationships between processing, the
8

network formed, and its behavior. At present, detailed empirical orsemi-empirical studies are relatively few in number, especially withrespect to fracture behavior.
9

SECTION III
TECHNICAL APPROACH
From the standpoint of relevance to the engineering applications,an epoxy resin system would be of considerable interest. Although thechemistry is complex, the systems are easily adaptable to specimenpreparation, an increasing number of quantitative studies relating atleast average or relative network properties such as Mc to stoichiometryand curing conditions have appeared (5-23,36-40). In several studies byothers and this group (7,39,40), it has been possible to demonstratethat full curing can be effectively obtained using special cure histories.Also, at least some qualitative evidence is available relating visco-elastic parameters such as damping to the breadth of the presumed dis-tribution of crosslinks (2), and some evidence is available on stress-strain behavior (7,36), fracture (28,29), and impact strength (36), thelatter as a function of Mc. Disadvantages include difficulty inprecisely controlling the distribution and nature of crosslinks (due tothe fact that commercial resins usually exhibit a distribution of mole-cular weight) and in directly measuring the crosslink distribution.Nevertheless, it seemed reasonable to conclude that a thorough character-ization of viscoelastic behavior in blends of epoxy resin should enablecorrelation of the distribution of Mc and other network variable withultimate behavior under static and cyclic loading. Existing studieswere of insufficient scope to permit such a correlation.
To complement this study, and in a sense to calibrate it, itseemed desirable to also study a still more definable model system.For this purpose a novel network system developed by Bamford and otherswas selected (for a review, see reference 4). This system, which isdescribed in detail below (section IV) has several advantages. It isversatile chemically, well tested and studied in the laboratory, and,being free-radical in nature, readily interpretable in therms ofstatistical calculations and predictions of cross-link densities anddistributions. While average densities are still obtained, due to thestatistical nature of free radical polymerizations, it should be notedthat fairly narrow distributions of Mc would be obtainable (and quitepredictable) in the case of polystyrene. In fact (41), the ratio ofweight to number-average molecular weight must be 1.5 in this case(termination by combinations) - a value much lower than is found formost other free-radical polymerizations (values usually > 2), and closeto the range characteristic of the living polymer technique, 1.1 to 1.5.Another advantage is that the system selected inherently contains multi-ple heavy halogen atoms at the crosslinks, thus permitting direct cal-culation of the distribution from X-ray scattering (34,35); Mc can be
10

varied easily, and synthetic distributions can easily be prepared bymixing prepolymers with different Mc values. Finally, the system can bedesigned to contain a predictable proportion of linear chains orbranches, and to be controllably degraded to give branched species. Allthese advantages can be gained without the sensitivity of networkcharacteristics to whether or not curing temperature is above the testtemperature. In fact, as the gel point is approached, the reaction mayautoaccelerate (in contrast to the retardation with epoxies). However,if such an effect is observed, Mc values can be calculated fromknowledge of polymerization parameters (4); in any case, autoaccelerationcan be avoided by keeping rates and conversions below critical values,which for polystyrene are reasonably high.
In short, two complementory candidate systems were selected: onea potentially good, though not perfect, approximation to an ideal networkmodel of academic interest as a material, and the other a less goodapproximation to an ideal model, but a system with existing engineeringapplication. Thus, the two approaches should be considered as a dualmodel system: a primary, well definable model coupled with a modelwhich is less easily defined, but of greater technical per se. Theprimary model should serve to illuminate and calibrate the secondarymodel, the epoxy system; the two should be considered together.
Specific discussions of each system follow in sections IV and V.
11

SECTION IV
SYNTHESIS OF MODEL NETWORKS
A. Introduction
The principal aim of this research is to show how the mechanicalbehavior of glassy networks depend upon the distribution of Mc valuesand how free or dangling chains alter behavior. Polystyrene, with aglass transition temperature, Tg, of +100 0 C was selected as the modelnetwork, because its glass temperature is above room temperature, itsnetwork structure is susceptible to control, and its general physicalbehavior is well known.
Two objectives were sought: (1) To prepare networks with twodistributions of Mc through the use of the Bamford synthesis (4) and(2) to produce controlled network structures through the use ofdecrosslinking. The latter makes use of acid anhydride monomers, whichcan easily be hydrolyzed.
a. Bamford Networks
Model networks of polystyrene, with easily degradable crosslinksites, can be synthesized using a novel variation of the Bamfordtechnique (4). Bamford et al. have made crosslinked polymers, designatedas AB crosslinked copolymers, using vinyl trichloroacetate, or similarchlorinated monomers X in polymer A. Such sites serve as controlledinitiation points for formation of polymer B. A variety of photochemicaltechniques provide convenient initiation. A single network is formedif the second polymerization terminates via a combination reaction, asshown below.
)heat + B4- 3 1 -CI 2 (B)n ()
( Mo°(CO) 6 (A)(A) (A) +n
combination ..- * (2)
(B)- + :(B)n_ A A
disproportionat ion Bm
Since Bamford was primarily interested in a novel type of graft copolymer,monomer A and monomer B were different. However, as mentioned above, forour model network studies of thermoset plastics, polystyrene will serve
12

for both reactions, because of (a) its otherwise well-known behavior,(b) its high glass transition temperature, 1000C. In addition, poly-styrene radicals undergo termination by combination, giving a narrowermolecular weight distribution than otherwise (41). Branching can beintroduced controllably by adding known amounts of a photosensitivesolvent (4).
The networks can also be made controllably degradable if anhydridegroups can be introduced at some or all of the crosslink sites. Forexample, it should be possible to incorporate p-carboxystyrene-trichlo-roacetic acid mixed anhydride, PCSTAMA, or trichloroacetic acid-acrylicacid mixed anhydride, TCAAAMA (monomers not hitherto synthesized) inpolymer A, to serve as the initiating site for polymerization B. Theanhydride junction could then be easily broken by soaking in hot water,ethylene diamine, or aqueous ammonium hydroxide.
The amount of PCSTAMA or TCAAAMA and the amount of monomer B addedshould control the average molecular weight of chain segments between cross-link sites, Mc, in polymer A and B separately. Therefore, two Mc valueswill be required to characterize each network. Incorporation of p-2,2,2,trichloroethylstyrene in greater or lesser amounts should generate astable crosslink site. On hydrolysis of a polymerized B chain having one-end joined via the anhydride, and the other end joined stably, a branchwill be generated. If both ends contain the anhydride, a free chain ofknown average molecular weight will be generated.
Thus, several distinct model polymers can be synthesized in acontrolled manner via the above reaction scheme:
(1) Linear polystyrene of known molecular weight.(2) A network of known average crosslink density, containing two
separate but controllable and known Mc values (the distribution of Mcbeing known precisely, as it is governed by the well understood kineticsof styrene polymerization).
(3) A network containing known amounts of branches or free polymer,the molecular weights of the branches or free polymer being determined byknown kinetic parameters.
(4) Synthetic distributions made by mixing reactions havingdifferent spacings between potential crosslink sites. Again, thedistributions will be calculable from available information.
b. Specific Syntheses Planned
It was decided to begin network syntheses using the followingcomonomers with styrene:
13

(1) p-2,2,2- trichloroethyl styrene (PCES), for the introductionof permanent crosslinks in Bamford networks.
(2) the mixed anhydride of p-carboxy styrene (PCS) and trichloroacetic acid (PCSTAMA), for the Introduction of degradable crosslinks.
(3) the mixed anhydride of vinyl phenylacetic acid (VPA) andtrichloroacetic acid (VPATAMA), on a alternate for PCSTAMA.
However, PCES and VPA proved to be unavailable commercially, andPCS was quoted at a prohibitive price (45), $650/25g. While a synthesisfor VPA is known (46), it was decided instead to attempt the
0 0II II
CH2 = CH - C - 0 - C - CCI 3
synthesis of the mixed anhydride of acrylic acid with trichloroaceticacid (TCAAAMA), which would involve only common reagents.
The latter new monomer should be capable of copolymerizing withstyrene, to yiela through the Bamford reaction, a suitable crosslinkednetwork. The anhydride component could then be hydrolyzed to yield aproduct having the characteristics of either a linear polymer, or moreinterestingly, one with a lower level of crosslinking. The TCAAAMA canalso be mixed with a conventional crosslinking agent in various pro-portions, to produce new model networks having both permanent anddegradable crosslinks.
Since the synthesis of TCAAAMA involved considerable difficultyit was decided to confirm the feasibility of using degradable crosslinksby synthesizing polystyrene containing acrylic acid anhydride (AAA) as ahydrolyzable crosslink. For a similar reason, in order to examine vis-coelastic behavior in the rubbery region in a system containing hydroly-zable crosslinks, poly(ethyl acrylate)s were prepared containing tetra-ethylene glycol dimethacrylate (TEGDM) and AAA - the former
I (TEGDM)CHO 01211 II
HC - C O- 0 CH2 - CH2 4 0 -C -CH = CH22 24
S(AAA)CH 0 01 2 I1 Ii
HC - C - 0 - C - CH = CH2
yielding permanent, and the latter hydrolyzable, crosslinks.
So far, a crude product believed to be TCAAAMA has been obtained,copolymers of styrene and ethyl acrylate with AAA have been successfully
14

synthesized, and hydrolysis of the crosslinked latter copolymersdemonstrated.
Also, the Bamford synthesis itself was tested successfully,using CC14 and trichloroacetic acid as initiators. Experiments using2,2,2-trichloroethyl acrylate as a comonomer with styrene, and Mo(CO) 6as catalyst at 800C were unsuccessful, but are being repeated using aninert atmosphere.
B. Experimental Details, Results, and Discussion
a. Mixed Anhydride Synthesis
As mentioned above, the synthesis of the mixed acid anhydrideof acrylic acid and trichloroacetic acid was more complex thanoriginally anticipated. The reaction desired is the following:
0 0II II
CH2 = CH - C - OH + Cl3C - C -OH0 0 (4)
+ CH2 CH - C - 0 - C - CCI3
A review of standard literature sources revealed that theproposed compound had never been prepared before. After the first fewunsuccessful attempts, informal consultation with a synthetic organicchemist, Dr. Ned Heindel, Department of Chemistry, was also arranged.The specific approaches are discussed below.
1. Reaction of the acyl chloride with a carboxylic salt (42,43).
S0 RefluxCC 3 C - Cl + Na O- C -CH= CH 2
Ether,Slurry
0 0 (5)
CCI C - 0 - C - CH CH + NaCl3 2
Probably due to the heterogeneous nature of the system the kinetics ofanhydride formation were slow, and no product was recovered. In orderto effect some solution of the salt which would aid in speeding up thereaction, various polar solvents such as dimethyl formamide were tried,without success. Acetonitrile (dipole moment =3.92 D) was unsuccessfullyused in a Soxhlet extraction of the salt. This route has been setaside.
15

2. Reaction of the acyl chloride with a carboxylic acid (42,44).
0 01, 11 Pyridine
CCI 3 - C - Cl + CH2 = CH - C -OH
0 0
CCI3 - C - 0 - C -CH=CH 2 + C5H5N - HCI (6)
or
0 0i 1, PyridineCCI3 - C - OH + CH2 = CH - C -ClI
0 0II II
CCI3 = C - 0 - C - CH=CH2 + CHN'HC (7)
Reaction (7 ) gave better results than reaction (6).
During these trials, the need for a rigorously dry atmospherebecame apparent. Presently a leak-proof dry box with phosphorouspentroxide as drying agent and a continuous dry nitrogen flow (nowater and no oxygen) is being employed.
An exact description of the best procedure to date, which didyield a crude product, is as follows:
A solution of 0.1 mole of dry pyridine is made in 50 ml of drybenzene and 0.1 mole of acryloyl chloride is added dropwise withstirring. The temperature rose (to about 6 0 c) and a yellow pyridiniumcomplex separate. While stirring is continued, 0.1 mole of trichloroaceticacid in benzene solution is added dropwise; 0.2 percent of antioxidant330 (Ethyl Corporation) was also used. The temperature ohanges little,and soon stirring becomes difficult to continue due to the formation andcoagulation of solids, after stirring is stopped (about 30 min), adistinct red liquid phase separates on the bottom of the reactionmixture. The identity of the red liquid, which becomes more viscous aftervolatiles are removed, is still uncertain. It is only slightly solublein benzene, styrene, and carbon tetrachloride.
Distillation of the product caused polymerization. However, thebenzene could be removed under vacuum conditions. An elemental analysisof the liquid showed significant contamination with pyridine and pyridinehydrochloride.
16

Efforts are now being made to find a selective solvent. An anti-oxidant is being added (0.2%) to reduce the tendency to polymerize forthe red liquid may be actually an oligomer of some sort. A side reactionrequiring attention involves the addition of HCI across the double bond.
Preliminary attempts to copolymerize the crude product with styrene
are in progress.
b. Synthesis and Hydrolysis of Polystyrene-AAA Networks
Model experiments demonstrated the feasibility of synthesizingpolystyrenes containing degradable crosslinks consisting of AAA units.
0 0 0 0C - C - 0 - C - C C - C - OH + HO - C - C (8)
II I I
C C C C
Control polystyrenes with stable crosslinks were also prepared usingdivinyl benzene (DVB) as crosslinking agent.
Samples of polystyrene were synthesized in bulk (temperature, 600C;initiator: lauroyl peroxide, 0.4%; time, t,3 days). Three types wereprepared: (1) linear polystyrene, (2) polystyrene containing 0.2 wt.percent AAA, and (3) polystyrene containing 0.2 wt. percent DVB. Cross-linking in the latter two cases was demonstrated by the fact that speci-mens swelled by a factor of about 10 in toluene, but did not dissolve.Thus the AAA, as well as the well known DVB, introduces true chemicalcrosslinking. Although initial experiments were unsuccessful, suitableconditions for the hydrolysis were found more easily than expected.
First, samples treated in dilute NaOH (0.1 N), boiling aqueousNaOH (0.1 N), or dilute HCI (0.1 N) showed no detectable increase inswelling. Hence, no hydrolysis had occurred - a fact to be expected inview of the limited hydrophilic character of the networks. Samples werealso swelled in another potentially hydrolytic agent, pyridine, whichswells PS networks as much as toluene. The samples were then placed inwater where they turned white and brittle. However, when placed intoluene, the whiteness disappeared and swelling occurred to the sameextent as with untreated samples. (Note: linear PS dissolves in pyridine.)Again, no hydrolysis had occurred. Since water is soluble in pyridine,various pyridine:water mixtures were used to effect hydrolysis of theanhydride bonds; no swelling occurred in such mixtures. Some samples werethen left to soak in pyridine:water mixtures for about 3 weeks. Sincethese samples swelled much more in toluene than untreated samples, atleast partial hydrolysis must have occurred. Moreover, it was also foundthat samples swelled in pyridine and left in pyridine dissolved completelyin about 2 days. Thus complete hydrolysis was obtained.
17

However, best results were obtained using ethylene diamine, avery basic liquid. When samples were soaked in ethylene diamine, littleswelling occurred. However, after treatment for less than one hour,hydrolysis had occurred, for the specimens could be dissolved in toluene.Solutions of a few drops of ethylene diamine in toluene also dissolvedthe networks. In contrast, PS crosslinked with DVB, which contains nohydrolyzable groups, was unaffected by ethylene diamine.
Proof of the reversibility of crosslinking was adduced by thefollowing experiment, using a sample of linear PS and one containing AAAcrosslinks.
After hydrolysis of the latter polymer in ethylene diamine, bothpolymers were dissolved in toluene, and the intrinsic viscosities, En],determined. Viscosity-average molecular weights, M•, were calculated forboth polymers using the Mark-Houwink relationship (Bn1=KMa), with constantsfrom the Polymer Handbook (47).
Polymer Mv
Linear Polystyrene 3.3 x 10⁵
AAA containing PS, hydrolyzed 3.2 x 10⁵
These results, identical within experimental error, indicate that theoriginal polymerization kinetics were not significantly affected bythe presence of the AAA, except to introduce crosslinking.
Network characteristics, including the crosslink density, are
described In section V-B.
c. Synthesis and Hydrolysis of Poly(ethyl acrylate) - AAA Networks
The photochemical method of synthesizing poly(ethyl acrylate)(PEA) networks in bulk with UV light has been previously described (48).In brief, benzoin was used as the initiator (0.3 percent), acrylicacid anhydride (AAA) as the labile crosslinker and tetraethylene glycoldimethacrylate (TEGDM) as the permanent crosslinker. The chain transferagent 1-dodecanethiol (1-Doth) was employed to control molecular weight.This last was necessary because side reactions during the polymerizationof ethyl acrylate lead to gelation even without added crosslinker. Theexact levels of TEGDM, AAA, and 1-Doth employed are shown in Tables1, 2 and 3.
Decrosslinking studies were done using ethylene diamine andammonium hydroxide. As mentioned in section IV-b, it was found thatethylene diamine was effective in decrosslinking polystyrene networks;however, soaking the PEA for 24 hours in 28% NH4 OH was very effective,
18

and this reagent was adopted for the present study.
d. Conclusion
In summary, the PEA-AM system shows that AAA crosslinks can beeasily and selectively hydrolyzed to yield a wide range of viscoelasticbehavior patterns. In combination with permanent type crosslinks, AAAsystems were made and hydrolyzed to give novel structures between thoseof a regular crosslinked network and a branched soluble system.
19

SECTION V
PROPERTIES OF MODEL NETWORKS
A. Introduction
The physical and mechanical behavior of polymer networks dependsupon the crosslink density, the distribution of molecular weights ofchain segments between crosslinks, Mc, the number of free or danglingchains, and the temperature. Three general temperature regions havebeen identified: (1) above the glass-rubber transition region, where thematerial behaves like an elastomer, (2) within the glass-rubber transi-tion region, where the material is viscoelastic, and (3) below the glass-rubber transition region, where more or less glassy behavior predominates.The experiments performed under this contract are primarily directedtowards region (3), with some effort placed in region (2) to show thechanges in behavior that may be expected as the polymer chains gainmobility. Region (1) is of interest only in the ana!ytical determinationof crosslink density (see section a, below).
Properties of particular interest include creep or stress relaxa-tion (to determine long-term behavior), stress-strain response, andfracture characteristics. Progress to date is discussed below.
Since the synthesis of the AATAMA has been more difficult thananticipated, experiments have been directed not only to PS systems cross-linked with AA, but also to poly(ethyl acrylate) systems crosslinked withdiethylene glycol dimethacrylate (DEOM) and AAA. The latter systems areespecially convenient for characterization of effects of reversible cross-linking on viscoelastic behavior.
B. Experimental Details, Results, and Discussion
a. Crosslink Density
While absolute values of crosslinking cannot generally be obtainedwith densely crosslinked systems such as epoxy resins (2), approximatevalues in more "open" systems can be estimated in several ways, the mostcommon being by swelling and by measurement of the modulus in the rubberystate.
Thus values of Mc, the average molecular weight between crosslinksites, were obtained by swelling samples before and after hydrolysis inmethyl ethyl ketone (MEK) and using the Flory-Rehner equation (24,49):
20

1 In (1-v 2 + v12 + X12 v2
Fr., PpV0 (v21/3 - v2/2)
where v represents the volume fraction of polymer in the sample atequilib~ium, V is the solvent molar volume, of density p, and X 2 thepolymer-solvenA interaction parameter was taken as 0.47.. In eacn casevolumes were assumed to be additive. Values reported in Tables 1-3 werebased on actual weight gain, Mfc(wg), and on length change, Mc(L).
In addition, values of Mc were estimated from Young's modulus, E,by means of the theory (24) of rubber elasticity, to give M-c(E):
Mc(E) 3pRT (10)E
where p is the density, R the gas constant, and T the absolute temperature.
Results for the various systems are discussed below:
1. PS-AAA Systems. In this case, the Flory-Rehner equation (equation3) was employed to estimate Mc. Based on the increase in weight of theswollen sample, v2 was found to be 0.0802. Based on the increase inlength, v2 = 0.102. Using X, = 0.47, the Mc values were then estimated,
and compared with the values calculated from the known addition of AAA inTable I.
Table 1. M for PS-AAA Crosslinked Networks.c
Method v2 M
Weight increase 0.0802 1.1 x 10⁵
Length increase 0.102 4.5 x 10⁴
,
Calculated - 3.4 x 10⁴
* Assumed infinite chain length.
Clearly, reasonable agreement (at least in order of magnitude) wasobtained, in view of the precision and accuracy inherent in the measure-ments and calculations. Probably, the "weight increase" technique above ismore accurate than the "length increase" method. However, the crosslink
21

levels are very low, making accurate assessments via the Flory-Rehnerequation difficult.
Ordinarily, the swelling method yields values for M smaller thanthose estimated from composition because of the presence oý physicalcrosslinks (i.e., chain entangements). The inverted situation suggeststhat either the AAA is inefficient (resulting in dangling unreactedgroups, or both vinyls being incorporated in the same chain), or that theanhydride bond was partly hydrolyzed before the final measurements.Hydrolysis is the more probable cause. While the AAA may have been partlyhydrolyzed as received, careful handlipg procedures are obviously needed(for example, use of a dry-box).
2. PEA-AAA and PEA-TEGDM Networks. In Tables 2-4, values of M viaboth swelling and modulus measurements are compared to the theoreticalvalues, M (th), calculated on the basis of actual amounts of crosslinkeradded, assuming infinite primary chain length. Experimental values ofMc are shown to agree with theory in Table I, except for the far righthand column, With no added crosslinks, a value of •c equal to themolecular weight itself is expected, but since infinite chains wereassumed in the Mc(th) calculations, a value of - is reported for the caseof no crosslinks. Finite values are noted experimentally, with muchsmaller values obtained via the modulus experiment. This last is becausephysical entanglements count effectively as crosslinks. None of thematerials in Table I would dissolve after hydrolysis, although increasedswelling values were noted..
Table 2. Characterization of Crosslinked PEA Networks.
I-DOTH 0
AAA 1.2 ml 0.56 0.56 0.28 0 0 0
TEGDM 0 0 1.4 0.70 2.9 1.4 0
4M (L) x 10 0.9 1.3 0.9 1.6 0.8 1.5 135
M-c(wg)x 104 1.3 1.9 1.0 1.8 0.8 1.7 110
4M (th)x 10 1.0 2.0 1.0 2.0 1.0 2.0
4M- -(E) x 10 0.9 1.2 0.9 1.3 0.7 1.2 1.7
EA: 100 ml Benzoin: 0.4 g
22

Table 3. PEA Networks with 0.68% I-Dodecanethiol.
1-DOTH 0.68 ml
AAA 1.2 ml 0.56 0.56 0.28 0 0 2.4
TEGDM 0 0 1.4 0.7 2.9 1.4 0
4M (L) x 10 3.1 6.7 2.2 8.5 2.2 - 1.2
4M-- (wg)x 10 2.9 5.2 2.7 7.6 2.4 - 1.4
M e-(th)x 104 1.9 3.9 2.0 4.0 2.0 4.1 1.0
M- (E) x 104 0.8 1.2 0.9 1.4 0.8 1.2 0.6
After Hydrolysis (NH 4OH)
M-c (L) x 10 4.1 9.0 4.0 10.0 2.4 - -
c (wg)x 104 5.7 8.7 3.5 8.4 2.7 - -
M-c (E) x 10 1.2 2.1 1.0 2.1 0.8 1.0 1.3
EA: 100 ml Benzoin: 0.4 g
Table 4. PEA Networks Capable of Complete Hydrolysis.
1-DOTH 1.36 ml 2.7
AAA 1.2 ml 0.56 0.56 0.28 2.4 2.4
TEGDM 0 0 1.4 0.7 0 0
M C(L) x 105 1.8 3.9 0.44 5.3 1.1 0.8
- 5M (wg)x 10 1.8 4.0 0.4 4.7 0.8 0.6
M (E) x 104 1.4 2.0 1.2 3.0 0.75 0.78
After Hydrolysis (NH 4OH)
M (L) SOL SOL 0.54 6.2 SOL SOLc
Mc(wg) SOL SOL 0.5 5.89 SOL SOL
MIc (E) x 10• 3.5 5.2 0.36 2.6 1.6 1.6
EA: 100 ml Benzoin: 0.4 g23

In an attempt to counteract the accidental gelation reactions,various quantities of 1-dodecanethiol were introduced to promote chaintransfer reactions. As shown in Tables 3 and 4, at a level of 1.36%1-Doth or greater, the polymers are soluble after hydrolysis. Thevalues of 9 C (E) on the bottom row of Table 4 represent the limiting levelof physical crosslinks only.
To summarize the effects of AAA on M (E), values are plotted inFigure 2 before and after hydrolysis for two different 1-Doth levels.(Note that a decreasing Mc value indicates an increased crosslinkinglevel).
b. Creep and Stress Relaxation
Creep response was investigated using Gehman (50,51) and Clash-Berg (52) type creep testers; also tensile creep studies were performed.
For stress relaxation, a special unit was used. The relaxationmodulus E(t) was calculated at time t from the equation
w x 981 E(t) 1 (11)A 3 a2
where w equals the weight applied, A is the cross-sectional area of thesample, and a is the elongation, equal to the final length over tle 1initial length. For high elongations, the engineering strain (2a + T)was employed for modulus calculations. TesTs were confined to PEA-TEGDM Systems.
Results of the Gehman-type creep test are shown in Figure 3, forPEA containing 1.2% AAA, before hydrolysis. The reported Tg of thismaterial, -22 C., agrees well with the result, and a well defined rubberplateau is approached at -5 0 C. Addition of 0.68% of 1-Doth increases therate of creep somewhat, as shown in Figure 4. After hydrolysis, the rateof creep was increased still more, as shown in Figure 6. Even thoughviscoelasticity increases from Figure 3 through Figure 4, to Figure 5, theactual glass transition temperature probably remains nearly the same,only the molecular weight distributions in relation to the crosslinklevels were changed.
Stress relaxation studies on a series of networks is shown inFigure 6 and 7.
The effect of hydrolysis time is shown in Figure 8. The level of1-Doth, 1.36%, permits solubility after hydrolysis, as noted in Tables 3and 4. The TEGDM employed however, kept the networks intact. Notethat only a small effect is noted on the behavior between 24 hours and
24

1o4 0 o
105 1,. 2.. 4
AAA(ml)/E.A1OOmI
Figure 2. Values of M (E) as a function of AAA and 1-Doth levels,before and after hydrolysis.-o-0.68% 1-Doth before hydrolysis-o-0.68% 1-Doth after hydrolysis-.- 1.3% 1-Doth before hydrolysis-c-1.3% 1-Doth after hydrolysis.
25

-. .- 3o'.
10 ' -25'C
DIO -2oCc
-15*C-15C
EAlOOmI/AAA12mI
p. • .. i • ,
1 10 102 iTIME(Sec)
Figure 3. Values of log 3G vs. time in the glass transitiontemperature range of PEA.
26

---------.----------
-25t
z -2UC
10
-151CS-I0Cf
E.AlOOml/AAA12n-i/l"DothO.6Br, .
10 10, 10
TIME(Sec)
Figure 4. Values of log 3G vs. time for a series of temperaturesfor a material containing 0.68% 1-Doth.
27

ido ' -30C
id -2oC
Sd -210C
1Cr5C
10 After hydrolysis
E. A1O0ml/AAAt2rj/1DothQ68ml
1 10 i0•10TINME(Sec)
Figure 5. Log 3G vs. temperature for PEA, after hydrolysis, for a PEAcontaining 1.7 ml of AAA and 0.68% 1-Doth.
28

AAAQ56IE AIOOHy 1Doth
-'- 24 /-o- / 0.68-o- 24 0.68
1-0- I 1.3
w
W ()---(___
ldD
r . ... I......... .. i
10 102
TIME(MIN)
Figure 6. Stress relaxation of PEA networks before and after
hydrolysis.
29

AAAQ28+TEGDMO.7/E.A
Hly. -1Oth-.- / /
-o- 0.68-o- 24 0.68
"-D- / 1.3.ý10wz
--------- O----O
----- - 0 - - -0I
10 10_
TIME(MIN)
Figure 7. Stress relaxation of PEA networks containing bothpermanent and temporary crosslink sites.
30

48 hours of hydrolysis time.
The tensile creep modulus of several networks is shown in Figure9. At a level of 1.36% 1-Doth, the network structures of the materialswithout TEGDM is seen to be completely destroyed. Creep was rapid enoughto cause sample failure after only a few minutes.
Finally, Figure 10 summarizes the creep modulus behavior of hydro-lyzed samples having various levels of 1-Doth. At 0.68% 1-Doth, a networkis retained, and the modulus does reach a plateau. At 1.36% 1-Doth, thepolymer is just soluble, and failure occured after about one hour. At 2.7%1-Doth, creep is much more rapid, due undoubtedly to the lower molecularweight remaining, and the sample failed after only a few minutes.
31

ExOG/A A 28. ý) ItEG . If111,Itth 136Hylolysis(NH.OH)
-0- 0-cIý- 24hours
(D- 48
W
z
10010
TIME(MIN)
Figure 8. Stress relaxation of PEA networks as a function ofhydrolysis time.
32

EA100/ 1Doth t36AAA TEGDM
-s- 12 /-o- Q56 /-0- 0.28 0.7-0- 056 14
0I 1010
TIME (MIN)
Figure 9. Tensile creep modulus of several PEA samples, afterhydrolysis for 24 hours at 2500.
33

10? - A1(EA00 -/AAA 2A)
J!•Doyh7 0 O-4h I116h
1.36 () 00
106.
TIME(MIIN)
Figure 10. Creep modulus of samples having little or no networkproperties after hydrolysis for 24 hours at 25°C in28% NH4OH.
34

SECTION VI
SYNTHESIS OF EPOXY NETWORKS
A number of epoxy systems have been intensively studied over thelast few years (5-23,36-40), most based on bisphenol A derivatives.Variations have included the nature of the epoxy resin or curing agent(10,11), the length between functional groups, which will help defineMc(11), temperature (5), and the introduction of reaction diluents, whichmay dilute the network and also alter the state of cure (7). Both aminesand polyamides have been used; in the latter case (39,40), the Mc can bevaried by changing the amide equivalent content.
For this study, one system considered for selection was the epoxy-amine-diluent system used by Whiting and Kline (7); (Epon 828-diethylene-triamine-styrene oxide.) The system has been characterized thoroughlyin terms of % reaction of the epoxy groups, and concentrations of both
-OH and -CH 2 -0- groups followed as a function of amine and diluent(styrene oxide) contents. A wide variety of degrees of cure are obtainable,and also variations in Mc as a function of stoichicmetry. Moreover,values of yield strength, ultimate tensile strengths and fracture energyhave been obtained and related to process parameters. A similar system(Epon-828/methylene dianiline (MDA)) was also studied extensively byBell et. al. (6,36-38), who critically analyzed the stoichiometric aspectsof curing and also determined the effects of Mc in other amine-cured resins(by changing the molecular weight of the amine curing agent) on tensileand impact strength.
Bell (37) also showed that the presence or absence of an exothermhad no effect on the curing reaction, that nearly complete curing could beachieved in this system, and that predicted values of Mc agreed well withvalues estimated by experiment. Later, Selby and Miller (17) studied theEpon-828/MDA system extensively, with emphasis on the effect ofstoichiometry on fracture toughness. Since this combination of studiesprovided excellent background in fracture behavior as well as otherproperties, the Epon 828-MDA System was selected as a standard of referencefor this study.
Another advantage of this system is that no clear evidence for atwo-phase structure has so far been adduced for gross heterogeneity of thetype reported for other systems (2,8,22,23). Thus Selby and Miller (17)found evidence for craters and hillocks in the micrometer size range, butno relationship between these features and crack propagation behavior.Also, small angle X-ray studies (54) have revealed no evidence for a two-phase structure in the 50 ý to 100 ý size range, and, in these laboratoriesno evidence (based on modulus-temperature studies) for a two-phasestructure has been observed for bisphenol-A-type resins fully cured with
35

polyamides (39,40,55), though studies of this kind have been used topostulate a two-phase morphology (2,8). It may be noted that nodularstructures (size, "100 R) have been ovserved in "homogeneous" amorphouspolymers (56); the question is controversial, and as yet unresolved (57).In any case, any significant degree of two-phase morphology should bereadily observable.
For initial study, several series of epoxies were prepared basedon the Epon 828-MDA reference resin. Systems include blends toachieve equal equivalent weights but different distributions of molecularweight (and M9 ), and also homopolymers of varying molecular weight toprovide additional standards for comparison. Characteristics of thoseand related resins are described in sections A-a and A-b, and proceduresand results in Section B.
A. Structure and Stoichiometry
a. Structure of Epoxies
The epoxy prepolymers used in this study all have the followinggeneral structure:
0 CH 1O CH3
MrCH-..HC]42 {0.qOOQ CH2-4H- CH2 j-._0.-{+-C.--J---CH,--CH--jCH2
LH, n CH,
where n varies from 0 to 24 (58-60).
As supplied commercially, a distribution of composition usuallyexists (61,62). It is possible to obtain only two prepolymers whichhave relatively narrow distributions of molecular weight and henceequivalent weight: Epon 825 (Shell Chemical Company) and Epi-Rez 509(Celanese Coatings Company). As will be described later, this fact(along with requirements of curing) restricts the control over heterogeneityin molecular weight M (and hence in M) which can be achieved in blends.
The curing agents are available in several forms and purities, theessential component being methylene dianiline (MDA), also called p,p'-diaminophenyl methane (DDM):
36

H2 N CH2 -- a NH2
The nominal characteristics (as supplied by the manufacturers) ofthe epoxy prepolymers are given in Table 5.
Table 5. Characteristics of Epoxy Prepolymers.
Prepolymer Equivalent Composition, wt%
wt, g/eq n=O n=1 n=2-8
Epon 825 176 100 - -
Epon 828 190 75 25 -
Epirez 520-Ca 475 - - -
Epon 100 1a 500 11 16 72
Epirez 522-C a 600 - - -
aEpon 1002 650 - - -
Epon 1004a 938 - - -
a Solid at room temperature.
Confirmation of the distributions will require the use of gelpermeation chromatography; this characterization has not yet beenaccomplished on the materials used in this study.
b. Stoichiometry and Mc
For estimation of Mc , the calculations of Bell (37) may beemployed. Bell developed equations for Mc based on the stoichiometryof the curing reaction and the amount of primary amine and epoxy groupsremaining in the polymer at a given time. Since calculated values wereshown to agree well with values estimated from measurements of swellingand the polymer solvent-interaction term X (equation 9 ).
37

With curing conditions used in Bell's and this study, severalidealized structures may be expected, depending on the stoichiometry(Figure Ila). In principle, the epoxy prepolymer is difunctional andthe amine tetrafunctional so that under conditions of equivalence offunctional groups, the following reaction will occur:
•- CH - CH CH - CH
0H HO0o H H 0
-- CH - CH2 CH 2- CH
-- CH - CH2 CH - CHI 2 I
OH OHN -R -N (12)OH OH
Uri - CHCH - CH 2 C
At other stoichiometries, structures can be readily visualized byreference to Bell's paper.
Thus, with an amine/epoxy ratio of 2:1(Figure 11a) enoughprimary amine groups are present to theoretically react with all epoxygroups and yield linear chains. In fact, as shown by Bell (37), however,some primary amine groups may remain after secondary groups have reacted,thus yielding some crosslinks. In this case, the effective Mc is givenby
aMA + bMB - X{(aMA + bM B)/[3/2(2a - Y) + (X/2)]1}A= BA B(13)c 3/2(2a - Y) - (3X/2)
where: a and b are the number of moles of amine and epoxy, respectively;MA and M are the molecular weights of the amine and epoxy, respectively;and X an• Y are the numbers of unreacted primary and secondard aminegroups, respectively. Since the concentration of unreacted epoxy groups,E, is equal to 2b-4a+2X+Y, analysis of X and E gives Y (37). Afteranalysis, Bell was then able to estimate Mc* From his tabulated data, avalue of about 1500 may be estimated.
If, on the other hand, the structure were in fact linear, and conversioncomplete, Mc would in effect become the number average moledular weight
38

M as given byn
_ aMA + bMBM n = (14)
n a-b
Using this equation, one would have a value for Mn of •. In reality,conversion of precisely all the functional groups is not complete;even a minuscule decrease from 100 percent conversion will yield finitemolecular weights. Hence the significance of calculated values for Mcor Rn is questionable unless very accurate analytical data in theconcentration of residual functional groups is available.
For the case of equal stoichiometry, when b=2a (Figure 11a), Mis given by
S=(aM + bM )/3(b-a) (15)c A B
when the amine is slightly In excess, equation 15 may be used as well.
When epoxy is up to about 20 percent In excess, Mc is given by
M = [aMA - (b - 4a)MB/[3a - 3/2(2b - 4a)] (c6)
which allows for the presence of not more than one dangling end perbranch point. The idealized structure will consist of an amine moleculewith epoxy branches.
B. Experimental Details, Results, and Discussion
As mentioned above, several series of unblended and blendedepoxies were prepared. General procedures described by Bell (37) andManson and Chiu (39,40) were followed for systems using liquid epoxies,depending on the system; variations were necessary In the case of solidepoxies. Resins were prepared in two thicknesses: 0.25 in. (6.35 mm)for fracture studies, and 0.020 in. (0.51 mm) for measurement ofdynamic mechanical and other properties. Materials, procedures, andgeneral results are discussed below.
a. Materials
The epoxy resins used were all diglycidyl ethers of Bisphenol-Aoligomers: Epon series 825, 828, 1001, and 1004 (Shell Chemical'Company); and Epirez series 520-C and 522-C (Celanese Coatings Company).Of these prepolymers, Epon 1001 and 1004, and Epirez 520-C and 522-C weresolids at room temperature. The curing agent used In most syntheses wasmethylene dianiline (MDA), obtained in the form of Tonox (Shell ChemicalCompany) and 99%-pure MDA (Aldrich Chemical Company). In a few cases,the following polyamides were used as curing agents: Versamids 115 and
39

140 (General Mills Chemicals, Inc.). In the latter case, phenyl-glycidyl ether (Shell Chemical Company) was used as a reactive diluent.All resins of a given type were taken from a given batch; equivalentweights were used as supplied by the manufacturers.
b. Pre.paration and Curing
The various procedures for preparation and curing are summarizedbelow. Compositions are given in following sections:
1. The general procedure for systems using liquid epoxy pre-polymers with MDA as the curing agent was similar to that used by Bell(37). Following prior heating to 1000 C, the resin and curing agentwere evacuated for 5-15 min io remove bubbles, mixed6 cast, andcured as follows: 45 min in a circulating oven at 60 C; 30 min at 800C,and 2.5 hr at 1509C; slow cooling to room temperature. The moldassemblies comprised clamped 5-in by 5-in glass plates separated by0.02-in (0.51 mm) or 0.25-in (6.35 mm) ethylene-propylene copolymer orTeflon spacers were heated to I00°C prior to the casting step. BothMold Release 225 (Ram Chemical Company) and Epoxy ParFilm (PriceDriscoll Co.) were used successfully as mold release agents; sheets ofMylar were also effective. With care, clear, yellowish to brownspecimens were obtained from which bubble-free sections could be cut.
The cure cycle used was reported by Bell to give essentiallycomplete curing (37) - a conclusion supported by data presented insection VII. Somewhat higher temperatures were used by Selby andMiller (17), but the effectof curing temperature as a variable was notexamined in this study.
2. Higher molecular weight epoxies such as Epon 1001 are solidsat room temperature, and are usually used in conjunction with a solvent.In order to avoid at this time the question of a possible role ofsolvent in network formation, it was decided to conduct curing in bulk.It was difficult to achieve defect-free specimens in these cases, forat the higher temperatures needed to give the fluidity necessary forhandling curing proceeded at an undesirably fast rate. However, thinspecimens (0.5 mm thick) were successfully made as follows.
The resin was melted at 125 0C and evacuated. The curing agentwas mixed in and samples cast between glass plates without furtherevacuation. The curing cycle was modified to I000C for 1.5 hr., and1500C for 2.5 hr; dynamic modulus studies indicated complete curing.A similar method was used for Epon 1004. By this technique, it waspossible to get bubble-free sections for dynamic modulus studies.
40

3. For Versamid-cured systems the procedure developed by Mansonand Chiu (39,40) was followed. First 6 percent by weight (based on thetotal mix) of phenyl glycidyl ether was mixed with the epoxy prior toaddition of the polyamide in order to reduce viscosity and thusfacilitate mixing and removal of bubbles. The epoxy resin was heatedto 400 C, and evacuated in a vacuum oven to remove absorbed air andmoisture. After the curing agent is heated to 40°C and added to theresin, the total mixture then evacuated for about 5 min. Sheets ofsamples were formed by use of the mold assemblies described in sectionb-1.
c. Series A (varied stoichiometry)
This series (with MDA as curing agent) was prepared to provide astandard for comparison with other specimens prepared in this study andwith the literature. Table 6 gives the compositions, on the basis ofequivalent weights (based in turn on specifications supplied by themanufacturer). Theoretical values of Mc, as calculated by equations 13to 16, are given in Table 6, along with compositions.
Table 6. Compositions of Series A Epoxy Resins.
Designation Amine/epoxy Ratioa Mc (theoretical)b
A-7 0.7 : 1 1523A-8 0.8 : 1 526A-9 0.9 : 1 383A-10 1.0 : 1 326A-1OA 1.0 : 1 326A-11 1.1 : 1 370A-14 1.4 : 1 592A-16 1.6 : 1 924A-18 1.8 : 1 1922A-20 2.0 : 1 (Linear)
a All are based on the use of Shell TONOX curing agent, except for
the A-1OA case, for which 99% MDA was used.b For reasons discussed by Bell (37) actual Mc values for specimens
A-16 to A-20 may be in error. However, estimation of absolutevalues will require analysis of the residual amine content. In anycase, the error will not affect any trends observed in propertiesas a function of stoichiometry.
Thus this series provides resins covering a wide range in composi-tion, ranging in amine excess from -30 percent to +100 percent.
41

d. Series B (Blends at equal Mc)
For this series, various resins were blended to achieve an epoxyequivalent weight of 190 g/eq (equivalent to that of Epon 828, and to avalue for ITc of 326). Stoichiometric amounts of MDA were used in allcases. Details are given in Table 7, which also includes data on theblending resins themselves.
Table 7. Compositions of Series B (Blends) Epoxy Resins.
Desig- wt % of I wt %nation Epon Epirez Epon Epirez Epon Epon Eq n=0 n=1 n=2-8
1004 522-C 1001 520-C 828 825 wt I
B-I - 11.4 - - 88.6 190 89.9 1.8 8.3
B-2 - 10.3 - 9.6 80.1 190 88.4 4.1 7.5
B-3 10.0 - - - 90.0 190 - - -
B-4 - - 11.8 - 88.2 190 - - -
B-5. - - - 100 - 190 75 25 -
B-6 - 5.7 - 50.0 44.3 190 82.4 13.4 4.2
B-7 - 2.3 - 80.0 17.7 170 - - -
B-8 - - - 100 168 100 - -
B-9 - - 100 - - 475 - - -
B-10 - 100 - - - 500 11 16 73
B-11 100 - - 600 - - >73
B-12 100 .... . 938 - - >73
a Not yet cast.
e. Series C (equal Mc but different stoichiometry)
In order to determine whether or not behavior at a given Mcdepends on whether or not stoichiometry is 1:1, series C was made. Thisseries complements series A but provides direct comparison of resinsat equal Mc* Table 8 gives the compositions; data for control B-5 arealso included.
42

Table 8. Compositions of Series C Resins.
Desig- - Epoxy Amine/Epoxynation c Fraction
B-5 326 Epon 828 1.000
C-8 326 Epon 825 1.045
C-9 326 Epon 825 0.956
B-10 740 Epon 1001 1.000
C-11 740 Epon 825 1.531
C-12 740 Epon 828 0.742
f. Series D (Versamid Resins)
Several resins were prepared from Epon 828 using polyamide curingagent, Versamids 115 and 140. It seemed undesirable to examine effectsof distribution in Mc using Versamid-based resins, which are softer,tougher, and typical of adhesives and coatings rather than rigid, high-Tg resins. However, in view of considerable experience at Lehigh withsuch resins (39,40,55), and because such resins were expected to beeasier to handle than the brittle MDA-cured ones, several specimens werecured. Because of their relative flexibility, they provide a means ofexamining the effects of network flexibility on viscoelastic and fracturebehavior. It was also thought that a two-phase morphology might bepossible.
Compositions are given in Table 9.
Table 9. Compositions of Series D (Versamid-cured) Epoxy Resins.
Designation Relative Amine/Epoxy Proportions
Epon 825 Epon 828 Epon 1001 V-11 5 a V-140a
D-- - 1.0 1.0 -
D-2 - 1.0 - - 1.0
D-3 1.0 - - - 1.0
a Amine equivalent weights are: V-115 and V-140, 238 and 385 g/eq,
respectively.
43

g. Series E (Unblended Resins, equal Stoichiometry)
To provide a baseline for examining the effects of Mc at constantstoichiometry, resins based on the following prepolymers were synthesizedusing stoichiometric amounts of MDA as curing agent: Epons 825, 828, 834,1001, 1002, and 1004.
C. Discussion
Using the techniques described, it was possible to preparespecimens suitable for testing, albeit with considerable difficulty inthe case of the solid epoxies. Reproducibility of casts appears to bereasonable (see section VI I).
With respect to the blends, It is clear that there are limits onthe number of blends that can be prepared from resins which themselveshave a distribution. In this case, the limit of variation of individualMc values within a blend has been a factor of about 3.
It should be noted also that while the broadest distributionsachieved are relatively broad on a weight basis, they are much lessbroad on a number basis. This must be borne in mind in interpretingeffects on behavior.
44

SECTION VII
GENERAL CHARACTERIZATION OF EPOXY NETWORKS
A. Introduction
A principal aim in the epoxy portion of the program is to studyeffects of network structure on ultimate properties such as strength,toughness, and fatigue resistance, as well as on behavior at small-deformation such as creep or stress relaxation. Adequate correlationrequires thorough characterization of the polymers concerned - an idealprocedure all-too-often unrealized in practice.
Some studies in the literature have been concerned with severalaspects of behavior, for example, tensile strength as a function of Mc(7,36) in epoxies rather well characterized in terms of dynamicmechanical behavior. Otter studies, for example of fracture toughnessand fatigue not included such characterization, and sometimes theepoxies themselves are not specified (63-66). It was therefore decidedto establish a standard series of well-characterized polymers againstwhich specimens having varying distributions of Mc and other networkcharacteristics could be compared.
Parameters of particular interest are the crosslink density asexpressed by Mc, which also reflects the degree of cure, and theviscoelastic behavior, which reflects the segmental mobility and energydissipation characteristics. In particular, viscoelastic response isoften sensitive to differences in network structure. Microscopicexamination is also important, to verify the presence or absence of atwo-phase morphology.
This section describes progress to date with the characterizationof the resins discussed in section VI. Materials and characterization arediscussed in more detail below.
a. Crosslink Density
The degree of cure and crosslink can be analyzed in several ways,the two most common involving determination of swelling (and sol-gelratio) and modulus in the rubbery state. While, as will be seen,absolute values may not be obtained in densely crosslinked systems,values still give an excellent indication of relative network characteris-tics.
Thus Whiting and Kline (7) showed that the swelling of epoxy-amine-diluent systems was very sensitive to the nature of the network; themeasurements were used to indicate relative values of Mc. Values of Mc
45

can also be estimated from swelling using the Flory-Rehner equation(equation 9). Use of this or modifiea empirical equations (2) hashad some success with epoxy resins (7,37); in any case, the values canbe correlated with values derived from mechanical tests. In principle,distribution functions can be estimated for Mc from measurements ofswelling as a function of pressure; in practice, this is difficult (2).
Values of Mc can also be determined from moduli measured bydynamic mechanical spectroscopy using a Rheovibronor similar unit.Although the kinetic theory of rubber (equation 17a)is not valid forhighly crosslinked systems, an approximation (2) may be useful(equation 17b):
a) G = nRT = pRTMc (17)
b) log G = 7.0 + 2 9 3 p/Mc
where G is the shear modulus, p the density, n the number of moles ofnetwork chains per unit volume, and IT the average molecular weightcbetween crosslinks. In our experience (39,40) equation'16 held well forseveral epoxy resins (cured with polyamides), yielding values of Mc inexcellent agreement with prediction; equation 17 Tav be better when therubbery modulus is greater than, say, 108 dyn/cm . Values of Mc havealso been estimated from the elevation of the glass transitiontemperature, Tg, by crosslinking (2,6):
3.9 x 10 4Mc =Tg - T go°(8
where Tg is the transition temperature of uncrosslinked polymer (made by
incompletely curing an epoxy-amine mixture).
b. Effects of Crosslinking and Network Structure
Crosslinking profoundly affects the viscoelastic behavior ofpolymers: the T , the damping (as measured by tan 6 or E" - see sectionb ), and the slope of the glass transition (2,6,7). In addition, cross-linking affects the characteristics of the next loss peak appearing asone lowers the temperature from T - a peak often called the "a" peak,as distinct from the "ct" peak corresponding to the T (18). Some changesare shown in Figure 11.
As Mc decreases (and crosslink density increases) T shifts tohigher temperatures, and at very low values (densely crosslinked systemssuch as phenolic resins) may disappear altogether. Also the damping peak isbroadened and heightened as crossl ink density increases, the maximum
46

0
ur_w
-w
0 ir
Liiw H:
w wH
I-J
Lo00
C=) c 00 CD O
990-1 9N IdWVU 901 b-j z
w w wwL U
P0 u < cn Ow w -H
0 0 O0 WFw~~ LI : : W
>- W wLL-uo - 0 r z U
-i ~< w 00.
H- H- Cso)
W W LU-ic w. CD8.C w C) C:H
ID CDxXi-I LU
-4r
0 (
C,,ý
47

occurring when stoichiometry is optimum. Effects of stoichiometry anddiluents are readily observed (1,6,7). The distribution of crosslinksis believed to be in large part responsible for the noticeable broadeningof the glass transition as Mc decreases (1, chapter 4); this effect isalso seen with crystallinity. Presumably a spread in crosslink distri-bution (or crystallinity) will result in a spread in relaxation timesand hence slope of the transition.
Stress relaxation and creep are also sensitive to networkcharacteristics (2,23), though most scientific work on characterizedspecimens appears to have been concerned with rubbers. In general, creepof highly crosslinked systems in the glassy state is very slow, probablylower at high loads, long times, and temperatures just below T than forless crosslinked systems (2). The stress relaxation technique (whichis essentially equivalent to the inverse of a creep test) can often reveallong-time effects, when coordinated long range molecular motions ordisentanglements first become important. Each type of test has been usedsuccessfully to predict the modulus of epoxies at long times (67);correlations using time-temperature superposition principles (25) in theform of master curves is feasible.
B. Experimental Details, Results, and Discussion
In this section, characterization to date by swelling and dynamicmechanical spectroscopy will be presented and discussed, as well as pre-liminary examination of morphology by electron microscopy. Analysis ofthe resins to determine unreacted functional groups has not yet beenmade; for the present purpose, the extent of cure can be inferred from themechanical studies. Differential scanning calorimetry is also being usedto characterize the state of cure, but results are not yet ready fordiscussion.
a. Swelling
Preliminary swelling tests have been made on Series A and SeriesB resins. Two techniques have been used: swelling of powder in chloroformvapor to get a swelling ratio (7) and swelling in liquid acetone (37).
In the first technique, finely ground powder (about0.1 g) was placedin a desiccator over about 100 ml of chloroform. Weights were measuredafter 24 hr., and the swelling ratio calculated as the ratio of the finalto initial weight.
In the second technique, small specimens (0.5-in by 0.5-in x0.020-in) were cut from plates and soaked in 150 ml of acetone for 15days with agitation. Swollen specimens were weighed after drying ofacetone from the surface. The sol fraction was determined by evaporatingthe residual acetone to dryness or by weighing the dried samples after the
48

swelling test was complete. The swelling ratio, q, is given by
Final Volumeq = (19)
(1 - wt fraction sol) x original volume
For calculation of Mc using the Flory-Rehner equation, values ofX were interpolated from values given bv Bell (39).
1. Series A Epoxy Resins (Varied Stoichiometry)
Although data are not yet complete, (correction for solubilitynot applied, due to scatter in the data) it may be seen from Figurethat both methods indicate a minimum at or near the stoichiometric ratio.Also results so far tend to agree with those reported by Bell (37) - seeFigure 12, which shows Mc (calculated using the Flory-Rehner equation) asa function of stoichiometry. However, Mc values are lower than predictedby stoichiometry (section VI-c ).
Tests are being repeated to check reproducibility, especially ofspecimens taken from various portions of a cast plate, and to correctfor the sol fraction.
During the course of swelling test numerous cracks were observedon all specimens. On closer observation the number and sizes of cracksseemed dependent on stoichiometry, their being more and larger cracksthe further away from equal stoichiometry. On solvent evaporation thecracks close up, but reappear on soaking after 2 to 3 hr. Figure 13shows large cracks in specimen A-16 (about 30 pm in width) with smallerones (about 7 Um) branching out. It is possible that such cracking,which resembles stress-cracking, may be sensitive to details of the net-work.
2. Series B Epoxy Resins (Broad Distribution)
Data are summarized in Table 10.
49

700
0
600 0
500
400
300
200 -0
0 9 BELL'S SERIES(37)
100 - 0 SERIES A
* SERIES B
010.8 1.0 1.2 1.4 1.6 1.8
AMINE/EPOXY RATIO
FIGURE 12. COMPARISON OF MC DATA FROM SWELLING TESTS: SERIES B(POINT INCLUDES ALL SPECIMENS).
50

Ow1
FIGURE 13. SOLVENT-INDUCED CRACKING DURING SWELLING OF ASERIES A EPOXY RESIN (A-16), AS OBSERVED BYOPTICAL MICROSCOPY (66.5X).
51

Table 10. Swelling Behavior of Series B Epoxy Resins a
Approx wt % of Swell Ratio, q % SolSample Moleculesa having Spec Spec av. Spec Spec av.
No. n=O n=1 n=2-8 a b a b
B-1 89.86 1.82 8.32 0.255 0.253 0.254 0.46 0.37 0.42
B-2 88.41 4.06 7.53 0.256 0.255 0.256 0.49 0.59 0.54
B-6 82.44 13.41 4.15 - - - - - -
B-5b 75.00 25.00 0.00 0.262 0.261 0.262 0.67 0.55 0.61
B-4 similar to 1 0.258 0.257 0.258 0.36 0.35 0.36
B-7 lowerc %I higher 0.255 0.247 0.251 0.40 0.30 0.35than thanB-I B-I
aAll specimens blended to give Mc = 326.bcb Nominal composition for Epon 828 (control specimen).
c Quantitative analysis not available.
It is interesting to note that use of the Flory-Rehner equationyields a value for Mc of close to 160 for all specimens. This valueis about half that given by stoichiometry, 326; the value also does notagree with the value given in Figure 12. Clearly, swelling results canbe used only for relative comparisons, and then only within a givenseries. It should be noted that after correction for the sol fraction,the data for series A at 1:1 stoichiometry will agree rather well withthose for Series B.
At first glance, the values of swelling do appear to be verynearly equal. However, there does appear to be a slight trend towardshigher sol fraction and swelling ratio when the proportion of materialwith n=1 is high, and the proportion with n=2-8 is low. It seems likelythat the effect of the former is dominant. Thus the longer chains maywell permit a higher degree of swelling than is possible with shortchain ones. An effect of distribution in Mc is therefore possible,though not clearly proven.
b. Dynamic Mechanical Spectroscopy
Measurements of complex Young's moduli (1) were made using aRheovibron viscoelastometer, model DDV-II, (Toyo Measuring InstrumentCompany). The instrument applies a sinusoidal tensile strain to one endof a sample, and measures the stress sensed at the other end. Trans-ducers permit the reading of the absolute dynamic modulus IE*I (the ratioof maximum stress to maximum str-in) and the phase angle 6 between the
52

strain and the stress. The storage modulus, E', the loss modulus, E",
and the dissipation factor, tan 6, are given as follows:
E' = IE*I cos 6
E" = IE*I sin 6 (20)
tan 6 = E"/E'
E" and tan 6 are measures of the energy dissipated irreversibly, and E'a measure of the energy stored reversibly.
The experimental procedure was as follows. Thin strips (1n2 mm)were cut out carefully from 0.020-in sheets and polished well along theedges using fine sand paper. It was found that heating to above Tgprior to cutting helped minimize shattering of the more brittle specimens.Measurements were made at 110 Hz and a heating rate of 1 C/min over atemperature range from -80 0 C to about 400 C above the T". The T and B-transition temperature were taken from the major and lower maxima,respectively, on the loss modulus (E") vs. temperature curves. Theslope change of E'(d log E'/dt) at T was obtained in the region ofT +40 C. Typical original data are reproduced on Figure 14 in order t-show the kind of scatter encountered. Several points may be noted.First, the duplicate run (on the same specimen) gave excellent re-producibility in the transition region, thus indicating essentiallycomplete curing. An exception was specimen A-IOA, cured with 99% MDAinstead of TONOX. This specimen gave incomplete curing, as shown inTable 11; T. and slope (n) increased and decreased, respectively, (in-dicating further curing) on repeated runs. Second, however, reproduci-bility of absolute values of E, E', and tan 6 in the glassy range isless good, with a 40% variation between the highest and lowest value(at O°C). This behavior seems to be characteristic of the Rheovibroninstrument: good reproducibility of transition temperatures, butvariation in absolute moduli, especially in the glassy state.
Fluctuations in reading were often encountered at low temperaturesdue to ice formation on the surface of the specimen; this problem wasalso mentioned by Arridge & Speake (18). However, this problem has beenresolved satisfactorily by sweeping dry nitrogen through the specimenchamber. Also correction of the instrumental correction factor (K)to allow for slight size variations from specimen to specimen seems toimprove reproduciblity of absolute values. Good reproducibility alsorequires frequent recalibration of temperature readings. By followingthese precautions, runs by different operators give transition temperatureswhich agree within 2 to 3 degrees.
To evade the problems of cutting specimens and of using thinspecimens whose behavior may not reflect that of thick ones an acousticresonance-type unit (Nametre spectrometer, Model XV) has been purchased.
53

NVI
C:)r- C
9~~- ofIII I I IL
r-i
I- WI~1%
~j w~ CC)
I-4 :0e 00 CD
< z ~-w C:)u 0:: LL
I! IZ500
.1 CD
w - u<JL ww w1
w _j a-54

The transitions of interest should be visible at frequencies betweenabout 100 and 2000 Hz for temperatures between -150&C and 2500 C (Klineused a resonance device in all his epoxy studies). A specially designedtransducer has been ordered for use with 0.25-in specimens.
1. Series A Epoxy Specimens (Variable Stoichiometry)
Three transitions are often evident in the dynamic spectra ofepoxies, as one descends in temperature; one at high temperature, (apeak), one at a lower temperature, and one at a still lower temperature.The a-peak is associated with the glass transition, while the lowest-temperature peak is attributed to motions of the glycidyl group (18).The middle peak is claimed to be an artefact associated with incompletecuring (18); after careful recalibration of the Rheovibran used in thisstudy, small peaks seen earlier disappeared. Thus, attention may befocussed on the upper and lower peaks. Since in these studies, we nowsee only two peaks, the lower-temperature one will be called "1", inconformity with conventional practice. (In some literature, this peakmay be called "y"; nomenclature is not standardized.) It may also benoted that with one exception no evidence for incomplete curing or atwo-phase morphology is seen in the dynamic spectra, as has been notedin other studies (1,2,8); re-running of a specimen gives essentially thesame curve as before.
Data are presented in Tables 11 to 13, and displayed in Figures15 to 17 . It may be seen that increased crosslinking raises thetemperatures at which the a and a transitions occur, as reported inother studies (6,7,18). Curiously, values of T are inexplicably high -
higher than those noted by Bell (39) [even afted allowance for thehigher frequency used in this study] and higher than predicted, based onthe curing temperature (5). At present, no explanation in terms oftemperature error or adiabatic heating is tenable.
Increased crosslinking also increases the value of the rubberymodulus, E' (which was estimated using the theory of rubber elasticity,equation 10, and decreases theslope of the a-transition, in conformitywith prediction (1) It is interesting that the slope is a function ofstoichiometry only when the amine is in excess; the amine appears tosharpen the transition, perhaps by enhancing mobility of the chainsegments. The maximum value of tan 6 at the a-transition is also decreased,as reported by Murayama and Bell (6), but is increased at the 1-transition, as reported by Arridge and Speake (18).
Arridge and Speake (18) have also noted that the relative decreasein E' as one passed (upwards) through the 0 transition is related to thedegree of cure - the greater the decrease, the greater the crosslinkdensity. While values of E' are quantitatively uncertain, the value ofthe percent decrease in modulus between (-70 to -80) C and (+20 to +30)°Cwas found to increase, from 21 for sample A-18 (amine in excess) to 69for sample A-IOA (equal stoichiometry).
55

Table 11. Dynamic Mechanical Data of Series A Epoxy Resins (VariableStoichiometry).
Speci- Amine/ T a T a d log E'/dT tan 6 Ex1O-8b
men Epoxy Ta 1 at T,(n) maxRatio oC oc dyn/cm2 -deg Value Temp.(0C) dyn/cm2
A-7 0.7 132 -47 0.050 1.10 148 1.54A-8 0.8 162 -47 0.050 0.91 177 2.59A-9 0.9 197 -42 0.038 0.72 213 4.55A-I 1.0 198 -45 0.056 0.70 206 4.00
A-1OA 1 . 0 c 192-198 -42 0.043-0.050 0.76-0.68 202-206 4.13-4.25A-11 1.1 190 -40 0.056 0.82 201 3.82A-14 1.4 164 -45 0.067 1.08 176 2.40A-16 1.6 141 -47 0.077 1.25 153 1.38A-18 1.8 136 -45 0.083 1.30 149 1.25A-20 2.0 119 -45 0.083 1.60 133 0.78
a From maxima in E" vs. temperature curve.
b Storage modulus in rubbery state (at k T + 40).
c Epon 828/99% MDA. This specimen was shown to have incomplete curing;
first runs on new specimens gave T,=192, n=0.050 and repeated runs onthe same specimen gave Ta=1 9 8 , n=0.043, i.e., further curing onscanning.
Table 12. The a Transition of Series A Epoxy Resins (Variable Stoichiometry).
Stan E"
Specimen Amine/ !max maxEpoxy Temp Temp ValueRatio 0 C Value -9C 2_9dyn/om2
I A-7 0.7 -40 0.025 -47 0.68A-8 0.8 -40 0.032 -47 1.3A-9 0.9 -32 0.044 -42 1.2A-10 1.0 -35 0.036 -45 1.0A-IOA 1.0 -30 0.041 -42 1.5A-11 1.1 -30 0.038 -40 1.0A-14 1.4 -36 0.041 -45 1.0A-16 1.6 -40 0.033 -47 0.94A-18 1.8 -40 0.032 -45 0.84A-20 2.0 -40 0.032 -45 0.88
56

9-- [QUAL LIMIT T2A-ETOICHIOMETRY - .
7 OAMINE/EPOXY
NXO 2 7 RATIO
5~
E'Rx0-8R 23-
DYN/CM2
02
1 0o
200 -30
150 040
£0
100 -501.5 0
TAN6 MAX 1.0
0.55x10² 103 5x10 3
Mc (APPARENT)
FIGURE 15. DYNAMIC MECHANICAL PROPERTIES OF SERIES A EPOXY
RESINS AS FUNCTIONS OF [C. 0, AMINE IN EXCESS;
*, EPOXY IN EXCESS; (, SPECIMEN A-10A.57

10
NX102 L
5
E'XlW-8 3
R 22
DYN/CM2 21 -
2002OO
150
TAN MMAX1.0
0.50.8 1.0 1.2 1.4 1.6 1.8 2.0
AMINE/EPOXY RATIO
FIGURE 16. DYNAMIC MECHANICAL PROPERTIES OF SERIES AEPOXY RESINS AS FUNCTIONS OF STOICHIOMETRY:0, A-10A;E , SERIES B.
58
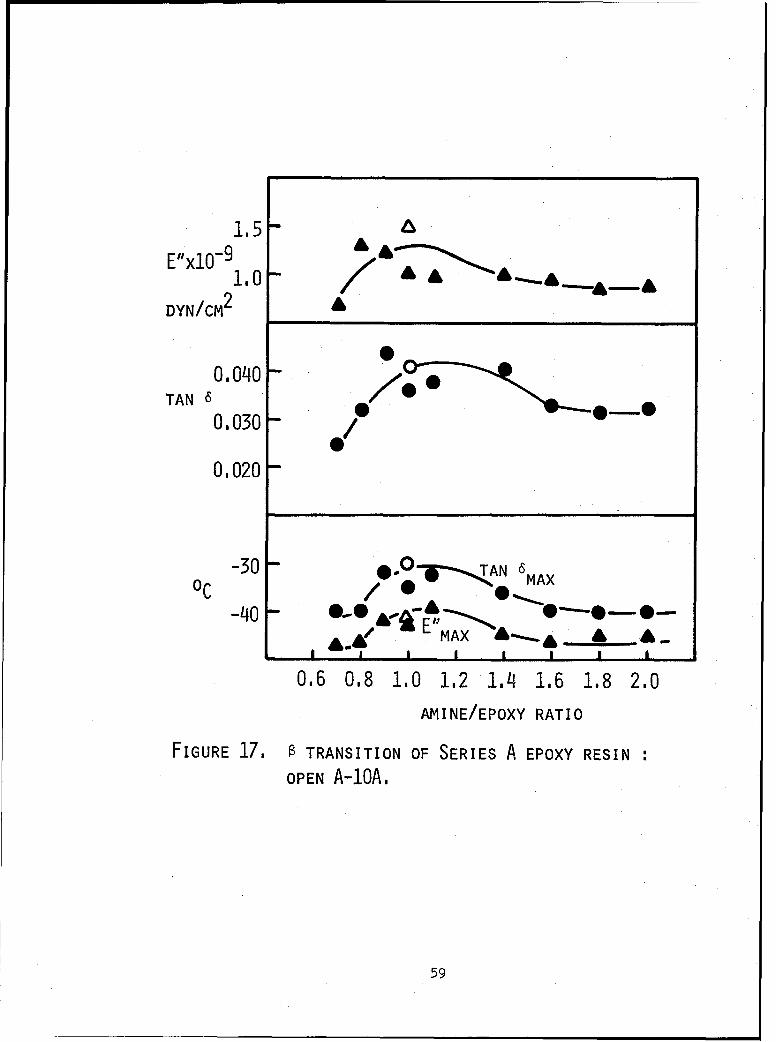
1.5 -E"x10- 91 0 , . ___%___
DYN/CM2 2
0.040TAN 6S @0._.0.030
/
0.020
-30 -0 AN 6MAX0c /
-4 0 - E l lMAX A & A_l I I I I III
0.6 0,8 1.0 1.2 1.4 1.6 1.8 2.0
AMINE/EPOXY RATIO
FIGURE 17. g TRANSITION OF SERIES A EPOXY RESIN
OPEN A-10A.
59

Values of M estimated from E' and the shift in T [using a valueof 800 C for Tgo, following Bell (39)5, are given in Tabl2 13.Agreement seems reasonable, especially in view of the difficulties inapplying the theory of rubber elasticity to highly crosslinked systems.
Table 13. Average Molecular Weight Between Crosslinks,
Mc, for Series A Epoxy Resins.
Amine/ From From From Stress
Specimen Epoxy Vibron Data Relax'nRatioa Stoichiometry E' T Shift At 150 0 Cr
A-7 0.7 1523 727 696 1361
A-8 0.8 526 458 464 -
A-9 0.9 383 282 317 86
A-10 1.0 326 316 325 -
A-10A 1.0 326 302 325-445 -
A-11 1.1 370 328 348 -
A-14 1.4 592 496 494 728
A-16 1.6 924 815 600 1561
A-18 1.9 1922 886 650 1613
A-20 2.0 (Linear) 1392 907 2414
a Amine/Epoxy Ratio on equivalent weight basis.
60

2. Series B Epoxy Resins (Broad Distribution)
Preliminary data for this series are given in Table 14; see alsoFigure 15. It may be seen that the blends comprising this seriesbehave very much like the reference resins of Series A. In earliermeasurements, slopes of the a-transition had appeared to be higher thanfor the reference B-5 resin. However, on recalibration of the Rheovibronunit, the values now fall close to those for B-5.
Blending of 25 percent of an epoxy having n=1 with an epoxyhaving n=O (the case of Epon 828) does change the viscoelastic behaviorsignificantly (Table 15). Since at the same time Mc is increased by 7percent, it is not yet feasible to separate possible effects of distri-bution in Mc from effects of a change in the average value.
Table 14. Dynamic Mechanical Data of Series Ba.
Sample tan 8c °T, Tg, Er' Slope (n)Sa x10-8 d(log E)No. ata C C dyn / cm2 dT
B-i .048 -40 198 4.0 .050
B-2 .043 -38 198 4.0 .056
B-6 .028 -35 198 4.0 .055B-5b .036 -45 198 4.0 .056B-4 .038 -44 198 4.0 .050
B-3 .038 -41 198 4.0 .054
All specimens blended to give Mc = 326; for compositions see Table7.
b Nominal composition for Epon 828 (control specimen).
c Tan 6(max),seen near T , ranges between 0.70 and 0.71 in all cases.
Attempts are being made to broaden the distribution of M stillmore at a given average value, if necessary by using a solvent ýofacilitate mixing. In any case, statistical comparison with the masterplots of viscoelastic data now available will be possible.
Satisfactory theories for dense networks do not appear to exist,though it is supposed that the distribution of Mc is not Gaussian (25).Reliance must therefore be placed on experiment.
61

3. Series E Epoxy Resins (Unblended Resins)
Data obtained so far are presented in Table 15. Clearly all theviscoelastic parameters change significantly as a function of molecularweight of the epoxy resin, and hence Mc. Indeed comparison with thedata in Figure 15_shows excellent agreement. Thus, regardless of howa given value of M is obtained - whether by changing stoichiometry fora given resin, or gy changing the molecular weight of the epoxy at agiven stoichiometry - the viscoelastic behavior seems to be determinedby M c. We are not aware that this reciprocity has been noted previously.
It will be interesting now to blend, for example, E-6 and E-1 togive a mixture with Mc equivalent to that of E-3 or E-4.
Table 15. Viscoelastic Parameters for Series E Epoxy Resins(Homopolymers).
Tan 6(max) Slope, E' Temp ofEpoxy T ,g Value Trmp d PogE' r_7 Peak,
Sample R a c TxS eResin c C dT dyn / cm C
E-1 825 308 203 .62 220 .039 45 -35
E-2 828 326 198 .71 210 .056 42 -45
E-3 834 413 - - - - - -
E-4 1001 740 145 1.15 155 .077 10 -53
E-5 1002 940 - - - - - -
E-6 1004 1324 125 1.52 137 .095 6.8 -55
a Epon Series, all bisphenol-A-based (Shell Chemical Co.).
c. Morphology
Techniques have been developed for high resolution electron (EM)
and transmission electron microscopy (TEM)and scanning electronmicroscopy (SEM). In the former case, specimens were cut with a micro-
tome equipped with a glass knife. In the latter case, specimens were
either fractured in liquid nitrogen, or used as a free surface; acetone
extraction (15) and ion etching (17) and use of carbon-platinum replicas,
62

were used in order to reveal any morphological features. Specimens werecarbon-coated prior to examination by the SEM. Magnifications usedrange up to 80,OOOX.
While studies are still in progress, several micrographs havebeen obtained. For example, the fracture surfaces of a thin film ofD-1 (Epon-iOO1/Versamid 115 system) which had been previously extractedwith acetone resembled that of many other polymers.Similarly a sample of B-5 (MDA-cured) was ion-etched, but revealed onlya one-phase structure when examined with a range of magnification from20,OOOX to 80,OOOX.
Using replication (Figure 18), a micrograph was obtained for specimenD-2 which generally resembled those reported by Morgan and O'Neal (15).While it is possible that the features do reflect the true networkstructure, further work will be required for confirmation. On the otherhand, when specimen D-2 was examined in the SEM, after acetoneetching, no features at all could be distinguished at magnificationsup to 40,OOOX. Similarly, using TEM, no structure was seen in thereplica of specimen D-2 (polyamide-cured), at a magnification of 130,OOOX.
In any case, EM, TEM, and SEM may well prove useful in elucidatingeffects of composition on network structure, especially after extractionof solublematerial by acetone (which seemed to also reflect the distri-bution in Mc - see section B-a.). It will be necessary to determinewhat is artefact and what is not a classical problem in electronmicroscopy.
d. Stress Relaxation
Preliminary stress relaxation tests using a Tobolsky-typerelaxometer (33) have been made with two specimens (A-9 and A-20) at150 0 C. Results are summarized in Table 16. No relaxation occurred withspecimen A-9 (T >1500 C) after 1000 min, while a 25 percent decreaseoccurred with s~ecimen A-20 (Tg<1500 C). For greater convenience, a high-temperature chamber has been fitted to the Instron tester. Once tested,future experiments will be made with this unit.
63

FIGURE 18. ELECTRON MICROGRAPH OF POLYAMIDE-CURED
EPOXY RESIN, SAMPLE D-2, ETCHED IN ACETONE
7 DAYS, 130,OOOX (1000 • = 0.77 CM).
64

Table 16. Stress Relaxation of Series A Epoxy Resins at 150 0 C.
Specimen E(t)a Comments
7A-7 7.75 x 10 slight discoloration, no relaxation to 400 min.
A-9 1.22 x 10 9 slight discoloration, no relaxation to 400 min.A-14 1.45 x 10⁸ heavy discoloration, 3% decrease in Er at 400 min.A-16 6.76 x 10⁷ heavy discoloration, 3% decrease in Er at 400 min.
A-18 6.54 x 7 heavy discoloration, 5% decrease in Er at 400 min.
A-20 4.37 x 10⁷ heavy discoloration, 15% decrease in Er at 400 min;
25% decrease
All resins except A-9 are apparently rubbery at 150°C, so that E(t)
E (t).r
e. Discussion
A series of reliable standard resins has now been characterizedfor comparison with blends of various kinds as well as specimens withother network variations such as diluents. While swelling results tendto be erratic, dynamic mechanical data are more reproducible and con-sistent than might have been expected.
Variations in crosslink density affect many properties, includingswelling, a and 0 transitions (both position and other characteristics),and E?. EP, T , and the slope of the a-transition are especiallysensitive to cAanges in Mc close to stoichiometry.
Effects of broadening the distribution of Mc are not seen invalues of Tg or El. Indeed, if Mc is, as is generally supposed, anumber-average parameter, then an exceptionally broad distribution wouldbe required to have much effect. On the other hand, the swell ratioseems to be sensitive to the details of the Mc distribution. Earliermeasurements of the slope of the a transition seemed to indicate aneffect of distribution; later work has not confirmed such an effect.
65

stress relaxation may also be sensitive in the transition region.
Properties related to fracture, which involve plastic deformationand hence a strong dependence on weight-average molecular weight, mayalso be expected to be sensitive. In any case, still broader distributionsneed to be prepared, even if they cannot be made without changing Mc.With the reference curves now in hand, comparison will be facilitated.Also, distributions may play a greater role at non-stoichiometriccompositions.
66
SECTION VIII
FRACTURE TOUGHNESS, STRENGTH AND FATIGUE
CRACK PROPAGATION (FCP) OF EPOXY NETWORKS
A. Introduction
Work is in progress with measurements of fracture toughness,fatigue crack propagation, and stress-strain behavior. The first twotopics are emphasized, because it was necessary to demonstrate feasibilityof testing. The study of stress-strain response is important but notready for reporting.
a. Fracture Toughness
Fracture toughness may be measured using either of two approaches,based on concepts of either a critical energy balance or a criticalstress intensity factor (28,68).
The former concept is due originally to Griffith (69), who showedthat crack instability in an ideally brittle solid should occur at astress, a, when the following relationship holds:
S ES - (21)ira 7I
where E is Young's modulus, S the surface energy of the solid, a thecrack length, and Gc (=2S ) the critical strain energy release rate.Put simply, the release of strain energy must exceed the amount ofenergy required to break bonds and form new surface.
In fact, values determined for S invariably greatly exceed thosecalculated on the basis of bond fracture energies (2ý). Thu , even abrittle epoxy exhibits a value for S the order of 10 erg/cm - twoorders of magnitude greater than calculated; more ductile resins showeven greater discrepancies. Thus S should be considered as an "effective"fracture energy that includes a-dominant contribution fromiplasticdeformation, evidence for which is seen by electron microscopy.
The second concept is due to Irwin (70), Who soggested that crackinstability could be expressed in terms of the stress intensity factorK - a measure of the degree of stress amplification at the crack tip.Since K can be calculated from the applied stress, crack length-, and geometry,
67

it is an especially convenient parameter for correlation purposes.
Catastrophic crack propagation will occur when either a or Kreach critical levels (ac or Kc), corresponding in turn to criticalvalues of S or G. The two concepts are essentially equivalent,
K2Kc
G E = (22)c (v2)C (1-V2)
for the case of interest here, plane strain, where v is Poisson's ratio.KIcis a useful material constant, though it depends on temperature andon the mode of crack opening. (For simplicity, we shall use "Kc" below.)
b. Fatigue Crack Propagation
Fatigue failure may occur by two mechanisms: (1) a thermal modein which failure occurs by melting due to hysteretic heating, and (2)a mechanical mode comprising the initiation and propagation of a crack.The rate of temperature rise, At, characteristic of thermal failure isa function of stress amplitude, a, frequency, f, and the loss modulus,G" (25):
At = CfG"a 2 (23)
where C is a constant, and G" is itself a function of f and T. Whiletemperatures can, indeed, rise in the fatigue of, for example, epoxyresins in composites due to such hysteretic heating of a whole specimen(71), this study is concerned with low-frequencies and loads well belowthose which will cause large temperature rises (68). Of course, theremay be hysteretic effects locally, but the volume of polymer affected issmall, and any effect will be seen as an effect on the mechanicalpropagation rate.
Failure of a resin takes place in two stages: initiation of acrack, and propagation of the crack to catastrophic rupture. While insome cases, the initiation step may be the critical one, frequently inplastics the propagation step is the most important (28,68). Thus, mostpolymers contain flaws introduced during processing. Such flaws willbegin to grow after a certain number of cycles - the number being lowerthe higher the stress applied. However, the important point in determiningfatigue life is the number of cycles required to grow these flaws to asize which meets the requirements of catastrophic fracture (see equation21). In fact, frequently most of the fatigue life is in the stage ofcrack propagation. Hence measurements of fatigue crack propagation areof special interest in the characterization of toughness in an engineeringplastic; in addition, approximate values of a quasi-fracture toughnessmay be obtained as well (see below).
68

The crack propagation regime can be examined exclusively byprecracking (notching) the test specimen so that the artificial flawis essentially ready to propagate. This approach has received in-creased attention recently (68 ) and was adopted in this investigation.
A useful parameter to characterize the fatigue crack propagation(FCP) response in notched specimens is the stress intensity factor (70).Derived from principles of fracture mechanics (70), the stress intensityfactor describes the stress conditions at the tip of the advancing crackand is defined by
K = Yo/a (24)
where K is the stress intensity factor, Y a correction for specimengeometry, a the stress, and a the crack length.
Fatigue crack propagation data are generated by cycling notchedsamples within a constant load range and recording crack growth over thecorresponding number of fatigue cycles. Under fatigue conditions K willalso vary over a range defined by AK (calculated from equation 24) willalso increase, enabling the measurement of the rate of crack growth percycle, da/dN, over a range of AK. It has been shown (68), that therelationship between da/dN and AK could often be represented by a simpleequation of the form:
da = AAKn (25)dN
where A and m are constants for a given polymer. Other relationships exist,but offer no special advantage in discerning trends in the effects ofchemical structure and composition (68).
In addition, using equation 25, an approximate value of Kc may beestimated from the value of AKma , the last value of AK noted priorto catastrophic failure,and the load range. It has been shown that goodagreement can be obtained with values of Kc measuredindependently from static fracture tests (72).
Using this relationship between da/dN and AK, it is possible toanalyse the FCP response of a polymer as a function of external variablessuch as frequency and temperature (73,74) and structural variables suchas molecular weight composition, and plasticization (72,74,75). Usingequation 25, many correlations between fatigue and structural parametershave been made successfully. The following factors have been shown toenhance FCP resistance: crystallinity, high molecular weight, linearityvs: crosslinking, and presence of a rubbery inclusion. Several specificpoints in these studies are worth noting in more detail.
69

First, while studies of controlled crosslinking have not beenmade, until now, earlier work in these laboratories showed that cross-linking tends to increase the slope of the da/dN curve and, at least athigh values of AK to decrease Aimax significantly; each of these effectsis a measure of decreased toughness. Further, studies with a denselycrosslinked epoxy resin showed that stable FCP behavior could be obtainedonly for a few cycles, and then only by increasing the temperature. (Anew possible solution to working with such brittle thermoset resin isdescribed later; see section B-a , below).
Second, there is an unexpectedly large effect of molecular weightin linear polymers such as poly(methyl methacrylate) and poly(vinylchloride) (72,74,76); in fact, it was shown that da/dN varies with theterm e(exp)I/M. Values of Kc also depend strongly on M, rising sharplyas M exceeds the critical value required for chain entanglements tobecome effective, and levelling of• more or less asymptotically at highervalues of M - say, the order of 10 . However, even though M is in thenearly asymptotic range, the FCP rate at a given AK still dependsstrongly on M. Hence a strong specific effect of fatigue per se exists -an effect attributed to a disentanglement of chains due to cyclicloading. The higher the average molecular weight, the greater theresistance to fatigue; a high-molecular-weight tail in a broad distributionalso gives, for the same average M, enhanced fatigue resistance (75).
Third, the l transition appears to play a role not only instrength phenomena such as yielding but also in FCP and its sensitivityto frequency. Thus FCP is highest at the temperature and frequencycorresponding to the 0 transition (74), and the greater the sensitivityof FCP rate (at a given AK) to frequency - the rate being reduced by anincrease in frequency.
Fourth, it has been abundantly clear that crazing in advance ofthe crack tip is a nearly universal phenomena in fatigue as well as instatic crack growth. Under some conditions (72) the crazegrows incrementally with each cycle, and the crack then strikes through,yielding one striation per cycle on the fracture surface. Under otherconditions, the craze may grow for many cycles before the crack strikesthrough, yielding one striation for many cycles (so-called "discontinuousgrowth bands"). While precise explanations of the role of structure incraze formation do not yet exist, it seems likely that stable crazes,and hence a degree of crack growth resistance, require the presence ofeven a small proportion of high molecular weight material (78). Littleis known yet about crazing in epoxies in general (15), and nothingabout crazing and fatigue. It does seem likely that crazing will tend tobe suppressed by tightly crosslinked networks. In any case, fracturesurface morphology ("fractography") can help in elucidating the micro-mechanisms of failure (77).
70

Finally, relatively little has been published on fatigue inmonolithic epoxy resins. Schrager (79) has noted increases in the shearmodulus and dissipation factor in an epoxy resin; a similar effect hasbeen noted by Outwater and Murphy (64). It was suggested that cyclingmay have enhanced the degree of cure. Outwater and Murphy also foundthat da/dN was a linear function of AK. Sutton (63) described FCP in a"representative commercial epoxy-resin" cured with tetraethylenepentamine, and also found that equation 25and a variant which takesaccount of mean stress held very well. The response was quite sensitiveto mean stress; with da/dN at constant AK increasing by two orders ofmagnitude for a 5-fold change in load ratio (Kmin/Kmax from 0.1 to 0.5).Tomkins and Biggs (80) suggested that FCP in a brittle epoxy resin isdominated by crack branching - a phenomenon possibly related to crazing.
In any case, epoxy resins tend to behave like brittle solids infatigue, exhibiting low values of AKmax, high values of the slope ofthe da/dN - AK curve ("40) at room temperature, and a strong sensitivityto mean stress.
B. Experimental Details, Results and Discussion
a. Experimental Details
Fatigue test specimens used were cast sheets (see section VI-B)1/4-in (0.635 cm) x 3-in (7.62 cm) x 3-in (7.62 cm) in dimensions.Such specimens are commonly referred to as "compact tension" specimens.A 1/4-in'(0.635 cm) notch was first cut into the edge usinga saw; a vee was then cut using a fine jeweller's saw. Specimens weremounted using pin grips.
To start the crack, a sharp razor blade was drawn across the tipof the vee, and cycling was then begun at a low load. The load wasgradually increased until the crack was observed to begin growing. Thisprocedure was satisfactory for all specimens except those having 1:1stoichiometry, though great care was necessary since only a slightincrease in load sufficed to induce catastrophic rupture.
For the 1:1-stoichiometry specimens, the above procedure provedto be ineffective, and stable cracks could not be grown. However, itwas found that stable crack growth could be induced by rubbing therazor blade to the vee while the specimen was being cycled. In this way,a crack could be initiated with considerable delicacy. Discovery ofthis procedure constitutes a significant advance in dealing withspecimens such as brittle epoxies. The technique also works with otherpolymers which are prone to fail before a stable crack can be induced,and may well open up the possibility of studying refractory materialswhich are otherwise most difficult to handle.
71

For compact tension specimens, AK is given by (74)
AK = (26)BW
where AP is the load range, B the specimen thickness, W the specimenwidth, a the crack length, and
2 3 4Y = 29.6 - 185.5(a/w) + 655.7(a/w) - 1017(a/w) + 638.9(a/w) . (27)
All fatigue tests were performed on an MTS electrohydraulic closedloop testing machine operated at a test frequency range of 10 Hz andwith the ratio Pm /Pmax=0.1. Crack growth rates were monitored withthe aid of a travelIing microscope in increments of approximately 0.25mm.All fatigue tests were run in laboratory air.
While fractographic examination is planned, pictures have not yetbeen taken. However, by optical microscopy, the fracture surfacesresemble closely those found for polystyrene (81).
b. Fracture Toughness
Data are given in Table 17 for Series A, Series B, and Series Dresins; see also Figures 19 to 22. It is clear that, as expected, Kc is asmooth and nearly linear function of the amine ratio In terms 5of 2fracture energy, we have a range from 1.0x10 4 erg/cm to 4.4x10 erg/cmThus the anticipated brittleness is confirmed. Presumably the effectof excess amine is to enhance ductility, and hence local plasticdeformation and Gc, more than it decreases E. On the other hand, anexcess of epoxy resin has the effect of decreasing K , perhapsby giving branched structures. In comparison, tensiye strength isindependent of stoichiometry in this system (36).
These results are in contrast to those reported by Selby and Miller(17) and Bell (36). As shown in Figure 23, the former found a peak infracture toughness by several "static" techniques; the latter found apeak in impact strength. Since Selby and Miller obtained considerablevariation in the intensity of the peak, and only a slight one in one case,depending on the method of determination, it may be that the disagreementreflects differences in the test methods. Also, testing under impactloading may not necessarily be correlatable with testing in fatigue.
It is interesting to note that, although a statistical comparisonhas not yet been made, there appears to be a tendency for Series B(broad distribution) resins to be somewhat tougher than controls. InSeries D (polyamide-cured), the narrow-distribution resin exhibits asignificantly lower value of Kc than the broader distribution one. Since
72

Table 17. Fracture Toughness and Fatigue Characteristics of Epoxy Resins.
Amine/ a b Slope ofSpecimen Epoxy AKa K c MPaVm da/dN
Ratio Curve
A-7 0.7 0.50 0.58 9.3
A-8 0.8 - - -
A-9 0.9 0.49 0.63 19.3
A-1Oc 1.0 - - -
A-10A 1.0 0.53 0.73 11.1
A-11 1.1 0.58 0.78 7.7
A-14 1.4 0.75 0.93 17.6
A-16 1.6 0.72 0.93 18.3
A-18 1.8 0.79 0.98 19.0
A-20 2.0 0.83 1.07 9.9
D-2 1.0 0.68 1.00 7.9
D-3 1.0 0.68 1.22 7.9
B-I 1.0 0.53 0.72 13.6
B-2 1.0 0.57 0.80 11.6
B-3 1.0 0.57 0.76 15.8
B-4 1.0 0.57 0.78 10.8
B-5c 1.0 0.53 0.72 13.6
a At da/dN = 3 x 10⁻⁴ mm/cyc.
b Calculated from relationship Kc = AKmax/0.9.
c A-10 and B-5 are equivalent; A-10A is similar, but cured
with 99% MDA instead of TONOX.
Epon 825 has a slightly lower Mc than Epon 828, however, resolution ofthis question will require more study.
Finally, in terms of fracture toughness, an equal-stoichiometryepoxy behaves rather like a polystyrene or poly(methyl methacrylate) (68),except for a much higher Tg.
73

1.0
Kc 0.9
ORAK 0.8
0.7
0.6 0
0.5 - A
20
SLOPE
I I I I I p
0.8 1.0 1.2 1.4 1.6 1.8 2.0AMINE/EPOXY RATIO
FIGURE 19. FRICTURE TOUGHNESS, KC, AND FCP PARAMETERSAKR(AK AT 3x10- 4 MM/CYC), AND SLOPE OF THE
DA/DN CURVE AS A FUNCTION OF THE STRESS
INTENSITY FACTOR RANGE, AK, AS FUNCTION OF
STOICHIOMETRY: CIRCLES AND TRIANGLES FOR
SERIES A, OPEN CORRESPONDING TO A-10A;SHADED AREA FOR SERIES B.
74

30
SLOPE 2
10 00 --- 0
Kc
MPAi-
-- -o
0000
AKO
I , , , , I I i p
5x10² 103 5x10 3
'YC (APPARENT)
FIGURE 20. FRACTURE TOUGHNESS, Kc AND FCP PARAMETERS AKe(AK AT3x10 4 MM/CYC), AND SLOPE OF THE DA/DN CURVE AS AFUNCTION OF THE STRESS INTENSITY FACTOR RANGE, AK,AS FUNCTION OF Ic: OPEN CIRCLE AMINE EXCESS INC,SERIES A, CLOSED CIRCLE EPOXY EXCESS, SHADED AREA
FOR SERIES B.75

10-3 -,(-
DA/DN
MM/CYC
10-4 , , 110.5 1.0
AK, MPA/i
FIGURE 21. TYPICAL FCP BEHAVIOR AS A FUNCTION OFAK, SPECIMEN, A-18; F=10 Hz.
76

10-2S oA-7o A-8A A-10* A-10AA A-11o A-14a A-16A A-18O A-20
10-3i
DA/DNMM/CYC
m m/y
10-4
0.1 l.0"AK, MPA-i
FIGURE 22. FCP BEHAVIOR OF SERIES A EPOXY RESINS; F=10 Hz.
77

TOUGHNESS
ARB. UNITS
0.8 1.0 1.2 1.4 1.6 1.8 2'.0
AMINE/EPOXY RATIO
FIGURE 23. FRACTURE TOUGHNESS AND IMPACT STRENGTH (IN
ARBITRARY UNITS) OF EPON 828/MBA EPOXY RESINS
AS A FUNCTION OF AMINE/EPOXY RATIO: 0, DATA
OF SELBY AND MILLER (17) FROM 3 DIFFERENT
MEASUREMENTS OF TOUGHNESS; A, DATA OF BELL
(36) FOR IMPACT STRENGTH.
78

wit
-U
WLJU-
0
Lii
C) L
U-
0
-U
Lu 0
w
CD U-
79

10-2
10-3 _
DA/DNMM/CYC
10-
-- o EPON 828
""-is EPON 825
i0-! ",,
1.0
AK, MPA'M
FIGURE 25. FCP BEHAVIOR OF SERIES D (POLYAMIDE-CURED)
EPOXY RESINS: ONLY THE FIRST AND LAST POINTS
SHOWN; F=10 Hz.
80

c. Fatigue Crack Propagation (FCP)
Several FCP parameters are presented in Table 17 and Figure 20.The behavior itself is illustrated in Figures 21 to 25, inclusive.
First, the data show that, just as Kc did, values of AK (ameasure of the energy to drive a crack at a given velocity) increase asthe amine content increases, at least with Series A. Data for SeriesB fall, within experimental error, on the same curve. In contrast, theSeries D resins are identical in their behavior, except for their Kvalues. This finding is in contrast with the results of Selby and hiller(17) and Bell (36), who found maxima in static K and impact strength,respectively, as a function of amine/epoxy ratio.
in any case, the results are quite self-consistent, anj shouldserve as a standard of reference for future work. Indeed, AKT correlateswell with K - a relationship suggested earlier by Manson and Hertzberg(68). Thus, in -contrast to metals, it was shown that the higher thestatic fracture toughness, K , the greater the value of AK required todrive a fatigue of interest Rere exhibit a similar phenomenon.
It would be interesting to examine the effects of temperature,frequency, and compositional and curing parameters. Perhaps a distri-bution in M at non-sfoichiometric ratios or in the presence of a net-work diluen$ may show enhanced effects. The technique used can probablyalso be adapted to other brittle epoxies.
Also the fracture surface morphology should be helpful in inter-pretory behavior, especially with respect to the micromechanisms offailure, for example, the effect of network structure on crazing relativeto shear response,
The relatively small effects of distribution at equal stoichiometrymay reflect the fact that an absolute increase in M , not just in thebreadth of the distribution, is required to change Seformation behaviorgreatly. Thus, 25 percent of a fraction with n=1 has a major effect onthe properties of the resin based on a diglycidyl ether of bisphenol-A(n=O), but also changes M somewhat.
c
81

SECTION IX
CONCLUSIONS AND RECOMMENDATIONS
A. Model Networks
a. Conclusions
Based on research to date, the following conclusions may be made:
I. Controllable decrosslinking of model networks may be achievedby hydrolyzing deliberately introduced anhydride linkages in copolymersof styrene and ethyl acrylate with acrylic acid anhydride, the latterbeing used as a site for growth of crosslinks of polystyrene or poly(ethyl acrylate). A rapid and convenient technique for hydrolysis wasdiscovered, based on the use of ethylene diamine as a cleaving agentfor the styrene-based polymers, and ammonium hydroxide for the ethylacrylate based systems. After hydrolysis, values of M revert to valuesin good agreement with values found for the uncrosslin~ed polymers.Reasonable agreement may be obtained between results based on swellingtechniques and the measurement of rubbery modulus, as long as allowanceis made for the contribution of physical entanglements.
2. In conjunction with hydrolyzable crosslinks, permanent cross-links may be introduced by copolymerization of diethyleneglycol dimetha-crylate along with acrylic acid anhydride and ethyl acrylate. Use of a chaintransfer agent, 1-Doth, prevents parasitic crosslinking reactions.
3. Creep and stress relaxation behavior of the ethyl acrylatesystems reflects the network characteristics as determined by the cross-link density prior to hydrolysis, and by the ratio of hydrolyzable to per-manent cross I inks.
4. Thus the systems mentioned should be useful in preparingnetworks with variable network structures.
5. Preparation of Bamford-type networks for control of the dis-tribution of M appears to be not as easy as expected. In particular,synthesis of te mixed anhydride of trichloroacetic acid and acrylicacid has posed considerable difficulty, and optimum reaction conditionshave not yet been found. However, a crude product, expected to containthe desired anhydride, has been obtained by the use of pyridine withacryloyl chloride and trichloroacetic acid. Problems appear to lie inthe heterogeneity of the reaction system, and in removal of the pyridi-nium hydrochloride by-product.
82

b. Recommendations for Further Work
The following recommendations for continued research are made:
I. Since the mixed anhydride would be an ideal comonomer forstyrene to give controllable networks, synthetic studies should be con-tinued in an attempt to purify the present crude product, and to findan optimum solvent and HCI-acceptor.
2. Specifically, other solvents such as.styrene or carbon tetra-chloride should be tried, as well as different temperatures, and the useof aqueous trisodium phosphate as an HCI-acceptor.
3. Other methods such as the possibility of an anhydrideinterchange reaction should be explored.
4. In any case, the Bamford synthesis itself should be developed,even without the incorporation of hydrolyzable crosslinks, for it stilloffers the possibility of making networks with controlled variations incrosslink characteristics.
5. Also, the polystyrene system with hydrolyzable crosslinksshould be pursued, and the viscoelastic behavior examined as a functionof hydrolysis, partial hydrolysis giving dangling chain ends.
B. Epoxy Networks
a. Conclusions
Based on research so far, the following conclusions maybe made:
I. Satisfactory experimental techniques have been developed forthe synthesis of bisphenol-A-epoxy/MDA and bisphenol-A,-epoxy/polyamideresins with the following variations in crosslinking: variable M (by
Cchanging stoichiometry or molecular weight of the epoxy); and variabledistribution of M (by blending epoxies of different molecular weights).Attainment of essentially complete curing has been demonstrated.
2. Standard techniques-have been used to determine the following:stress-strain behavior; viscoelastic response (using the Rheovibron elasto-viscometer); stress relaxation; swelling; response to differential scanningcalorimetry;.and morphology (using high-resolution electron microscopy byreplica and transmission techniques, and scanning electron microscopy).Also, a standard fatigue fracture technique was successfully modified toconveniently determine the quasi-static fracture toughness and fatiguecrack propagation rates as a function of stress intensity factor rangeand any other fatigue variables of interest.
3. Thus a precise baseline of viscoelastic and fracture response
has been established for use in comparing the effects of any desired
83

variation in composition or network structure.
4. The viscoelastic response is a well-behaved function of M .Various viscoelastic parameters depend in a quite regular fashion onM whether a given value of M is achieved by changing stoichiometry orcby changing the molecular weibht of the epoxy--the latter correlation
being apparently new. As the degree of crosslinking is increased thefollowing parameters are increased in conformity with expectation: T(or Ta), T , the rubbery modulus, and the breadth of the a and 0 gtransitionR. However, the absolute values of T are higher than reportedby others using similar curing conditions. Thegfollowing parameters aredecreased by increasing crosslinking: the magnitude of tan 6 at itsmaximum value near T ; and the slope of the modulus-temperature curve atT . In the case of ?he transition slope, the relationship depends onw~ether or not the amine or epoxy is in excess. With the broad-M -distribution specimens studied so far, the distribution breadth appearsto have little effect on the viscoelastic parameters, perhaps becauseof insufficient breadth.
5. The swelling ratio and the soluble fraction are decreasedby increased crosslinking, as expected, though results are more variablethan the viscoelastic results. Swelling and solubility appear to behigher, the broader the distribution of M
c
6. Stress relaxation is, as expected, inhibited by crosslinkingwith no relaxation at 1500C for equal-stoichiometry resins but some foramine-rich specimens, after 4000 sec.
7. In contrast to results reported by others, fracture toughness,K , is a smooth, linear function of the amine/epoxy ratio from less-than-to greater-than-stoichiometric amine contents. All specimens are quitebrittle, with values of K ranging from about 1.1 (excess of amine)to 0.6 (excess of epoxy) RPar4. The stress intensity factor range, AK,required to drive a crack at constant velocity under cyclic loadingbehaves in a generally similar fashion, while the slope of the curves of crackgrowth rate per cycle vs AK also appears to be independent of the stoichiometryrange of excess amine. (FCP behavior does not appear to have been de-scribed before as a function of composition.) Broad-M -distributionspecimens, at a constant average Mc show a tendency to have slightlyhigher values of Kc and AK.
8. Preliminary high-resolution electron microscopy reveals avariety of surface features in the resins after etching and replication,while scanning and transmission electron microscopy has not yet con-firmed the existence of such features. The question of whether or not atwo-phase morphology exists is not yet resolved. Inspection of fracturesurfaces by optical microscopy revealed considerable variation in theextent of plastic deformation, depending on the stoichiometry and AKlevel; definite conclusions about the relationships will require furtherwork.
84

b. Recommendations for Further Work
The following recommendations for continued research are made:
I. The following work should be completed on a suitable range ofspecimens made to date: determination of stress-strain behavior at highand low strain rates; determination of stress relaxation master curves topredict behavior at long times; measurements of fracture toughness andfatigue crack propagation characteristics; and determination of themorphology in bulk and on fracture surfaces.
2. Preparation of specimens including the following variationsin crosslinking and network parameters should be completed: temperatureof cure, presence of network diluents such as solvents, and greatervariations in the distribution of molecular weight (and hence M ) inthe epoxy components. Narrow-distribution resins should be obtained, if possible.
3. Characterization of these specimens should be performed asfollows: viscoelastic, stress-strain, stress relaxation and fracturebehavior; and state of cure by chemical or instrumental analysis, orswelling. Prepolymers should be characterized by gel chromatography.
4. If time and budget permits, exploratory measurements ofviscoelastic response and fracture behavior should be made on specimensof an appropriate epoxy having an even higher T than those examinedto date. g
5. Correlations of all behavior should be made, and the effectsof network structure interpreted in terms of the best available networktheories.
85

APPENDIX
LIST OF SPECIAL CHEMICAL STRUCTURES AND ABBREVIATIONS
A. Model Networks: Chemical Structures
Material Structure Symbol
Mixed anhydride 0 0of acrylic acid IT ,,and trichloro- Cl 3C-C-0-C-CH=CH2 TCAAAMAacetic acid
Acrylic acid 0 0,
anhydride CH2 =CH-C-O-C-CH=CH2 AAA
Tetraethylene- CH3 0 0 CH3glycol dimetha- C 0 0 C
crylate CH2 =C -C.O-CH 2 CH2- 40-C-C =CH2 TEGDM
B. Epoxy Networks: Chemical Structures
Material Structure Symbol
Methylene diani-line (p, p'-di- - CH MDAaminodiphenyl- H2 N OH2 NH2methane)
Epoxy prepoly- (See section VI-A) **Epon 825, etc.Sme r*
Polyamide V-115, V-140(Versamid)
* Used in this study; other resins may have other general structures."**Registered trade-mark.
87

SECTION X
REFERENCES
I. L. E. Nielsen, "Mechanical Properties of Polymers and Composites",Vol. I, Marcel Dekker, Inc., New York, 1974.
2. L. E. Nielsen, "Crosslinking-Effect on Physical Properties of Polymers",Monsanto/Washington University/ONR/ARPA Association, Report HPC-68-57,May, 1968; J. Macromol. Sci.-Rev. Macromol. Chem., C3 (I), 69 (1969).
3. "Aerospace Structural Adhesives", report of the National MaterialsAdvisory Board, Publication NMAB 300, National Academy of Sciences/National Academy of Engineering, DOD contract no. MDA-903-74-C-0167,July 1974.
4. C. H. Bamford and G. C. Eastmond, "Synthesis, Morphology and Propertiesof AB Crosslinked Copolymers", in "Recent Advances in Polymer Blends,Blocks and Grafts", Ed. by L. H. Sperling, Plenum, 1974.
5. J. K. Gillham, J. A. Benci, and A. Noshay, "Isothermal Transitionsof a Thermosetting System", J. Appl. Polym. Sci., 18, 951 (1974).
6. T. Murayama and J. P. Bell, "Relation Between the Network Structureand Dynamic Mechanical Properties of a Typical Amine-cured EpoxyPolymer", J. Polym. Sci.-A2, 8, 437 (1970).
7. D. A. Whiting and D. E. Kline, "Effect of Stoichiometric Concentra-tion of Hardener and Percentage Styrene Oxide on the Crosslinkingand Mechanical Properties of an Epoxy Resin Cured with DEAPA", J.Appl. Polym. Sci. 18, 1043-52 (1974).
8. A. S. Kenyon and L. E. Nielsen, "Characterization of NetworkStructure of Epoxy Resins by Dynamic Mechanical and Liquid SwellingTests", J. Macromol. Sci.-Chem., A3(2), 275 (1969).
9. D. H. Solomon and J. J. Hopwood, "Molecular Weight Distribution inAlkyd Resins, Ill. Presence of Microgel in Alkyd Resins", J. Appl.Polym. Sci., 10, 1893 (1966).
10. 0. Delatycki, J. C. Shaw, and J. G. Williams, "ViscoelasticProperties of Epoxy - Diamine Network", J. Polym. Sci.-A2,7, 753-762 (1969).
II. J. P. Bell and W. T. McCarvill, "Surface Interaction Between Aluminumand Epoxy Resin", J. Appl. Polym. Sci. 18, 2243-47 (1974).
88

12. F. R. Dammont and T. K. Kwei, "Dynamic Mechanical Properties ofAromatic, Aliphatic, and Partially Fluorinated Epoxy Resins",Polymer Prepr., 8, 920 (1967).
13. J. L. Kardos, "Interface Modification in Reinforced Plastics",lecture, U. of Utah Conference Series on Adhesion, June, 1974.
14. T. Hirai and D. E. Kline, "Dynamic Mechanical Properties of Non-stoichiometric, Amine-Cured Epoxy Resin", J. Appl. Poly. Sci.,16, 3145-3157 (1972).
15. R. J. Morgan and J. E. O'Neal,"Structural Parameters Affecting theMechanical Properties of Epoxies,"Polymer Prepr., 16(2), 610 (1975).
16. N. Hata, "Viscoelastic Properties of Epoxy Resins. I. Effect ofPrepolymer Structure on Viscoelastic Properties", J. Appl. Polym.Sci., 15, 2371 (1971),
17. K. Selby and L. E. Miller, "Fracture Toughness and Mechanical Behaviorof an Epoxy", J. Mater. Sci., 10, 12-24 (1975).
18. R. G. C. Arridge and J. H. Speake, "Mechanical Relaxation Studies ofthe Cure of Epoxy Resins: I. Measurement of Cure", Polymer, 13 (9)"443 (1972).
19. T. Hirai and D. E. Kline, "Effect of Heat Treatment on DynamicMechanical Properties of Nonstoichiometric, Amine-cured Epoxy Resins",J. Appl. Polym. Sci. 17, 31 (1973).
20. J. N. Sultan and F. J. McGarry, "Effect of Rubber Particle Sizeon Deformation Mechanisms in Glassy Epoxy", Polym. Eng. Sci.,13, I (1973).
21. K. Shibayama, T. Tanaka, and D. H. Solomon, "The Effect of GlycerideComposition on the Mechanical Properties of Alkyd Resin Films",J. Macromol. Sci., A-I, 1531 (1967).
22. R. E. Cuthrell, "Epoxy Polymers II. Macrostructure", J. Appl. Polym.Sci., 12, 1263 (1968).
23. R. E. Cuthrell, "Macrostructure and Environment-influenced SurfaceLayer in Epoxy Polymers", J. Appl. Polym. Sci., II, 949 (1967).
24. P. J. Flory, "Principles of Polymer Chemistry", Cornell UniversityPress, 1953.
25. J. D. Ferry, "Viscoelastic Properties of Polymers", 2nd edition,Wiley, 1970.
89

26. T. L. Smith, "Relations Between Ultimate Tensile Properties ofElastomers and their Structures", Proc. Roy. Soc. (London), 282, 102(1964).
27. F. Bueche and J. C. Halpin, "Fracture of Amorphous Polymeric Solids:Reinforcement", J. Appl. Phys., 35, 3142 (1964).
28. E. H. Andrews, "Fracture in Polymers", American Elsevier, 1968.
29. A. T. DiBenedetto and A. D. Wambach, "The Fracture Toughness ofEpcxy-Glass Bead Composites", Int. J. Polym. Mater., 1, 159 (1972).
30. L. H. Sperling, T. C. P. Lee and A. V. Tobolsky, "ThermodynamicStability of Elastomeric Networks at High Temperatures", J. Appl.Polym. Sci., 10, 1831 (1966).
31. L. H. Sperling and A. V. Tobolsky, "Thermoelastic Properties ofPoly(dimethyl siloxane)and Poly(ethyl acrylate) as a Function ofTemperature", J. Macromol. Chem., I, 799 (1966).
32. L. H. Sperling, E. J. Zaganiaris and A. V. Tobolsky, "Elastomericand Mechanical Properties of Poly-m-carboranylene siloxanes", J.Macromol. Sci.-Chem., Al, 1111 (1967).
33. L. H. Sperling and A. V. Tobolsky, "Network Relaxation Propertiesof Crosslinked Poly(ethyl acrylate) and Polydimethylsiloxane",J. Polym. Sci., Part A-2: 6, 259 (1968).
34. A. Guinier and G. Fournet, "Small Angle Scattering of X-rays",Wiley, 1955.
35. W. R. Krigbaum and R. G. Goodwin, "Direct Measurement of MolecularDimensions in Bulk Polymers", J. Chem. Phys. 43, 4523 (1965).
36. J. P. Bell, "Mechanical Properties of a Glassy Epoxide Polymer:Effect of Molecular Weight Between Crosslinks", J. Appl. Polym.Sci., 14, 1301 (1970).
37. J. P. Bell, "Structure of a Typical Amine-Cured Epoxy Resin",J. Polym. Sci.-A2, 8, 417-437 (1970).
38. C. J. Lin and J. P. Bell, "The Effect of Polymer Network StructureUpon the Bond Strength of Epoxy-Aluminum Joints", J. Appl. Polym.Sci. 16, 1721 (1972).
90

39. J. A. Manson and E. H. Chiu, "Permeation of Liquid Water in aFilled Epoxy Resin", J. Polym. Sci.-Symp. No. 41, 95-108 (1973).
40. J. A. Manson and E. H. Chiu, "Effect of Water on the Behavior ofGlass-bead-filled Epoxy Resin", Polym. Prepr., 14, 469 (1973).
41. R. W. Lenz, "Organic Chemistry of Synthetic High Polymers",Interscience, 1967. (Reviews work by M. Szwarc, et. al.).
42. R. B. Wagner and H. D. Zook, "Synthetic Organic Chemistry", Wiley,New York, 1961, pp. 558-564.
43. J. B. Polza and T. M. Spotswood, "Acetic Propionic Anhydride",J. Am. Chem. Soc., 71, 2938 (1949).
44. C. F. H. Allen, et al., "Acid Anhydrides", Organic Syntheses, 26,pp. 1-3, (1946).
45. Quotation from Polysciences, Inc., Warrington, Pa.
46. Private Communication, W. E. Broxterman, Dow Chemical Company,July 2, 1975.
47. "Polymer Handbook", ed. by J. Brandrup and E. H. Immergut,Interscience, New York, 1966.
48. V. Huelck, D. A. Thomas and L. H. Sperling, "Interpenetrating PolymerNetworks of Poly(ethyl acrylate) and Poly(styrene-eo-methyl methacrylate).I. Morphology via Electron Microscope", Macromol., 5, 340 (1972).
49. P. J. Flory and J. Rehner, "Statistical Mechanics of Crosslinked PolymerNetworks. I, Rubberlike Elasticity", J. Chem. Phys., II, 512 (1943).
50. ASTM Standards, American Society for Testing Materials, Philadelphia,Pa. 1958, ASTM D 1053-58T.
51. ASTM D-1043, American Society for Testing Materials, Philadelphia,Pa., 1974.
52. R. F. Clash, Jr. and R. M. Berg, "Vinyl Elastomers. Low TemperatureFlexibility Behavior", Ind. Eng. Chem., 34, 1218 (1942); ASTM D 1043-51.
53. A. V. Tobolsky, "Properties and Structure of Polymers", Wiley, 1960,Chapter 4.
54. R. N. Haward, ed., "The Physics of Glassy Polymers", Applied SciencePublishers, London, 1973, p. 130.
91

55. J. W. Vanderhoff, J. A. Manson, G. W. Poehlein, and H. D. Leidheiser,"Exploratory Development of Improved Water Base Coatings", FinalReport, AFML Contract F3365-73-C5179, January, 1975.
56. K. Neki and P. H. Geil, "Morphology-Property Studies of AmorphousPolycarbonate", J. Macromol. Sci.-Phys., B-8, 295 (1974).
57. Symposium "The Physical Structure of Amorphous State", Amer. Chem.Soc. Meeting, Atlantic City, September, 1974, G. Allen and S. E. B.Petrie, Chairman; see Polym. Prepr., 15 (2), 1-336 (1974).
58. Anon., Technical Literature, The Dow Chemical Company, n. d.
59. H. Lee and K. Neville, "Handbook of Epoxy Resins", McGraw-Hill, 1967.
60. "Epoxy Resins, Chemistry and Technology", Ed. by C. A. May and Y.Tanaka, Marcel Dekker, Inc., New York, 1973.
61. H. Batzer and S. A. Zahir, "STudies in the Molecular Weight Distribu-tion of Epoxide Resins. I. Gel Permeation Chromatography of EpoxideResins", J. Appl. Polym. Sci., 19, 585-620 (1975); "II. ChainBranching in Epoxide Resins", ibid, 19, 601-607 (1975).
62. W. A. Dark, E. C. Conrad, and L. W. Crossman, Jr., "LiquidChromatographic Analysis of Epoxy Resins", J. Chromat., 91,247-260 (1974).
63. S. A. Sutton, "Fatigue Crack Propagation in an Epoxy Polymer",Eng. Frac. Mech., 6, 587 (1974).
64. J. 0. Outwater and M. C. Murphy, "On the Fatigue of Epoxy Resin",26th Annual Tech. Conf., 1971, Reinforced Plastics/Composite Div.,The Society of the Plastics Industry, Inc. Section IOA, p. I.
65. L. J. Broutman and S. K. Gagger, "Fatigue Behavior of Epoxyand Polyester Resins", 27th Annual Tech. Conf., 1972, ReinforcedPlastics/Composite Div., The Society of the Plastics Industry, Inc.,Section 9B, p. I.
66. R. Griffiths and D. G. Holloway, "Fracture Energy of Epoxy ResinMaterials", J. Mater. Sci., 5, 302 (1970).
67. P. S. Theocaris, "Viscoelastic Properties of Epoxy Resins Derivedfrom Creep and Relaxation Tests at Different Temperatures",Rheol. Acta, 2, 92, (1962).
68. J. A. Manson and R. W. Hertzberg, "Fatigue Failure in Polymers",Crit. Rev. Macromol. Sci., I, 433 (1973).
92
69. A. A. Griffith, "The Phenomena of Rupture and Flow in Solids",
Phil. Trans. Roy. Soc. (London), 221, 163 (0921).
70. G. R. Irwin, "Fracture", in Handuch der Physik, VI, 551 (1958).
71. J. W. Daily and L. J. Broutman, "Frequency Effects in the Fatigueof Glass Reinforced Plastics", J. Compos. Mater., 1, 424C 1967).
72. S. L. Kim, M. Skibo, J. A. Manson and R. W. Hertzberg, "Effect ofMolecular Weight on Fatigue Crack Propagation in PMMA", PolymerPrepr., 16 (2), 559 (1975).
73. G. C. Martin and W. W. Gerberich, "Temperature Effects on FatigueCrack Growth in Polycarbonate", J. Mater. Sci., II, 231 (1976).
74. R. W. Hertzberg, J. A. Manson, and M. Skibo, "Frequency Sensitivityof Fatigue Processes in Polymeric Solids", Polym. Eng. Sci., 15,252 (1975).
75. S. L. Kim, M. Skibo, R. W. Hertzberg and J. A. Manson, "Effects ofMolecular Weight and Plasticization on Fatigue Crack Propagation inPolymers", Polym. Prepr, 17 (I), 144 (1976).
76. J. A. Manson, M. Skibo, and R. W. Hertzberg, "Effects of MolecularWeight and Plasticizer on FCP in PVC", to be presented, SecondConference on Poly(Vinyl Chloride), Lyon, France, July, 1976.
77. M. Skibo, R. W. Hertzberg, J. A. Manson, and S. L. Kim, "On theDiscontinuous Nature of Fatigue Crack Propagation in Polymers",accepted, J. Mater. Sci., 1976.
78. S. Wellinghoff and E. Baer, "The Mechanism of Crazing in Polystyrene",J. Macromol. Sci.-Phys., B-11(3), 367 (1975).
79. M. Schrager, "Fatigue as Monitored by the Torsion Pendulum", J. Polym.Sci., Part A-2, 8, 1999-2014 (1970).
80. B. Tomkins and W. D. Biggs, "Low Endurance Fatigue in Metals andPolymers, part 3", J. Mater. Sci., 4, 544 (1969).
81. M. Skibo, R. W. Hertzberg and J. A. Manson, "Fatigue FractureProcesses in Polystyrene", J. Mater. Sci., II, 479 (1976).
93SU. S. GOVERNMENT PRINTING OFFICE: 1976 - 757-001/47