influence of corporate sustainability on share prices of
TRANSCRIPT

INFLUENCE OF CORPORATE SUSTAINABILITY ON SHARE PRICES OF
LISTED COMPANIES IN THE NAIROBI
SECURITIES EXCHANGE
EDWARD MAINA WANJIHIA
A RESEARCH PROJECT SUBMITTED IN PARTIAL
FULFILMENT OF THE REQUIREMENTS FOR THE AWARD OF
A DEGREE OF MASTER OF BUSINESS ADMINISTRATION, SCHOOL
OF BUSINESS, UNIVERSITY OF NAIROBI
2019

ii
DECLARATION
This research project is my original work and has not been presented in any other
University
Signed.........................................................Date..............................................................
EDWARD MAINA WANJIHIA
D61/89380/2016
The research project has been submitted with my approval as the University Supervisor.
Signed.........................................................Date..........................................................
SUPERVISOR: DR ONESMUS MUTUNGA
iii
ACKNOWLEDGEMENT
I am full of praises to the Almighty God for giving me the grace and strength to
complete this research project.
In a unique way I acknowledge the Love, support and encouragement of my wife
Beatrice, my children Mitchell, Ryan and Dylan through this academic period.
My special thanks to my supervisor Dr. Onesmus Mutunga for his untiring academic
and professional advice throughout this journey

iv
DEDICATION
This work is a dedication to my loving mom Joyce Nyambura Wanjihia, my late Dad
Wanjihia Paul Mwangi (who never lived long enough to see this dream) my beloved
wife Beatrice Wangui and our children Mitchell Nyambura Maina, Ryan Wanjihia
Maina and Dylan Kiarie Maina.
v
TABLE OF CONTENTS
DECLARATION.......................................................................................................... ii
ACKNOWLEDGEMENTS ...................................................................................... iii
DEDICATION............................................................................................................. iv
LIST OF TABLES ..................................................................................................... vii
LIST OF FIGURES ................................................................................................. viii
ABBREVIATIONS AND ACRONYMS ................................................................... ix
ABSTRACT .................................................................................................................. x
CHAPTER ONE: INTRODUCTION ........................................................................ 1
1.1 Background to the Study ......................................................................................... 1
1.1.1 Corporate Sustainability .............................................................................. 2
1.2.1 Share Prices of Listed Firms ........................................................................ 3
1.1.2 Corporate Sustainability and Share Pricing in a Securities Exchange ........ 3
1.1.3 Nairobi Securities Exchange ....................................................................... 4
1.2 Research Problem ................................................................................................... 5
1.3 Objectives ............................................................................................................... 6
1.3.1 Specific Objectives ...................................................................................... 6
1.4 Value of the Study .................................................................................................. 7
CHAPTER TWO: LITERATURE REVIEW ........................................................... 8
2.1 Introduction ............................................................................................................. 8
2.2 Theoretical Review ................................................................................................. 8
2.2.1 Resource Based Theory ............................................................................... 8
2.2.2 Ecological Modernization Theory ............................................................... 9
2.2.3 Stakeholder Theory ...................................................................................... 9
2.3 Empirical Review.................................................................................................. 10
2.5 Summary of Literature Review and Research Gap............................................... 13
CHAPTER THREE: RESEARCH METHODOLOGY ........................................ 14
3.1 Introduction ........................................................................................................... 15
3.2 Research Design.................................................................................................... 15
vi
3.3 Target Population of the Study ............................................................................. 15
3.4 Sample Design and Sample size ........................................................................... 15
3.5 Data Collection Instrument and Procedure ........................................................... 16
3.6 Data Analysis and Presentation ............................................................................ 16
3.7 Operationalization of Variables ............................................................................ 16
3.8 Diagnostic Tests .................................................................................................... 17
CHAPTER FOUR: DATA ANALYSIS, RESULTS AND DISCUSSIONS ......... 17
4.1 Introduction ........................................................................................................... 18
4.2 Response Rate ....................................................................................................... 18
4.3 Data Validity ......................................................................................................... 19
4.3.1 Normality Test ........................................................................................... 19
4.3.2 Test for Heteroscedasticity ........................................................................ 20
4.4 Descriptive Statistics ............................................................................................. 20
4.5 Correlation Analysis ............................................................................................. 21
4.6 Regression Analysis .............................................................................................. 22
4.7 Overall Regression Model of Variable ................................................................. 22
4.8 Discussion of Findings .......................................................................................... 24
CHAPTER FIVE: SUMMARY, CONCLUSION AND RECOMMENDATIONS
...................................................................................................................................... 26
5.1 Introduction ........................................................................................................... 26
5.2 Summary ............................................................................................................... 26
5.3 Conclusion ............................................................................................................ 27
5.4 Recommendations ................................................................................................. 27
5.5 Suggestions for Further Research ......................................................................... 28
REFERENCES ........................................................................................................... 30
APPENDICES ............................................................................................................ 32
APPENDIX I: Categories oflisted firms at the NSE .................................................. 32
APPENDIX 1I: Specific Firms Comprising The NSE Share Index ........................... 33
APPENDIX III: Raw Data ......................................................................................... 35
vii
LIST OF TABLES
Table 4.1: Five Year Average Data for the Companies……………………………20
Table 4.2: Results of Tests of Normality…………………………………………..21
Table 4.3: Breusch-Pagan Test for heteroscedasticity……………………………..22
Table 4.4: Descriptive Statistics for all the Variables…………………...…………22
Table 4.5. Pearson’s Correlation Matrix……………………………………...……24
Table 4.6: Model Summary of Variables………………………………………......25
Table 4.7: ANOVA………………………………………………………………...25
Table 4.8: Model Coefficient………………………………………………….…...26

viii
LIST OF FIGURES
Figure 2.1 Conceptual Framework ......................................................................... 13
ix
ABBREVIATIONS AND ACRONYMS
ASEA African Stock Exchanges Associations
BVPS Book value per share
CSR Corporate social responsibility
DPS Dividend per share
EPS Earnings per share
FTSE Financial Times Stock Exchange
IPO Initial Public offering
KCB Kenya commercial bank KCB
MPS Market Price per Share
NASI The NSE all-share Index
NSE Nairobi Securities Exchange
ROI Return on investment

x
ABSTRACT
The intense corporate competition coupled with increased investor awareness and focus
on ethical and environmental good has permeated the financial and capital markets in
the last three decades. Corporate sustainability focuses on increasing a firm’s survival
into the future by balancing the three objectives of economic, social and environmental
wellbeing. The study sought to determine the effect of corporate sustainability on the
market share price of listed companies on the Nairobi securities exchange broken down
into four specific research objective; to determine economic success effect on share
prices of listed companies, to establish product stewardship’s effect on share prices of
firms, to determine the effect of corporate citizenship on prices of shares of firms and
to examine the environmental stewardship effect on prices of shares. The study adopted
a descriptive survey design in order to have a deeper view into the relationships and the
effects of corporate sustainability on the market share price among firms listed on the
Nairobi securities exchange. Target population comprised all the 64 firms listed on the
NSE categorized into nine groups. The study took a census of all the NSE 20 share
indexed companies. Only secondary data from published sustainability reports,
financial reports from company websites and those obtainable from the CMA were
used. The researcher made use of secondary data collection template. Based on
regression analysis, the study revealed that all the variables were significant in
affecting market share price of the firms. The F statistics was 0.168 at p<0.05, 0.395
and 0.49 respectively at p˂0.05. All variables were used in the final model. The study
was restricted to the assessment of the effect of the corporate sustainability on market
share price. This calls for replication of a study of the same nature in other functional
and related public sector organizations and a comparison made on the dependability of
the findings on service delivery on these public organizations. The study was also
limited by the sample size since only 20 firms were studied. This therefore creates a
need of replication inorder to covet the entire listed firms on the NSE. Based on the
study findings, the researcher recommends an intense adoption and implementation of
sustainability initiaves by firms which would translate to favourable corporate
sustainability and hence influence growth a firm’s Market price per share.

1
CHAPTER ONE
INTRODUCTION
1.1 Background to the Study
The dramatic economic, social and environmental consequences occasioned by
organizations activities have lately invoked the interest of investors and other
stakeholders (IPCC, 2018). Consumers groups, governments and non-governmental
organizations as well as sustainability conscious investors have continually stressed the
need for organizations to adopt sustainability in its tripods- economic, social and
environmental. Sustainability incorporates a firm’s endeavors and commitment to
improve and balance its environmental, social, governance and economic objectives.
Environmental issues, ethics, corporate citizenship, and corporate social responsibility
have emerged as imperative elements in business practice (Huang, Tan & Ding, 2015).
This study was explained by use of three theories namely; the Resource Based Theory
which explains how a firm can nurture resources unique to the firm such as
environmental management systems and audit, corporate citizenship and corporate
social responsibility strategies to influence investors to pay a premium prices for its
shares. Ecological modernization theory explains how continued green innovations in
a firm’s operations can influence public and analysts positive sentiments hence greater
future prospects of good returns. Stakeholder Theory portrays clearly the relevance of
stakeholder involvement and community improvement through corporate social
responsibility and corporate citizenship. Investors will pay premium prices for firms
that uphold ethics, share resources with the community and that which is committed to
improving the welfare of the community (Canzaniello, Hartmann & Fifka, 2017).
This research project outlines the need to recognize the fact that in the current
globalised world, besides economic value based factors, share prices are being
determined by intangibles like environmental responsibility, ethics, corporate
citizenship, and corporate social responsibility, all of which have emerged as imperative
elements in today’s business practice (Huang, Tan & Ding, 2015). At the NSE, the
concept of corporate sustainability reporting is also becoming imperative in informing
investor decision on share price offerings. Investors are increasingly using
2
sustainability factors as primary filters in investment security selection hence, making
it impossible for organizations to survive by simple pursuit of profit alone( Sroufe,
2016).
1.1.1 Corporate Sustainability
Corporate sustainability is the deliberate effort by a firm to balance the tripod objectives
of economic success, conservation of the planet (environmental) and enhancement of
social and governance reputation. The popularization of the new paradigm of business
sustainability in the world emanates from the Bruntland report (1987) and Elkington’s
“Cannibals with Forks: The Triple Bottom Line of 21st Century Business”. (Beske &
Seuring, 2014; Ashby, Liet & Hudson-Smith, 2012).
A business organization can operationalize sustainability through a multiple and
iterative approach of integrating the triple bottom line concepts in a way that is achieves
its desired financial value, ecological and communal prosperity. Green responsible and
conscious organizations will strive towards resource use minimization, closed loop
economies, reduction of supply chain impacts, energy efficient technologies and
renewable energy use (Schaltegger & Burritt, 2014). Still others will pursue waste
prevention and management, natural resource use, environmental control and
restoration as well as cooperation with the public (Maack, 2012).
According to Sarkis, Zhu and Lai (2011), a socially sustainable organization will ensure
that social wealth is responsibly managed comprising of skills, abilities and ambitions
of workers and society based values. As corporate, an organization will increasingly
pursue not only the improvement of capacities of individuals but also the capacity of
the society or the community (Dyllick & Hockerts, 2002. The blended version and the
most agreed upon model of sustainability is Venn diagram which is composed of three
concentric circles representing the links between environmental, social, and
economic dimensions of sustainability. (Giddings, Hopwood, & O’Brien, 2002).
Sustainability is in the diagram is represented in the areas of overlap of the three circles.
3
1.2.1 Share Prices of Listed Firms
In a bourse, an investor may trade in a range of financial assets where share is one. As
in any form of financial asset, investment is guided by the elements of risk and returns
(Al-Qaisi, Tahtamouni & Al-Qudah, 2016). Stock prices in the equity market are
reflective of the imperatives of the commercial health and strength of a listed firm.
Additionally, share prices also apprise the investors on leadership performance and
vision. According to Sharma (2011), prior research is indicative of the fact that
variations in share prices results from varying factors, knowledge of which helps in the
conveyance of prize data to a firms managers. Traditionally, the prices of a share has
always been regarded to be a factor of the value of assets, dividend pay-out, a country’s
gross domestic product (GDP), net asset value, interest rate, political policy regime,
analyst reports and technical influences (Njogu, 2017). Serafeim (2018) has pointed out
that, in modern equity investment, investors are always ready to offer superior prices
for share of companies that have adopted green and social consciousness in their
operations.
1.1.2 Corporate Sustainability and Share Pricing in a Securities Exchange
Today’s corporate arena is being characterized by stiff competition for fast shrinking
natural resources, global warming, climate change, social concerns and explosion of
consumer and investor awareness (Serafeim, 2018). This calls for the adoption of
corporate sustainability. Indeed, the UN, in establishing the Sustainable Development
Goals (SDGs) in 2015 urged all corporate organizations to strive to be informed by
sustainability agenda in making investment decisions, strategies and policies (UN,
2015). The drive for sustainability to inform investment and investor sentiments is
informed by the common agreement that both the economic, environmental and social
wellbeing of man is heavily burdened by business activities (Dam et al., 2014).
The relationship between the triple bottom-line concepts can be conceived from the
multinational giants like WorldCom, Enron and Lehman Brothers that reported super
profits before discovery by investors and stakeholders of their concealed unethical
business activities and hence their downfall (Sarbox, 2002). In the auto-industry,
cheating in the design of emissions technology among Nissan and Volkswagen resulted
in massive share price falling (EPA, 2017; Forbes, 2018). Businesses having robust
ecological, ethical and are administered according to the tenets of fair governance

4
depicts positive investor sentiments and investors associate them with less financial
risk, higher consumer and regulatory ratings and going concern ( True Value Labs,
2018).
General Investment Management (GIM) (2017) observes that the continued provisions
and support of the planet and the people must be aggressively protected by the
businesses and investor sentiments. Negative environmental impacts affect the welfare
of the people and hence directly shorten the life and the value of a firm (GIM, 2017).
Investors will pay premiums for share of firms that actively endeavours to establish
environmental management systems and audit and those with clear social integrity and
accountability systems (True Value Labs, 2017).
In Kenya, two listed firms that have adopted sustainability initiatives are worth noting,
Safaricom Telecoms and Kenya Commercial Bank (KCB) Group. From its IPO in
2008, Safaricom regularly reported falling in average year to year share prices till the
year 2013 when it adopted the Global Compact’s Global Reporting Index (GRI), an
initiative for sustainability.
Since 2014, the firm has reported increasing year-year increase in average share price
increase, topping the highest of over 550% increase in 2017. KCB Group, the largest
bank in Kenya by asset base was a loss making entity until 2014 when it adopted both
the GRI and the equator principle for financial operations.
1.1.3 Nairobi Securities Exchange
Shares trading in Kenya commenced in 1920 purely on the basis of gentlemanly
agreement until 1954 when it was formally registered as a voluntary association of stock
brokers. Its primary responsibilities were to develop securities market and regulation of
stock trading activities in Kenya. In those ages, it adopted telephone operations with
share prices determined through negotiations. By 1975, the NSE had listed 66 firms
spread across East Africa after which NSE has seen a lot of developments including,
setting up of CMA in 1994 as a regulator, adoption of computer-based delivery and
settlement system (DASS), addition of more stock brokers, formation of association of
Kenya stock brokers (AKS) in 1997, the splitting of NSE into three segments
comprising of the investment market, alternate investment market and fixed income

5
securities market. The NSE also joined the African stock exchange association (ASEA).
In terms of trading volumes, NSE is number four in Africa and fifty based on market
capitalization as a percentage of GDP ratios. (NSE Handbook, 2008).
1.2 Research Problem
Globally there is an increasing demand for sustainable investing. This investment
transformation is being fuelled by the need to guarantee an economy of the future which
will be safer, cleaner, and healthier. The push for the change of how firms do business
is being done by an increasing number of investors who are concerned about how they
make their money. This have seen investors getting more concerned about the growing
impact of corruption, climate change and global warming, depletion of global energy
reserves and the accompanying conflict and hence avoid investing in stock of firms
seeking only economic profitability while ignoring environmental and the societal
concerns. (Ochieng, 2018).
In Kenya, NSE share prices have been on the decline, hence challenging organizational
management to think deeply on strategies of implementing corporate sustainability
initiatives as a way of achieving the much needed economic advantage (Njogu, 2017).
Also, there is dearth of literature and research linking the integrated corporate
sustainability practices to listed companies share prices. Studies in Kenya, still links the
traditional economic indicators of earnings dividend, and asset value to share prices of
listed firms. (Njogu, 2010).
Steiner (2012) propounds that, the internalization of corporate sustainability initiatives
by firms’ can lead to vast reduction in costs, waste generation, energy conservation
costs, and an enhancement in productivity and corporate image. In the same note,
Ioannou & Serafeim (2010) and Cheng et al. (2014) Studying among companies in EU
and the USA found that good product stewardship, green practices and innovation,
ethical partnerships, good social rating and accountability brings myriads of benefits
including easy access to financing, positive sentiments and recommendations among
investment analysts

6
Camilleri (2017) looked at corporate citizenship and CSR policies in the USA. Using a
case study, the study found a relationship between corporate citizenship behaviour and
stakeholder and institutional theories. At local level, Njogu (2010) sought to establish
factors influencing stock pricings of shares at the Nairobi bourse after the initial public
offering. The study found that dividend policy and liquidity informs share pricing after
initial public offering. Nderi (2013), Swaleh (2013) and Gichohi (2014) examined
associations between social responsibility commitments and financial disclosure on
share prices among companies participating in the Nairobi bourse. They showed that
social responsibility commitments have greater effects on investor sentiments and
decisions on share pricing.
It is noticeable that, the studies focused only on one dimension of sustainability, solely
focusing on either economic sustainability, environmental and social sustainability all
of which are aspects of corporate sustainability. In Kenya, previous studies have
concentrated more on the traditional value based determinants of share prices while
others have leaned more on corporate social responsibility and has not comprehensively
analysed the influence of the three dimensions of corporate sustainability. Further, these
studies are more than five years old. This provides the gap upon which this study is
based. Therefore this study sought to answer the question “what is the relationship
between corporate sustainability initiatives and share prices of NSE listed firms.
1.3 Objectives
The general objective of the study was to determine influence of corporate
sustainability on share prices of listed firms in Kenya.
1.3.1 Specific Objectives
i. To determine economic success effect on share prices of listed companies.
ii. To establish product stewardship’s effect on share prices of firms.
iii. To determine the effect of corporate citizenship on prices of shares of firms.
iv. To examine the effect of environmental stewardship on prices of shares.
7
1.4 Value of the Study
Corporate sustainability has been recognised as the new paradigm that drives not just
business operations but also investment decisions around risk and returns of equities.
The study stands to be beneficial to all the stakeholders especially policy makers in
drafting policies that ensures that the current generation meets their needs in a
sustainable manner without jeopardizing the ability of future generations to do the
same. These are Policies addressing the environmental, social and economic
sustainability and their reporting for both listed and non-listed firms in Kenya
In practice, policy influencers, investors, investment analysts and business managers
will be able to make informed decision especially in implementation of corporate
sustainability initiatives. It will also inform balancing between the traditional value
based influences of share prices and sustainability factors.
The study stands to contribute immense knowledge and theory by helping make sense
of the complicated relationships that link corporate Sustainability to the price of shares.
This will enable academics and researchers to move from mere exploratory to more
detailed analyses and investigations in the sustainability. As has already been pointed
out, the last five years has seen dearth of literature linking corporate sustainability and
trends in stock prices. This research work also adds to literature that focuses on the
integrated tripods of the new paradigm of sustainability.
8
CHAPTER TWO
LITERATURE REVIEW
2.1 Introduction
This section focuses on theories and literature on economic success, environmental
stewardship, corporate citizenship product stewardship and their linkages with share
prices of Kenyan listed firms. Finally, research gap and chapter summary are
presented.
2.2 Theoretical Review
A critically examinamination of the key theories anchoring the study is presented.
Resource based theory, stakeholder theory and the ecological modernization theory will
be used in specifiying relations between the study variables.
2.2.1 Resource Based Theory
The theory is derived from 20th century works of Recardian and Penrosian economics.
Birger Wernerfelt (1884) originally coined the term "resource-based view". In its view,
the use of resources unique to a firm can lead to the achievement of consistent and
sustainable supernormal returns. (Peters, Hoffsteters & Hoffmann, 2011; Barney,
2001). A highly competitive firm will mint exemplary initiatives and systems like
superior production and operational quality systems, trust and relationship building,
community enrichment, ethics and fair dealing, fair labour practices, environmental
management systems as well as good citizenship (Versei, 2014; Connelly & Slater,
2011). These are believed to build greater corporate value, superior brand, customer
loyalty and positive public and investor sentiments (Serafeim, 2018).
In the proposed study, the theory will be used to help explain how accumulation or lack
of bundle of valuable sustainability resources, competences and capabilities such as
green management systems and strategies, ethics and fair dealing, stakeholder trust and
relationship can inform positive investor or investment analysts’ valuation of company
stocks.

9
2.2.2 Ecological Modernization Theory
Ecological Modernization Theory emanates from the work of Huber, Janicke and
Simonis in the 1980s. In this theory, the authors posit that the continued human
innovation and invention in business should be accompanied with equal effort to ensure
ecological safety and security. EMT, postulates that greater efficiency, economic value
and higher share values would be permeated through new innovations and inventions
in material use, fuel conservation, natural resource use, and the designing of closed loop
economy. EMT has grown to focus on the impact of investment in social schemes how
it relates with a firm’s economic value (Mol, 2002). Spaargaren and Mol (2012)
proposes that because the future of the business is hinged on the welfare of the planet,
investors are therefore called upon to pay premium prices for shares of firms that place
premium on environmental and social responsibility.
In the proposed study, the EMT explains how continued innovation around
environmental preservation, good governance and improved social reputation of a firm
can be eyed by the investors as a platform for share price valuation. That those firms
listed in different bourses and which are keen on environmental and social innovation
will continuously reap value in form of premium price offering by environmentally and
socially conscious investors, investment advisors and analysts.
2.2.3 Stakeholder Theory
Stakeholder theory was first described by Freeman (1984). He defines a stakeholder as
anyone who stands to affect or be affected by business activities either directly or
indirectly in pursuit of organizational goals. The argument of this theory is based on
the need of firms to address the interests of its stakeholders in the pursuit of its goals.
(Benner and Cochran, 1991). In the context of the proposed study, stakeholders are the
investors, the public, and the investment analysts, all whose sentiments would act as
influencers in the determination of the value, competitiveness and survival of a
business. In this regard sustainability requirements, plans and desires of stock market
investors would be key on improving a company’s share prices beyond current
operational period.
10
A business organization can initiate and sustain sustainability through a multiple and
iterative approach of integrating the triple bottom line concepts in a way that is achieves
economic, environmental and social benefits to the entire organization.
2.3 Empirical Review
This part of the study scrutinises the work of different past researchers in the area of
the study concepts of economic success factors, product stewardship, environmental
stewardship, corporate citizenship and and share prices globally.
Narsa (2017) looked at the association of CSR disclosure and stock prices with
customer loyalty as the causal link. He carried out a census study of all the mining firms
in the Indonesia stock exchange from 2008-2014. Only secondary data from yearly and
from sales reports was utilized. As highlighted by the researcher, CSR disclosure
included; availing an assessment of the impacts of the businesses performance on the
environmental and societal dimensions, reporting, and a provision for an information
systems capable of providing a full assessment report on the specific company
capabilities plus effect on sustainability based on its activities. The study findings
presented a positive relationship of CSR disclosure and stock prices.
Dam and Petkova (2014) discussed the effect of commitment to environmental driven
supply chain sustainability and it’s perceived in terms of reward by stock markets and
the effect of such commitments to stock prices. Utilizing sample of 66 firms with fully
internalized environmental supply chain sustainability programs (ESCSP), the
researcher conducted an event study and there after a two-equation Heckman
modelling. The researcher’s findings showed that a sizeable number of the
organizations implementing sustainability programs, were participants in an industry
exchange consortium. Study analysis indicated a significant negative reaction to stock
price on announcement of participation in this ESCSP.
Sebastenialli et al. (2011) studied the links that exist amongst enhanced green
performance and stock prices of publically listed firms. The researcher relied on ISO
14000 environmental management systems and audit for data sourcing. Correlation and
linear multiple regression models were used. There was a revelation of a positive effect
11
of ISO 14000 certification the stock price. On the other hand, Uwuigbe, Olusegun and
Godswill (2012) examined Nigerian stock exchange for the determinants of stock
prices. The researchers used judgmental sampling technique, and a sample of 30 firms
selected. Data used was retrieved from the firm’s yearly reports available from 2006
to 2010. The researcher concluded that not only knowledge of but also the practice and
development of corporate citizenship among listed companies had negative but
significant effect on the market value of stock prices in Nigeria.
Gichohi (2016) using a descriptive research design to test for existing links between
CSR and stock prices of NSE listed companies. The researcher studied the link
connecting CSR and price of stock movement of firms in Kenya. Data was obtained
from financial statement, websites and publications. Secondary data was obtained from
the year 2010 to 2014. The study established a positive but insignificant CSR effect on
stock price movement. Mutwiri (2011) used a descriptive research approach to evaluate
the effects of eco-management systems and audit programs on stock prices of non-
finance institutions trading on the NSE from 2010-2016. The author analysed secondary
data for financial returns extracted from the websites of the firms in the same period of
listing. The study showed that increase in activities like eco-training, eco-audit systems,
life-cycle management and initiation of closed loop system were followed by increased
share prices.
Ratemo (2015) sought to investigate the effects of CSR on stock price determinants at
NSE. Data was collected on a five year period from 2008 – 2012. The researcher used
regression analysis to determine the effect variables on stock prices. The results indicate
in inadequacy of one model in the prediction of stock prices at NSE. In the researcher’s
view, only Equity Bank possessed a model that proved useful in the determination of
stock prices as per the study variables. This also explained the existence of big
differential in the firms stock prices ranging from, a high of Kshs 324.00 and low of
Kshs 11.85.
The seminal works of Spaargaren and Mol, (2012) based on the ecological
modernization theory provides that as firms progress, it important to consider programs
aimed at conservation of the environment. The various programs are the various
12
process, capabilities and strategies such as environmental management systems, audits
and life cycle assessment as proposed by resource based theory (Barney, 2012). These
proposal agrees with Wiengerten and Longoni (2015); Weingerten et al. (2014);
Gimenez et al. (2012); Micheli and Cagno, (2010) who concurred that firms size would
affectinternalization of corporate sustainability which in turn will positively influence
MPS, collaboratively and coordinatively design resources, pursue product or process
certification and pursue common organizational culture types rich in sustainability.
In a bid to explore the supernormal returns accrued by green stock trading companies,
Levi and Newton (2016) through their work “flash of green: are environmentally driven
stock returns sustainable?” Attempted to attribute the effect on market share price
changes to risk. A portfolio of stocks was created using the Trucost data in creation
environmental compliant firms. The researcher thereafter compared the risk-adjusted
yields derived from the two categories comprising of the firms caring for the
environment and those which didn’t.. It was determined that on risk adjusted basis,
environment supporting companies returns yearly outperformed the non-green shares
by a margin of 3.7 percent. The findings indicated a significant although an
economically minute impactin the short term but can have a longer lasting and greater
desirable benefits to drive green returns.
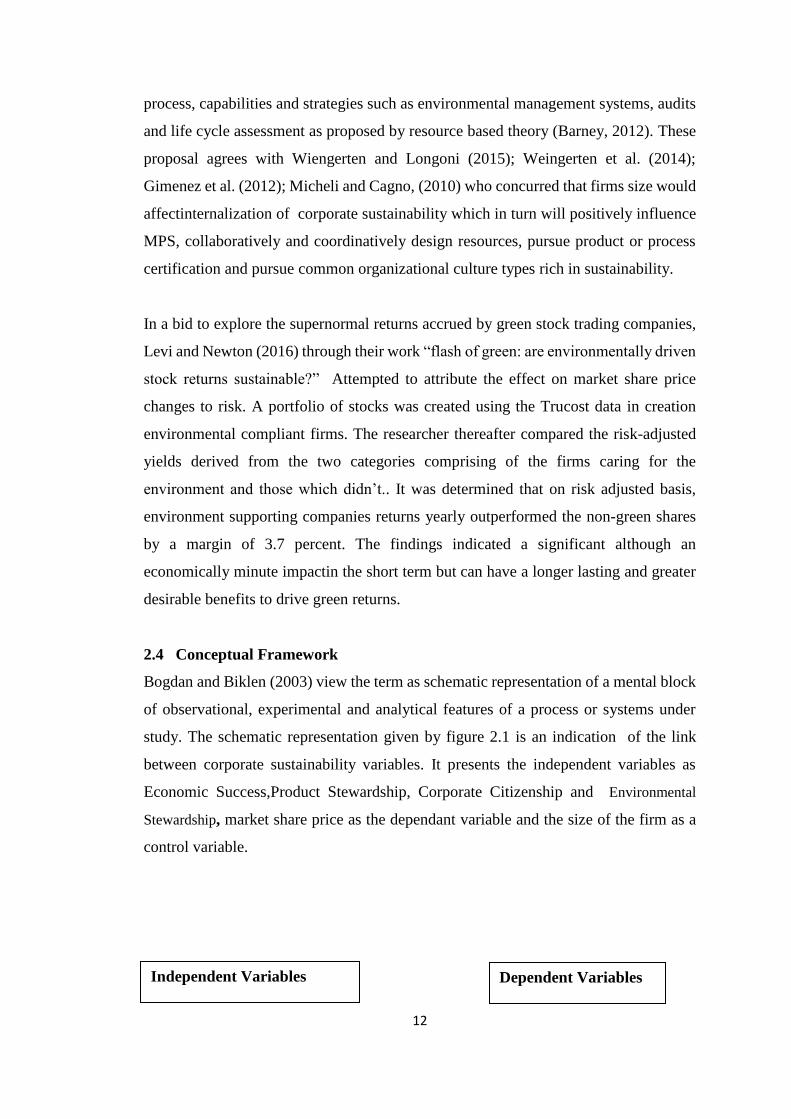
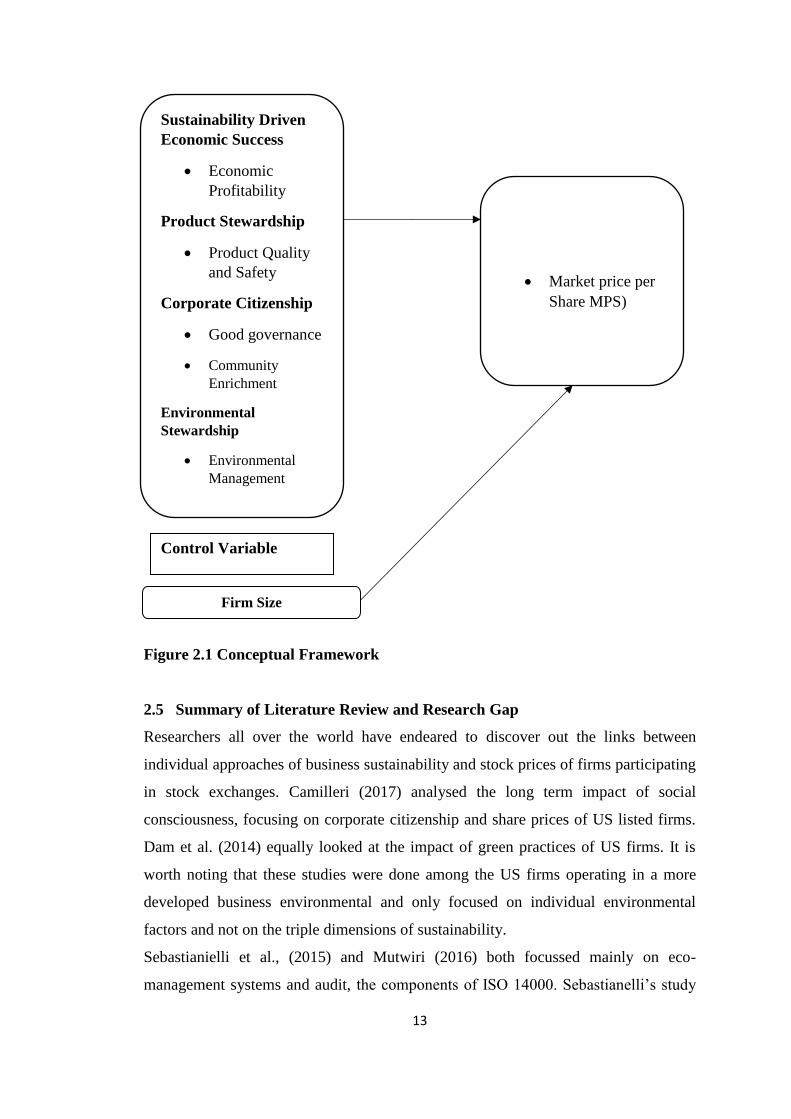
2.4 Conceptual Framework
Bogdan and Biklen (2003) view the term as schematic representation of a mental block
of observational, experimental and analytical features of a process or systems under
study. The schematic representation given by figure 2.1 is an indication of the link
between corporate sustainability variables. It presents the independent variables as
Economic Success,Product Stewardship, Corporate Citizenship and Environmental
Stewardship, market share price as the dependant variable and the size of the firm as a
control variable.
Independent Variables Dependent Variables
13
Figure 2.1 Conceptual Framework
2.5 Summary of Literature Review and Research Gap
Researchers all over the world have endeared to discover out the links between
individual approaches of business sustainability and stock prices of firms participating
in stock exchanges. Camilleri (2017) analysed the long term impact of social
consciousness, focusing on corporate citizenship and share prices of US listed firms.
Dam et al. (2014) equally looked at the impact of green practices of US firms. It is
worth noting that these studies were done among the US firms operating in a more
developed business environmental and only focused on individual environmental
factors and not on the triple dimensions of sustainability.
Sebastianielli et al., (2015) and Mutwiri (2016) both focussed mainly on eco-
management systems and audit, the components of ISO 14000. Sebastianelli’s study
Market price per
Share MPS)
Sustainability Driven
Economic Success
Economic
Profitability
Product Stewardship
Product Quality
and Safety
Corporate Citizenship
Good governance
Community
Enrichment
Environmental
Stewardship
Environmental
Management
Firm Size
Control Variable

14
was done in the US and as with the Mutwiri Study both focused more on the green
sustainability, ignoring the economic and social aspects of corporate sustainability.
Though Ratemo (2015) analysed effect of CSR and corporate citizenship, it did not
look at comprehensively the integrated triple bottom line effect. This ignored other
sectors in the stock market. In summary most of these studies were done in setups and
business environment far different from Kenyan business environment. The studies also
used different methodologies and considered only the individual sustainability
dimensions rather than the known tripods of corporate sustainability
CHAPTER THREE
RESEARCH METHODOLOGY
15
3.1 Introduction
The focal point of this part are the strategies, action plan, processes or design driving
the researcher’s choice of any methods and its justification (Zikmund, Babin, Carr &
Griffin, 2013). The section reviews the study design, Target population, sampling
methodology and frame, methods, data collections tools and procedures, pilot study,
analysis all the way to the presentation of findings.
3.2 Research Design
Here, description of type of study and the outline for obtaining, measuring and
investigating the inherent characteristics of data for the purposes of drawing inferences
is provided (Kerlinger, 2019). According to Kumar (2011), descriptive survey research
design provides the appropriate scheme for obtaining data regarding the existing
position of the object under study. It enables description of "what exists" regarding
measurable quantities or circumstances surrounding variables being studied. The
researcher found the design suitable due to its effectiveness in the facilitation of
collection of dependable data for explaining the association existing between the study
variables (Babbie, 2007).
3.3 Target Population of the Study
This are the whole assortment of objects, organizations, people, artefacts or elements
with similar features upon which a researcher would wish to make conclusion (Kumar,
2011). A unit of observation is a single unit or element within the study population. It
is from where data will be gathered and whose characteristics are representative of the
population (Nassiuma, 2000). The study targeted all the 65 firms participating in the
thirteen categories at the NSE (CMA, 2018). In this study, the unit of observation and
the unit of analysis will be similar which will be each of the individual firms
participating on the NSE as at April, 2018.
3.4 Sample Design and Sample size
Sample design is the overall strategy for collection of study subjects from the study
elements (Sekaran, 2015). It is the procedure for picking of a subsection of subjects
from the entire collection of population elements to facilitate drawing deduction and
16
interpretations from data set. The study took a census of all the NSE 20 share indexed
companies as at April, 2018, which are the most highly performing, stable listings in
the NSE. Most have been listed for more than ten years and have regularly used the
Global Reporting Index and Equator principle initiatives of sustainability reporting.
3.5 Data Collection Instrument and Procedure
This study relied secondary data gathered from published sustainability and financial
reports available in company websites and those obtainable from CMA. A template was
developed with firm numbers on the rows and variable information on the columns to
record the same.
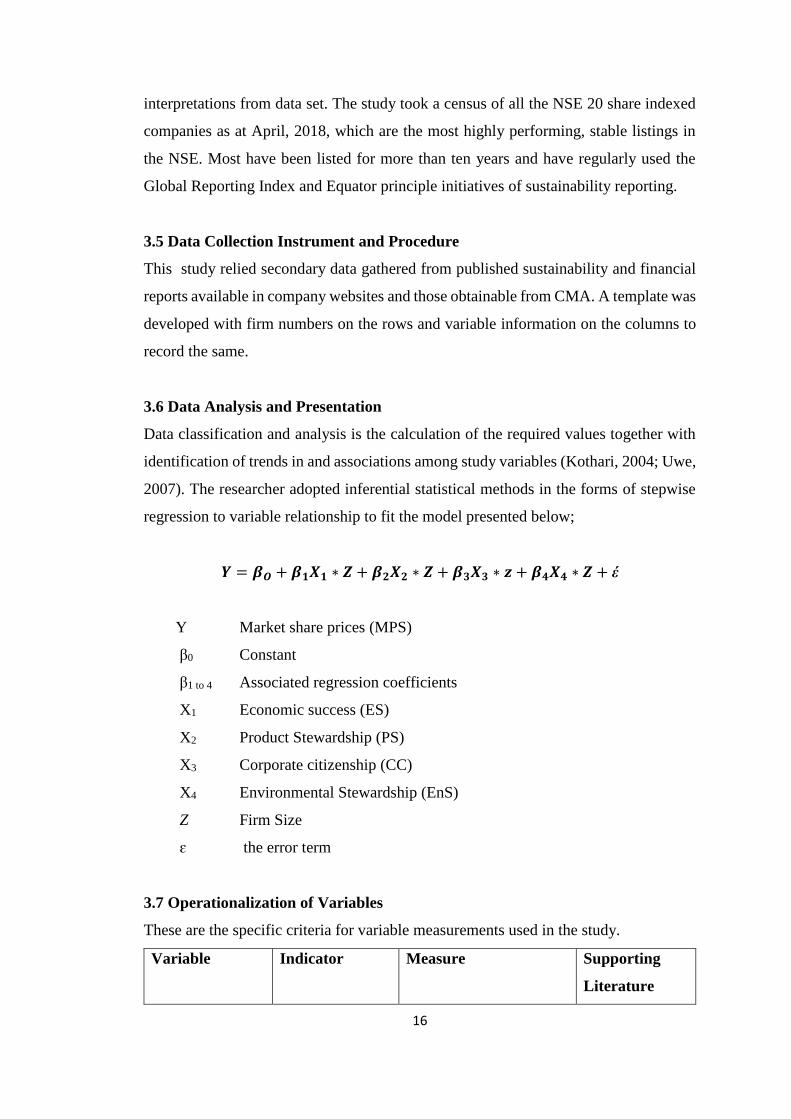
3.6 Data Analysis and Presentation
Data classification and analysis is the calculation of the required values together with
identification of trends in and associations among study variables (Kothari, 2004; Uwe,
2007). The researcher adopted inferential statistical methods in the forms of stepwise
regression to variable relationship to fit the model presented below;
𝒀 = 𝜷𝑶 + 𝜷𝟏𝑿𝟏 ∗ 𝒁 + 𝜷𝟐𝑿𝟐 ∗ 𝒁 + 𝜷𝟑𝑿𝟑 ∗ 𝒛 + 𝜷𝟒𝑿𝟒 ∗ 𝒁 + έ
Y Market share prices (MPS)
β0 Constant
β1 to 4 Associated regression coefficients
X1 Economic success (ES)
X2 Product Stewardship (PS)
X3 Corporate citizenship (CC)
X4 Environmental Stewardship (EnS)
Z Firm Size
ɛ the error term
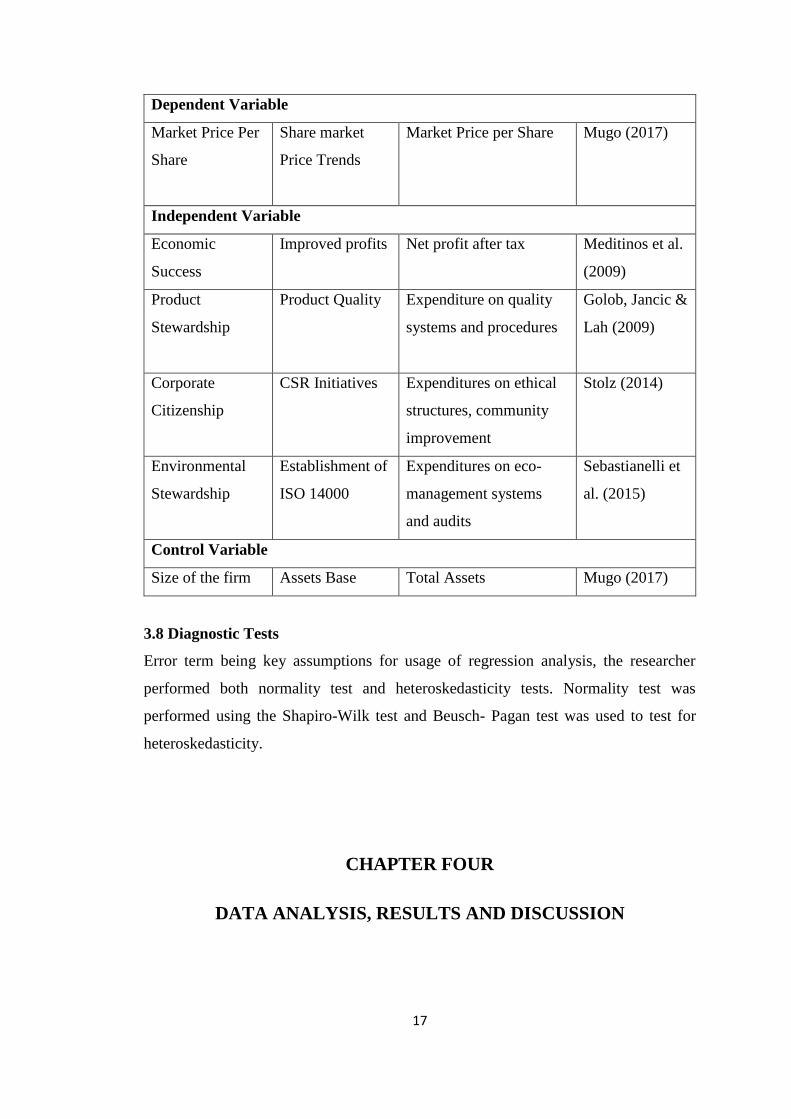
3.7 Operationalization of Variables
These are the specific criteria for variable measurements used in the study.
Variable Indicator Measure Supporting
Literature
17
Dependent Variable
Market Price Per
Share
Share market
Price Trends
Market Price per Share
Mugo (2017)
Independent Variable
Economic
Success
Improved profits Net profit after tax Meditinos et al.
(2009)
Product
Stewardship
Product Quality
Expenditure on quality
systems and procedures
Golob, Jancic &
Lah (2009)
Corporate
Citizenship
CSR Initiatives
Expenditures on ethical
structures, community
improvement
Stolz (2014)
Environmental
Stewardship
Establishment of
ISO 14000
Expenditures on eco-
management systems
and audits
Sebastianelli et
al. (2015)
Control Variable
Size of the firm Assets Base Total Assets Mugo (2017)
3.8 Diagnostic Tests
Error term being key assumptions for usage of regression analysis, the researcher
performed both normality test and heteroskedasticity tests. Normality test was
performed using the Shapiro-Wilk test and Beusch- Pagan test was used to test for
heteroskedasticity.
CHAPTER FOUR
DATA ANALYSIS, RESULTS AND DISCUSSION
18
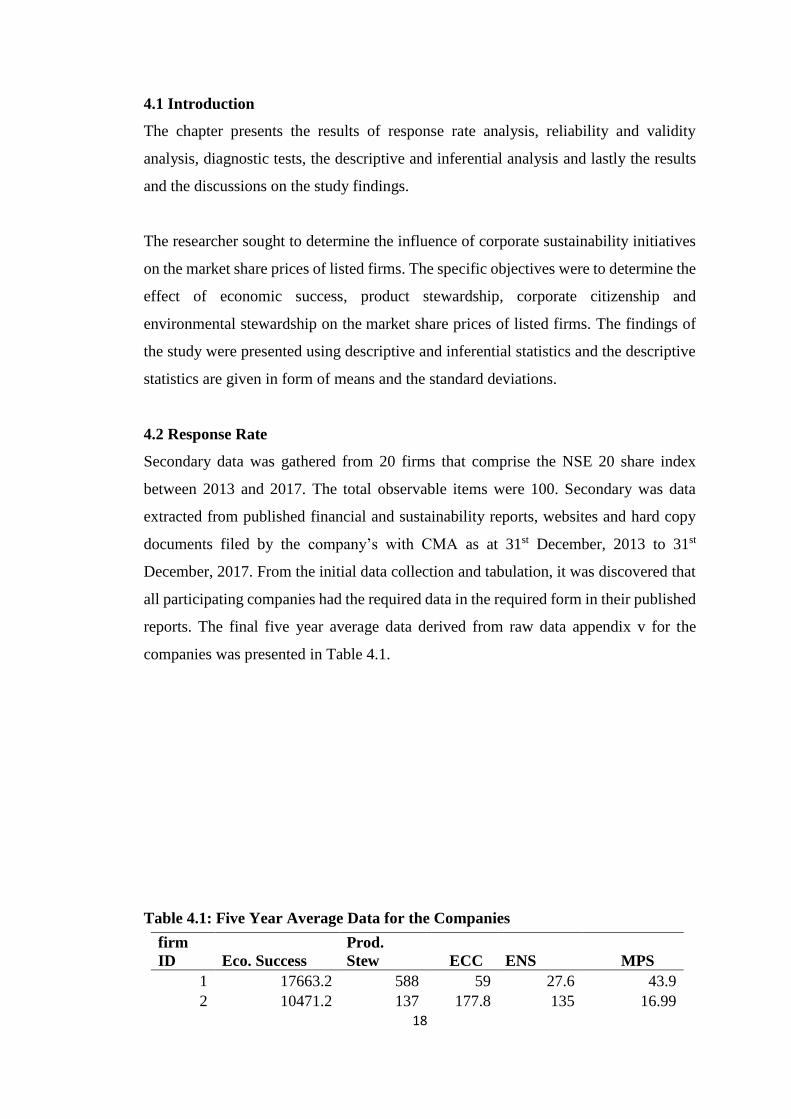
4.1 Introduction
The chapter presents the results of response rate analysis, reliability and validity
analysis, diagnostic tests, the descriptive and inferential analysis and lastly the results
and the discussions on the study findings.
The researcher sought to determine the influence of corporate sustainability initiatives
on the market share prices of listed firms. The specific objectives were to determine the
effect of economic success, product stewardship, corporate citizenship and
environmental stewardship on the market share prices of listed firms. The findings of
the study were presented using descriptive and inferential statistics and the descriptive
statistics are given in form of means and the standard deviations.
4.2 Response Rate
Secondary data was gathered from 20 firms that comprise the NSE 20 share index
between 2013 and 2017. The total observable items were 100. Secondary was data
extracted from published financial and sustainability reports, websites and hard copy
documents filed by the company’s with CMA as at 31st December, 2013 to 31st
December, 2017. From the initial data collection and tabulation, it was discovered that
all participating companies had the required data in the required form in their published
reports. The final five year average data derived from raw data appendix v for the
companies was presented in Table 4.1.
Table 4.1: Five Year Average Data for the Companies
firm
ID Eco. Success
Prod.
Stew ECC
ENS MPS
1 17663.2 588 59 27.6 43.9
2 10471.2 137 177.8 135 16.99
19
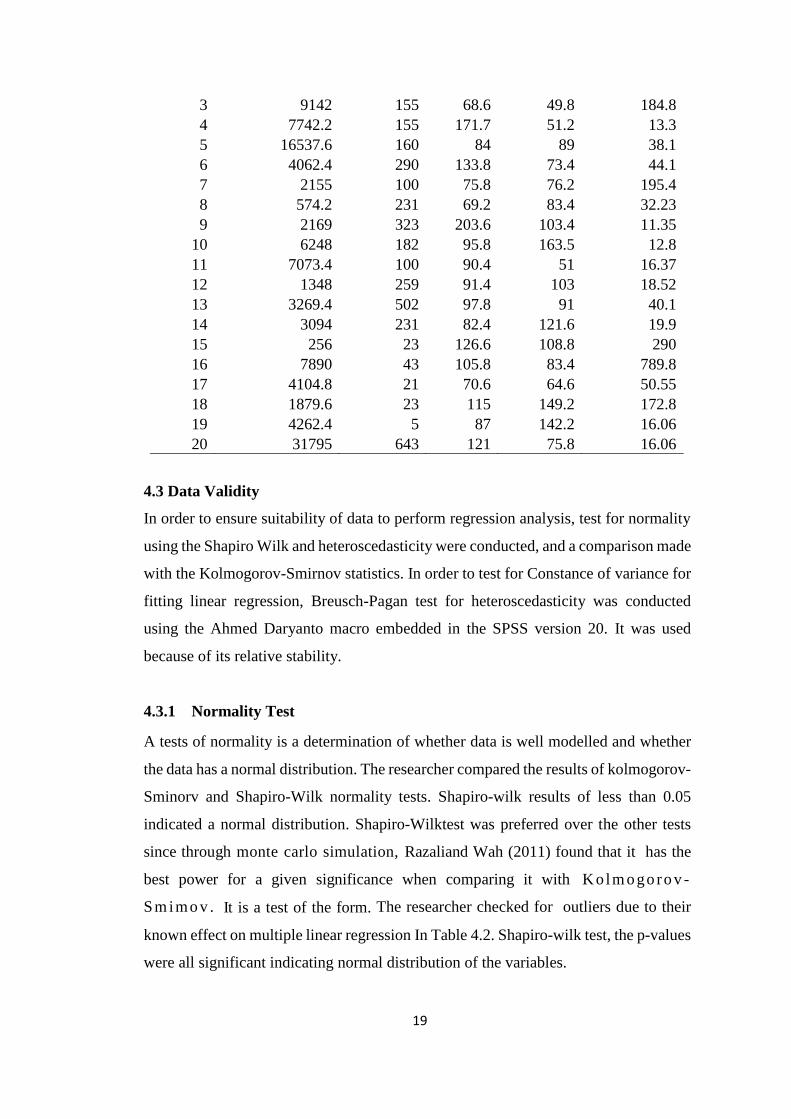
3 9142 155 68.6 49.8 184.8
4 7742.2 155 171.7 51.2 13.3
5 16537.6 160 84 89 38.1
6 4062.4 290 133.8 73.4 44.1
7 2155 100 75.8 76.2 195.4
8 574.2 231 69.2 83.4 32.23
9 2169 323 203.6 103.4 11.35
10 6248 182 95.8 163.5 12.8
11 7073.4 100 90.4 51 16.37
12 1348 259 91.4 103 18.52
13 3269.4 502 97.8 91 40.1
14 3094 231 82.4 121.6 19.9
15 256 23 126.6 108.8 290
16 7890 43 105.8 83.4 789.8
17 4104.8 21 70.6 64.6 50.55
18 1879.6 23 115 149.2 172.8
19 4262.4 5 87 142.2 16.06
20 31795 643 121 75.8 16.06
4.3 Data Validity
In order to ensure suitability of data to perform regression analysis, test for normality
using the Shapiro Wilk and heteroscedasticity were conducted, and a comparison made
with the Kolmogorov-Smirnov statistics. In order to test for Constance of variance for
fitting linear regression, Breusch-Pagan test for heteroscedasticity was conducted
using the Ahmed Daryanto macro embedded in the SPSS version 20. It was used
because of its relative stability.
4.3.1 Normality Test
A tests of normality is a determination of whether data is well modelled and whether
the data has a normal distribution. The researcher compared the results of kolmogorov-
Sminorv and Shapiro-Wilk normality tests. Shapiro-wilk results of less than 0.05
indicated a normal distribution. Shapiro-Wilktest was preferred over the other tests
since through monte carlo simulation, Razaliand Wah (2011) found that it has the
best power for a given significance when comparing it with K o lm o go ro v -
Sm imo v . It is a test of the form. The researcher checked for outliers due to their
known effect on multiple linear regression In Table 4.2. Shapiro-wilk test, the p-values
were all significant indicating normal distribution of the variables.
20
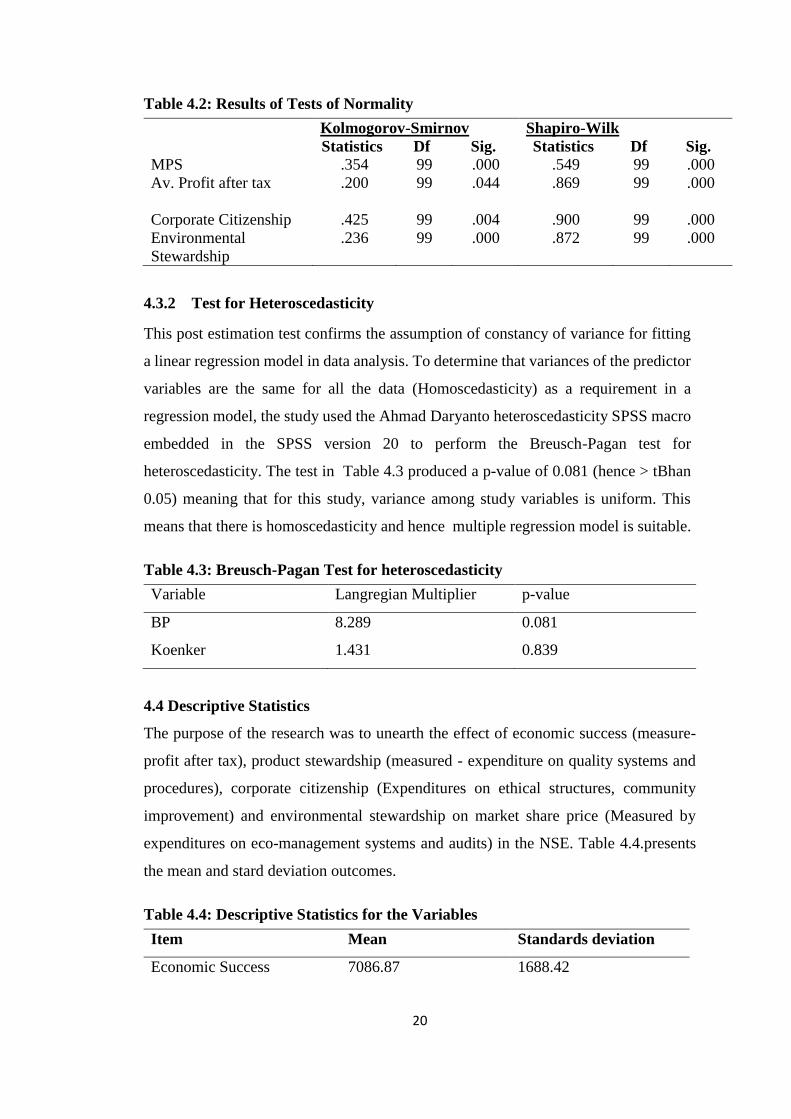
Table 4.2: Results of Tests of Normality
Kolmogorov-Smirnov Shapiro-Wilk
Statistics Df Sig. Statistics Df Sig.
MPS .354 99 .000 .549 99 .000
Av. Profit after tax .200 99 .044 .869 99 .000
Corporate Citizenship .425 99 .004 .900 99 .000
Environmental
Stewardship
.236 99 .000 .872 99 .000
4.3.2 Test for Heteroscedasticity
This post estimation test confirms the assumption of constancy of variance for fitting
a linear regression model in data analysis. To determine that variances of the predictor
variables are the same for all the data (Homoscedasticity) as a requirement in a
regression model, the study used the Ahmad Daryanto heteroscedasticity SPSS macro
embedded in the SPSS version 20 to perform the Breusch-Pagan test for
heteroscedasticity. The test in Table 4.3 produced a p-value of 0.081 (hence > tBhan
0.05) meaning that for this study, variance among study variables is uniform. This
means that there is homoscedasticity and hence multiple regression model is suitable.
Table 4.3: Breusch-Pagan Test for heteroscedasticity
Variable Langregian Multiplier p-value
BP 8.289 0.081
Koenker 1.431 0.839
4.4 Descriptive Statistics
The purpose of the research was to unearth the effect of economic success (measure-
profit after tax), product stewardship (measured - expenditure on quality systems and
procedures), corporate citizenship (Expenditures on ethical structures, community
improvement) and environmental stewardship on market share price (Measured by
expenditures on eco-management systems and audits) in the NSE. Table 4.4.presents
the mean and stard deviation outcomes.
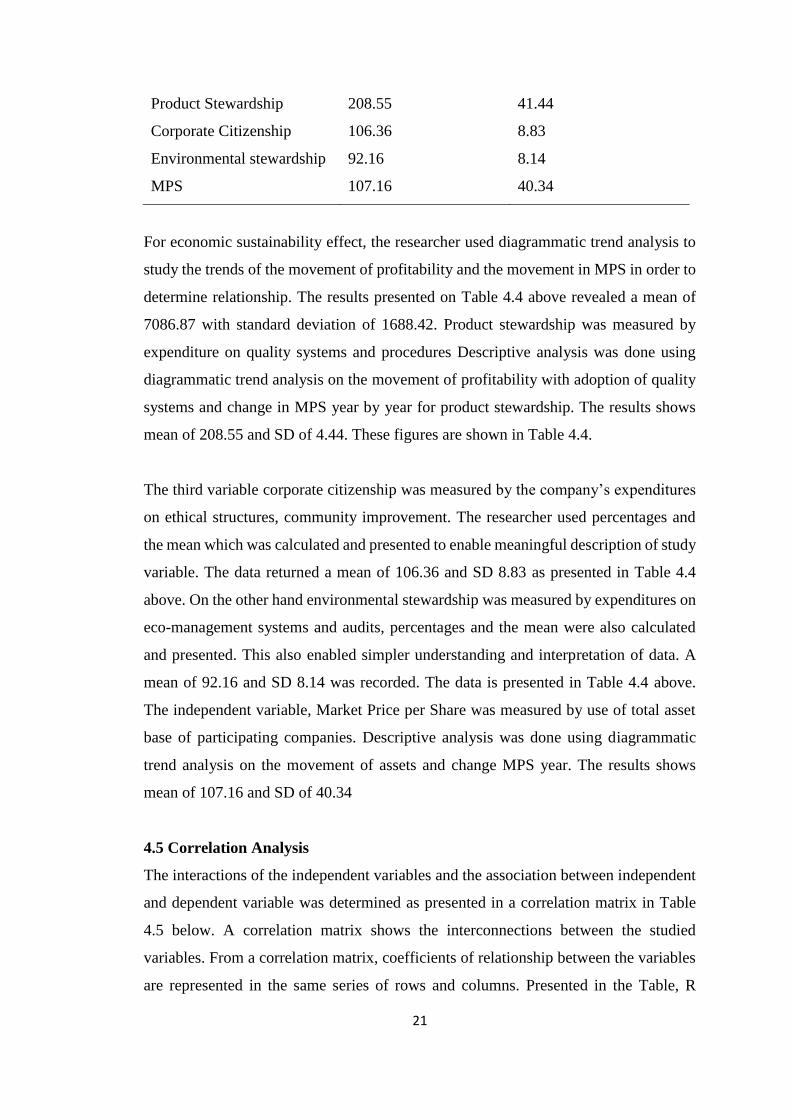
Table 4.4: Descriptive Statistics for the Variables
Item Mean Standards deviation
Economic Success 7086.87 1688.42
21
Product Stewardship 208.55 41.44
Corporate Citizenship 106.36 8.83
Environmental stewardship 92.16 8.14
MPS 107.16 40.34
For economic sustainability effect, the researcher used diagrammatic trend analysis to
study the trends of the movement of profitability and the movement in MPS in order to
determine relationship. The results presented on Table 4.4 above revealed a mean of
7086.87 with standard deviation of 1688.42. Product stewardship was measured by
expenditure on quality systems and procedures Descriptive analysis was done using
diagrammatic trend analysis on the movement of profitability with adoption of quality
systems and change in MPS year by year for product stewardship. The results shows
mean of 208.55 and SD of 4.44. These figures are shown in Table 4.4.
The third variable corporate citizenship was measured by the company’s expenditures
on ethical structures, community improvement. The researcher used percentages and
the mean which was calculated and presented to enable meaningful description of study
variable. The data returned a mean of 106.36 and SD 8.83 as presented in Table 4.4
above. On the other hand environmental stewardship was measured by expenditures on
eco-management systems and audits, percentages and the mean were also calculated
and presented. This also enabled simpler understanding and interpretation of data. A
mean of 92.16 and SD 8.14 was recorded. The data is presented in Table 4.4 above.
The independent variable, Market Price per Share was measured by use of total asset
base of participating companies. Descriptive analysis was done using diagrammatic
trend analysis on the movement of assets and change MPS year. The results shows
mean of 107.16 and SD of 40.34
4.5 Correlation Analysis
The interactions of the independent variables and the association between independent
and dependent variable was determined as presented in a correlation matrix in Table
4.5 below. A correlation matrix shows the interconnections between the studied
variables. From a correlation matrix, coefficients of relationship between the variables
are represented in the same series of rows and columns. Presented in the Table, R
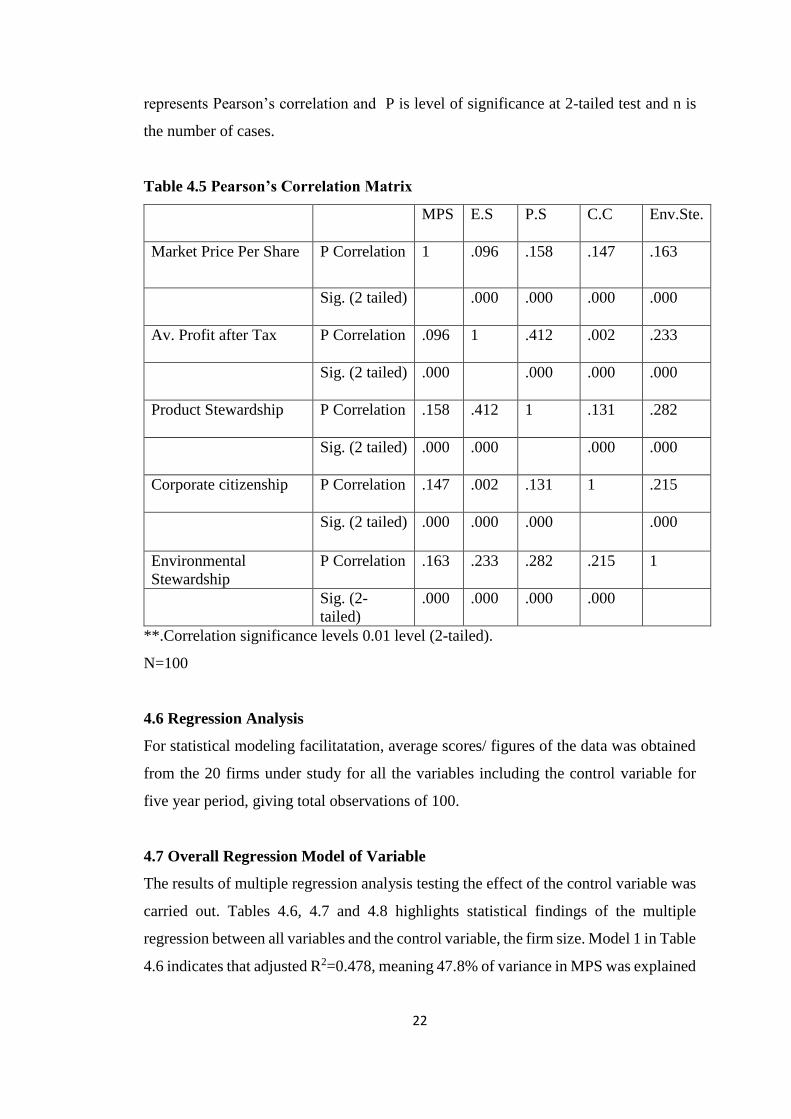
22
represents Pearson’s correlation and P is level of significance at 2-tailed test and n is
the number of cases.
Table 4.5 Pearson’s Correlation Matrix
MPS
E.S
P.S
C.C
Env.Ste.
Market Price Per Share P Correlation 1
.096
.158 .147 .163
Sig. (2 tailed)
.000 .000 .000 .000
Av. Profit after Tax
P Correlation .096
1 .412 .002 .233
Sig. (2 tailed)
.000 .000 .000 .000
Product Stewardship P Correlation .158
.412
1 .131 .282
Sig. (2 tailed)
.000 .000 .000 .000
Corporate citizenship P Correlation .147
.002
.131 1 .215
Sig. (2 tailed)
.000 .000 .000 .000
Environmental
Stewardship
P Correlation .163 .233
.282 .215 1
Sig. (2-
tailed)
.000 .000 .000 .000
**.Correlation significance levels 0.01 level (2-tailed).
N=100
4.6 Regression Analysis
For statistical modeling facilitatation, average scores/ figures of the data was obtained
from the 20 firms under study for all the variables including the control variable for
five year period, giving total observations of 100.
4.7 Overall Regression Model of Variable
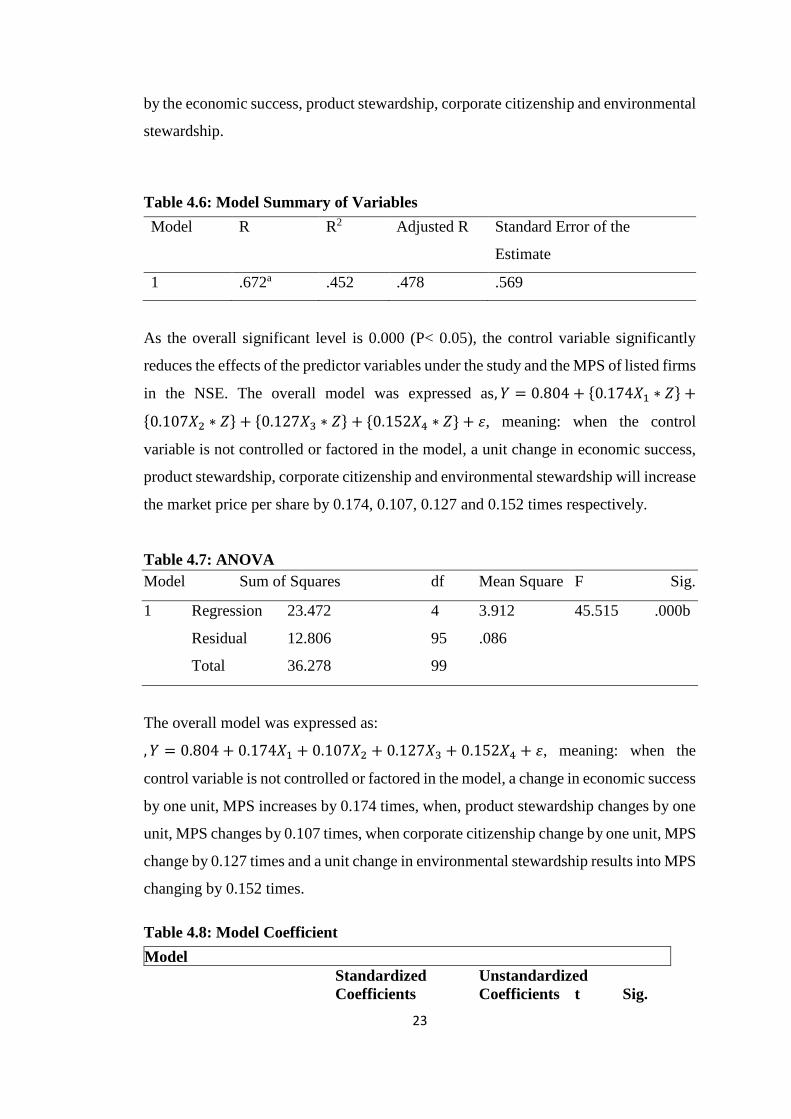
The results of multiple regression analysis testing the effect of the control variable was
carried out. Tables 4.6, 4.7 and 4.8 highlights statistical findings of the multiple
regression between all variables and the control variable, the firm size. Model 1 in Table
4.6 indicates that adjusted R2=0.478, meaning 47.8% of variance in MPS was explained
23
by the economic success, product stewardship, corporate citizenship and environmental
stewardship.
Table 4.6: Model Summary of Variables
Model R R2 Adjusted R Standard Error of the
Estimate
1 .672a .452 .478 .569
As the overall significant level is 0.000 (P< 0.05), the control variable significantly
reduces the effects of the predictor variables under the study and the MPS of listed firms
in the NSE. The overall model was expressed as, 𝑌 = 0.804 + {0.174𝑋1 ∗ 𝑍} +
{0.107𝑋2 ∗ 𝑍} + {0.127𝑋3 ∗ 𝑍} + {0.152𝑋4 ∗ 𝑍} + 𝜀, meaning: when the control
variable is not controlled or factored in the model, a unit change in economic success,
product stewardship, corporate citizenship and environmental stewardship will increase
the market price per share by 0.174, 0.107, 0.127 and 0.152 times respectively.
Table 4.7: ANOVA
Model Sum of Squares df Mean Square F Sig.
1 Regression 23.472 4 3.912 45.515 .000b
Residual 12.806 95 .086
Total 36.278 99
The overall model was expressed as:
, 𝑌 = 0.804 + 0.174𝑋1 + 0.107𝑋2 + 0.127𝑋3 + 0.152𝑋4 + 𝜀, meaning: when the
control variable is not controlled or factored in the model, a change in economic success
by one unit, MPS increases by 0.174 times, when, product stewardship changes by one
unit, MPS changes by 0.107 times, when corporate citizenship change by one unit, MPS
change by 0.127 times and a unit change in environmental stewardship results into MPS
changing by 0.152 times.
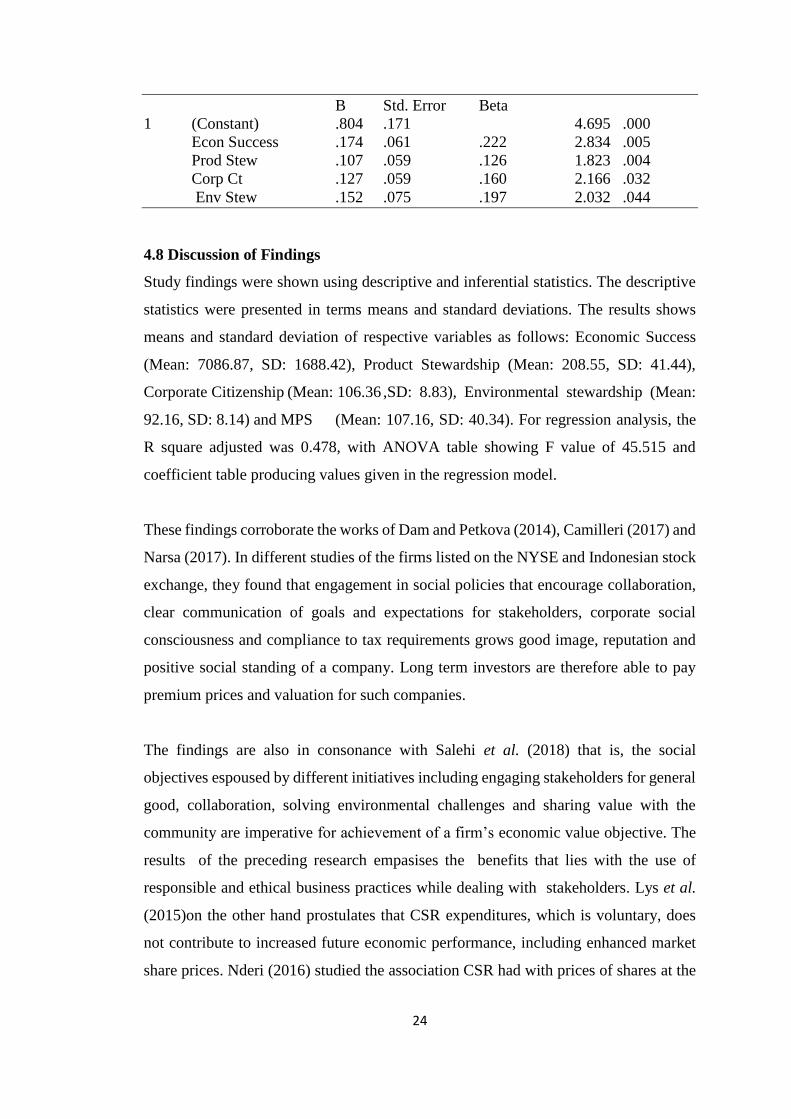
Table 4.8: Model Coefficient
Model
Standardized Unstandardized
Coefficients Coefficients t Sig.
24
B Std. Error Beta
1 (Constant) .804 .171 4.695 .000
Econ Success .174 .061 .222 2.834 .005
Prod Stew .107 .059 .126 1.823 .004
Corp Ct .127 .059 .160 2.166 .032
Env Stew .152 .075 .197 2.032 .044
4.8 Discussion of Findings
Study findings were shown using descriptive and inferential statistics. The descriptive
statistics were presented in terms means and standard deviations. The results shows
means and standard deviation of respective variables as follows: Economic Success
(Mean: 7086.87, SD: 1688.42), Product Stewardship (Mean: 208.55, SD: 41.44),
Corporate Citizenship (Mean: 106.36 ,SD: 8.83), Environmental stewardship (Mean:
92.16, SD: 8.14) and MPS (Mean: 107.16, SD: 40.34). For regression analysis, the
R square adjusted was 0.478, with ANOVA table showing F value of 45.515 and
coefficient table producing values given in the regression model.
These findings corroborate the works of Dam and Petkova (2014), Camilleri (2017) and
Narsa (2017). In different studies of the firms listed on the NYSE and Indonesian stock
exchange, they found that engagement in social policies that encourage collaboration,
clear communication of goals and expectations for stakeholders, corporate social
consciousness and compliance to tax requirements grows good image, reputation and
positive social standing of a company. Long term investors are therefore able to pay
premium prices and valuation for such companies.
The findings are also in consonance with Salehi et al. (2018) that is, the social
objectives espoused by different initiatives including engaging stakeholders for general
good, collaboration, solving environmental challenges and sharing value with the
community are imperative for achievement of a firm’s economic value objective. The
results of the preceding research empasises the benefits that lies with the use of
responsible and ethical business practices while dealing with stakeholders. Lys et al.
(2015)on the other hand prostulates that CSR expenditures, which is voluntary, does
not contribute to increased future economic performance, including enhanced market
share prices. Nderi (2016) studied the association CSR had with prices of shares at the
25
NSE. The researcher studied all 64 firms listed on the bourse; the outcome showed a
positive link between CSR total overheads and shares of listed firms.
The findings agree with those of Mutwiri (2011) and Ratemo (2018). Mutwiri (2011)
used a descriptive research approach to evaluate the effects of eco-management systems
and audit programs on stock prices of non-finance institutions at the NSE from 2010-
2016. The author analysed secondary data for financial returns extracted from the
websites of the firms in the same period of listing. The study showed that increase in
activities like eco-training, eco-audit systems, life-cycle management and initiation of
closed loop system were followed by increased share prices. Ratemo (2018)
investigated the impact of a firm’s social responsibility practices and corporate
citizenship on share price in Kenya. The researcher obtained data in 7 firms under study
based on five year panel data from 2008-2012. Regression analysis of various macro-
economic elements impacting on stock value of the organizations indicated positive
influence on share prices at NSE.
The findings also agree with those of Sebastianelli, Tamimi and Lacocca (2015) who
considered the impact of ecological practices on the S&P 500 indexed firms in the US.
There is a concurrence that Certifications like ISO 14000 confers on firm’s capabilities
and competences such as environmental management and audit systems that are key to
eco-management. Firms that are known to conserve the environment have operational
efficiency and acceptance that goes in increasing share market price. These results
agrees with Wiengerten and Longoni (2015); Weingerten et al. (2014); Gimenez et al.
(2012), all concur that firms size would affect internalization of corporate sustainability
which in turn will positively influence MPS, collaboratively and in a coordinated way
design resources, pursue product or process certification and pursue common
organizational culture types rich in sustainability.
26
CHAPTER FIVE
SUMMARY, CONCLUSION AND RECOMMENDATIONS
5.1 Introduction
Highlighted is the summary, conclusions, recommendations, contribution to knowledge
and the implications of the study findings on management and practice. Finally, gaps
for further future studies are suggested.
5.2 Summary
The principal drive of the study was to determine the influence of corporate
sustainability espoused by economic success, product stewardship, corporate
citizenship and environmental stewardship on the market share price among listed
firms. Audited financial statements, Published annual reports, , reports filed by the
companies with the NSE and published on the NSE website acted as the source of
secondary data. The study used descriptive study as the research design and covered
the period from 2013 to 2017. A census study was done on the 20 constituent of the 20
share index of the Nairobi stock Exchange.
The descriptive statistics were given in form of means and the standard deviations. The
results shows means and standard deviation of respective variables as follows:
Economic Success (Mean: 7086.87, SD: 1688.42), Product Stewardship (Mean:
208.55, SD: 41.44), Corporate Citizenship (Mean: 106.36,SD: 8.83), Environmental
stewardship (Mean: 92.16, SD: 8.14) and MPS (Mean: 107.16, SD: 40.34). For
regression analysis, the R square adjusted was 0.478, with ANOVA table showing F
value of 45.515 and coefficient table producing values given in the regression model.
The overall multiple regression model with the control variable (firm size) produced an
adjusted R2 of 0.478. This implied that all the four variables explained 47.8% on MPS
among listed firms on the NSE. This means that control variable had an improvement
effect on the relationship between the independent variables (Economic success,
product stewardship, corporate citizenship and environmental stewardship) and MPS.

27
5.3 Conclusion
The purpose of the study was to establish the effect of corporate sustainability and
market share price among listed companies on the Nairobi securities exchange. The
study used both descriptive and inferential statistics to try to determine the effects of
independent variables of economic success, product stewardship, corporate citizenship
and environmental stewardship on the market price of shares among listed companies.
A regression model was used to fit the relationship between the variables in the study.
The study concludes that, there was a positive influence of economic success measured
by profit after tax, product stewardship, corporate citizenship and environmental
stewardship, of companies listed on the Nairobi securities exchange. Furthermore, the
variables are key to efficiency which in turn had a significant positive effect on
performance of market share price the listed companies. This implies that the amount
of money expended on corporate sustainability projects significantly explain market
share price of the listed companies. Businesses ought not to incur high expenditures on
corporate sustainability initiatives with the anticipation of enhancing their corporate
market share price.
5.4 Recommendations
With growing concerns over limitation of resources, rise in consciousness of
stakeholders, global warming, and greenhouse gas emissions has created an urgency
for businesses to invest resources in the internalization of corporate sustainability into
their strategies and practices as they engage in stock markets has reached its peak. The
study therefore recommends that listed companies must consider re-designing,
configuring and orienting their key strategies, processes, capabilities, competences and
practices and activities as a way of adding sustainability into their corporate strategy
and operations and to engender positive impact on market share price. These will be
sure ways of positively managing customers and suppliers expectations while also
managing the long-term impact tha come with business operations to the community
and environment. A supply chains relational orientation geared towards long term
collaborative partnership as a capability is recommended towards the broader
implementation and development of sustainability, since the supply chain integration
considers the product from initial processing of raw materials to delivery to the
customer.

28
The study was able to reveal the value of various certification standards in enforcing
various management systems and audits that are key in implementation of economic,
environmental and social sustainability. The study recommends that listed companies
must improve their economic, environmental and social impact and value through
measures such as implementation of ISO 9001 for economic sustainability, ISO 14001
for environmental sustainability and OHSAS 18001 and SA8000 for social
sustainability. ISO 14001 will include systems for measuring the amount of carbon
emissions that the company emits and create goals to encourage reductions.
Standardizations will also help listed companies to be proactive with respect to
governmental regulations and other pressures from stakeholders. The basic objective is
to gain positive impact on MPS
Among listed companies in the NSE, the conclusions of the study demonstrates that
compliance to corporate citizenship and compliance to stakeholder pressure as well as
operations based on stakeholder relationships is a feasible sustainability management
alternative, especially for logistics service providers with multiple and varied
stakeholders. This study recommends that listed companies take time to understand
stakeholder requirement and detail the appropriate approaches to corporate citizenship,
involvement, leadership and visibility that may serve to make a significant contribution
towards achieving green and social objectives.
5.5 Suggestions for Further Research
The present study was carried in the stock exchange market in Kenya, with focus on
the firms listed on the NSE, drawing from the 20 share indexed companies. It is
suggested that a more elaborate study embracing all companies listed in the securities
exchange. Other than the affore-mentioned factors, the study recommends further
studies focussing on factors like firm characteristics, management intentions, perceived
value of sustainability and organizational readiness in manufacturing and government
sectors be undertaken to establish their effect on corporate sustainability
implementation and market share prices of listed companies.
Even though the government through various agencies set regulations regarding
economic, social and environmental performance and operations, there is no empirical
29
evidence that public sector organizations comply with the same regulations. The
findings presented here, can also be tested in the public sector, where due to the nature
of objectives, sustainability issues are still not a priority. For criticalities of
implementation, a thorough examination has only been observed for some of the
identified macro-areas, such as reverse logistics (e.g. Wu and Dunn, 1995), whereas
additional research should be recommended for the others. Focusing on impacts
deriving from adoption, they have been mainly addressed from the viewpoint of the
shippers and considering the entire supply chain. Evaluation and measurement of
environmental performances have only been partially explored and a more holistic
perspective is still missing. In recent years many efforts have been made towards the
measurement and control of company environmental performances.
30
REFERENCES
Ali, J., & Kumar, S. (2011). Information and communication technologies (ICTs) and
farmers’ decision-making across the agricultural supply chain. International
Journal of Information Management, 31(2), 149–159. doi:
10.1016/j.ijinfomgt.2010.07.008
Ashby, A., Leat, M., & Hudson‐Smith, M. (2012). Making connections: a review of
supply chain management and sustainability literature. Supply Chain Management:
An International Journal, 17(5), 497–516. doi: 10.1108/13598541211258573
Beske, P., & Seuring, S. (2014). Putting sustainability into supply chain
management. Supply Chain Management: An International Journal, 19(3), 322–
331. doi: 10.1108/scm-12-2013-0432
Camilleri, M. A. (2017). Corporate citizenship and social responsibility policies in the
United States of America. Sustainability Accounting, Management and Policy
Journal, 8(1), 77–93. doi: 10.1108/sampj-05-2016-0023
Cannibals with forks: the triple bottom line of 21st century business. (1999). Choice
Reviews Online, 36(07). doi: 10.5860/choice.36-3997
Connelly, B. L., Ketchen, D. J., & Slater, S. F. (2010). Toward a “theoretical toolbox”
for sustainability research in marketing. Journal of the Academy of Marketing
Science, 39(1), 86–100. doi: 10.1007/s11747-010-0199-0
Dam, L., & Petkova, B. (2014). The impact of environmental supply chain
sustainability programs on shareholder wealth. International Journal of Operations
& Production Management, 34(5), 586–609. doi: 10.1108/ijopm-10-2012-0482
Dyllick, T., & Hockerts, K. (2002). Beyond the business case for corporate
sustainability. Business Strategy and the Environment, 11(2), 130–141. doi:
10.1002/bse.323
Eleni-Maria, P. (2013). Logistics Service Providers. Outsourcing Management for
Supply Chain Operations and Logistics Service Advances in Logistics, Operations,
and Management Science, 52–77. doi: 10.4018/978-1-4666-2008-7.ch004
Global Reporting Initiative Search. (n.d.). Retrieved from
https://www.globalreporting.org/Search/Pages/default.aspx?k=GRI&start1=1231.
31
Golob, U., Jančič, Z., & Lah, B. M. (2009). Corporate social responsibility and
transparent pricing in the case of the euro changeover. Corporate Communications:
An International Journal, 14(4), 456–469. doi: 10.1108/13563280910998781
Ioannou, I., & Serafeim, G. (2014). The impact of corporate social responsibility on
investment recommendations: Analysts perceptions and shifting institutional
logics. Strategic Management Journal, 36(7), 1053–1081. doi: 10.1002/smj.2268
Isnalita, & Narsa, I. M. (2017). CSR Disclosure, Customer Loyalty, and Firm Values
(Study at Mining Company Listed in Indonesia Stock Exchange). Asian Journal of
Accounting Research, 2(2), 8–14. doi: 10.1108/ajar-2017-02-02-b002
Kothari. (2014). Research methodology methods and techniques. New Delhi: New Age
International.
Kothari, C. R., & Kothari, C. R. (n.d.). Research methodology: methods and
techniques. New Delhi : Wiley, 1985: publisher not identified.
Maditinos, D. I., Šević, Ž., & Theriou, N. G. (2009). Modelling traditional accounting
and modern value‐based performance measures to explain stock market returns in
the Athens Stock Exchange (ASE). Journal of Modelling in Management, 4(3),
182–201. doi: 10.1108/17465660911006431
Mitchell, R. (2008). Resource-Based Theory: Creating and Sustaining Competitive
Advantage Edited by J.B. Barney and D.N Clark Oxford University Press, Oxford,
Paperback, 2007; 316 pages, ISBN 978-019-927769-8. Journal of Public
Affairs, 8(4), 309–313. doi: 10.1002/pa.303
Mol, A. P. J. (1995). The refinement of production ecological modernization theory and
the chemical industry. Amsterdam.
New Age International (P) Limited, Publishers. (2014). Research methodology:
methods and techniques. New Delhi.
Peters, N. J., Hofstetter, J. S., & Hoffmann, V. H. (2011). Institutional entrepreneurship
capabilities for interorganizational sustainable supply chain strategies. The
International Journal of Logistics Management, 22(1), 52–86. doi:
10.1108/09574091111127552
Ratemo, R.B. (2015). Relationship between stock prices and company performance of
firms listed at Nairobi securities exchange that engage in sustainability reporting.
32
Schaltegger, S., & Burritt, R. (2014). Measuring and managing sustainability
performance of supply chains. Supply Chain Management: An International
Journal, 19(3). doi:
10.1108/scm-02-2014-0083
Sekaran, U. (2011). Research Methods for Business. A Skill Building Approach. New
York: John Wiley & sons.
Serafeim, G. (2018). Public Sentiment and the Price of Corporate Sustainability.
Harvard Business School, working paper 19-044.
Sebastianelli, R., Tamimi, N., & Iacocca, K. (2015). Improving the quality of
environmental management: impact on shareholder value. International Journal of
Quality & Reliability Management, 32(1), 53–80. doi: 10.1108/ijqrm-03-2013-
0056
Sharma, S., & Ruud, A. (2003). On the path to sustainability: integrating social
dimensions into the research and practice of environmental management. Business
Strategy and the Environment, 12(4), 205–214. doi: 10.1002/bse.366
Stolz, I. (2014). The role of OD practitioners in developing corporations’ capacity to
practice corporate citizenship. European Journal of Training and
Development, 38(5), 436–455. doi: 10.1108/ejtd-04-2013-0046
Varsei, M., Soosay, C., Fahimnia, B., & Sarkis, J. (2014). Framing sustainability
performance of supply chains with multidimensional indicators. Supply Chain
Management: An International Journal, 19(3), 242–257. doi: 10.1108/scm-12-
2013-0436 .
Verma, S., & Chaudhuri, R. (2009). Creating Customer Satisfaction and Profitable
Value Chain With E-Commerce In Rural India: A Case Based Approach.
International Journal of Business Insights & Transformation, Vol 2 (1), 51–63.
Visser, W., & Elkington, J. (n.d.). Cannibals with Forks. The Top 50 Sustainability
Books, 108–112. doi: 10.9774/gleaf.978-1-907643-44-6_24
Wernerfelt, B. (1984). A Resource-Based View of the Firm. Strategic Management
Journal, 5 (2), 171-180.
Zikmund, W. G., Babin B. J., Carr J. C., Griffin, M. (2013). Business research methods.
CENGAGE Learning Custom Publishing.
APPENDICES
APPENDIX I: Categories oflisted firms at the NSE

33
Categories Number
Agricultural 6
Automobile and Accessories 1
Banking 12
Commercial Services 12
Construction and Allied 5
Energy and Petroleum 5
Insurance 6
Investment 5
Investment services 1
Manufacturing and Allied 9
Telecommunications 1
Real Estate Investment Trust 1
Exchange Traded Trust 1
Total 65
Source: CMA (2018)
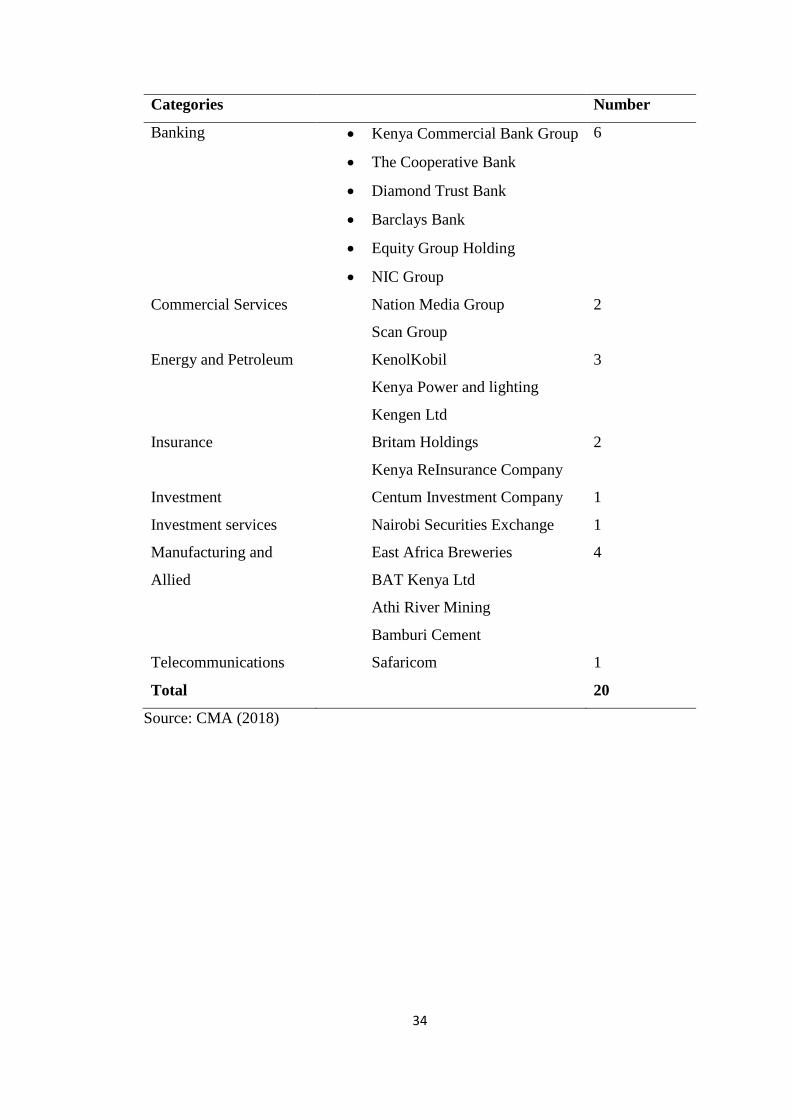
APPENDIX 1I: Specific Firms Comprising The NSE Share Index
34
Categories Number
Banking
Kenya Commercial Bank Group
The Cooperative Bank
Diamond Trust Bank
Barclays Bank
Equity Group Holding
NIC Group
6
Commercial Services Nation Media Group
Scan Group
2
Energy and Petroleum KenolKobil
Kenya Power and lighting
Kengen Ltd
3
Insurance Britam Holdings
Kenya ReInsurance Company
2
Investment Centum Investment Company 1
Investment services Nairobi Securities Exchange 1
Manufacturing and
Allied
East Africa Breweries
BAT Kenya Ltd
Athi River Mining
Bamburi Cement
4
Telecommunications Safaricom 1
Total 20
Source: CMA (2018)
35
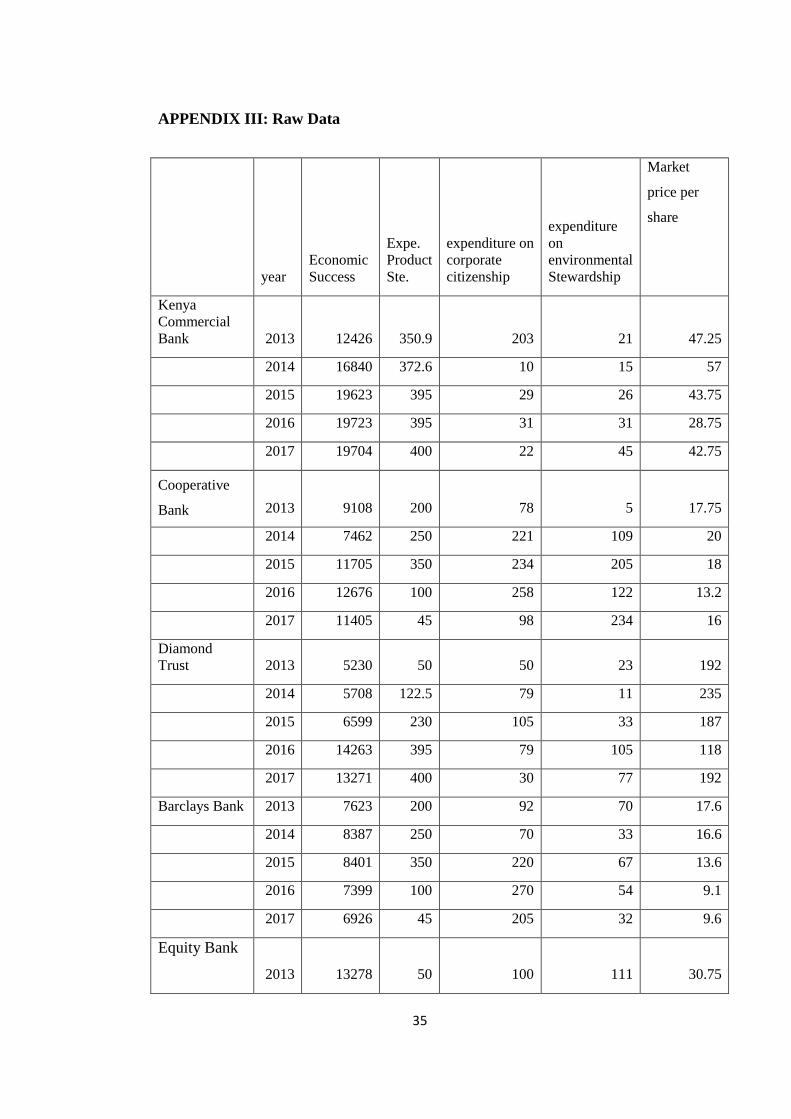
APPENDIX III: Raw Data
year
Economic
Success
Expe.
Product
Ste.
expenditure on
corporate
citizenship
expenditure
on
environmental
Stewardship
Market
price per
share
Kenya
Commercial
Bank 2013 12426 350.9 203 21 47.25
2014 16840 372.6 10 15 57
2015 19623 395 29 26 43.75
2016 19723 395 31 31 28.75
2017 19704 400 22 45 42.75
Cooperative
Bank 2013 9108 200 78 5 17.75
2014 7462 250 221 109 20
2015 11705 350 234 205 18
2016 12676 100 258 122 13.2
2017 11405 45 98 234 16
Diamond
Trust 2013 5230 50 50 23 192
2014 5708 122.5 79 11 235
2015 6599 230 105 33 187
2016 14263 395 79 105 118
2017 13271 400 30 77 192
Barclays Bank 2013 7623 200 92 70 17.6
2014 8387 250 70 33 16.6
2015 8401 350 220 67 13.6
2016 7399 100 270 54 9.1
2017 6926 45 205 32 9.6
Equity Bank
2013 13278 50 100 111 30.75
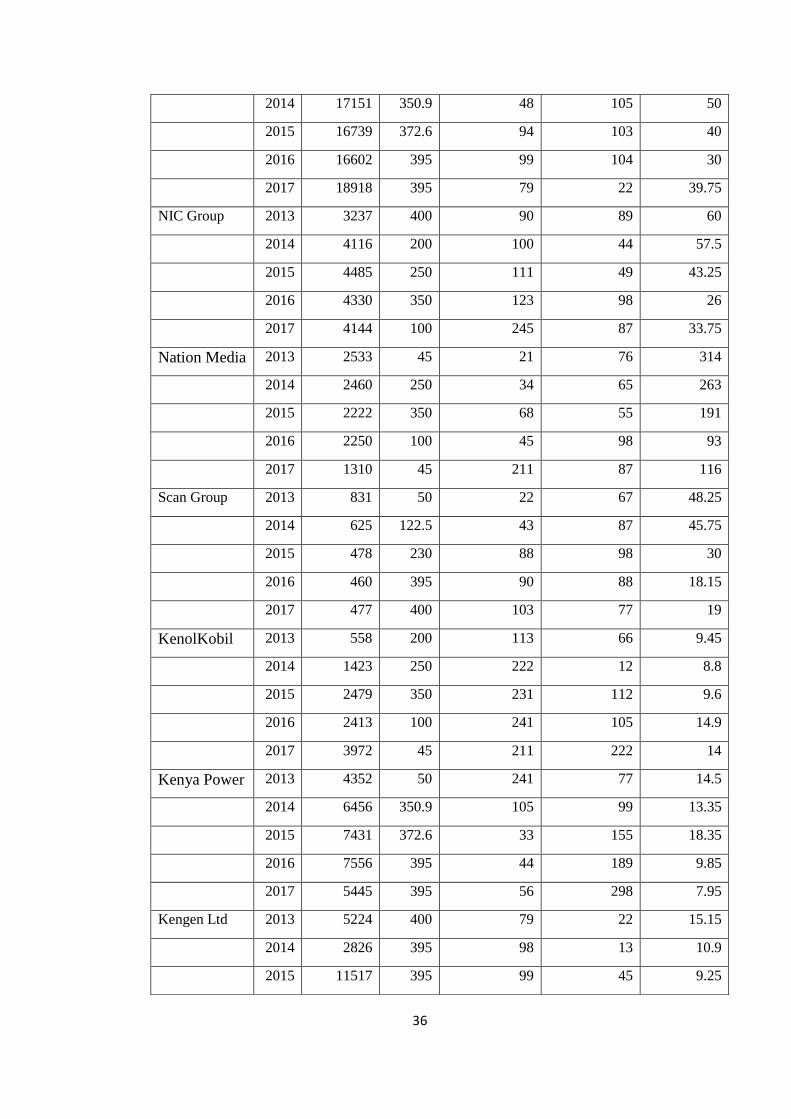
36
2014 17151 350.9 48 105 50
2015 16739 372.6 94 103 40
2016 16602 395 99 104 30
2017 18918 395 79 22 39.75
NIC Group 2013 3237 400 90 89 60
2014 4116 200 100 44 57.5
2015 4485 250 111 49 43.25
2016 4330 350 123 98 26
2017 4144 100 245 87 33.75
Nation Media 2013 2533 45 21 76 314
2014 2460 250 34 65 263
2015 2222 350 68 55 191
2016 2250 100 45 98 93
2017 1310 45 211 87 116
Scan Group 2013 831 50 22 67 48.25
2014 625 122.5 43 87 45.75
2015 478 230 88 98 30
2016 460 395 90 88 18.15
2017 477 400 103 77 19
KenolKobil 2013 558 200 113 66 9.45
2014 1423 250 222 12 8.8
2015 2479 350 231 112 9.6
2016 2413 100 241 105 14.9
2017 3972 45 211 222 14
Kenya Power 2013 4352 50 241 77 14.5
2014 6456 350.9 105 99 13.35
2015 7431 372.6 33 155 18.35
2016 7556 395 44 189 9.85
2017 5445 395 56 298 7.95
Kengen Ltd 2013 5224 400 79 22 15.15
2014 2826 395 98 13 10.9
2015 11517 395 99 45 9.25
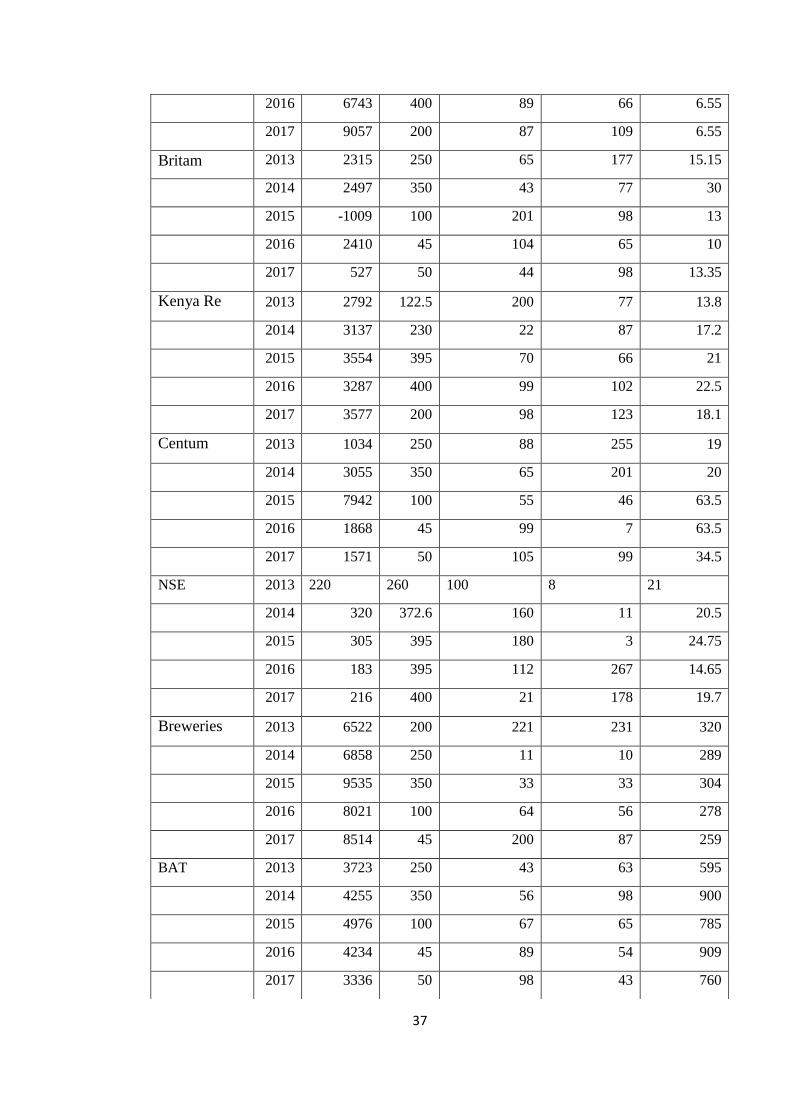
37
2016 6743 400 89 66 6.55
2017 9057 200 87 109 6.55
Britam 2013 2315 250 65 177 15.15
2014 2497 350 43 77 30
2015 -1009 100 201 98 13
2016 2410 45 104 65 10
2017 527 50 44 98 13.35
Kenya Re 2013 2792 122.5 200 77 13.8
2014 3137 230 22 87 17.2
2015 3554 395 70 66 21
2016 3287 400 99 102 22.5
2017 3577 200 98 123 18.1
Centum 2013 1034 250 88 255 19
2014 3055 350 65 201 20
2015 7942 100 55 46 63.5
2016 1868 45 99 7 63.5
2017 1571 50 105 99 34.5
NSE 2013 220 260 100 8 21
2014 320 372.6 160 11 20.5
2015 305 395 180 3 24.75
2016 183 395 112 267 14.65
2017 216 400 21 178 19.7
Breweries 2013 6522 200 221 231 320
2014 6858 250 11 10 289
2015 9535 350 33 33 304
2016 8021 100 64 56 278
2017 8514 45 200 87 259
BAT 2013 3723 250 43 63 595
2014 4255 350 56 98 900
2015 4976 100 67 65 785
2016 4234 45 89 54 909
2017 3336 50 98 43 760

38
Safaricom 2013 1348 122.5 88 86 90
2014 1493 230 105 101 82.5
2015 -2890 395 111 123 41.75
2016 -2800 400 66 235 25.5
2017 -6549 200 205 201 13
Bamburi 2013 3673 250 99 109 210
2014 3903 350 90 189 139
2015 5873 100 55 201 175
2016 5890 45 88 209 160
2017 1973 50 103 3 180
Athi River 2013 17539 350.9 103 69 6
2014 23017 372.6 104 58 12.35
2015 1627 220 94 120 207
2016 1540 220 94 121 209