influence of calcium sulfoaluminate cement on the pullout
TRANSCRIPT

University of Kentucky University of Kentucky
UKnowledge UKnowledge
Theses and Dissertations--Civil Engineering Civil Engineering
2015
Influence of Calcium Sulfoaluminate Cement on the Pullout Influence of Calcium Sulfoaluminate Cement on the Pullout
Performance of Reinforcing Fibers: An Evaluation of the Micro-Performance of Reinforcing Fibers: An Evaluation of the Micro-
Mechanical Behavior Mechanical Behavior
Robert B. Jewell University of Kentucky, [email protected]
Right click to open a feedback form in a new tab to let us know how this document benefits you. Right click to open a feedback form in a new tab to let us know how this document benefits you.
Recommended Citation Recommended Citation Jewell, Robert B., "Influence of Calcium Sulfoaluminate Cement on the Pullout Performance of Reinforcing Fibers: An Evaluation of the Micro-Mechanical Behavior" (2015). Theses and Dissertations--Civil Engineering. 27. https://uknowledge.uky.edu/ce_etds/27
This Doctoral Dissertation is brought to you for free and open access by the Civil Engineering at UKnowledge. It has been accepted for inclusion in Theses and Dissertations--Civil Engineering by an authorized administrator of UKnowledge. For more information, please contact [email protected].

STUDENT AGREEMENT: STUDENT AGREEMENT:
I represent that my thesis or dissertation and abstract are my original work. Proper attribution
has been given to all outside sources. I understand that I am solely responsible for obtaining
any needed copyright permissions. I have obtained needed written permission statement(s)
from the owner(s) of each third-party copyrighted matter to be included in my work, allowing
electronic distribution (if such use is not permitted by the fair use doctrine) which will be
submitted to UKnowledge as Additional File.
I hereby grant to The University of Kentucky and its agents the irrevocable, non-exclusive, and
royalty-free license to archive and make accessible my work in whole or in part in all forms of
media, now or hereafter known. I agree that the document mentioned above may be made
available immediately for worldwide access unless an embargo applies.
I retain all other ownership rights to the copyright of my work. I also retain the right to use in
future works (such as articles or books) all or part of my work. I understand that I am free to
register the copyright to my work.
REVIEW, APPROVAL AND ACCEPTANCE REVIEW, APPROVAL AND ACCEPTANCE
The document mentioned above has been reviewed and accepted by the student’s advisor, on
behalf of the advisory committee, and by the Director of Graduate Studies (DGS), on behalf of
the program; we verify that this is the final, approved version of the student’s thesis including all
changes required by the advisory committee. The undersigned agree to abide by the statements
above.
Robert B. Jewell, Student
Dr. Kamyar C. Mahboub, Major Professor
Dr. Yi-Tin Wang, Director of Graduate Studies

INFLUENCE OF CALCIUM SULFOALUMINATE CEMENT ON THE PULLOUT
PERFORMANCE OF REINFORCING FIBERS: AN EVALUATION OF THE
MICRO-MECHANICAL BEHAVIOR
_________________________________
DISSERTATION
_________________________________
A dissertation submitted in partial fulfillment of the requirements for the degree of
Doctor of Philosophy in the College of Engineering at the University of Kentucky
By
Robert Benjamin Jewell
Lexington, Kentucky
Director: Dr. Kamyar Mahboub, Associate Dean of Engineering and Lawson Professor
of Civil Engineering, University of Kentucky
Lexington, Kentucky
2015
Copyright © Robert Benjamin Jewell 2015

ABSTRACT OF DISSERTATION
INFLUENCE OF CALCIUM SULFOALUMINATE CEMENT ON THE PULLOUT
PERFORMANCE OF REINFORCING FIBERS: AN EVALUATION OF THE
MICRO-MECHANICAL BEHAVIOR
The objective of this research was to determine the influence of calcium sulfoaluminate
(CSA) cement on reinforcing fibers by evaluating the fiber pullout behavior, and bonding
characteristics, of a single fiber embedded in a cementitious paste matrix. Four types of
fibers commonly used in industry were evaluated: 1) Polyvinyl alcohol; 2)
Polypropylene; 3) Coated Steel; and 4) Plain Steel.
Upward trends in energy costs and potential greenhouse gas regulations favor an
increased use of construction materials that require lower energy and lower CO2
emissions to fabricate, such as CSA cement, as opposed to the production of ordinary
portland cement (OPC), which is more energy intensive and produces more CO2
emissions. However, widespread use of CSA cement requires a more in-depth
understanding of the engineering characteristics that govern its performance, including
interaction with reinforcing fibers.
The overarching objective of this research was to provide the engineering base needed for
the utilization of reinforcing fibers in CSA cement-based construction materials. The
aims of the research were (1) to develop an ettringite-rich calcium sulfoaluminate
cement, and (2) evaluate the pullout characteristics of reinforcing fibers embedded in a
CSA-cement matrix. Key elements of the strategy included (1) Compare the
performance of a laboratory-fabricated CSA cement to a commercial CSA cement and
OPC, (2) Evaluate the peak load, and toughness of reinforcing fibers in CSA cement and
OPC, (3) Evaluate the debonding-energy density and multiple-cracking behavior of fibers
in CSA cement and OPC, and (4) Evaluate the shear bond strength of reinforcing fibers in
CSA cement and OPC.
Based on the findings of this PhD dissertation, calcium sulfoaluminate cement has a
significant influence on the characteristics and behavior of embedded reinforcing fibers.
An important factor contributing to the bond strength between fiber and matrix was the
ability to transfer interfacial stresses from fiber to matrix. The more rigid-dense
morphology of the CSA cement paste related to the ettringite crystal structure yielded

higher peak loads, toughness, debonding-energy densities and shear-bond strengths for
both steel and synthetic fibers. In addition to cement phase morphology, the reduction of
the fiber/matrix elastic modulus ratio was found to be a primary factor affecting the
performance and behavior of fibers embedded in a cementitious matrix.
KEYWORDS: Calcium Sulfoaluminate Cement, Single-Fiber Pullout, Interfacial Bond,
Reinforcing Fibers, Fiber-Matrix Bond
Robert Benjamin Jewell
Student’s Signature
4/17/2015
Date

INFLUENCE OF CALCIUM SULFOALUMINATE CEMENT ON THE PULLOUT
PERFORMANCE OF REINFORCING FIBERS: AN EVALUATION OF THE
MICRO-MECHANICAL BEHAVIOR
By
Robert Benjamin Jewell
Dr. Kamyar C. Mahboub
Co-Director of Dissertation
Dr. Yi-Tin Wang
Director of Graduate Studies
4/17/2015
Date

This dissertation is dedicated to my wife Meghan and my sons, Elliott and Isaac
iii
ACKNOWLEDGMENTS
I would never have been able to finish my dissertation without the guidance of my
committee members and support from my wife, children and family.
I would like to express my gratitude to my advisor, Dr. Kamyar Mahboub, for his time,
support and patience during my doctoral education. I would like to thank my supervisor
Dr. Thomas Robl for encouraging me to seek a PhD, and for creating the flexibility in my
job that provided time for classwork and research. I would also like to thank Dr. Harik,
Dr. Bryson, and Dr. Bathke for guiding my research and for providing sound advice on
the doctoral process. I am very appreciative for the time, teaching, and expertise of Dr.
Wood on finalizing the statistical analyses.
Finally, I would like to thank my wife, Meghan Jewell. She is my greatest supporter and
walked beside me the entire way. To my sons, Elliott and Isaac, for their unconditional
love and understanding of my absence on this journey.
The work reported in this dissertation was supported by the University of Kentucky
Center for Applied Energy Research and the National Institute for Hometown Security.

iv
TABLE OF CONTENTS
ACKNOWLEDGMENTS..................................................................................................iii
TABLE OF CONTENTS....................................................................................................iv
LIST OF TABLES...............................................................................................................x
LIST OF FIGURES...........................................................................................................xii
CHAPTER 1 : INTRODUCTION.......................................................................................1
1.1. Introduction.............................................................................................................1
1.2. Background.............................................................................................................4
1.2.1. Calcium Sulfoaluminate Cements................................................................4
1.2.2. Engineered Cementitious Composites.........................................................6
1.3. Literature Review....................................................................................................7
1.3.1. Reinforcing Fibers in Concrete....................................................................8
1.3.2. Calcium Sulfoaluminate Cements and Fabrication from CCBs..................8
1.3.3. Engineered Cementitious Composite and the Single-Fiber Pullout Test
Method.......................................................................................................10
1.3.4. Multiple Cracking Behavior of ECCs........................................................12
1.3.5. Interfacial-Shear Strength of ECCs...........................................................12
1.4. Nomenclature........................................................................................................13

v
1.4.1. Cement Chemistry Notation......................................................................13
1.4.2. Acronyms...................................................................................................15
CHAPTER 2 : MATERIALS AND METHODS………………………………………..16
2.1. Materials………………………………………………………………………...16
2.1.1. Calcium Sulfoaluminate Cement……………………………………...…17
2.1.2. Ordinary Portland Cement……………………………………………….18
2.1.3. Polyvinyl-Alcohol Fiber…………………………………………………18
2.1.4. Polypropylene Fiber……………………………………………….......…20
2.1.5. Steel Fibers……………………………………………………………….20
2.2. Methods………………………………………………………………………….21
2.2.1. Calcium Sulfoaluminate Cement Fabrication…………………………....21
2.2.2. Sample Characterization…………………………………………………22
2.2.3. Single-Fiber Pullout Test Setup………………………………………….23
2.2.4. Preparation of Test Specimens…………………………………………...25
2.2.5. Statistical Analysis.....................................................................................27
CHAPTER 3 : FABRICATION AND TESTING OF LOW-ENERGY CSAB CEMENTS
THAT UTILIZE CIRCULATING FLUIDIZED BED COMBUSTION
BYPRODUCTS.................................................................................................................28

vi
3.1. Introduction……………………………………………………………………...28
3.2. Fabrication of CSAB Cement from CCBs………………………………………32
3.3. Paste Study – Effect of Gypsum Content……………………………………….37
3.4. Fabrication of Bulk CSAB Clinker Cement…………………………………….43
3.5. Strength Testing of CSAB Mortar……………………………………………....44
3.5.1. Set Time.....................................................................................................44
3.5.2. Strength of Commercial CSA Cement Mortar………………………...…45
3.5.3. Strength of Laboratory CSA Cement Mortar…………………………….46
3.6. Conclusions……………………………………………………………………..50
CHAPTER 4 : INTERFACIAL BOND BETWEEN REINFORCING FIBERS AND CSA
CEMENTS: FIBER PULLOUT CHARACTERISTICS……………………………..….52
4.1. Introduction……………………………………………………………….……..52
4.2. Research Significance – Chapter 4……………………………………………...55
4.3. Experimental Results and Discussion…………………………………………...56
4.3.1. Single-Fiber Pullout Test……………………………………………..….56
4.3.2. PVA fiber………………………………………………………………...58
4.3.3. Polypropylene fiber…………………………………………………...….59
4.3.4. Coated steel fiber……………………………………………...............…60

vii
4.4. Peak Load Analysis……………………………………………………………...61
4.4.1. Ordinary Portland Cement…………………………………………….…61
4.4.2. Commercial CSAB cement………………………………………………63
4.4.3. CAER CSAB cement………………………………………………….…66
4.5. Energy Consumption Analysis……………………….……….............................68
4.5.1. Ordinary Portland Cement…………………………………………….…68
4.5.2. Commercial CSAB Cement………………………………………….......70
4.5.3. CAER CSAB Cement………………………............................................71
4.6. Statistical Analysis………………………………………………………….…...72
4.6.1 Peak Load………………………………………………………………...73
4.6.2. Pullout Energy Consumption………………………………………….…74
4.6.3. Synthesis of the Statistical Analysis………………………………..........75
4.7. Conclusions……………………………………………………………………...76
CHAPTER 5 : INFLUENCE OF CEMENT TYPE ON MULTIPLE CRACKING
BEHAVIOR IN FIBER COMPOSITES………………………………………...............79
5.1. Introduction…………………………………………...........................................79
5.2. Research Significance – Chapter 5………………………………………….......83
5.3. Experimental Program…………………………………………………………..84

viii
5.4. Experimental Results and Discussion…………………………………………...85
5.4.1. Fiber/Matrix Debond-Energy Density……………………………….......85
5.4.2. Influence of Hydrated Cement Morphology…………………………......93
5.4.3. Fiber Bridging Stress………………………………………………….....96
5.4.4. Toughening Mechanisms……………………………………….............106
5.5. Statistical Analysis…………………………………………………………......108
5.5.1. Steel Fiber Results………………………………………………….......110
5.5.2. Synthetic Fiber Results............................................................................113
5.6. Conclusion………………………………..........................................................116
CHAPTER 6 : INFLUENCE OF CEMENT TYPE ON FIBER-MATRIX INTERFACE
BOND STRENGTH........................................................................................................118
6.1. Introduction........................................................................................................118
6.2. Research Significance – Chapter 6.....................................................................122
6.3. Experimental program........................................................................................123
6.4. Experimental Results and Discussion.................................................................124
6.4.1. Influence of Hydrated Cement Morphology............................................124
6.4.2. Interface Shear Strength...........................................................................127
6.4.3. Shear-Bond Stress....................................................................................130

ix
6.4.4. Axial-Bond Stresses.................................................................................136
6.4.5. Influence of Interface Stresses on Composite Toughness.......................140
6.5. Statistical Analysis..............................................................................................143
6.5.1. Steel Fiber Results...................................................................................145
6.5.2. Synthetic Fiber Results............................................................................148
6.6. Conclusion..........................................................................................................151
CHAPTER 7 : CONCLUSIONS AND FUTURE WORK..............................................152
7.1. General Conclusions...........................................................................................152
7.2. Future Work........................................................................................................154
APPENDICES.................................................................................................................156
APPENDIX A : STATISTICAL ANALYSIS.................................................................156
APPENDIX B : SINGLE-FIBER PULLOUT TEST DATA..........................................159
REFERENCES................................................................................................................181
VITA................................................................................................................................189

x
LIST OF TABLES
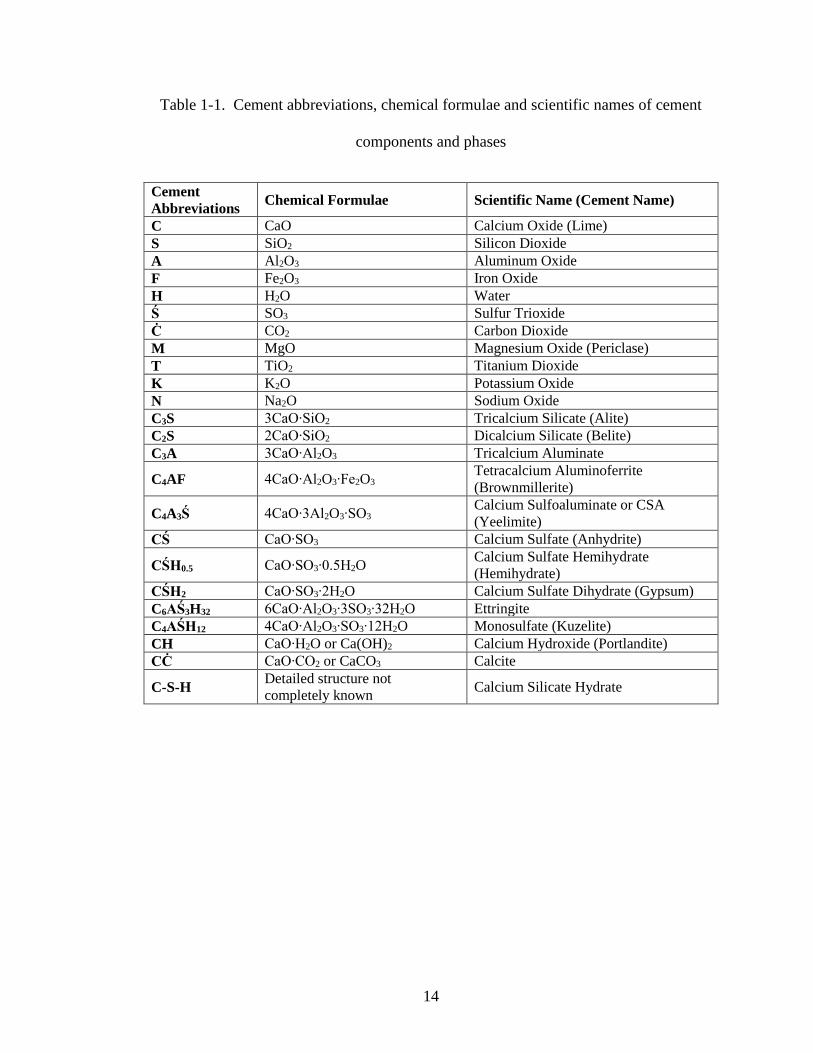
Table 1-1. Cement abbreviations, chemical formulae and scientific names of cement
components and phases....................................................................................14
Table 1-2. List of acronyms..............................................................................................15
Table 2-1. Properties of reinforcing fibers (data from product technical datasheet.........17
Table 2-2. Description of raw materials...........................................................................22
Table 2-3. Chemical composition of CCBs......................................................................23
Table 3-1. Comparison of clinker phases.........................................................................36
Table 3-2. CSAB cement formulations.............................................................................37
Table 3-3. CSAB cement composition from XRF analysis..............................................37
Table 3-4. Mortar mix proportions following ASTM C 305 and C 109 protocols...........44
Table 3-5. Effect of set retarder on the set time of CSAB, from China, cement
mortar...............................................................................................................45
Table 4-1. Peak load (N) and energy consumption values (mJ).......................................57
Table 4-2. Analysis of variance on peak load...................................................................74
Table 4-3. Analysis of variance on energy consumption..................................................74
Table 4-4. Synthesis of statistical analysis.......................................................................75
Table 5-1. Coefficient of determination before and after log transformation.................109
Table 5-2. ANOVA results for effect of cement type and levels of days of curing on
debonding-energy density for the plain-steel fiber.........................................110
Table 5-3. ANOVA results for effect of cement type and levels of days of curing on
debonding-energy density for the coated-steel fiber.......................................112
Table 5-4. ANOVA results for effect of cement type and levels of days of curing on
debonding-energy density for the polypropylene fiber...................................113
Table 5-5. ANOVA results for effect of cement type and levels of days of curing on
debonding-energy density for the polyvinyl-alcohol fiber.............................115
Table 6-1. Matrix strength and elastic modulus results..................................................135
Table 6-2. 𝐸𝑓 𝐸𝑚⁄ ratios..................................................................................................139
Table 6-3. Coefficient of determination before and after log transformation.................144

xi
Table 6-4. Type I ANOVA for effect of cement type and levels of days of curing on
shear strength for the plain-steel fiber...........................................................145
Table 6-5. Type I ANOVA for effect of cement type and levels of days of curing on
shear strength for the coated-steel fiber.........................................................147
Table 6-6. Type I ANOVA for effect of cement type and levels of days of curing on
shear stress for the polypropylene fiber.........................................................148
Table 6-7. Type I ANOVA for effect of cement type and levels of days of curing on
shear stress for the polyvinyl-alcohol fiber....................................................150

xii
LIST OF FIGURES
Figure 1-1. The crystalline structure of ettringite modified from Hartman and Berliner
(2006); the c-axis is vertical.............................................................................9
Figure 2-1. SEM image of a coated steel fiber, 400x magnification...............................21
Figure 2-2. Left) Tensile testing machine setup; Right) Screw-type grips for securing
specimen.........................................................................................................25
Figure 2-3. Specimen preparation; fiber embedded in paste plug....................................26
Figure 2-4. Fiber pullout specimen preparation: Left) Schematic of mold used to form
each cement plug; Right) Grips with fiber-plug specimen............................27
Figure 3-1. XRD profiles of the three laboratory synthesized clinkers compared to the
commercially available CSAB cements. K = Klein’s Compound; An =
anhydrite; B = belite (C2S)…........………………………………………….34
Figure 3-2. CSAB clinker demonstrating color variation and mass loss based on oven-
firing temperature………....................……………………………………...35
Figure 3-3. SEM image of ettringite crystals within the CSAB#2 paste, taken at
3000x magnification......................................................................................39
Figure 3-4. XRD profiles for the hydration of the CSAB#2, 15% gypsum, cement.
Gp = gypsum; K = Klein’s Compound; B = belite; Et = ettringite. On the
right, an SEM image, under 2500x magnification, showing the formation
of ettringite crystals in the CSAB#2, 15% gypsum cement after 7-days of
curing.............................................................................................................40
Figure 3-5. XRD profiles for the hydration of the CSAB#2, 20% gypsum, cement. On
the right, an SEM image, under 2500x magnification, showing the
formation of well-defined ettringite crystals in the CSAB#2, 20%
gypsum, cement after 7-days of curing………......................................…….41
Figure 3-6. XRD profiles for the hydration of the CSAB#2, 20% gypsum with 1%
lime, cement. On the right, an SEM image, under 2500x magnification,
showing the formation of ettringite crystals in the CSAB#2, 20% gypsum
1% lime, cement after 7-days of curing.........................................................42
Figure 3-7. Compressive strength of mortar cubes using the CSAB#2 cement with the
addition of gypsum and lime..........................................................................43
Figure 3-8. Compressive strength of mortar cubes made with commercially available
CSAB cement.................................................................................................47
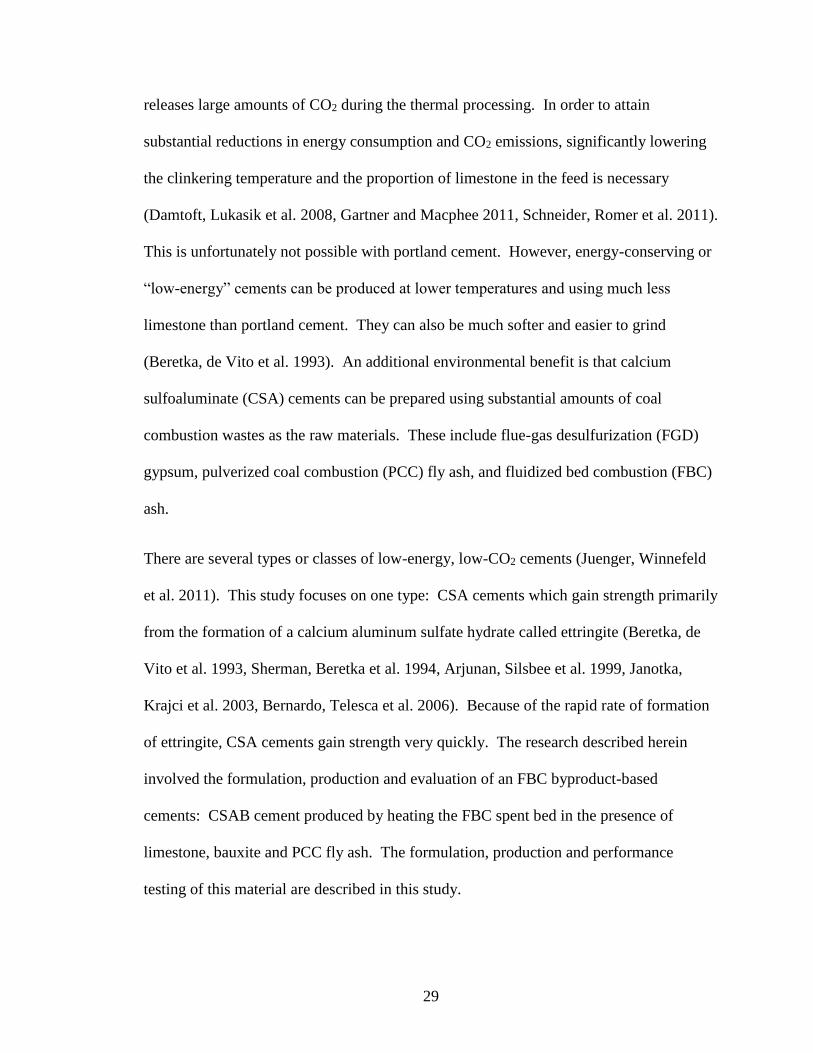
Figure 3-9. Compressive strength of the CSAB#4 cement mortar...................................49
xiii
Figure 3-10. Left: SEM image, under 700x magnification, of ettringite crystals in the
CSAB#4 cement mortar. Right: SEM image, under 1500x magnification,
showing ettringite crystals within the CSAB#4 cement
paste..............................................................................................................49
Figure 3-11. SEM image of the CSAB#4 cement used in mortar with sand grains
clearly embedded in the paste; with a zoomed view of the sand grain
surface..........................................................................................................50
Figure 4-1. Typical load-displacement curves for each fiber type...................................57
Figure 4-2. Clusters of ettringite crystals adhered to a single PVA fiber after 3-days
of curing.........................................................................................................59
Figure 4-3. Left: Polypropylene fiber after the pullout test. Right: Surface of fiber
with valley-and-ridge structure.......................................................................60
Figure 4-4. SEM images of a copper-coated steel fiber: (A) Copper coating peeled
from fiber surface; (B) Fiber end with crack in copper coating; (C)
Zoomed image of crack with defined boundary between copper coating
and steel surface.............................................................................................61
Figure 4-5. Peak load development of PVA, PP and steel fibers embedded in an OPC
matrix; standard error of the mean are indicated for each column................62
Figure 4-6. SEM images of fibers pulled from the OPC matrix (500x magnification):
(A) PVA; (B) PP; (C) Steel............................................................................63
Figure 4-7. SEM image of the matrix morphology for the commercial CSAB
Cement...........................................................................................................64
Figure 4-8. Peak load development of PVA, PP and steel fibers in the Commercial
CSAB matrix..................................................................................................65
Figure 4-9. SEM images of fibers pulled from the Commercial CSAB matrix (500x
magnification): (A) PVA; (B) PP; (C) Steel..................................................66
Figure 4-10. SEM image of the CAER CSAB cement with long needle-like ettringite
Crystals.........................................................................................................67
Figure 4-11. Peak load development of PVA, PP and steel fibers in the CAER CSAB
cement.........................................................................................................67
Figure 4-12. SEM images of fibers pulled from the CAER CSAB matrix (500x
magnification): (A) PVA; (B) PP; (C) Steel................................................68
Figure 4-13. Energy consumption development of PVA, PP and steel fibers in the
OPC matrix..................................................................................................69

xiv
Figure 4-14. Energy consumption development of PVA, PP and steel fibers in the
Commercial CSAB cement..........................................................................71
Figure 4-15. Energy consumption development of PVA, PP and steel fibers in the
CAER CSAB cement...................................................................................72
Figure 5-1. Fiber-matrix debond-energy density as a function of curing time for the
steel fibers......................................................................................................90
Figure 5-2. Fiber-matrix debond-energy density as a function of curing time for the
synthetic fibers...............................................................................................92
Figure 5-3. SEM image of OPC paste showing irregular structure of C-S-H phases;
9000x magnification......................................................................................94
Figure 5-4. SEM images of hydrated CSA cement: Top: Commercial CSA, 2500x
magnification; Bottom) CSAB#4, 1500x magnification.................................95
Figure 5-5. Fiber bridging stress as a function of curing time in the OPC paste............100
Figure 5-6. Fiber bridging stress as a function of curing time in the Commercial
CSA cement paste........................................................................................103
Figure 5-7. Fiber bridging stress as a function of curing time in the CSAB#4 cement
paste.............................................................................................................105
Figure 5-8. Chart illustrating relationship between fiber strain and fiber-bridging
stress.............................................................................................................108
Figure 5-9. Analysis of variance for debonding-energy density for the plain-steel
fiber..............................................................................................................111
Figure 5-10. Analysis of variance for debonding-energy density for the coated-steel
fiber............................................................................................................112
Figure 5-11. Analysis of variance for debonding-energy density for the
polypropylene fiber....................................................................................114
Figure 5-12. Analysis of variance for debonding-energy density for the
polyvinyl-alcohol fiber...............................................................................115
Figure 6-1. Fiber pullout specimen.................................................................................120
Figure 6-2. SEM image of OPC paste showing irregular structure of CSH phases,
magnification is 9000x.................................................................................125
Figure 6-3. SEM image of CSA cement paste showing acicular ettringite structure,
magnification is 1500x.................................................................................126

xv
Figure 6-4. Representative load-displacement highlighting key points in the fiber
pullout process.............................................................................................129
Figure 6-5. Relationship between 𝐸𝑓 𝐸𝑚⁄ ratio and shear-bond stress of coated-steel
fibers............................................................................................................132
Figure 6-6. Relationship between 𝐸𝑓 𝐸𝑚⁄ ratio and shear-bond stress of plain-steel
fibers............................................................................................................133
Figure 6-7. Relationship between 𝐸𝑓 𝐸𝑚⁄ ratio and shear-bond stress of PVA
fibers............................................................................................................134
Figure 6-8. Relationship between 𝐸𝑓 𝐸𝑚⁄ ratio and shear-bond stress of PP fibers.......135
Figure 6-9. Normalized axial stress as a function of normalized axial position for the
Coated-Steel Fiber in OPC at different 𝐸𝑓 𝐸𝑚⁄ ratios..................................138
Figure 6-10. Normalized interfacial shear stress as a function of normalized axial
position for the Coated-Steel Fiber in OPC at different 𝐸𝑓 𝐸𝑚⁄ ratios......139
Figure 6-11. Influence of cement and fiber type on fiber-matrix axial stresses.............140
Figure 6-12. Comparing the relationship between energy consumption from total fiber
pullout to total fracture toughness as a function of interface shear
bond............................................................................................................142
Figure 6-13. Analysis of variance response curves of shear strength for the plain-steel
fiber............................................................................................................146
Figure 6-14. Analysis of variance response curves of shear stress for the coated-steel
fiber............................................................................................................147
Figure 6-15. Analysis of variance response curves of shear stress for the polypropylene
fiber............................................................................................................149
Figure 6-16. Analysis of variance response curves of shear stress for the polyvinyl-
alcohol fiber...............................................................................................150

1
CHAPTER 1 : INTRODUCTION
1.1. Introduction
The primary reason for the addition of fibers to cementitious matrices is to delay and
contain cracking (Naaman, Namur et al. 1991, Lin and Li 1997, ACI 2010). While it is
generally believed that the inclusion of fibers enhances the pre-cracking behavior of
cement composites by increasing its cracking strength, the effect of fiber addition
becomes evident only after cracking (Naaman, Namur et al. 1991, Lin and Li 1997, ACI
2010). Fibers bridge the cracked parts of the matrix, thus delaying sudden global failure
of the composite (Lin and Li 1997). Therefore, in the post-cracking stage the fiber
behavior is governed by the interfacial bond stress response as being subjected to pull-out
loads (Naaman, Namur et al. 1991). The bond between fiber and matrix is important, if
fibers have a weak bond with the matrix they can slip out at low loads and do not
contribute to preventing the propagation of cracks. However, if the bond is too strong
then the fibers may rupture before they can contribute to the post-crack strength of the
matrix material.
Fiber-reinforced composites (FRC) resist tensile forces through a composite action,
whereby part of the tensile force is resisted by the matrix, while the balance is taken by
the fibers (Naaman, Namur et al. 1991). The transmission of forces between the fiber and
the matrix is achieved through a bond defined as the shearing stress at the interface
between the fiber and the surrounding matrix (Naaman, Namur et al. 1991). The fiber
contribution to increasing the toughness (total energy absorbed with a unit mJ) of the
composite is primarily dictated by the mechanisms of fiber pullout (Naaman, Namur et
al. 1991, Brown, Shukla et al. 2002). Fiber pull-out tests are often used to study the

2
fiber-matrix bond behavior in fiber reinforced cement composites. This test simulates the
fiber bridging-pull-out mechanism during the failure process of FRC (Wang, Li et al.
1988). In relating pullout test results with the fiber-matrix bond characteristics,
numerous studies have been completed to demonstrate the reliability of the data (Bentur,
Mindess et al. 1989, Naaman, Namur et al. 1991, Herrera-Franco and Drzal 1992,
Betterman, Ouyang et al. 1995, Mobasher and Cheng Yu 1996, Zucchini and Hui 1996,
Wille and Naaman 2012).
Composites made with brittle fibers, such as steel, and brittle matrices, i.e. calcium
sulfoaluminate cement, can exhibit high toughness when failure occurs preferentially
along the interface before fibers fail in tension. Most of the important toughening
mechanisms are a direct result of the interface-related shear failure which gives rise to an
improved energy absorption capability with a sustained crack growth stability through
crack surface bridging and crack tip blunting (Li and Stang 1997). The prevalent type of
cracking depends on the properties of the interface relative to the fiber and matrix (Kim
and Mai 1998). According to Kim and Mai (1998), when a crack approaches an isolated
fiber, the following failure mechanisms may be expected to take place: 1) fiber-matrix
interface debonding; 2) post-debonding friction; 3) fiber tensile failure; 4) stress
redistribution and 5) fiber pullout.
The cement-fiber interfacial bond results from some combination of mechanical
interlocking of cement hydration products with the fiber surface and chemical reaction
between fiber and cement paste within the interstitial transition zone (Kim and Mai 1998,
Brown, Shukla et al. 2002, Chan and Chu 2004, Markovic 2006). In FRC materials, the
principal factor governing load transfer from the matrix to the fiber is shear strength of

3
the interfacial bond between the two components. Broken specimens of fiber-reinforced
concrete show that failure takes place primarily due to fiber pullout or debonding.
Generally fiber pullout rather than rupture confers a larger ductility to the fiber reinforced
composites (Li and Stang 1997, Lin and Li 1997). Unlike plain concrete, a fiber-
reinforced concrete specimen does not break immediately after initiation of the first
crack; thereby increasing the work of failure, or toughness. Within the cracked section,
the matrix does not resist any tension and the fibers carry the entire load applied to the
composite. With an increasing load on the composite, fibers will tend to transfer
additional stress to the matrix through bond stresses. If these bond stresses do not exceed
the bond strength, then there may be additional cracking in the matrix. This process of
multiple cracking will continue until either the fibers fail or accumulated local debonding
will lead to fiber pullout (Shah 1991, Mehta and Monteiro 2006).
The principal phases of CSA clinker are 4CaO•3Al2O3•SO3 (C4A3Ś), also called Klein’s
compound or yeelimite, Ca2SiO4 (C2S) or belite, and C4AF (or brownmillerite) (Arjunan,
Silsbee et al. 1999). Other phases such as calcium aluminates (e.g. C12A7 or C11A7CaF2)
are sometimes present. Unlike portland cement, which gains its strength from the
hydration of calcium silicates, alite (C3S) and belite (C2S), CSA cement gains strength
from the hydration of Klein’s compound with calcium sulfate (such as gypsum CŚH2 or
anhydrite CŚ) to form ettringite via these reactions (Arjunan, Silsbee et al. 1999,
Marroccoli, Nobili et al. 2007):
C4A3Ś + 2CŚH2 + 34H → C6AŚ3H32 + 2AH3
C4A3Ś + 2CŚ + 38H → C6AŚ3H32 + 2AH3
4
These reactions are relatively fast, and are nearly complete within one month. When the
sulfate anion is depleted, ettringite C6AŚ3H32 (AFt phase) is converted to monosulfate
C4AŚH12 (AFm phase or “mono” phase) which reduces the strength of the cement.
1.2. Background
1.2.1. Calcium Sulfoaluminate Cements
The production of portland cement requires a large amounts of energy, mainly because of
the high temperatures required to partially melt and fuse the raw materials into clinker.
Portland cement clinker, which is comprised mainly of calcium silicates, is also very hard
and requires considerable energy to grind to the final product (Arjunan, Silsbee et al.
1999). Furthermore, limestone is the predominant raw material used to produce Portland
cement and releases large amounts of CO2 during the thermal processing. In order to
attain substantial reductions in energy consumption and CO2 emissions, significantly
lowering the clinkering temperature and the proportion of limestone in the feed is
necessary (Damtoft, Lukasik et al. 2008, Gartner and Macphee 2011, Schneider, Romer
et al. 2011). This is unfortunately not possible with portland cement. However, energy-
conserving or “low-energy” cements can be produced at lower temperatures and using
much less limestone than portland cement. They can also be much softer and easier to
grind(Beretka, de Vito et al. 1993). An additional environmental benefit is that CSA
cements can be prepared using substantial amounts of coal combustion wastes as the raw
materials. These include FGD gypsum, pulverized coal combustion (PCC) fly ash, and
fluidized bed combustion (FBC) ash. There are several types or classes of low-energy,
low-CO2 cements (Juenger, Winnefeld et al. 2011). The proposed research focuses on
5
one type: calcium sulfoaluminate (CSA) cements however portland cement specimens
will be tested for comparative purposes.
Currently in the U.S., there are approximately 60 fluidized bed combustion boilers used
to generate electricity. Although FBC boilers can substantially reduce SOx and NOx
emissions relative to a pulverized coal combustion (PCC) boiler, they generate a much
larger quantity of solid byproducts. FBC burns coal in a fluidized bed of sorbent, usually
limestone, which removes most of the SOx emissions. The resultant byproducts are thus
mainly composed of calcium sulfate, and also contain lesser amounts of unreacted
sorbent i.e. lime or CaO. There are two types of byproducts produced in an FBC boiler:
spent bed material, which is a coarse sandy material, and fly ash, which is a much finer
material that is captured from the flue gas. The spent bed material generally contains a
higher proportion of lime and calcium sulfate than the fly ash, whereas the latter contains
more alumina and silica because of the presence of ash from the combusted coal. The
lime, alumina and calcium sulfate within FBC byproducts imparts a cementitious nature
when they are mixed with water. The cementitious properties are largely the result of the
formation of two hydrated phases: gypsum and ettringite. Gypsum is formed from the
hydration of the anhydrous calcium sulfate, anhydrite (Marroccoli, Nobili et al. 2007).
Ettringite is a calcium aluminum sulfate hydrate that forms in a high pH environment, i.e.
that occurring from the dissolution of lime in the FBC ash.
In China, CSA cements have been used primarily to replace portland cement in mortars
and concrete when rapid strength gain, self-stressing properties or sulfate resistance is
desired. Approximately 1 million tons per year are manufactured in China which has
special standards for the cements (Zhang and Glasser 1999, Zhang, Su et al. 1999,

6
Damtoft, Lukasik et al. 2008, Ukrainczyk, Frankoviæ Mihelj et al. 2013). CSA-type
cements have a long history of use in the United Kingdom for specialty applications such
as in the mining industry. Brown (1993) described a wide range of formulations for
products used in construction, for example, general purpose low shrinkage cement,
shrinkage compensated concrete slabs, mortar coatings for concrete pipes, rapid repair
and setting m mortars, anchor bolt grouts and glass fiber reinforced cement products
(Brown 1993). The proposed work will use a combination of ordinary portland cement, a
CSA cement manufactured in the United States and a CSA cement fabricated from coal-
combustion byproducts at the Center for Applied Energy Research
1.2.2. Engineered Cementitious Composites
The increasing interest in researching and utilizing ultrahigh performance concrete
(UHPC) as a means for moving away to lessen or remove the need for reinforcing steel in
the construction process. Cementitious matrices have been developed that are capable of
surpassing structural strengths within the first day of curing; in some cases, within the
first few hours after mixing. After 28 days of curing these same mixes have attained
strengths, both compressive and flexural, that can potentially replace steel members in a
structure. As cementitious matrices continue to be engineered to perform at ultrahigh
compressive and flexural strengths there is an underlying need for the characterization of
how these enhanced systems interact with reinforcing fibers. High-strength cementitious
systems are brittle and exhibit low-energy absorption or toughness as a result of their
inability to sustain deformation and crack resistance. The proposed research intends to
illustrate how the fiber-matrix composite is influenced from the utilization of high-
strength cementitious systems, specifically calcium sulfoaluminate cements. As

7
compared to lower-strength systems, like that of an ordinary portland cement. Moreover,
there is a need to understand better the pullout process and the energy absorbing
mechanisms associated with increased toughness in composites.
The most crucial link between the properties of fiber, matrix and fiber-matrix interface
and that of a composite is the crack bridging stress-crack opening relation. This relation
defines the ultimate stress and strain of a uniaxial tensile stress-strain curve and the
energy consumption due to fiber bridging, which in turn control the strength, ductility
and toughness of a structural member (Lin and Li 1997).
The bond between the fiber and matrix is important, if the fibers have a weak bond with
the matrix they can slip out at low loads and do not contribute to preventing the
propagation of cracks. However, if the bond is too strong then the fibers will rupture
before they can contribute to the post-crack strength of the matrix material and will
exhibit a low complementary energy.
1.3. Literature Review
Published literature on the subject of reinforcing fiber in calcium sulfoaluminate cement
is not available, and is the main thrust for pursuing this research opportunity. There is a
great deal of published work on the bonding characteristics of reinforcing fibers in a
portland cement matrix.
1.3.1. Reinforcing Fibers in Concrete
The length and volume of fibers present in a concrete mix are critical in controlling the
flexural strength and toughness of the hardened concrete, including the prevention of

8
crack propagation. Generally, the composite will carry increasing loads after the first
cracking of the matrix if the pull-out resistance of the fibers at the first crack is greater
than the load at first cracking. Within the cracked section, the matrix does not resist any
tension and the fibers carry the entire load taken by the composite. With an increasing
load on the composite, the fibers will tend to transfer the additional stress to the matrix
through bond stresses. If these bond stresses do not exceed the bond strength, then there
may be additional cracking in the matrix. This process of multiple cracking will continue
until either the fibers fail or the accumulated local debonding will lead to fiber pullout
(Shah 1991, Mehta and Monteiro 2006).
1.3.2. Calcium Sulfoaluminate Cements and Fabrication from CCBs
There are several types or classes of low-energy, low-CO2 cements (Juenger, Winnefeld
et al. 2011). The proposed research focuses on one type: calcium sulfoaluminate (CSA)
cements which gain strength primarily from the formation of a calcium aluminum sulfate
hydrate called ettringite (Beretka, de Vito et al. 1993, Sherman, Beretka et al. 1994,
Arjunan, Silsbee et al. 1999, Janotka, Krajci et al. 2003, Bernardo, Telesca et al. 2006).
Because of the rapid rate of formation of ettringite, CSA cements gain strength very
quickly. The research described herein will involve the formulation, production and
evaluation of an FBC byproduct-based product: CSAB cement produced by heating the
FBC spent bed in the presence of limestone, bauxite and PCC fly ash. The formulation,
production and performance testing, in relation to reinforcing fibers are described in the
proposed research.

9
Ettringite is a hexagonal hydrated calcium aluminum sulfate (a = 11.26, c = 21.48 Å,
space group P31c, Z = 2; Figure 1-1) (Moore and Taylor 1968, Grier, Jarabek et al. 2002,
Hartman and Berliner 2006, Stark, Möser et al. 2007). Numerous analogous compounds
exist for ettringite, where carbonate (CO32-), sulfite (SO3
2-), borate (BO33-), and other
oxyanions may replace sulfate, and Fe3+, Cr3+, and other cations substitute for Al3+ (Grier,
Jarabek et al. 2002).
Figure 1-1. The crystalline structure of ettringite modified from Hartman and Berliner
(2006); the c-axis is vertical.
The sizes and shapes of ettringite crystals in cements depend on chemical conditions and
whether the ettringite forms early or later in curing, or during weathering in commercial
products. Different chemical reactions produce ettringite crystals of variable sizes and
habits, including needle-like, fibrous and prismatic forms (Xu and Stark 2005, Hartman
and Berliner 2006). In one set of experiments, Xu and Stark (2005) noticed that small
prismatic crystals of ettringite formed within ~30 minutes after the initiation of curing of
ordinary portland cement. The addition of an alkaline shotcrete accelerator, mainly
consisting of sodium aluminate (NaAl[OH]4) and sodium hydroxide (NaOH), produced
10
fiber- and needle-like ettringite within 0.5 to 8 hours of curing (Xu and Stark 2005). The
high strength, dense crystal structure, of ettringite-rich CSA cements underscore the
reason for exploring their interaction with reinforcing fibers. Therefore a CSA produced
by Buzzi Unicem USA for rapid repair of concrete structures will be used along with a
low-energy, low-CO2 CSA cement produced from coal-combustion byproducts.
1.3.3. Engineered Cementitious Composite and the Single-Fiber Pullout Test
Method
The design of engineered cementitious composites (ECC) is targeted at creating a fiber
reinforced cementitious material with a deformation behavior analogous to that of metals,
specifically at achieving pseudo strain-hardening and cracking behaviors after first
cracking (Li and Leung 1992, Lin and Li 1997, Li and Fischer 2002). Unlike plain
concrete, a fiber-reinforced concrete specimen does not break immediately after initiation
of the first crack. This has the effect of increasing the work of failure, or toughness.
Fiber-reinforced composites (FRC) resist tensile forces through a composite action,
whereby part of the tensile force is resisted by the matrix, while the balance is taken by
the fibers (Naaman, Namur et al. 1991). The transmission of forces between the fiber and
the matrix is achieved through bond defined as the shearing stress at the interface
between the fiber and the surrounding matrix (Naaman, Namur et al. 1991). It is
generally agreed that the fiber contribution to increasing the toughness of the composite
is primarily dictated by the mechanisms of fiber pullout (Naaman, Namur et al. 1991).
The term toughness, which represents the crack resistance capability of concrete, or the
total energy absorbed prior to complete failure; or the critical potential energy release rate

11
of a composite specimen with a unit mJ (Brown, Shukla et al. 2002). Toughness is also
one of the fundamental parameters in failure analysis (Xu and Zhang 2008).
A popular interface characterization test is the single-fiber pullout test (Nairn, Liu et al.
2001). In the single-fiber pullout test, the end of a fiber is embedded in a cement matrix
and pulled out while the matrix is held in place. The peak force, P, required to debond
the fiber is typically recorded as a function of time; and will be correlated to curing time
in the proposed research. The pullout test is also important by itself as it simulates the
fiber bridging-pull-out mechanism during the failure process of FRC (Wang, Li et al.
1988). In relating the pullout test results with the fiber-matrix bond characteristics,
numerous models have been developed and many of them have been reviewed (Bartos
1981, Bentur, Mindess et al. 1989, Hsueh 1990, Leung and Li 1990, Kim and Mai 1991,
Naaman, Namur et al. 1991, Herrera-Franco and Drzal 1992, Nairn 1992, Chu, Robertson
et al. 1994, Betterman, Ouyang et al. 1995, Mobasher and Cheng Yu 1996, Zucchini and
Hui 1996, Li and Stang 1997, Kanda and Li 1998).

12
1.3.4. Multiple Cracking Behavior of ECCs
The crack-bridging behavior and associated complementary energy concept first
proposed by Marshall and Cox (1988) is used as the linking concept between interfacial
bond and composite failure behavior (Marshall, Cox et al. 1985, Marshall and Cox 1988,
Li, Kanda et al. 1997).
Xu and Zhang (2008) defined crack propagation in concrete as having three distinguished
stages: crack initiation, stable crack propagation and unstable failure (Leung and Li 1990,
Betterman, Ouyang et al. 1995, Xu and Zhang 2008). After first-cracking, provided the
fibers are strong enough, the material can take further loading (by the fibers themselves)
until ultimate failure occurs. With increased loading beyond the first-cracking strength,
multiple cracks will be formed, giving rise to pseudo-ductility of the material (Leung and
Li 1990). Pseudo strain-hardening and multiple cracking have been observed in
continuously reinforced ceramic and cement matrices with aligned fibers (Li and Wu
1992).
1.3.5. Interfacial-Shear Strength of ECCs
The cement-fiber interfacial bond results from some combination of mechanical
interlocking of cement hydration products with the fiber surface and chemical reaction
between fiber and cement paste within the interstitial transition zone (Kim and Mai 1998,
Brown, Shukla et al. 2002). In fiber reinforced composite materials, the principal factor
governing load transfer from the matrix to the fiber is the shear strength of the interfacial
bond between the two components. Broken specimens of fiber-reinforced concrete
shows that failure takes place primarily due to fiber pullout or debonding. Generally

13
fiber pullout rather than rupture confers a larger ductility to the fiber reinforced
composites (Li and Stang 1997, Lin and Li 1997).
The mechanical properties of mortars are influenced by microstructure development
through changes induced during cement hydration and hardening of the bonding system
in the cement paste during curing (Janotka, Krajci et al. 2003). Uniform shear bond
strength between the fiber and the matrix is often assumed in FRC models and the bond
strength from pull-out tests is frequently reported in terms of the average value over the
embedded fiber surface area (Kim and Mai 1998, Johnston 2001, Mehta and Monteiro
2006).
1.4. Nomenclature
Due to the frequent recurrence of the hydration phases and cement chemical formulations
within the text, abbreviations commonly used in the cement industry, as-well-as
acronyms, are used to simplify the language of this dissertation and are displayed in
Sections 1.4.1 and 1.4.2.
1.4.1. Cement Chemistry Notation
The cement abbreviations, chemical formulae and scientific names for each cement
component and hydrated phases are presented in Table 1-1.
14
Table 1-1. Cement abbreviations, chemical formulae and scientific names of cement
components and phases
Cement
Abbreviations Chemical Formulae Scientific Name (Cement Name)
C CaO Calcium Oxide (Lime)
S SiO2 Silicon Dioxide
A Al2O3 Aluminum Oxide
F Fe2O3 Iron Oxide
H H2O Water
Ś SO3 Sulfur Trioxide
Ċ CO2 Carbon Dioxide
M MgO Magnesium Oxide (Periclase)
T TiO2 Titanium Dioxide
K K2O Potassium Oxide
N Na2O Sodium Oxide
C3S 3CaO∙SiO2 Tricalcium Silicate (Alite)
C2S 2CaO∙SiO2 Dicalcium Silicate (Belite)
C3A 3CaO∙Al2O3 Tricalcium Aluminate
C4AF 4CaO∙Al2O3∙Fe2O3 Tetracalcium Aluminoferrite
(Brownmillerite)
C4A3Ś 4CaO∙3Al2O3∙SO3 Calcium Sulfoaluminate or CSA
(Yeelimite)
CŚ CaO∙SO3 Calcium Sulfate (Anhydrite)
CŚH0.5 CaO∙SO3∙0.5H2O Calcium Sulfate Hemihydrate
(Hemihydrate)
CŚH2 CaO∙SO3∙2H2O Calcium Sulfate Dihydrate (Gypsum)
C6AŚ3H32 6CaO∙Al2O3∙3SO3∙32H2O Ettringite
C4AŚH12 4CaO∙Al2O3∙SO3∙12H2O Monosulfate (Kuzelite)
CH CaO∙H2O or Ca(OH)2 Calcium Hydroxide (Portlandite)
CĊ CaO∙CO2 or CaCO3 Calcite
C-S-H Detailed structure not
completely known Calcium Silicate Hydrate

15
1.4.2. Acronyms
Acronyms used through this dissertation are shown in Table 1-2.
Table 1-2. List of acronyms
Acronym Signification
OPC Ordinary Portland Cement
CSA Calcium Sulfoaluminate
FGD Gypsum Flue Gas Desulfurization Gypsum
AFm Al2O3∙Fe2O3-mono
AFt Al2O3∙Fe2O3-tri
XRD X-Ray Diffraction
SEM Scanning Electron Microscope
wt. % Weight percentage
TZ Transition Zone
UHPC Ultra High Performance Concrete
ECC Engineered Cementitious Composites
FRC Fiber Reinforced Composites
PVA Polyvinyl Alcohol
PP Polypropylene
16
CHAPTER 2 : MATERIALS AND METHODS
The single-fiber pullout test will be performed to investigate the peak pullout load and
corresponding energy consumption, or toughness, shear-bond strength, debonding-energy
density and fiber-bridging stress. The major parameter that will be investigated is the
bond developed to various fiber types, over time, with sulfate-based hydration products
as compared to silicate-based hydration products.
2.1. Materials
Three types of cements were investigated; ordinary portland cement, a commercially
available CSA cement, and a CSA cement fabricated from coal combustion byproducts,
at the University of Kentucky Center for Applied Energy Research (CAER), referred to
in this study as CSAB#4. Polypropylene (PP) fiber, from Propex Inc., polyvinyl alcohol
(PVA) produced by Nycon, Type-1 copper-coated steel fibers (Nycon-SF®) from Kuraray
Company, and plain steel fibers from Bekaert were used in the tests, fiber properties are
listed in Table 2-1.

17
Table 2-1. Properties of reinforcing fibers (data from product technical datasheet)
Fiber
Type Polypropylene
Polyvinyl
Alcohol Plain Steel Coated Steel
Image
Tensile
Strength,
MPa
600 1200 2000 2660
Modulus of
Elasticity,
GPa
5 30 200 220
Fiber
Elongation,
%
25 7 5 5
Density
g/cm3 0.91 1.30 7.80 7.80
Fiber
Surface
Area mm2 (6 mm length)
6.75 1.89 2.85 2.85
Fiber
Length,
mm
15 12 13 13
2.1.1. Calcium Sulfoaluminate Cement
The principal phases of CSA clinker are C4A3Ś (also called Klein’s compound or
yeelimite), C2S (dicalcium silicate, i.e. belite), and C4AF (tetracalcium aluminoferrite, i.e.
brownmillerite)(Arjunan, Silsbee et al. 1999). Other phases such as calcium aluminates
(e.g. C12A7 or C11A7CaF2) are sometimes present. CSA cement gains strength from the
hydration of Klein’s compound with calcium sulfate (such as gypsum CŚH2 or anhydrite
CŚ to form ettringite via these reactions (Marroccoli, Nobili et al. 2007):

18
C4A3Ś + 2CŚH2 + 34H → C6AŚ3H32 + 2AH3
C4A3Ś + 2CŚ + 38H → C6AŚ3H32 + 2AH3
These reactions are relatively fast, and are nearly complete within one month. When the
sulfate anion is depleted, ettringite C6AŚ3H32 (AFt phase) is converted to monosulfate
C4AŚH12 (AFm phase or “mono” phase) which reduces the strength of the cement (Ikeda
1980).
2.1.2. Ordinary Portland Cement
Unlike CSA cement portland cement gains its strength from the hydration of C3S
(tricalcium silicate, i.e. alite), C2S, C3A (tricalcium aluminate), and C4AF, in the presence
of a sulfate source, i.e. gypsum or anhydrite (Richardson 1999, Woodson 2012). These
main binding phases in portland cement-based systems are referred to as calcium silicate
hydrates (CSH). In addition to CSH, calcium hydroxide is also formed.
2.1.3. Polyvinyl-Alcohol Fiber
The breaking of the chemical bond is evident in the first significant load drop. The
second increase in load with fiber pullout has resulted from a slip hardening affect; this
behavior is achieved through multiple cracking of the reinforced matrix (Redon, Li et al.
2001). However, as the matrix continues to hydrate and chemically bonds to the fiber
surface fiber failure is experienced more often. This type of failure occurs when the
fiber-matrix bond is greater than the load capacity of the fiber, thus the fiber ruptures in
the fiber-free zone or debonded region of the fiber.

19
PVA fibers are hydrophilic and have the ability to chemically bond to the surrounding
matrix along the interface boundary (Chu, Robertson et al. 1994, Betterman, Ouyang et
al. 1995, Redon, Li et al. 2001). The hydrogen bond is formed by the available hydroxyl-
groups on the PVA fiber. The chemical bond creates a cohesive fracture (matrix phase
adheres to the fiber) when the fiber is pulled from the matrix (Hertzberg 1996). Another
possibility for the increased bond with PVA fibers is attributed to the PVA fiber
providing nucleation sites for the crystallization of hydrated cement phases (Cadek,
Coleman et al. 2002, Bin, Mine et al. 2006, Naebe, Lin et al. 2008).
The use of PVA fibers has caused the mechanism of failure to change. The strong bond
between the fiber and matrix has caused the failure site to move from the fiber surface to
the more porous matrix region. The porous region is most likely more brittle by
comparison with the ductile interfacial layer with steel fibers (Chu, Robertson et al.
1994). In some cases the matrix strength and the fiber-matrix bond exceed the yield
strength of the fiber, and rupture results. If fibers rupture the energy experienced by the
composite cannot be dissipated through pullout. In this case, the fibers behave as non-
active inclusions leading to only marginal improvement in the mechanical properties
(Mehta and Monteiro 2006).

20
2.1.4. Polypropylene Fiber
A typical polypropylene-fiber pullout curve shows a broad curve with a large area value
below the curve, demonstrating the PP fiber’s ability to increase the toughness of the
composite. The PP fiber does not chemically bond to the surrounding matrix, they are
hydrophobic and non-polar; therefore fractures form with the matrix in an adhesive (no
matrix phase residue on the fiber) manner (Hertzberg 1996, Brogren and Karlsson 1997).
The surface morphology of the PP fiber allows for surface irregularities ideal for matrix
bonding; in addition to the potential for increased frictional loading, during fiber pullout,
due to the valley-and-ridges found on fiber surface.
2.1.5. Steel Fibers
A typical single steel fiber pullout curve displays high peak loads, relative to the PVA
and PP fibers, along with a shallow-sloping slip hardening curve; providing a large
energy density as illustrated by the area beneath the curve. The coated-steel fibers are
coated in copper for corrosion resistance as stated by the manufacturer's product
specifications. The plain-steel fiber has not been coated. A scanning electron
micrograph is shown in Figure 2-1, where the coating can be seen peeling away from the
coated-fiber surface.

21
Figure 2-1. SEM image of a coated steel fiber, 400x magnification.
2.2. Methods
2.2.1. Calcium Sulfoaluminate Cement Fabrication
Bulk samples of FBC spent bed and fly ash were collected from a Kentucky FBC unit at
the start of the project. These samples were sealed in mylar bags and stored in
polyethylene drums. Bauxite was obtained from Ward’s Scientific Inc. and stored in
closed polyethylene buckets. Class F fly ash was obtained from a Kentucky PCC plant,
which is located at the same site as the FBC unit. The limestone used in some of the
cement formulations was acquired from a local quarry, and hydrated lime was obtained
from a local supplier. Commercial CSAB from China was obtained from the Shenzhen
Chenggong Trade supplier. Two additional commercial CSA cements that are produced
in North America were also obtained for testing. Cemex Type I ordinary portland cement
(OPC) was purchased from a local distributor. All cements were stored in heat-sealed
mylar bags.

22
Flue gas desulfurization (FGD) gypsum was acquired from a power plant in northern
Kentucky. An ultra-fine Class F fly ash (UFA) was produced at the CAER from material
obtained at a coal ash impoundment in northern Kentucky. Table 2- provides a list of the
raw materials used in the project.
Table 2-2. Description of raw materials
Material Name Type of Material Source
FBC Spent Bed Material Coarse FBC Byproduct Kentucky FBC plant
FBC Fly Ash Fine FBC Byproduct Kentucky FBC plant
Class F Fly Ash Low-calcium coal ash Kentucky PCC plant
Class C Fly Ash High-calcium coal ash Indiana PCC plant
Ultra-Fine Fly Ash (UFA) Processed Class F ash Kentucky PCC plant ash pond
Gypsum FGD Byproduct Proprietary source
Bauxite Quarried raw material Ward’s
Limestone Quarried raw material Local quarry
Hydrated Lime Agricultural lime Southern States
2.2.2. Sample Characterization
The major oxide composition of the materials was determined using x-ray fluorescence
following ASTM D 4326 protocols. The loss on ignition (LOI) is important when
proportioning the feed materials for CSAB production because the weight loss during
heating must be accounted for. During production of the CSAB cement, limestone loses
primarily carbon dioxide, whereas the bauxite evolves water from dehydroxylation of the
aluminum hydroxide. The majority of LOI for the Class F fly ash and the Gilbert
byproducts was derived from combustion of coal. For this study, the LOI of the materials
was conducted at 950°C. Density was determined on selected samples using a
LeChatelier flask (ASTM C 188). The major oxide compositions of the coal combustion
byproducts (CCBs) and native raw materials are shown in Table 2-3.

23
Table 2-3. Chemical composition of CCBs
FBC
Spent
Bed
FBC
Fly
Ash
Class F
FA
Class
C FA UFA
FGD
Gypsum
Ward’s
Bauxite Limestone
Hydrated
Lime
SiO2 12.77 25.62 57.44 41.65 50.88 4.54 10.61 7.41 4.99
Al2O3 5.25 10.34 29.97 22.28 26.98 1.09 78.75 2.76 2.03
Fe2O3 3.15 9.08 4.94 5.97 4.85 0.60 5.25 0.77 0.59
CaO 48.23 33.74 1.09 19.32 1.21 40.15 0.28 81.62 89.19
MgO 2.47 4.09 0.79 4.43 0.91 0.37 0.18 3.31 2.69
Na2O 0.05 0.13 0.15 1.09 0.38 <0.01 0.01 0.04 0.16
K2O 0.36 1.24 2.73 1.24 2.70 0.06 0.03 0.61 0.12
P2O5 0.13 0.14 0.11 0.89 0.25 0.04 0.32 0.03 0.03
TiO2 0.26 0.42 1.64 1.32 1.72 0.13 3.67 0.15 0.13
SO3 27.83 16.97 0.11 1.18 <0.01 53.67 1.58 0.82 0.19
LOI 2.00 n.d. 1.61 0.43 3.36 19.05 26.21 41.59 23.27
Free
Lime 23.0 10.0 Na na na na na na na
Density
(g/cm3) 2.98 2.82 2.41 2.37
Particle-size distribution was determined using a Malvern Mastersizer 2000 laser
diffraction analyzer. Refractive and absorption indices of the materials were determined
prior to diffraction analysis. The crystalline phases present in the raw materials were
determined using a PANalytical XPert x-ray diffraction (XRD) spectrometer. Hydrated
cement pastes and mortars were ground in a mortar and pestle prior to analysis and were
either analyzed wet, or after treatment in acetone (to stop hydration) and oven drying at
50-60°C for 1 hour. Scanning electron microscope (SEM) analysis was conducted on
samples that had been treated using the acetone-drying method.
2.2.3. Single-Fiber Pullout Test Setup
Fiber pull-out tests are often used to study the fiber-matrix bond behavior in fiber
reinforced cement composites. The pullout test is also important by itself as it simulates
the fiber bridging-pull-out mechanism during the fracture process of FRC (Wang, Li et
al. 1988). In relating the pullout test results with the fiber-matrix bond characteristics,

24
numerous models have been developed and many of them have been reviewed (Bartos
1981, Bentur, Mindess et al. 1989, Hsueh 1990, Leung and Li 1990, Kim and Mai 1991,
Naaman, Namur et al. 1991, Herrera-Franco and Drzal 1992, Nairn 1992, Chu, Robertson
et al. 1994, Betterman, Ouyang et al. 1995, Mobasher and Cheng Yu 1996, Zucchini and
Hui 1996, Li and Stang 1997, Kanda and Li 1998). Uniform shear bond strength between
the fiber and the matrix is often assumed in FRC models and the bond strength from pull-
out tests is frequently reported in terms of the average value over the embedded fiber
surface area (Gray 1984, Kim and Mai 1998, Johnston 2001, Mehta and Monteiro 2006,
Subramani and Gaurav 2012).
The pullout tests were conducted on an Instron 600DX universal testing machine (Figure
2-2). A 2 kN load cell was used to measure the pullout load of the fibers with a
displacement rate of 0.02 mm/s. Fiber-free length was kept at a maximum of 1 mm to
reduce the effects of fiber elongation. The fibers were embedded 6 mm into a paste plug,
which was held in place with a screw-type grip that was secured into the 2 kN (450 lbf)
load cell (Figure 2-3). The fiber-free end was glued to a plastic-anchor plate and then
secured in the jaws of the upper grip.

25
Figure 2-2. Left) Tensile testing machine setup; Right) Screw-type grips for securing
specimen.
2.2.4. Preparation of Test Specimens
Test specimens were embedded in a paste plug (water:cement = 0.45) with an 8 mm (0.31
in) diameter and 25 mm (0.98 in) length (Figure 2-3 and Figure 2-4). The shortest fiber
was 12 mm (0.47 in) in length; therefore a depth of 6 mm (0.24 in) was selected to
maximize the available fiber-matrix bond surface to allow for quantitative comparison.
Fiber characterization and properties are listed in Table 2-1. A depth gauge ensured
fibers were embedded to 6 mm (0.24 in) and perpendicularly aligned to the mold surface.
Specimens were removed from molds and placed in a temperature and humidity
controlled environment and tested at 1, 7, 21, 28 and 56 days.

26
Figure 2-3. Specimen preparation; fiber embedded in paste plug.

27
Figure 2-4. Fiber pullout specimen preparation: Left) Schematic of mold used to form
each cement plug; Right) Grips with fiber-plug specimen.
2.2.5. Statistical Analysis
Common to all fiber pullout tests is a certain amount of data scatter in the experimental
results; therefore five specimens were prepared for each test. Data scatter is attributed to
the presence of naturally occurring random fiber flaws and the lack of uniformity in the
surface characteristics along the length of each fiber. The data in Chapter 4 were
statistically analyzed using a 3-way analysis of variance (ANOVA) (cement type, fiber
type and days of curing). Additionally, the nonparametric rank-based ANOVA-type test
proposed by Brunner et al. (1997) was used to confirm the results from the parametric
ANOVA. The nonparametric test does not assume normality or homoscedastic errors.
Therefore, its agreement with the parametric ANOVA can be interpreted as a
confirmation that the latter’s assumptions were not grossly violated. Also, the
nonparametric ANOVA-type test is invariant under monotone transformations of the
data, meaning in particular that it doesn’t matter whether the original data or log-
transformed data is analyzed.
28
CHAPTER 3 : FABRICATION AND TESTING OF LOW-ENERGY CSAB
CEMENTS THAT UTILIZE CIRCULATING FLUIDIZED BED COMBUSTION
BYPRODUCTS
3.1. Introduction
The utilization of circulating fluidized bed combustion (CFBC) ash to make cement
products that provide added value and offset CO2 production is the objective of this
research. CFBC burns coal in the presence of a bed of slaked limestone, which effectively
absorbs sulfur dioxide (SO2) to form anhydrite (CaSO4). CFBC produces two kinds of
spent bed materials, coarse bottom ash and a much finer fly ash. Both of these products
are very high in calcium. When properly conditioned these materials are capable of
acting as hydraulic cements, forming both calcium aluminosulfate minerals, most
importantly ettringite, as well as calcium-alumina-silica gels, like that formed from
portland cement.
The research to generate calcium sulfoaluminate-belite (CSAB) cement was centered on
two components. The first was the production of a cement that maximizes the proportion
of coal combustion byproducts while achieving acceptable strength development. The
second component focused on optimizing the laboratory-derived CSAB cement to have
comparable strength characteristics with commercial CSAB cements.
The production of portland cement requires a large amounts of energy, mainly because of
the high temperatures required to sinter the raw materials into clinker. Portland cement
clinker, which is comprised mainly of calcium silicates, is also very hard and requires
considerable energy to grind to the final product (Arjunan, Silsbee et al. 1999).
Furthermore, limestone is a major raw material used to produce portland cement and
29
releases large amounts of CO2 during the thermal processing. In order to attain
substantial reductions in energy consumption and CO2 emissions, significantly lowering
the clinkering temperature and the proportion of limestone in the feed is necessary
(Damtoft, Lukasik et al. 2008, Gartner and Macphee 2011, Schneider, Romer et al. 2011).
This is unfortunately not possible with portland cement. However, energy-conserving or
“low-energy” cements can be produced at lower temperatures and using much less
limestone than portland cement. They can also be much softer and easier to grind
(Beretka, de Vito et al. 1993). An additional environmental benefit is that calcium
sulfoaluminate (CSA) cements can be prepared using substantial amounts of coal
combustion wastes as the raw materials. These include flue-gas desulfurization (FGD)
gypsum, pulverized coal combustion (PCC) fly ash, and fluidized bed combustion (FBC)
ash.
There are several types or classes of low-energy, low-CO2 cements (Juenger, Winnefeld
et al. 2011). This study focuses on one type: CSA cements which gain strength primarily
from the formation of a calcium aluminum sulfate hydrate called ettringite (Beretka, de
Vito et al. 1993, Sherman, Beretka et al. 1994, Arjunan, Silsbee et al. 1999, Janotka,
Krajci et al. 2003, Bernardo, Telesca et al. 2006). Because of the rapid rate of formation
of ettringite, CSA cements gain strength very quickly. The research described herein
involved the formulation, production and evaluation of an FBC byproduct-based
cements: CSAB cement produced by heating the FBC spent bed in the presence of
limestone, bauxite and PCC fly ash. The formulation, production and performance
testing of this material are described in this study.

30
Currently in the United States, there are approximately 60 fluidized bed combustion
(FBC) boilers used to generate electricity. Although FBC boilers can substantially
reduce SOx and NOx emissions relative to a PCC boiler, they generate a much larger
quantity of solid byproducts. FBC burns coal in a fluidized bed of sorbent, usually
limestone, which removes most of the SOx emissions. The resultant byproducts are thus
mainly composed of calcium sulfate, and also contain lesser amounts of unreacted
sorbent i.e. lime or CaO. There are two types of byproducts produced in an FBC boiler:
spent bed material, which is a coarse sandy material, and fly ash, which is a much finer
material that is captured from the flue gas. The spent bed material generally contains a
higher proportion of lime and calcium sulfate than the fly ash, whereas the latter contains
more alumina and silica because of the presence of ash from the combusted coal.
The lime, alumina and calcium sulfate within FBC byproducts imparts a cementitious
nature when they are mixed with water. The cementitious properties are largely the result
of the formation of two hydrated phases: gypsum and ettringite. Gypsum is formed from
the hydration of the anhydrous calcium sulfate, anhydrite (Marroccoli, Nobili et al. 2007).
This reaction can be slow because of the “hard burned” nature of the FBC anhydrite,
which results from the high temperatures within the boiler. Nevertheless, the hydration
reaction is:
CaSO4 + 2H2O → CaSO4•26H2O (gypsum) (3-1)
Ettringite is a calcium aluminum sulfate hydrate that forms in a high pH environment (i.e.
that occurring from the dissolution of lime in the FBC ash) by the following reaction:
3CaSO4 + 3Ca(OH)2 + 2Al(OH)3 + 26H2O → Ca6Al2(SO4)3(OH)12•26H2O (3-2)

31
One potential pathway to the utilization of FBC byproducts is to produce a CSAB cement
via a high temperature clinkering process, similar to the production of portland cement.
In contrast to portland cement, which derives its strength from the formation of calcium
silicate hydrates, CSAB cement concrete hardens and gains strength primarily through
the hydration of Klein’s compound (Ca4Al6O12SO4) and calcium sulfate to form ettringite
(Arjunan, Silsbee et al. 1999, Janotka, Krajci et al. 2003, Bernardo, Marroccoli et al.
2004, Torre, Aranda et al. 2005):
Ca4Al6O12SO4 + 2CaSO4•2H2O + 34H2O → Ca6Al2(SO4)3(OH)12•26H2O + 4Al(OH)3 (3-3)
A compound similar to ettringite called “monosulfate” can also form under sulfate-
deficient conditions and its role as a cementitious component in CSA cement is not well
understood (Ikeda 1980, Glasser and Zhang 2001). Belite is usually present in CSA
cements, but its hydration is typically slow and only provides additional long-term
strength (Glasser and Zhang 2001, Torre, Aranda et al. 2005). Because of the rapid rate
of formation of ettringite, CSA cements gain strength very quickly. If enough lime
(Ca(OH)2) and calcium sulfate are present in the system, then additional ettringite is
formed through reaction with the aluminum hydroxide. However, with excess lime the
system can become expansive to the degree that it is destructive to the hardened material
(Mehta 1973).
In China, CSA cements have been used primarily to replace portland cement in mortars
and concrete when rapid strength gain, self-stressing properties or sulfate resistance is
desired. Approximately one million tons per year are manufactured in China which has
special standards for the cements (Zhang and Glasser 1999, Zhang, Su et al. 1999,

32
Damtoft, Lukasik et al. 2008). CSA-type cements have a long history of use in the
United Kingdom for specialty applications such as in the mining industry. Brown (1993)
described a wide range of formulations for products used in construction, for example,
general purpose low shrinkage cement, shrinkage compensated concrete slabs, mortar
coatings for concrete pipes, rapid repair and setting m mortars, anchor bolt grouts and
glass fiber reinforced cement products.
In summary, CSA cements can potentially present considerable environmental
advantages compared to portland cement because of the lower energy use, lower CO2
emissions and use of coal combustion wastes as raw materials. In order to support
widespread introduction of the cements in the marketplace there are several issues that
must be addressed, namely, high cost, durability issues, and appropriate applications. As
was discussed above, although only a limited amount of research has been conducted on
the durability of CSA cements, there is sufficient information indicating that the cements
can be quite durable in certain environments.
The research described herein has focused on the production of one class of FBC
byproduct-based cement: CSAB cement produced by heating the FBC spent bed in the
presence of limestone, bauxite, and PCC fly ash. The formulation, production and
performance testing of this class of material are described.
3.2. Fabrication of CSAB Cement from CCBs
Mixtures of FBC spent bed material, PCC fly ash; bauxite and limestone were
interground for clinkering. The clinker tests were conducted from 1000oC to 1250oC and
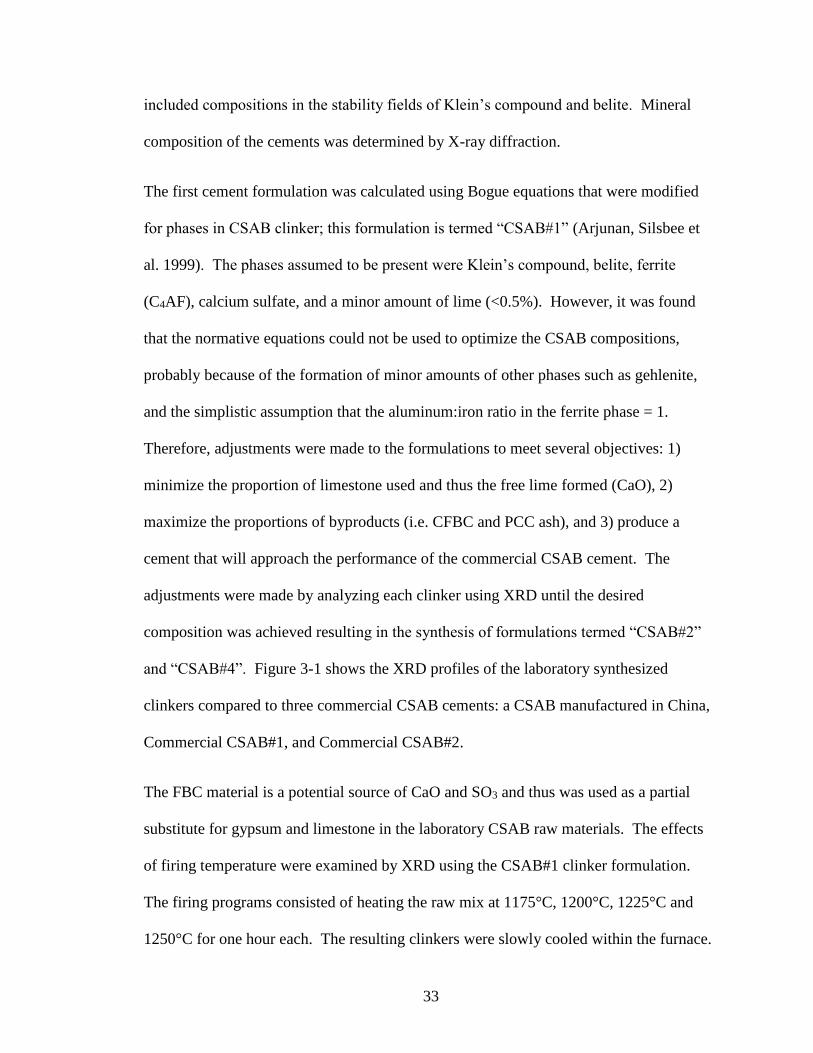
33
included compositions in the stability fields of Klein’s compound and belite. Mineral
composition of the cements was determined by X-ray diffraction.
The first cement formulation was calculated using Bogue equations that were modified
for phases in CSAB clinker; this formulation is termed “CSAB#1” (Arjunan, Silsbee et
al. 1999). The phases assumed to be present were Klein’s compound, belite, ferrite
(C4AF), calcium sulfate, and a minor amount of lime (<0.5%). However, it was found
that the normative equations could not be used to optimize the CSAB compositions,
probably because of the formation of minor amounts of other phases such as gehlenite,
and the simplistic assumption that the aluminum:iron ratio in the ferrite phase = 1.
Therefore, adjustments were made to the formulations to meet several objectives: 1)
minimize the proportion of limestone used and thus the free lime formed (CaO), 2)
maximize the proportions of byproducts (i.e. CFBC and PCC ash), and 3) produce a
cement that will approach the performance of the commercial CSAB cement. The
adjustments were made by analyzing each clinker using XRD until the desired
composition was achieved resulting in the synthesis of formulations termed “CSAB#2”
and “CSAB#4”. Figure 3-1 shows the XRD profiles of the laboratory synthesized
clinkers compared to three commercial CSAB cements: a CSAB manufactured in China,
Commercial CSAB#1, and Commercial CSAB#2.
The FBC material is a potential source of CaO and SO3 and thus was used as a partial
substitute for gypsum and limestone in the laboratory CSAB raw materials. The effects
of firing temperature were examined by XRD using the CSAB#1 clinker formulation.
The firing programs consisted of heating the raw mix at 1175°C, 1200°C, 1225°C and
1250°C for one hour each. The resulting clinkers were slowly cooled within the furnace.

34
Visually there was a progressively darker and notable volume loss with increasing firing
temperature as seen in Figure 3-2. The darkening color reflects the increased levels of
sintering.
Each clinker was milled in a ball mill along with gypsum, which is used to “activate” the
Klein’s compound to form additional ettringite during hydration. Class F fly ash was
also milled with the clinker to serve as a filler for certain formulations. The milling of
gypsum and/or fly ash with the clinker to make the final cement product is known as
“process addition”.
Figure 3-1. XRD profiles of the three laboratory synthesized clinkers compared to the
commercially available CSAB cements. K = Klein’s Compound; An = anhydrite; B =
belite (C2S).

35
Figure 3-2. CSAB clinker demonstrating color variation and mass loss based on oven-
firing temperature.
The optimum firing temperature for the FBC material based CSAB cement was chosen to
be 1250°C. At this temperature the maximum amount of Klein’s compound and belite
was formed with minimal quantities of silicosulfate, an unreactive phase (Roy, Silsbee et
al. 1999, Winnefeld and Lothenbach 2010). Table 3-1 provides a list of phases present in
the cement formulations.

36
Table 3-1. Comparison of clinker phases
Phase Composition OPC China CSAB CSAB#1 CSAB#2 CSAB#4
C4A3S` Ca4Al6O12SO4 ▬ √ √ √ √
C2S Ca2SiO4 √ √ √ √ √
C4AF Ca2(Al,Fe+3)2O5 √ ▬ √ √ ▬
CS` CaSO4 √ √ √ ▬ ▬
C CaO ▬ ▬ √ ▬ ▬
C2AS Ca2Al2.22Si.78O6.79(OH).22 ▬ ▬ ● ▬ ▬
√ = Major phase present ● = Minor phase ▬ = Not detected or trace
The first two formulations (CSAB#1 and CSAB#2) had relatively high contents of belite.
CSAB#1 was formulated using 32% FBC bottom ash, 8% Class C fly ash, 15% bauxite
and 45% limestone. The major compounds in the clinker were Klein’s compound, belite,
anhydrite, ferrite and lime. The major compounds in CSAB#2 were Klein’s compound
and belite, with only a minor amount of free lime.
The third CSAB cement formulation, CSAB#4, is comprised of limestone, bauxite and
spent bed material. Unlike CSAB#1 and CSAB#2, Class F fly ash was not added to the
raw mixture. However, it was added as a filler during mortar mixing. The CSAB#4
clinker was interground with 35% gypsum, by weight, to provide the necessary sulfate
for the formulation of ettringite (Winnefeld and Lothenbach 2010). The amount of
gypsum was calculated based on stoichiometry of ettringite formation from Klein’s
compound. The raw materials used for each formulation are shown in Table 3-2. Each
of the cement-clinker formulations were analyzed chemically to compare the major
oxides present (Table 3-3) with those that were calculated using modified Bogue

37
equations (Arjunan, Silsbee et al. 1999). The proportions of raw materials were adjusted
accordingly so the resulting clinker composition closely resembled the calculated
composition. This was done in order to achieve the phases shown in Table 3-1.
Table 3-2. CSAB cement formulations
Cement Formulations (% on a final product basis)
Raw Material CSAB#1 CSAB#2 CSAB#4 CSAB#4 FA
Clinker
Limestone 39.0 46.0 29.6 24.6
Bauxite 13.1 15.2 30.2 25.0
Gilbert FBC Spent Bed 27.7 13.1 19.6 16.3
Class F Fly Ash - 12.9 - -
Class-C PCC Fly Ash 6.9 - - -
Process Addition Gypsum 13.3 12.8 20.6 17.1
Ultra Fine Ash - - 0.0 17.1
% Coal Byproducts in Cement 40.2 38.8 40.2 50.4
Table 3-3. CSAB cement composition from XRF analysis
Cement Composition (%)
Cement SiO2 Al2O3 Fe2O3 CaO MgO Na2O K2O SO3
OPC 20.5 5.4 2.6 63.9 2.1 0.61 0.21 3.0
CSAB from China 11.12 26.94 1.76 44.99 3.18 0.04 0.19 12.23
Commercial CSAB#1 5.89 20.48 2.53 42.29 0.78 0.1 0.15 25.71
Commercial CSAB#2 14.92 16.12 1.32 48.91 1.63 0.24 0.49 15.46
CSAB#1 12.91 15.16 2.58 51.24 2.89 0.08 0.47 14.10
CSAB#2 16.90 16.95 2.39 47.10 2.25 0.15 0.68 13.52
CSAB#4 (CAER CSA) 8.21 24.30 2.59 40.02 1.32 0.14 0.62 22.30
3.3. Paste Study – Effect of Gypsum Content
Numerous hydration studies have already been done on the influence of gypsum, calcium
sulfate hemihydrate (referred to as “hemihydrate”) and anhydrite on the hydration of
CSA clinker containing C2S and C4A3Ś as main phases (Juenger, Winnefeld et al. 2011).
According to Majling, Znásik et al. (1985) anhydrite (depending on the heating

38
temperature and mechanochemical activation) is necessary for the high rate of initial
strength development. Furthermore, Shah (1991), Sahu and Majling (1994), Winnefeld
and Lothenbach (2010), Juenger (2011) and Winnefeld et al. (2011) found that ettringite
formation depends on the reactivity of the calcium sulfate used. With hemihydrate or
gypsum, ettringite formation is very intensive and can cover the aluminate phases, which
retards their hydration. Conversely with anhydrite, there is no “supersaturation” and the
hydration continues.
The effect of gypsum addition on the cement strength was determined using the CSAB#2
clinkers. Hydration of the materials was studied using paste prepared with a water:solids
ratio of 0.37 and stored at 100% relative humidity and 23°C. At specific hydration
intervals, samples of paste were obtained and analyzed using XRD. Hydration
experiments were conducted on four paste mixtures: 15%, 20% and 25% gypsum, and
20% gypsum + 1% Ca(OH)2. This latter mixture was prepared to study the influence of
lime availability on the formation of ettringite (Figure 3-3) and expansion characteristics.
Figure 3-4, Figure 3-5 and Figure 3-6 show the hydration process over a 56-day curing
period. With the addition of 5% more gypsum to the CSAB#2 clinker, from 15% to 20%,
there was more sulfate available for the continued formation of ettringite. This can be
seen by the decreasing gypsum peak with increasing time, at approximately 11.5° 2theta.
Most of the gypsum was consumed after 1-day of curing in the 15% gypsum paste,
whereas approximately a third of the peak intensity remains in the 20% gypsum paste.
Representative scanning electron microscope (SEM) images after 7-days of curing are
shown in Figure 3-4, Figure 3-5 and Figure 3-6. The 15% gypsum paste, Figure 3-4, has
ettringite crystals with an average length of 6 microns, with some areas of more crystals

39
appearing more massive and colloidal. The 20% gypsum paste, Figure 3-5, has well-
defined acicular ettringite crystals with an average length of 10 microns; with some areas
appearing massive and colloidal. The 20% gypsum 1% lime paste, Figure 3-6, contains
ettringite crystals that are mainly small and fibrous with an average length of 3 microns.
The smaller ettringite crystals in the presence of lime is consistent with the literature, e.g.
(Mehta 1973). The lime would also react with aluminum hydroxide (equation 3-3) to
form additional ettringite, which may have caused the slightly higher compressive
strength of this mortar (discussed below).
Figure 3-3. SEM image of ettringite crystals within the CSAB#2 paste, taken at 3000x
magnification.

40
Figure 3-4. XRD profiles for the hydration of the CSAB#2, 15% gypsum, cement. Gp =
gypsum; K = Klein’s Compound; B = belite; Et = ettringite. On the right, an SEM image,
under 2500x magnification, showing the formation of ettringite crystals in the CSAB#2,
15% gypsum cement after 7-days of curing.

41
Figure 3-5. XRD profiles for the hydration of the CSAB#2, 20% gypsum, cement. On
the right, an SEM image, under 2500x magnification, showing the formation of well-
defined ettringite crystals in the CSAB#2, 20% gypsum, cement after 7-days of curing.

42
Figure 3-6. XRD profiles for the hydration of the CSAB#2, 20% gypsum with 1% lime,
cement. On the right, an SEM image, under 2500x magnification, showing the formation
of ettringite crystals in the CSAB#2, 20% gypsum 1% lime, cement after 7-days of
curing.
The strength characteristics of the three cement blends, with the addition of a blend using
25% gypsum, were tested in mortar following ASTM C 109 and C 305. Figure 3-7
shows that the compressive strengths of the four blends were quite similar. The 1-day
strengths ranged between 15.9 MPa and 18.6 MPa, with the 20% gypsum mortars
producing the higher strengths. The 15% gypsum mortar started around 16.6 MPa and
gained strength steadily to 28.3 MPa after 56-days. The mortars with 20% gypsum had
the highest 1-day strength, approximately 18.6 MPa, and reached 30.0 MPa after 56-days
of curing. The addition of lime had very little influence on the strength characteristics of
the 20% gypsum mortar (Figure 3-7). The 25% gypsum mortar had the lowest 1-day
strength of 16.4 MPa and followed a similar strength-gain trend as the 15% gypsum

43
mortar. However, at 56 days of curing the mortar experienced a decrease in strength
down to 14.5 MPa. This decrease in strength results from a lack of water as seen by the
persistence of unhydrated phases in Figure 3-4, Figure 3-5 and Figure 3-6 (Bernardo,
Telesca et al. 2006). The continued strength gain for the remaining three pastes results
from the hydration of additional phases, in particular, belite (Glasser and Zhang 2001)
Figure 3-7. Compressive strength of mortar cubes using the CSAB#2 cement with the
addition of gypsum and lime.
3.4. Fabrication of Bulk CSAB Clinker Cement
The material formulation was used to create larger samples of FBC-derived CSAB
cement for mortar testing. Based on the calculated mix proportions determined from the
modified Bogue equations, the raw materials were proportioned and ground in a ball mill
to reach an approximate particle size of 16 microns. The ground mix was then placed
into zirconia crucibles and fired in an electric furnace at 1250°C for one hour and then
air-cooled. The resulting clinker was soft and required little effort to grind to cement
0
5
10
15
20
25
30
35
0 10 20 30 40 50 60
Co
mp
ress
ive
Str
en
gth
(M
Pa
)
Curing Time (days)
15% Gypsum
20% Gypsum
20% Gyp, 1% Lime
25% Gypsum

44
fineness. The ground clinker was analyzed to check that the expected phases were
present. Calcium sulfate (CaSO4) is necessary in CSAB cement to promote strength
development through the formation of ettringite (Glasser and Zhang 2001). The calcium
sulfate can be added by proportioning the CSAB clinker to contain excess CaSO4 as
anhydrite, or by intergrinding gypsum or anhydrite with the CSAB clinker; the cement
mixes within this study were fabricated by intergrinding FGD gypsum (Taylor, Famy et
al. 2001).
3.5. Strength Testing of CSAB Mortar
3.5.1. Set Time
The initial set time was established for cement mortars following ASTM C 807
procedures, and the data are shown in Table 3-4. The CSAB cement (from China)
cement mortar set earlier than OPC, but was still workable. The set time for the
laboratory CSAB cement mortars were substantially shorter than OPC and were
dependent on the content of Klein’s compound. The set time of the CSAB#4 cement
mortars ranged from approximately 70 to 90 minutes, with no discernible trend with
increasing process additions (Table 3-4).
Table 3-4. Mortar mix proportions following ASTM C 305 and C 109 protocols
Component OPC CSAB from China CSAB#1 CSAB#2 CSAB#4 CSAB#4 FA
Cement (g) 500 500 500 450 500 500
Sand (g) 1375 1375 1375 1237.5 1375 1375
Water (g) 242 242 238.8 217.8 242 215
Flow (%) 112 112 81 117 120 109
Time of set (min) 189 116 - 88 91 67
The effectiveness of retarding admixtures on initial set time of CSAB cement mortar was
conducted using Grace Recover®, which is an ASTM Type D set retarding admixture.

45
The dosages were specified based on recommendations from the manufacturer. Table 3-
5 provides the set time data for the CSAB cement from China and indicates that the
retarder was very effective in slowing the set time of CSAB cement.
Table 3-5. Effect of set retarder on the set time of CSAB, from China, cement mortar
Set Retarder Dosage
(ml/500 g cement) Initial Set (min)
0 116
0.75 180
1.5 237
3.0 330
3.5.2. Strength of Commercial CSA Cement Mortar
To establish benchmarks for strength performance, the commercial CSAB cements
described earlier were tested. Mortar cubes were prepared for the cement formulations
following ASTM C 305 and C 109 protocols. The mortar mix proportions are provided
in Table 3-4. The data for the commercially available CSAB cements are shown in
Figure 3-8. As expected for rapid-setting cements, the 1-day strength significantly
exceeded that of OPC. The rapid strength gain, accompanied by rapid heat evolution, is
characteristic of CSA cements (Glasser and Zhang 2001). This is primarily due to the
presence of a large amount of Klein’s compound, which readily forms ettringite upon
hydration. At 28-days of curing the cement from China matched the strength of the OPC
but was then surpassed by the latter. The leveling-off of strength gain for the CSAB
mortars was a result of the consumption of the available ettringite-forming compounds.
The extremely-high strength of the Commercial#1 cement is attributed to the large
amount of Klein’s compound and anhydrite available in the cement. However, the
Commercial#2 cement has a large amount of Klein’s compound but half of the available

46
anhydrite, based on peak intensity. The lesser amount of anhydrite in the cement
explains the slower strength gain after 1-day of curing compared to Commercial#1.
3.5.3. Strength of Laboratory CSA Cement Mortar
After compressive strength testing of the commercial CSA cement mortars, the laboratory
CSAB#2 clinker was interground with 20% by mas FGD gypsum and mortars prepared
according to ASTM C 109. The mortar prepared with this cement did not experience
expansive cracking but exhibited considerably lower strength than the commercial
cements (Figure 3-8), probably because it contained substantially more belite. However,
its strength gain was good and it would likely qualify as a general rapid hardening (GRH)
or medium rapid hardening (MRH) cement under ASTM C 1600 requirements. Of
particular interest is that the performance was achieved with cement that comprises
approximately 40% coal combustion byproduct.

47
Figure 3-8. Compressive strength of mortar cubes made with commercially available
CSAB cement.
The compressive strength development of CSAB#4 mortar was comparable to the CSAB
cement from China (Figure 3-9), which is not surprising since both contained a large
amount of Klein’s compound (Figure 3-1). CSAB#4 mortar cubes matched the
performance of the CSAB cement from China cubes from 1 to 7-days, and then from 28
to 112-days they greatly exceeded the CSAB cement from China cubes. The continued
strength gain exhibited by the CSAB#4 cubes can likely be attributed to the presence of
the active belite phase in the clinker. Based on ASTM C 1600, CSAB#4 would qualify
as a very rapid hardening (VRH) cement.
CSAB#4 FA produced a mortar that achieved approximately 26.2 MPa in 1 day, 31.7
MPa in 7 days and 34.5 MPa in 28 days, which meets the criteria for a VRH cement. It is
0
10
20
30
40
50
60
70
80
0 10 20 30 40 50 60
Co
mp
ress
ive
Str
eng
th (
MP
a)
Curing Time (days)
OPC
CSA from China
Commercial CSAB #1
Commercial CSAB #2

48
interesting that this cement gains strength more rapidly than the CSAB#2 formulation
despite the higher percentage of byproduct in CSAB#4 FA.
Figure 3-10 and Figure 3-11 depict the growth of ettringite crystals in the CSAB#4
mortar. Figure 3-10 is an image of ettringite crystals with an average length of 10 to 20
microns. The predominantly visible crystals formed in the space between the sand grains
and cement paste. However in the bottom-left corner of the image the outline of several
ettringite crystals can be seen within the cement paste. Figure 3-10 shows ettringite
crystals with an average length of 5 to 20 microns that have formed within the cement
paste and created a dense network of interlocking crystals and paste. The rapid-strength
gain of CSA cements can be attributed to this geometry. Figure 3-11 shows an SEM
image on the right, under 70x magnification, of the CSAB#4 mortar with grains of sand
clearly embedded in the cement paste. By increasing the magnification to 3000x and
focusing on the surface of one sand grain ettringite crystals, approximately 10 microns in
length, have melded to the surface of the sand grain, thereby bridging the interfacial zone
between the grain and the surrounding paste.
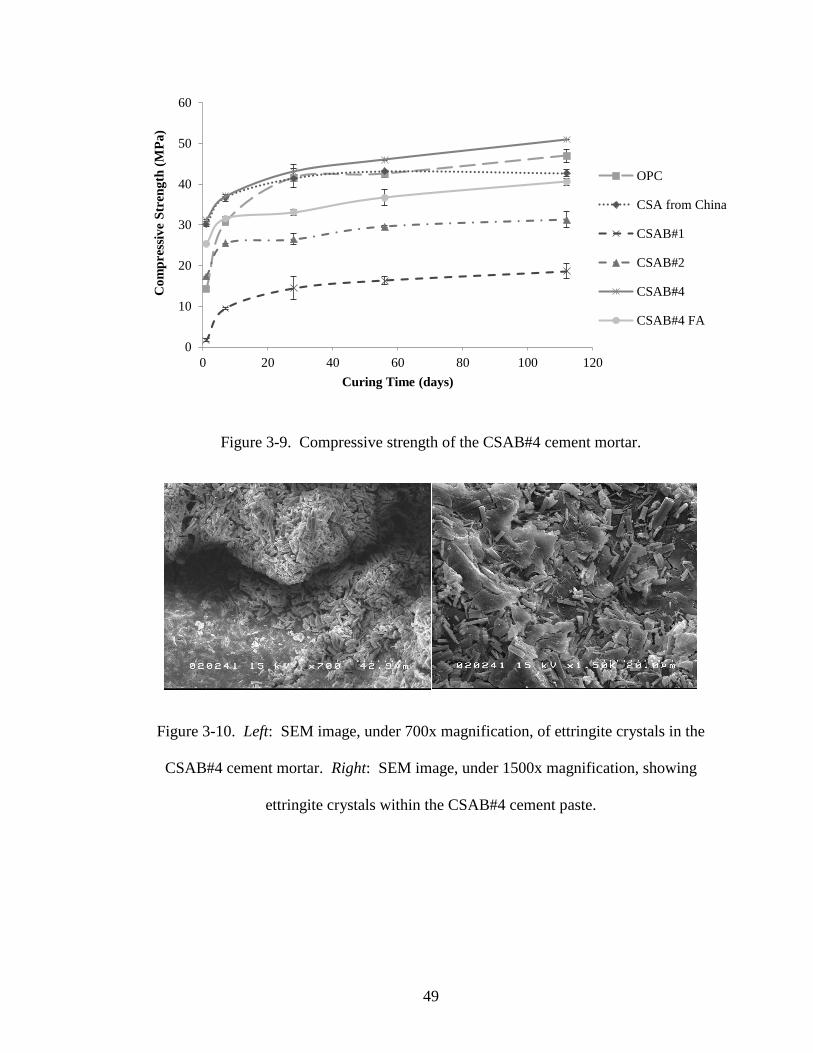
49
Figure 3-9. Compressive strength of the CSAB#4 cement mortar.
Figure 3-10. Left: SEM image, under 700x magnification, of ettringite crystals in the
CSAB#4 cement mortar. Right: SEM image, under 1500x magnification, showing
ettringite crystals within the CSAB#4 cement paste.
0
10
20
30
40
50
60
0 20 40 60 80 100 120
Co
mp
ress
ive
Str
eng
th (
MP
a)
Curing Time (days)
OPC
CSA from China
CSAB#1
CSAB#2
CSAB#4
CSAB#4 FA
50
Figure 3-11. SEM image of the CSAB#4 cement used in mortar with sand grains clearly
embedded in the paste; with a zoomed view of the sand grain surface.
3.6. Conclusions
The FBC material has potential for use in the production of calcium sulfoaluminate belite
cements. The utilization of the FBC spent bed material in CSAB cement shows potential
as a large-volume use for the material. Heating FBC bottom ash, PCC fly ash, limestone
and bauxite at 1250°C (about 200°C lower than that used for portland cement clinker),
produced a large quantity of Klein’s compound and belite (Juenger, Winnefeld et al.
2011). The FBC ash provides needed calcium sulfate and, particularly, calcium oxide.
The calcium oxide within the ash is an effective substitute for limestone, which is
required as a raw material for CSAB cement clinker. In fact, if changes in the FBC
combustion process were to result in substantially less lime in the spent bed material, its
value as a CSAB clinker raw material would be limited since FGD gypsum would
provide a more concentrated and refined source of calcium sulfate.
51
The synthesized CSAB clinkers were soft and readily milled to cement fineness. Milling
the clinker with FGD gypsum was effective in providing the additional calcium and
sulfate required to “activate” the clinker to form ettringite. The compressive strength of
the commercial and laboratory CSAB cements produced high-early strengths that
exceeded those of ordinary portland cement. Additional long-term strength was possibly
provided by hydration of dicalcium silicate (C2S) within the clinker.
Milling the laboratory CSAB clinker with Class F fly ash, in additional to FGD gypsum,
appeared to improve the dimensional stability of CSAB mortar. In every cement that
contained fly ash addition, destructive expansion did not occur and drying shrinkage
improved. However, fly ash addition generally decreased the compressive strength,
although the water reduction achieved with the fly ash, helped to offset this. Future work
will focus on optimizing the quantity of fly ash addition to provide maximum water
reduction benefits and minimize the strength loss.
A major issue regarding the production of CSAB cement is one of cost. Because CSAB
clinker production requires substantial quantities of bauxite, the cost of these cements is
high. In order to minimize or eliminate bauxite, alternatives to this raw material need to
be pursued. The replacement of some bauxite with high-iron raw materials could have
the net effect of replacing some of the aluminum with iron, which is considerably less
expensive. Thus, future research should focus on the use of high-iron materials, such as
certain Class F fly ashes and/or red mud, as partial replacements for bauxite.

52
CHAPTER 4 : INTERFACIAL BOND BETWEEN REINFORCING FIBERS AND
CSA CEMENTS: FIBER PULLOUT CHARACTERISTICS
4.1. Introduction
This chapter presents the results of an experimental investigation on the influence of the
interfacial bond of reinforcing fibers embedded in a calcium sulfoaluminate matrix on the
fiber-pullout peak load and energy consumption. Bonding at the fiber-matrix interface
plays an important role in controlling the mechanical performance of cementitious
composites. In particular, composites formed from sulfate-based systems, i.e. calcium
sulfoaluminate cements (CSA), as opposed to the silicate systems found in portland
cement.
The primary reason for the addition of fibers to cementitious matrices is to delay and
contain cracking (Naaman et al., 1991; ACI 5445R-10, 2010). While it is generally
believed that the inclusion of fibers enhances the pre-cracking behavior of cement
composites by increasing its cracking strength, the effect of fiber addition becomes
evident only after cracking (Naaman et al., 1991; Lin and Li, 1997; ACI 5445R-10,
2010). Fibers bridge the cracked parts of the matrix, thus delaying sudden global failure
of the composite (Lin and Li 1997). Therefore, in the post-cracking stage the fiber
behavior is governed by the interfacial bond stress response as being subjected to pull-out
loads (Naaman et al., 1991). The bond between fiber and matrix is important, if fibers
have a weak bond with the matrix they can slip out at low loads and do not contribute to
preventing the propagation of cracks. However, if the bond is too strong then the fibers
may rupture before they can contribute to the post-crack strength of the matrix material.
53
Fiber-reinforced composites (FRC) resist tensile forces through a composite action,
whereby part of the tensile force is resisted by the matrix, while the balance is taken by
the fibers (Naaman et al., 1991). The transmission of forces between the fiber and the
matrix is achieved through a bond defined as the shearing stress at the interface between
the fiber and the surrounding matrix (Naaman et al., 1991). The fiber contribution to
increasing the toughness (total energy absorbed with a unit mJ) of the composite is
primarily dictated by the mechanisms of fiber pullout (Naaman et al., 1991; Brown et al.,
2002). Fiber pull-out tests are often used to study the fiber-matrix bond behavior in fiber
reinforced cement composites. This test simulates the fiber bridging-pull-out mechanism
during the fracture process of FRC (Wang et al., 1988). In relating pullout test results
with the fiber-matrix bond characteristics, numerous studies have been completed to
demonstrate the reliability of the data (Bentur et al., 1989; Naaman et al., 1991; Herrera-
Franco and Drzal, 1992; Betterman et al., 1995; Mobasher and Cheng, 1996; Zucchini
and Hui, 1996; Wille and Naaman, 2012).
Composites made with brittle fibers, such as steel, and brittle matrices, i.e. calcium
sulfoaluminate (CSA) cement, can exhibit high fracture toughness when failure occurs
preferentially along the interface before fibers fracture. Most of the important
toughening mechanisms are a direct result of the interface-related shear failure which
gives rise to an improved energy absorption capability with a sustained crack growth
stability through crack surface bridging and crack tip blunting (Li and Stand, 1997). The
prevalent type of cracking depends on the properties of the interface relative to the fiber
and matrix (Kim and Mai, 1998). According to Kim and Mai (1998), when a crack
approaches an isolated fiber, the following failure mechanisms may be expected to take

54
place: 1) fiber-matrix interface debonding; 2) post-debonding friction; 3) fiber fracture;
4) stress redistribution and 5) fiber pullout.
The cement-fiber interfacial bond results from some combination of mechanical
interlocking of cement hydration products with the fiber surface and chemical reaction
between fiber and cement paste within the interstitial transition zone (Kim and Mai,
1998; Brown et al., 2002; Chan and Chu, 2004; Markovic, 2006). In FRC materials, the
principal factor governing load transfer from the matrix to the fiber is shear strength of
the interfacial bond between the two components. Fractured specimens of fiber-
reinforced concrete shows that failure takes place primarily due to fiber pullout or
debonding. Generally fiber pullout rather than rupture confers a larger ductility to the
fiber reinforced composites (Li and Stang, 1997; Lin and Li, 1997). Unlike plain
concrete, a fiber-reinforced concrete specimen does not break immediately after initiation
of the first crack; thereby increasing the work of fracture, or toughness. Within the
cracked section, the matrix does not resist any tension and the fibers carry the entire load
applied to the composite. With an increasing load on the composite, fibers will tend to
transfer additional stress to the matrix through bond stresses. If these bond stresses do
not exceed the bond strength, then there may be additional cracking in the matrix. This
process of multiple cracking will continue until either the fibers fail or accumulated local
debonding will lead to fiber pullout (Shah, 1991; Mehta and Monteiro, 2006).
The principal phases of CSA clinker are 4CaO•3Al2O3•SO3 (C4A3Ś), also called Klein’s
compound or yeelimite, Ca2SiO4 (C2S) or belite, and C4AF (or brownmillerite) (Arjunan
et al., 1999). Other phases such as calcium aluminates (e.g. C12A7 or C11A7CaF2) are
sometimes present. Unlike portland cement which gains its strength from the hydration

55
of calcium silicates, alite (C3S) and belite (C2S), CSA cement gains strength from the
hydration of Klein’s compound with calcium sulfate (such as gypsum CŚH2 or anhydrite
CŚ) to form ettringite via these reactions (Marroccoli et al., 2007):
C4A3Ś + 2CŚH2 + 34H → C6AŚ3H32 + 2AH3
C4A3Ś + 2CŚ + 38H → C6AŚ3H32 + 2AH3
These reactions are relatively fast, and are nearly complete within 1 month. When the
sulfate anion is depleted, ettringite C6AŚ3H32 (AFt phase) is converted to monosulfate
C4AŚH12 (AFm phase or “mono” phase) which reduces the strength of the cement (Ikeda,
1980).
4.2. Research Significance – Chapter 4
Calcium sulfoaluminate cements present considerable environmental advantages
compared to portland cement because of lower production energy, lower CO2 emissions
and use of coal combustion wastes as raw materials. Although there is sufficient
information on the performance of CSA systems; there is a lack of research that
characterizes the bond properties of fibers in these cements. Therefore this paper
presents the development of CSA-fiber interfacial bond characteristics in the context of
material design under the guidance of micro-mechanical tools. Specifically, this study
illustrates how the fiber-matrix interface is enhanced by the use of sulfate-based cements
when compared to silicate-based systems; providing some guidance in properly selecting
a combination of fiber and matrix that provides efficient bond strength.

56
4.3. Experimental Results and Discussion
4.3.1. Single-Fiber Pullout Test
Tests were performed using single fibers to compare the pullout (direct tension)
resistance and energies consumed during debonding and pullout of PVA, PP and steel
fibers. Results of the single-fiber pullout test indicated increased peak stress and energy
consumption for CSA-based cements than results obtained with an ordinary portland
cement, Table 4-1. Load-position curves were very different between the four fiber types
as seen in Figure 4-1. The 3-way ANOVA indicated the peak-stress test data varied
statistically (α = 0.05) according to cement type (P<0.01), fiber type (P<0.01) and days of
curing (P<0.01), but that the type of cement and days of curing interaction did not vary
statistically. The statistical analysis demonstrated a significant interaction between the
fiber type and days of curing; also between cement type and fiber type. Additionally, for
the pullout-energy consumption the 3-way ANOVA indicated test data varied statistically
according to fiber type (P<0.01), days of curing (P<0.01), but that the type of cement
interaction did not vary statistically. The statistical analysis demonstrated a significant
interaction between cement type and fiber type; with less significance between fiber type
and days of curing. The steel fibers showed overall higher peak load and energy
consumption than the polypropylene and PVA fibers (P<0.01) in all three cement types.

57
Table 4-1. Peak load (N) and energy consumption values (mJ)
Cement Time
(days)
Peak Load, N (lbf) Energy Consumption mJ (in-lbf)
PVA PP Steel PVA PP Steel
OPC
1 1.0 (0.2) 6.6 (1.5) 9.9 (2.2) 0.93 (.008) 25.77 (.228) 48.76 (.432)
7 3.6 (0.8) 11.4 (2.6) 15.7 (3.5) 1.97 (.017) 45.12 (.399) 34.49 (.305)
21 3.6 (0.7) 10.9 (2.5) 24.6 (5.5) 5.23 (.046) 40.76 (.361) 88.89 (.787)
28 3.9 (0.9) 4.9 (1.1) 31.0 (7.0) 3.99 (.035) 16.78 (.149) 88.48 (.783)
56 11.1 (2.5) 9.6 (2.2) 18.5 (4.2) 4.37 (.039) 26.99 (.239) 70.33 (.622)
Comm.
CSAB
1 2.0 (0.4) 8.5 (1.9) 11.1 (2.5) 5.53 (.049) 25.28 (.224) 30.64 (.271)
7 6.2 (1.4) 11.9 (2.7) 56.9 (12.8) 6.68 (.059) 50.19 (.444) 107.39 (.950)
21 5.1 (1.1) 7.1 (1.6) 61.8 (13.9) 6.30 (.056) 22.59 (.200) 173.98 (1.54)
28 5.6 (1.3) 9.3 (2.1) 67.7 (15.2) 3.36 (.030) 23.84 (.211) 109.85 (.972)
56 4.2 (0.9) 11.8 (2.7) 56.6 (12.7) 3.83 (.034) 42.62 (.377) 74.33 (.658)
CAER
CSAB
1 1.2 (0.3) 6.1 (1.4) 25.3 (5.7) 0.97 (.009) 22.01 (.195) 99.45 (.880)
7 1.7 (0.4) 9.8 (2.2) 33.6 (7.6) 3.85 (.034) 33.61 (.297) 115.24 (1.02)
21 4.6 (1.0) 6.9 (1.6) 46.4 (10.4) 4.72 (.042) 16.71 (.148) 114.28 (1.01)
28 6.0 (1.3) 5.2 (1.2) 77.4 (17.4) 6.36 (.056) 16.78 (.149) 181.05 (1.60)
56 4.4 (1.0) 7.8 (1.8) 55.8 (12.5) 7.06 (.062) 21.81 (.193) 126.05 (1.12)
Figure 4-1. Typical load-displacement curves for each fiber type.

58
4.3.2. PVA Fiber
Breaking of the chemical bond is evident in the first significant load drop, in a typical
single PVA-fiber pullout curve. It is hypothesized that the second increase in load with
fiber pullout results from a slip hardening affect; this behavior is achieved through
multiple cracking of the reinforced matrix (Redon et al., 2001; Wille and Naaman, 2012).
However, as the matrix continues to hydrate and chemically bond to the fiber surface,
fiber failure is experienced more often and is seen as a truncation in the load curve. This
type of failure occurs when the fiber-matrix bond strength is greater than the tensile load
capacity of the fiber, thus the fiber ruptures in the fiber-free zone or debonded region of
the fiber.
The use of PVA fibers has caused the mechanism of failure to change. The strong bond
between the hydrophilic fiber and matrix has caused the failure site to move from the
fiber surface to the more porous matrix region, creating multiple cracks (Chu et al.,
1994). The porous region is most likely more brittle by comparison with the ductile
interfacial layer with steel fibers (Chu et al., 1994). Another possibility is the shear load
will focus on the fiber itself causing the fiber to rupture. Fiber surfaces were observed
with a scanning electron microscope (SEM) (Hitachi S-4800) to determine mechanical-
bond characteristics that can be related to the data collected from the fiber pullout test
(Figure 4-2).

59
Figure 4-2. Clusters of ettringite crystals adhered to a single PVA fiber after 3-days of
curing.
4.3.3. Polypropylene Fiber
A typical single polypropylene-fiber pullout curve shows a broad curve with a large area
below the curve, demonstrating the PP fiber’s ability to increase the toughness of the
composite (Figure 4-1). PP fibers do not chemically bond to the surrounding matrix, they
are hydrophobic and non-polar; therefore the fiber separates from the matrix in an
adhesive (no matrix phase residue on the fiber) manner (Hertzberg, 1996; Brogren and
Karlsson, 1997). The surface morphology of PP fibers allow for surface irregularities
ideal for matrix bonding; in addition to the potential for increased frictional loading
during fiber pullout, due to the valley-and-ridge structure on the fiber surface (Figure 4-
3).
Magnification:
500x
Magnification: 3500x

60
Figure 4-3. Left: Polypropylene fiber after the pullout test. Right: Surface of fiber with
valley-and-ridge structure.
4.3.4. Steel Fibers
A typical single steel fiber pullout curve displays high peak loads, relative to PVA and PP
fibers along with a shallow-sloping curve, indicative of slip hardening; and a large energy
consumption (Figure 4-1). The coated-steel fibers are coated with copper for corrosion
resistance as stated by the manufacturer's product specifications. A SEM analysis of the
fiber surface after a pullout test revealed the copper coating provided a preferential
bonding surface for hydration products (Figure 4-4). High peak loads with the steel
fibers are attributed to the copper coating and surface roughness (Stengel, 2010; Wille
and Naaman, 2012). Hydration products likely formed a complex with copper in the
surface (as well as copper ions in solution), to form a strong bond (Chu et al., 1994).
This bond allowed the interfacial layer of the matrix to remain bonded to the fiber during
pullout.

61
Figure 4-4. SEM images of a copper-coated steel fiber: (A) Copper coating peeled from
fiber surface; (B) Fiber end with crack in copper coating; (C) Zoomed image of crack
with defined boundary between copper coating and steel surface.
4.4. Peak Load Analysis
4.4.1. Ordinary Portland Cement
The steel fibers demonstrated the highest overall bonding strength from 7 to 56 days of
curing, 31.0 N (7.0 lbf); represented by the peak-load data in Figure 4-5. However, the
polypropylene fibers exhibited greater bond strength after one day of curing, 6.6 N (1.5
lbf). As the ordinary portland cement (OPC) matrix continued to gain strength it also
increased in stiffness; therefore, the fiber that exhibits a similar stiffness, would yield
higher peak load. Similar to steel fibers, PVA fibers also have a high modulus of
elasticity and show resistance to stretching. The PVA fibers achieved a maximum peak
load of 11.1 N (2.5 lbf) at 56 days of curing. After 21-days of curing the fiber-rupture
rate increased, as expected, with increasing stiffness of the matrix and fiber-matrix bond.
This is a similar trend exhibited by the CSAB cements that will be discussed in the
following sections. The SEM images in Figure 4-6 indicate the fibers were completely

62
pulled from the matrix since there was no indication of failure along the fiber tip. There
are particles attached to the fibers which indicate the presence of bonding between fiber
and matrix; as compared to the surface of the fiber before they were embedded in the
matrix.
Figure 4-5. Peak load development of PVA, PP and steel fibers embedded in an OPC
matrix; standard error of the mean are indicated for each column.
1
10
100
1000
1 7 21 28 56 112
Pea
k L
oad
(N
)
Time (Days)
PVA
PP
Coated Steel
Plain Steel

63
Figure 4-6. SEM images of fibers pulled from the OPC matrix (500x magnification): (A)
PVA; (B) PP; (C) Steel.
Calcium silicate hydrate (C-S-H) grains form a fibrous, or fibrillar, morphology within
the hardened paste (Neville, 1995; Richardson, 1999). These grains help form the
interfacial bond between the fiber and surrounding matrix. However they are thin and do
not form an extremely dense structure as seen within an ettringite-based matrix. The
PVA fiber in Figure 4-6a demonstrates the preference for bonding to this type of fiber.
PVA fibers easily form a complex cluster with available metal hydroxide ions, and in
some cases bond to the matrix through the interfacial transition zone by a layer of
calcium hydroxide, Ca(OH)2 (Horikoshi et al., 2008).
4.4.2. Commercial CSAB Cement
The main hydration product of CSA is ettringite, which precipitates together with
amorphous Al(OH)3 until the available calcium sulfate is consumed after 1 – 2 days of
hydration. Afterwards, monosulfate is formed. However the microstructure of CSA
cement is denser than portland cement even after 16 hours of hydration. The dense
structure and acicular nature of ettringite crystals aids the increased bond strength
development (Figure 4-7). Whereas, OPC hydration products form layers of C-S-H gel

64
and calcium hydroxide crystals on the fiber surface; a minor amount of a phase near the
composition of ettringite forms during early hydration stages (Taylor, 1997).
Figure 4-7. SEM image of the matrix morphology for the commercial CSAB cement.
The steel fibers have the highest overall bonding strength from 1 – 56 days of curing, as
represented by the peak loads (Figure 4-8). The PP fibers exhibit an increasing peak load
from 3 hours to 56 days with a maximum load of 12 N (2.7 lbf) attained at 7 and 28 days
of curing. PVA fibers achieved a maximum peak load of 6.2 N (1.4 lbf) at 7 days of
curing. One reason for the lower peak loads with PVA fibers is from the crystallization of
hydrated phases at nucleation sites on the fiber surface (Cadek et al., 2002; Bin et al.,
2006; Naebe et al., 2008). The associated stronger bond moves the failure mode from the
cement matrix into the fiber itself, resulting in rupture. Table 4-1 shows a decrease in
pullout strength and toughness after 28-days of curing. This is attributed to the hydration
mechanics of CSA cement in which the matrix has increased in density and strength to a
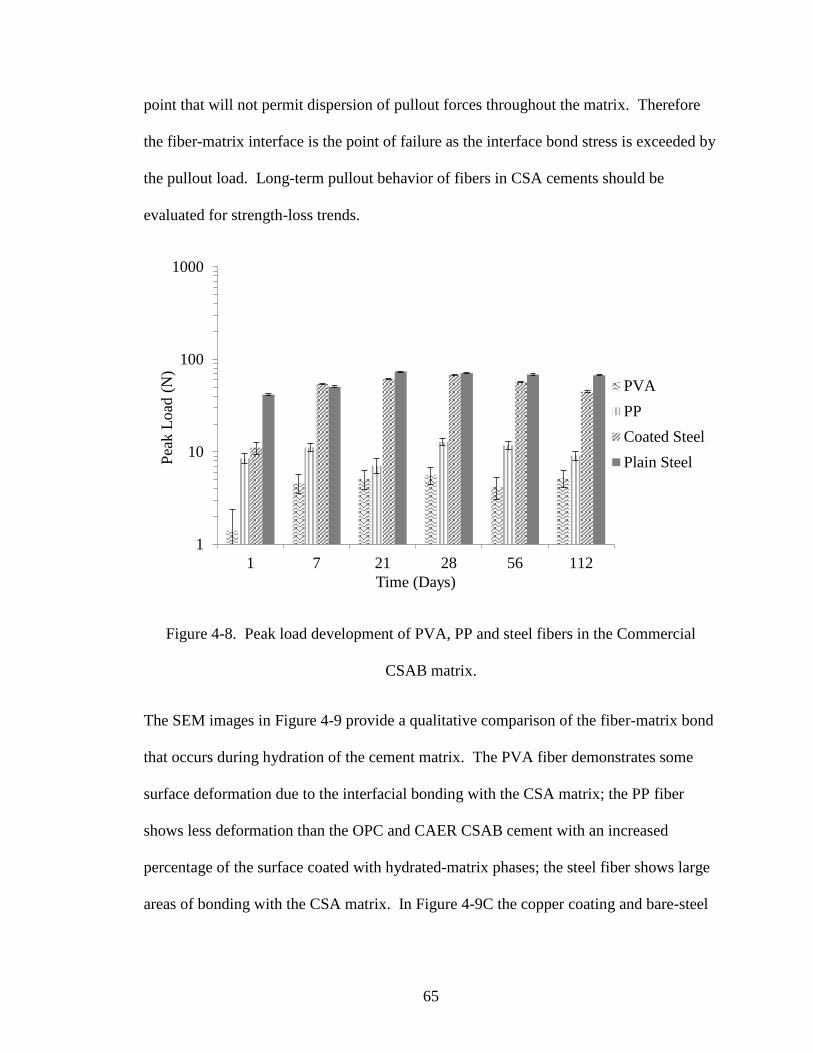
65
point that will not permit dispersion of pullout forces throughout the matrix. Therefore
the fiber-matrix interface is the point of failure as the interface bond stress is exceeded by
the pullout load. Long-term pullout behavior of fibers in CSA cements should be
evaluated for strength-loss trends.
Figure 4-8. Peak load development of PVA, PP and steel fibers in the Commercial
CSAB matrix.
The SEM images in Figure 4-9 provide a qualitative comparison of the fiber-matrix bond
that occurs during hydration of the cement matrix. The PVA fiber demonstrates some
surface deformation due to the interfacial bonding with the CSA matrix; the PP fiber
shows less deformation than the OPC and CAER CSAB cement with an increased
percentage of the surface coated with hydrated-matrix phases; the steel fiber shows large
areas of bonding with the CSA matrix. In Figure 4-9C the copper coating and bare-steel
1
10
100
1000
1 7 21 28 56 112
Pea
k L
oad
(N
)
Time (Days)
PVA
PP
Coated Steel
Plain Steel

66
fiber boundary is shown; the copper coating in the lower half of the image is completed
covered with hydrated-matrix phases.
Figure 4-9. SEM images of fibers pulled from the Commercial CSAB matrix (500x
magnification): (A) PVA; (B) PP; (C) Steel.
4.4.3. CAER CSAB Cement
The CAER CSAB cement is rich in Klein's compound, which in the presence of flue-gas
desulfurization (FGD) gypsum hydrates rapidly to form ettringite. The CAER CSAB
cement differs from commercially available CSA cement in that the ettringite crystals
formed are longer and more slender; allowing for a tighter-interwoven network of
crystals (Figure 4-10). This explains the increased bonding strengths seen in Figure 4-11
as compared to the commercial CSAB cement in Figure 4-5. The steel fibers exhibited
higher peak loads as compared to the PP and PVA fibers. As previously mentioned, the
increased pull-out load may be attributed to the influence of copper-coating on the bond
between steel fibers and cement matrix.
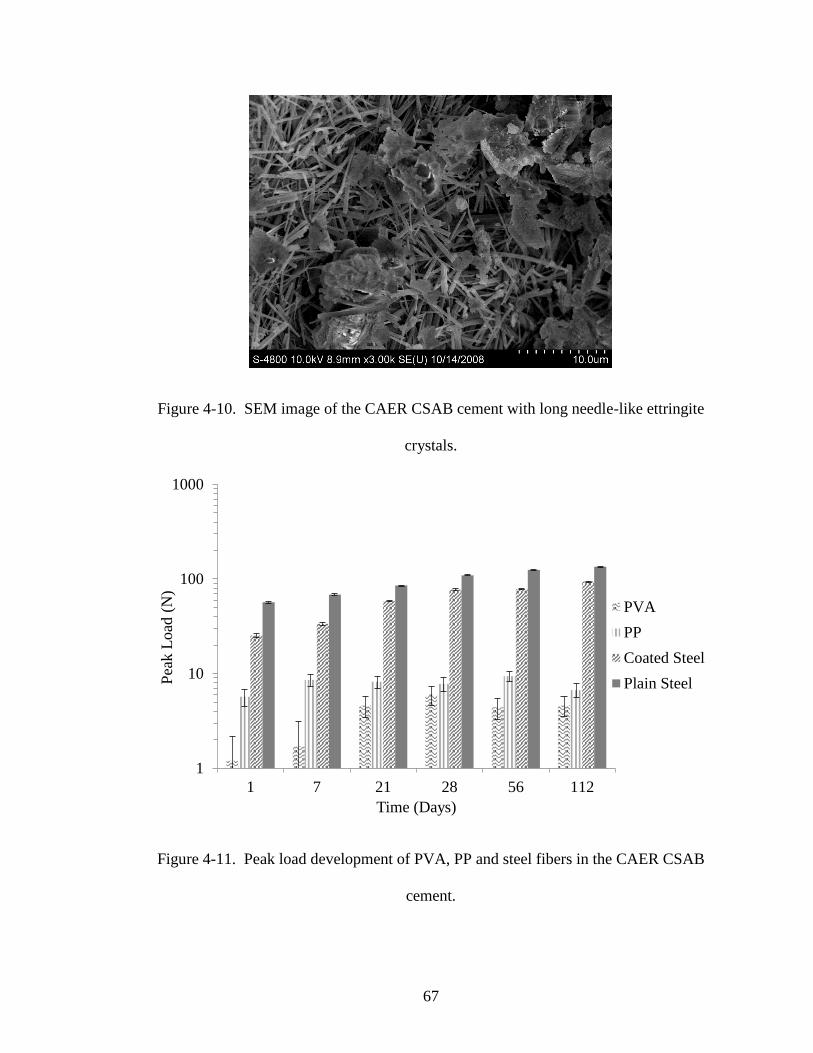
67
Figure 4-10. SEM image of the CAER CSAB cement with long needle-like ettringite
crystals.
Figure 4-11. Peak load development of PVA, PP and steel fibers in the CAER CSAB
cement.
1
10
100
1000
1 7 21 28 56 112
Pea
k L
oad
(N
)
Time (Days)
PVA
PP
Coated Steel
Plain Steel

68
The SEM images in Figure 4-12 demonstrate the increased fiber-matrix bond. The PVA
fiber shows a high level of deformity when compared to its original form; sections of
fiber have been pulled from the original structure providing evidence of a strong bond
between the fiber and surrounding matrix. The PP fiber shows a minor degree of
deformity with voids and impressions filled with hydrated-cement phases; the steel fiber
was covered by greater than 90% of matrix material bonded to the surface, or copper
layer.
Figure 4-12. SEM images of fibers pulled from the CAER CSAB matrix (500x
magnification): (A) PVA; (B) PP; (C) Steel.
4.5. Energy Consumption Analysis
Energy consumption corresponding to the single-fiber pullout test refers to energy
absorbed in the debonding process which corresponds to the area under the load-
displacement curve (Lin and Li, 1997). The energy consumption was determined with
the Instron machine operating software, “Partner”.
4.5.1. Ordinary Portland Cement
The plain-steel fibers obtained the highest overall energy consumption from 1 to 112
days of curing, with a maximum of 172 mJ at 28 days; as seen in Figure 4-13. The

69
coated-steel fibers did not reach the peak loads of the plain-steel fiber, however the
results followed a similar trend. The PP fibers exhibited the highest energy consumption,
45.12 mJ at 7 days of curing. PVA fibers achieved a maximum energy consumption of
5.23 mJ at 21-days. The early-age (1 to 7 days) pullout tests yielded the best results with
the softer PP fiber, in which the bond between the fiber and matrix was sufficiently
strong enough to transfer the excess energy into the matrix. However as the matrix
continued to gain strength at 21 to 56 days of curing the harder steel fibers were able to
sustain the increased load for the entire fiber debonding process. After 21 days of curing
the fibers with a higher modulus of elasticity have a tendency to exhibit higher energy
consumption.
Figure 4-13. Energy consumption development of PVA, PP and steel fibers in the OPC
matrix.
1
10
100
1000
1 7 21 28 56 112
Ener
gy C
onsu
mpti
on (
mJ)
Time (Days)
PVA
PP
Coated Steel
Plain Steel

70
Strands of PP fiber that appear to have peeled away from the main fiber body highly
influence the large energy consumption exhibited by this type of fiber. In addition to the
fiber-matrix bond, which appears minimal when compared to the matrix remnants bonded
to the PVA and steel fibers, as the strands of PP are peeled away they add to the energy
consumption by enhancing frictional stresses during loading. The plastic nature of the PP
fiber prevents catastrophic failure from occurring; alternatively a broad stress-strain curve
is produced.
4.5.2. Commercial CSAB Cement
The steel fibers obtained the highest overall energy consumption from 1 to 56 days of
curing with a maximum of 173.98 mJ (1.54 in-lbf) attained at 21 days, Figure 4-14. The
PVA fibers achieved a maximum energy consumption of 6.68 mJ (0.059 in-lbf) after 7
days of curing. PP fibers attained a maximum energy consumption of 50.19 mJ (0.444
in-lbf) after 7 days of curing. The decrease in energy consumption after 1 and 7 days of
curing, for the PP fibers, may be attributed to a decrease in ductility with increasing
hydration of Klein’s Compound to form ettringite, thereby forming an extremely dense
matrix structure.

71
Figure 4-14. Energy consumption development of PVA, PP and steel fibers in the
Commercial CSAB cement.
4.5.3. CAER CSAB Cement
Similar to the Commercial CSAB cement the steel fibers exhibited the highest overall
energy consumption from 1 to 56 days of curing with the CAER CSAB cement, with a
maximum of 181.05 mJ attained at 28 days (Figure 4-15). The PP fiber had a decreasing
trend with time, correlating to a decrease in peak load. This may be attributed to an
abundance of Klein’s compound in the CAER CSAB cement which will hydrate to form
a larger volume of ettringite than the Commercial CSAB cement.
1
10
100
1000
1 7 21 28 56 112
Ener
gy C
onsu
mpti
on (
mJ)
Time (Days)
PVA
PP
Coated Steel
Plain Steel

72
Figure 4-15. Energy consumption development of PVA, PP and steel fibers in the CAER
CSAB cement.
Fibers with a high Young’s modulus showed an overall increase in energy consumption
for each of the pullout test days, including the PVA fiber. Though results were not as
high as those attained with steel fibers, the PVA fiber reached a maximum energy of 3.85
mJ at 7 days of curing; and sustained an energy consumption of around 7 mJ out to 56
days of curing. The leveling-off of maximum energy after 7 days for PVA fibers is
directly associated with an increased percentage of fibers that ruptured during pullout.
4.6. Statistical Analysis
A statistical analysis was performed to determine any significance of the effects
measured for the following experimental responses: the peak load corresponding to the
maximum load supported by the fiber at the point before debonding; the total energy
consumption during the pullout process that corresponds to the region below the load-
1
10
100
1000
1 7 21 28 56 112
Ener
gy C
onsu
mpti
on (
mJ)
Time (Days)
PVA
PP
Coated Steel
Plain Steel

73
displacement curve (Chanvillard and Aitcin, 1996). Based on the Box-Cox
transformation technique, the data was log transformed (Box and Cox, 1964). This
reduced variance heterogeneity and made the data more symmetric, thus justifying the
use of ANOVA inference methods on the transformed data.
Consistent with the Box Cox log transformation, the summaries of peak load and energy
consumption visualized in Figures 4-5, 4-8, 4-11, 4-13, 4-14 and 4-15 are displayed on a
logarithmic scale. Specifically, for the transformed data, mean plus/minus standard error
of the mean were calculated and transformed back to the original scale. Thus, the
original magnitudes can be seen directly from the figures, but at the same time, it is
possible to validate the appropriateness of the statistical inference which was based on
the transformed data.
4.6.1 Peak Load
Table 4-1 displays the transformed mean-loads obtained for each peak load for each of
the 45 studied configurations. Table 4-2 gives the results of the ANOVA of the peak
load data. From the table it can be concluded that the cement, fiber, cement-fiber
interaction, day and fiber-day interaction have been shown to have a statistically
significant effect.

74
Table 4-2. Analysis of variance on peak load
Source DF Type III
SS
Mean
Square F Value Pr > F
Cement 2 8.805 4.402 16.96 <.0001
Fiber 2 200.921 100.461 386.98 <.0001
Cement*Fiber 4 7.644 1.911 7.36 <.0001
Day 4 23.386 5.847 22.52 <.0001
Cement*Day 8 2.398 0.300 1.15 0.3292
Fiber*Day 8 12.609 1.576 6.07 <.0001
Cement*Fiber*Day 16 6.514 0.407 1.57 0.0814
4.6.2. Pullout Energy Consumption
Table 4-1 displays the mean energy consumption during the pullout process for each of
the configurations studies, and Table 4-3 gives the results of the ANOVA for the energy
consumption. From the table it can be concluded that the fiber, day, cement-fiber
interaction and fiber-day interaction variable have been shown to have a statistically
significant effect.
Table 4-3. Analysis of variance on energy consumption
Source DF Type III
SS
Mean
Square F Value Pr > F
Cement 2 4.099 2.050 3.50 0.0321
Fiber 2 380.025 190.012 324.88 <.0001
Cement*Fiber 4 8.109 2.027 3.47 0.0094
Day 4 12.631 3.158 5.40 0.0004
Cement*Day 8 5.230 0.654 1.12 0.3533
Fiber*Day 8 12.684 1.586 2.71 0.0077
Cement*Fiber*Day 16 14.810 0.926 1.58 0.0773

75
4.6.3. Synthesis of the Statistical Analysis
To summarize the significant effects for peak load the cement type, fiber type, days of
curing and the interaction between cement and fiber type were highly significant. For
energy consumption the fiber type, days of curing, interaction between cement and fiber
type, and the interaction between fiber type and days of curing were highly significant.
The fiber type and days of curing always plays an important role when evaluating
behavior of the fiber with respect to all variables. Table 4-4 summarizes the significant
effects for each variable under study. The interaction between cement and fiber also
plays an important role when evaluating the peak load and energy consumption.
Table 4-4. Synthesis of statistical analysis
Variable Highly Significant Less Significant
Peak Load C; F; D; C x F C x F x D
Energy Consumption F; D; C x F, F x D C x F x D
C = cement type; F = fiber type; D = days of curing
In comparing the significant variables between peak load and energy consumption the
cement played a key role in the peak load; which contributes to the significance of the
cement-fiber interaction. The type of cement and cement-fiber interaction played a key
role in influencing the peak load analysis of the pullout test. The type of cement was not
significant for the energy consumption; instead the type of fiber, days of curing, cement-
fiber interaction and fiber-day interaction played a key role in the pullout test. Fiber type
was instrumental in sustaining toughness of the composite beyond the peak load of the
pullout test. However, the fiber type that achieved the largest toughness was dependent
on the right type of cement interaction.

76
4.7. Conclusions
The bonding characteristics of three fiber types and three different types of cement were
examined. The single-fiber pullout test was used to quantify peak load and energy
consumption; SEM analysis provided a qualitative comparison of the physical bonding
characteristics for the fibers and matrix. As evident from this study the ability to transfer
interfacial stress from fiber to matrix is an important factor in bond strength. The more
rigid-dense ettringite crystal structure yielded higher peak loads and larger energy
consumption. Thin-fibrous C-S-H structures of the OPC matrix provided good bonding
properties, which equated to large maximum peak loads. However, unable to resist
debonding-shear stresses the thin C-S-H structure resulted in a fiber-matrix bond with
small energy consumption. Pull-out test results indicated the following:
Peak load and pullout-energy consumption differed significantly according to the
fiber type, days of curing and the interaction between fiber type and type of
cement. The steel fibers showed higher peak load and energy consumption than
the PP and PVA.
High Young’s modulus fibers achieved larger failure loads and energy
consumption within a CSA-matrix throughout the curing regime. However this
result is only true in an ordinary portland cement matrix after 7 days of curing.
Low modulus fibers, i.e. PP, are best suited to resist pullout forces in an OPC
system at early ages of curing < 7 days. This is attributed to the soft-physical
nature of the fiber which is susceptible to deformation from delamination; which
in turn increases the frictional-shear resistance to pullout loads.
77
Evidenced from the pullout test PVA fibers have a significantly lower strain
capacity than the PP and steel fibers. Despite complete debonding the decreased
strain capacity is attributed to a high-strength chemical-bond to the matrix with
failure occurring near the fiber tip, close to the onset of shear-crack propagation.
A statistical analysis of peak load and energy consumption data was performed with the
ANOVA test. Results indicated:
The importance of cement type, fiber type and curing time on the peak load data
obtained from the pullout test.
The interaction between cement and fiber type was highly significant indicating
performance will either improve or diminish based on the combination of these
two variables.
Cement type was not highly significant for energy consumption as compared to
the significance of fiber type and days of curing.
Energy consumption was greatly influenced by the cement-fiber interaction. This
was demonstrated by comparing the pullout test data between OPC and CSAB
cement with fibers of varying elastic moduli.
In summary, the CAER CSAB cement, fabricated from CCBs, demonstrated optimum
bonding characteristics with both steel and PVA fibers; optimum with regards to
maximum peak load and energy consumption. However, PP fibers demonstrated
optimum bonding within the Commercial CSAB cement. Cements that produce rapid-
high early strengths, such as CSA cements, are most compatible with fibers that exhibit a
high modulus of elasticity. The known performance characteristics of reinforcing fibers

78
in an OPC system do not reflect the performance of the same fibers in a CSA cement
system. This is supported by the results of the ANOVA indicating the cement-fiber
interaction is highly significant for both peak load and energy consumption.
79
CHAPTER 5 : INFLUENCE OF CEMENT TYPE ON MULTIPLE CRACKING
BEHAVIOR IN FIBER COMPOSITES
5.1. Introduction
This chapter presents the results of an investigation to examine the effect of the
interfacial bond between the fiber and cement matrix on the multiple cracking behavior
of the composite by quantifying the debonding-energy density and maximum fiber-
bridging stress. This was accomplished by comparing the multiple cracking behavior of
reinforcing fibers embedded in composites formed from sulfate-based systems, CSA, as
opposed to the silicate systems found in portland cement; utilizing the single-fiber pullout
test.
Reinforcing fibers are an essential element in the design of engineered cementitious
composites (ECC) and ultrahigh performance concrete (UHPC). These materials are
targeted at creating a fiber-reinforced cementitious material that can sustain large
compressive and flexural loads and exhibit excellent toughness, specifically by
demonstrating pseudo strain-hardening and multiple cracking (Li and Leung, 1992; Lin
and Li, 1997; Li and Fischer, 2002; Yang, Wang et al., 2008). As cementitious matrices
continue to be engineered to perform at ultrahigh compressive and flexural strengths an
underlying need for the characterization of how these enhanced systems interact with
reinforcing fibers becomes more prevalent. High-strength cementitious systems are
brittle and have low-energy absorption or toughness as a result of their inability to sustain
deformation and crack resistance. The following research intends to illustrate how the
fiber-matrix composite is influenced from the utilization of calcium sulfoaluminate

80
cements with a high modulus of elasticity; as compared an ordinary portland cement
system, with a lower modulus of elasticity. Moreover, there is a need to better
understand the pullout process and the energy absorbing mechanisms associated with
engineered cementitious composites. This paper will evaluate the relationship between
fiber-matrix crack-bridging stress and debonding-energy density and how these
mechanisms contribute to multiple cracking behavior.
The relationship between crack bridging and crack opening when stressed is considered
the most important link between the properties of fiber, matrix and fiber-matrix interface
and that of a composite. This relation defines the ultimate stress and strain of a uniaxial
tensile stress-strain curve and the energy consumption due to fiber bridging, which in turn
control the strength, ductility and toughness of an engineered cementitious composite
(Lin and Li, 1997). The crack-bridging behavior, a concept first proposed by Marshall
and Cox (1988), and associated fiber-matrix debonding stress is used as the linking
concept between interfacial bond and composite failure behavior (Marshall et al., 1985;
Cox et al., 1985; Marshall and Cox, 1988, Li et al., 1997; Kanda et al., 1997). A fiber-
matrix composite is engineered to sustain additional loads after the matrix has been
cracked. However, this is only true if the pull-out resistance of the fibers, after the matrix
is cracked, is greater than the load when the matrix cracked. When the matrix has been
sufficiently cracked and unable to sustain external loading, the fibers take on any
additional load experienced by the composite. The zone between the fiber and matrix
performs many functions, but it primarily provides a pathway to transfer additional
stresses back into the matrix, through bond stresses. If these bond stresses do not exceed
the bond strength, multiple cracking may be induced in the matrix. This process of

81
multiple cracking will continue until either the fibers fail or the accumulated local
debonding will lead to fiber pullout (Shah, 1991; Mehta and Monteiro, 2006).
The bond between the fiber and matrix is important, if the bond is weak the fiber can slip
out at low loads and do not contribute to crack arresting. However, if the bond is too
strong then the fibers will rupture before they can contribute to the post-crack strength of
the matrix material and will exhibit a low debonding strength and reduced damage
tolerant behavior.
To fully understand the performance of the entire composite, the contribution of each
component must be evaluated. Particularly, the pullout behavior of a single fiber
embedded in a cementitious matrix. The contribution of the interfacial bond between a
single reinforcing fiber and surrounding cement matrix, may seem inconsequential to the
overall performance of a fiber-reinforced composite. However, that infinitesimally small
transition zone is what governs the ultimate load, toughness and debonding stress of a
composite when considering the volume of fibers present. The microstructural
development within the transition zone is governed by cement hydration and hardening of
the bonding system which defines the mechanical properties of the fiber-matrix
composite (Janotka et al., 2003; Krajci et al., 2003).
A popular interface characterization test is the single-fiber pullout test (Nairn et al., 2001;
Liu et al., 2001). In the single-fiber pullout test, the end of a fiber is embedded in a
cement matrix and pulled out while the matrix is held in place. The peak force, P,
required to debond the fiber is typically recorded as a function of time and/or
displacement; however, in this study it will be compared to curing time.

82
Fiber-reinforced composites (FRC) resist tensile forces through a composite action,
whereby part of the tensile force is resisted by the matrix, while the balance is taken by
the fibers (Naaman, Namur et al. 1991). The transmission of forces between the fiber and
the matrix is achieved through bond defined as the shearing stress at the interface
between the fiber and the surrounding matrix (Naaman et al., 1991). It is generally
agreed that the fiber contribution to increasing the toughness of the composite is
primarily dictated by the mechanisms of fiber pullout (Naaman et al., 1991). The term
toughness refers to the work dissipated, or the total energy absorbed prior to complete
failure; or the critical potential energy release rate of a composite specimen with a unit
mJ (Brown et al., 2002). As a precursor to toughness a composite must be able to
withstand brittle failure through multiple cracking. The ability for a fiber-matrix
combination to dissipate a large volume of cracking energy may be determined by
quantifying the debonding-energy density.
The cement-fiber interfacial bond results from some combination of mechanical
interlocking of cement hydration products with the fiber surface and chemical reaction
between fiber and cement paste within the interstitial transition zone (Kim and Mai,
1998; Brown et al., 2002). In fiber reinforced composite materials, the principal factor
governing load transfer from the matrix to the fiber is the shear strength of the interfacial
bond between the two components. Without the benefit of a mechanism, i.e. fibers, to
dilute crack-induced energy within the matrix the result is sudden failure as demonstrated
by plain concrete. Fibers have the effect of increasing the work of fracture by absorbing
the energy of a single crack and redistributing it by creating multiple cracks. Fractured
specimens of fiber-reinforced concrete shows that failure takes place primarily due to

83
fiber pullout or debonding. Debonding of the fiber-matrix interface generally initiates
before the ultimate load is reached. Regarding engineered cementitious composites it is
generally fiber pullout rather than rupture that enables a larger ductility to the fiber
reinforced composites (Li and Stang 1997, Lin and Li 1997). The development of
multiple cracking from the redistribution of cracking energy is reminiscent to strain-
hardening behavior.
5.2. Research Significance – Chapter 5
The increasing interest in researching and utilizing UHPC as a means to lessen or
eliminate the need for reinforcing steel in the construction process. As cementitious
matrices continue to be engineered to perform at ultrahigh compressive and flexural
strengths there is an underlying need for the characterization of how these enhanced
systems interact with reinforcing fibers. High-strength cementitious systems are brittle
and exhibit low-energy absorption or toughness as a result of their inability to sustain
deformation and crack resistance. This study intends to illustrate how the fiber-matrix
composite is influenced from the utilization of high-strength cementitious systems,
specifically calcium sulfoaluminate cements. As compared to lower-strength systems,
like that of an ordinary portland cement. Moreover, there is a need to understand better
the pullout process and the energy absorbing mechanisms associated with increased
toughness in composites.
The bond between the fiber and matrix is important, if the fibers have a weak bond with
the matrix they can slip out at low loads and do not contribute to preventing the
propagation of cracks. However, if the bond is too strong then the fibers will rupture

84
before they can contribute to the post-crack strength of the matrix material. Ideally the
debonding stress will be such that external loads are successfully transferred from the
matrix to the fiber and back into the matrix multiple times, over the entire length of the
embedded fiber as it’s pulled completely free from the surrounding matrix. Determining
the fiber-matrix pairing that will provide the most efficient bond to allow for the
development of multiple cracking will in turn control the strength, ductility and
toughness of a structural member.
Therefore this paper presents the development of the CSA cement-fiber interfacial
performance in the context of material design under the guidance of micro-mechanical
tools. Specifically this study illustrates how the fiber-matrix interface is enhanced by the
use of sulfate-based cements when compared to silicate-based cements, in regards to
debonding stress and multiple cracking. The overarching goal is to provide some
guidance in properly selecting a combination of fiber and matrix that provides efficient
damage tolerant behavior.
5.3. Experimental Program
The single-fiber pullout test was conducted to investigate the evolution of debonding-
energy density and fiber-bridging stress over time. The major parameters investigated
were cement type and fiber type and their effect on the ability for a cementitious
composite to dissipate deleterious external loads. The fiber-matrix debonding-energy
density and fiber-bridging stress was determined for each fiber-cement combination;
these composite properties were used to evaluate the multiple cracking behavior
differences in CSA and ordinary portland cements.
85
5.4. Experimental Results and Discussion
The influence of fiber and cement type on the fiber pullout energy and associated
multiple cracking was determined from the analysis of load-deflection curves. The
primary binder in CSA-cement systems differ greatly from that in OPC systems, both
chemically and physically. To evaluate the influence of these different binders on the
bond between cement and fiber the stress associated with multiple cracking was
quantified and analyzed for statistically significant interactions with fiber type, cement
type and days of curing. The effect of cement and fiber type on the ability for a
composite to induce multiple cracking was evaluated by quantifying the fiber bridging
load versus displacement.
5.4.1. Fiber/Matrix Debond-Energy Density
The primary behavior defining a tough material is the formation of multiple cracking (i.e.
microcracks) at increasing composite tensile stress (Mobasher et al., 1990). This
behavior hinges on two complementary requirements; first, the peak interfacial bond
strength between the fiber and matrix must exceed the first cracking strength of the
matrix. This condition is necessary so that the load, prior to matrix cracking, can be
supported by the fiber after matrix cracking. Second, according to Li and Leung (1992),
propagation of a matrix crack must occur at a constant stress and constant crack opening
in a flat configuration (Li and Leung, 1992; Li and Fischer, 2002). These requirements
are necessary in the development of multiple cracking in fiber reinforced brittle matrix
composites. Which has been extensively studied, starting with the investigation of fiber
reinforced cement by Aveston et al. (1971). Mobasher et al. (1990) evaluated the
86
micromechanics of matrix fracture in portland cement-based fiber composites using an
acoustic emission technique in combination with optical microscopy; which were used to
identify and confirm microcracking (Mobasher et al., 1990). The study found the
maximum acoustic emission to occur at the point where the stress-strain relationship
reached a maximum on the linear portion of the curve (Mobasher et al., 1990). The study
detected microcracks prior to the directional change of the stress-strain curve; with a
majority of the cracks located within the interfacial zone between the fiber and matrix
(Mobasher et al., 1990; Brandt, 2008). Therefore the debonding-energy density was used
to quantify the energy absorption capacity, through microcracking, up to peak loading. In
regards to the single-fiber pullout test peak loading represents the point in which the
microcracks within the interfacial zone have initiated the transition from fiber-matrix
debonding to fiber pullout. This is analogous to the coalescence of microcracks
described by Mobasher et al. (1990) at which point the first microcrack band was
developed (Mobasher et al., 1990).
To quantify the energy associated with multiple cracking, Equation 5-1, can be
interpreted as follows: the cumulative energy consumed from the onset of loading to
maximum fiber bridging stress σB,peak and corresponding crack opening δpeak; (i.e. the
energy consumed from fiber-matrix debonding). Graphically, the debonding energy
density is the area to the right of the σ – δ curve up to the peak stress.
𝐷𝑒𝑏𝑜𝑛𝑑𝑖𝑛𝑔 𝐸𝑛𝑒𝑟𝑔𝑦 𝐷𝑒𝑛𝑠𝑖𝑡𝑦 = ∫ 𝜎𝐵(𝛿)𝑑𝛿𝛿𝑝𝑒𝑎𝑘
0. (5-1)
With initiation of the first crack, the linear stress-strain relationship comes to an end.
After this point more cracks continue to form at higher deformation levels. Eventually

87
the crack resistance will be reduced when the crack bridging capacity is exceeded at a
particular crack location, deformation of the composite will localize at this site (van Zijl,
2011). The inclusion of reinforcing fibers provides the catalyst to deformation resistance
by increasing the stress over a larger strain by retarding the localization of deformation.
Pseudo strain-hardening in fiber reinforced composites is associated with the multiple
cracking phenomenon of the brittle matrix (Li and Wu, 1992). If crack spreading is
unstable, then a first macroscopic crack is formed in the composite. A load applied to a
fiber-reinforced composite will be shared by the bridging fibers. These fibers then
transfer the load through their interface back into the matrix. If enough load is
transferred, the matrix may crack again and the process repeats until the matrix is broken
by a series of sub-parallel cracks of approximately equal crack spacing (Li and Wu,
1992). Straining of the bridging fibers across the matrix cracks and within the matrix
zones give rise to a composite strain that can be substantially higher than the matrix
failure strain alone (Li and Wu, 1992).
Figure 5-1 shows the deboned-energy density as determined from equation 4-1 for the
coated steel and plain steel fibers embedded in the OPC, Commercial CSA cement and
CSAB#4 cement. The plain-steel fibers attained the highest debonding-energy density at
1 day (33.49 mJ/mm3) in the Commercial CSA cement paste. A positive increasing trend
in debonding-energy density was exhibited in both the OPC and CSAB#4 cement,
increasing from 18.65 mJ/mm3 (1 day) to 28.18 mJ/mm3 (112 days) in the OPC paste,
increasing from 11.30 mJ/mm3 (1 day) to 24.89 mJ/mm3 (56 days) in the CSAB#4 paste
before decreasing to 19.75 mJ/mm3 at 112 days. An increased debonding-energy density
suggests plain-steel fibers in the OPC matrix is the best combination for maximum

88
energy absorption through multiple cracking of the cementitious matrix. Countering the
trend of the OPC and CSAB#4 matrix the Commercial CSA cement had a decreasing
trend from 1 day (33.49 mJ/mm3) to 112 days (1.03 mJ/mm3). The rapid-hardening
nature of the Commercial CSA cement has attributed to the reduction of energy density in
the fiber-matrix debonding zone of the stress-strain curve. The increasing elastic
modulus of the CSA cement made it more difficult to induce multiple cracking, thereby
creating a more brittle composite with the plain-steel fibers. However the CSAB#4
cement showed an increasing debonding-energy density with time which is surprising
considering the similarity in chemistry and mineral phases present in both the
Commercial CSA and CSAB#4. The answer may reside in the microscopic differences
in the morphology of the ettringite crystals themselves; these differences will be
discussed in the following section on hydrated cement morphology.
The coated-steel fibers demonstrated a decreasing trend in debonding-energy density
from 1 to 112 days in all three cements tested (Figure 5-1). The range in debonding-
energy densities from 1 day to 112 days in OPC was 16.16 mJ/mm3 to 0.49 mJ/mm3; in
the Commercial CSA, 29.21 mJ/mm3 to 4.74 mJ/mm3; and in the CSAB#4, 22.85
mJ/mm3 to 9.79 mJ/mm3. The coated-steel fiber has a similar elastic modulus as the
plain-steel fiber; however, the coating added for corrosion control (Figure 2-1), appears
to have modified the fiber surface thereby reducing the effectiveness of the fiber-matrix
bond which is demonstrated by the reduction in debonding-energy density in each
cement. The cementitious matrix creates a strong bond with the coating, which readily
breaks free from the fiber surface reducing the level of stress/energy present through the

89
debonding zone of the stress-strain curve. The corrosion-control coating works as a
lubricant or a bond release agent.

90
Figure 5-1. Fiber-matrix debond-energy density as a function of curing time for the steel
fibers.
-5
0
5
10
15
20
25
30
35
40
0 20 40 60 80 100 120
Deb
on
din
g-E
ner
gy
Den
sity
(m
J/m
m3)
Curing Time (days)
Comm. CSA
CSAB#4
OPC
Comm. CSA
CSAB#4
OPC
Plain-Steel Fiber
-5
0
5
10
15
20
25
30
35
40
0 20 40 60 80 100 120
Deb
on
din
g-E
ner
gy
Den
sity
(m
J/m
m3)
Curing Time (days)
Comm. CSA
CSAB#4
OPC
Comm. CSA
CSAB#4
OPC
Coated-Steel Fiber

91
Figure 5-2 shows the debonding-energy density as determined from equation 1 for the
polyvinyl-alcohol and polypropylene fibers embedded in the OPC, Commercial CSA
cement and CSAB#4 cement. The PVA fiber showed an increasing debonding-energy
density with time from 1 to 112 days of curing in the cementitious composite. The
greatest energy density range was exhibited in the CSAB#4 paste (0.17 mJ/mm3 to 7.82
mJ/mm3), followed by the Commercial CSA paste (1.26 mJ/mm3 to 4.85 mJ/mm3), and
the lowest energy density range was demonstrated in the OPC paste (0.45 mJ/mm3 to
1.58 mJ/mm3).
The polypropylene fibers produced the most consistent ability to form multiple cracking
in the ordinary portland cement over the full range of curing time; with a debonding-
energy density range of 2.83 mJ/mm3 to 4.98 mJ/mm3. However with the PP fiber
embedded in the Commercial CSA cement there was an increasing debonding-energy
density from 1 to 112 days. Whereas the energy density decreased in both the CSAB#4
and ordinary portland cement matrixes, over the range of curing.
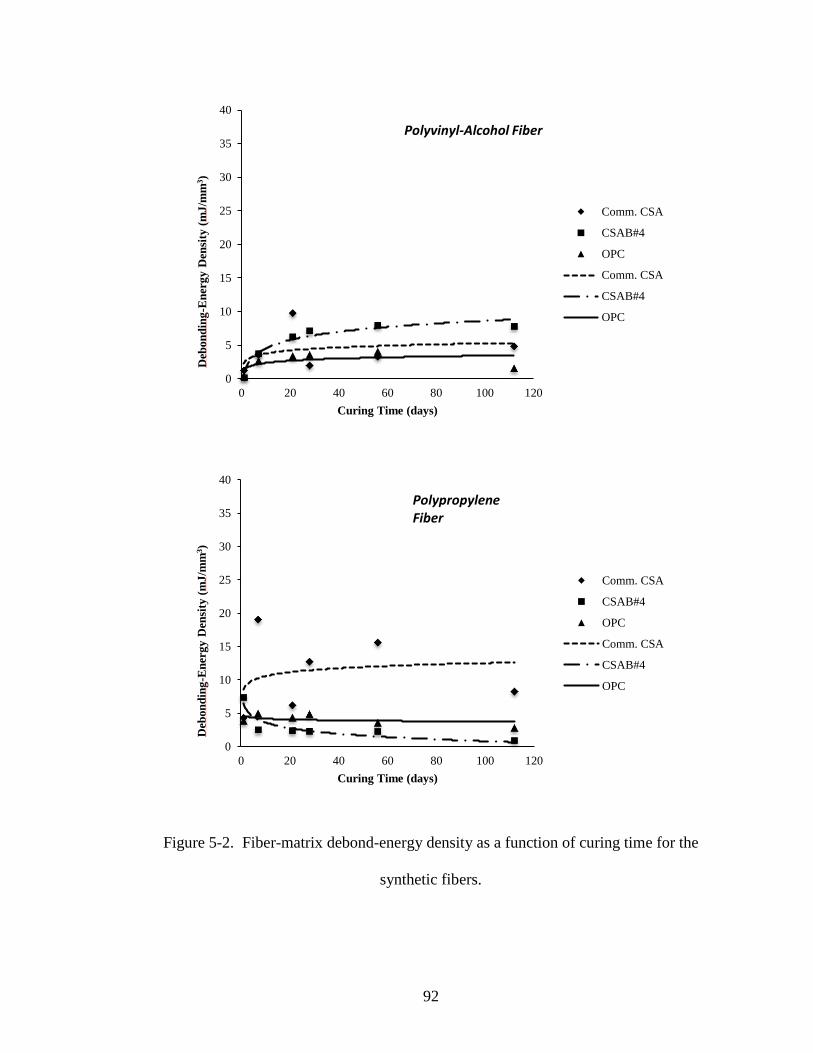
92
Figure 5-2. Fiber-matrix debond-energy density as a function of curing time for the
synthetic fibers.
0
5
10
15
20
25
30
35
40
0 20 40 60 80 100 120
Deb
on
din
g-E
ner
gy
Den
sity
(m
J/m
m3)
Curing Time (days)
Comm. CSA
CSAB#4
OPC
Comm. CSA
CSAB#4
OPC
Polyvinyl-Alcohol Fiber
0
5
10
15
20
25
30
35
40
0 20 40 60 80 100 120
Deb
on
din
g-E
ner
gy
Den
sity
(m
J/m
m3)
Curing Time (days)
Comm. CSA
CSAB#4
OPC
Comm. CSA
CSAB#4
OPC
Polypropylene Fiber

93
5.4.2. Influence of Hydrated Cement Morphology
The transition zone (TZ) between the cement matrix and fiber plays a crucial role in
governing the performance of the fiber-matrix composite. The bond developed in the TZ
between the fiber and matrix is strongly influenced on the nanostructure and
microstructure of the hydrated cement; which is analogous to the inter- and
intramolecular interactions of every amorphous and crystalline solid (Fahlman, 2011).
The cement paste structure depends on the composition of the original cement grains, the
starting water:cement ratio, the temperature of hydration, and the presence of chemical
admixtures at the time of hydration (Hannant, 2000). Considering the entire paste
structure, there is a wide range of particle sizes and void spaces making each fiber-matrix
bond unique. Each fiber-matrix TZ may be composed of unhydrated cement grains of
irregular shape of approximately 10 – 20 µm in size, the space between them filled with
less than 1 µm calcium silicate hydrates of complex forms including partly crystalline
fibers and sheet-like networks in which other phases are present like plates of calcium
hydroxide, Figure 5-3 (Hannant, 2000).
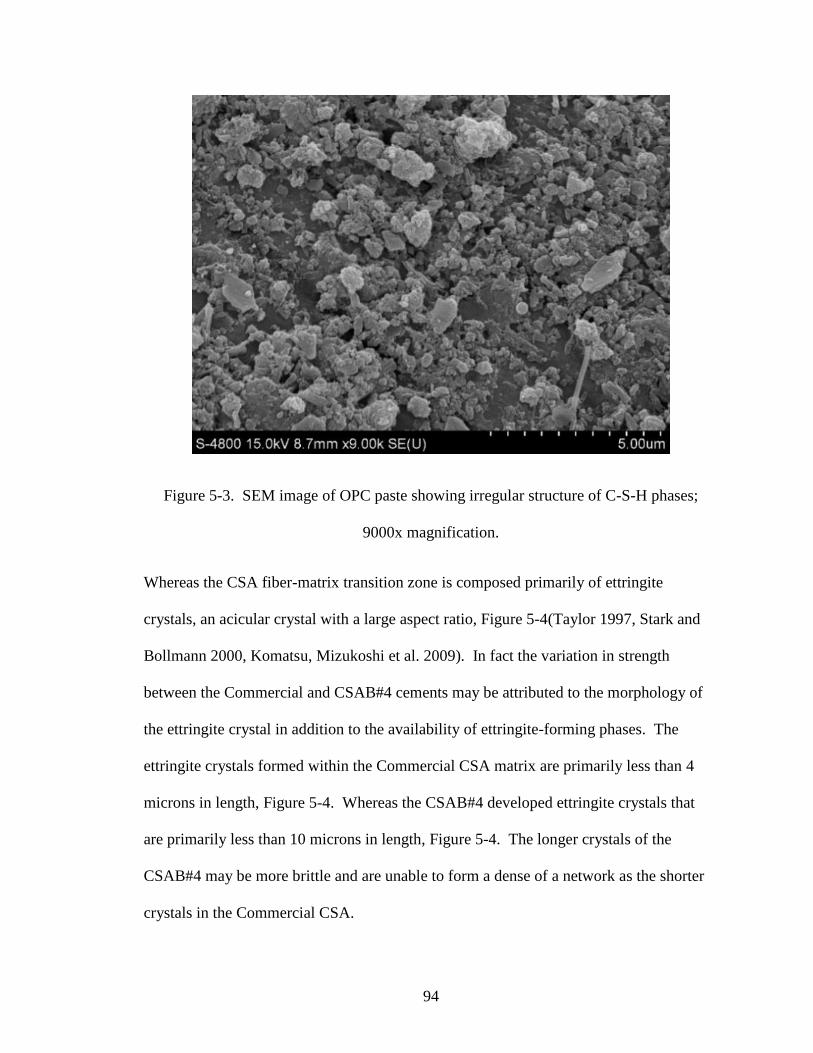
94
Figure 5-3. SEM image of OPC paste showing irregular structure of C-S-H phases;
9000x magnification.
Whereas the CSA fiber-matrix transition zone is composed primarily of ettringite
crystals, an acicular crystal with a large aspect ratio, Figure 5-4(Taylor 1997, Stark and
Bollmann 2000, Komatsu, Mizukoshi et al. 2009). In fact the variation in strength
between the Commercial and CSAB#4 cements may be attributed to the morphology of
the ettringite crystal in addition to the availability of ettringite-forming phases. The
ettringite crystals formed within the Commercial CSA matrix are primarily less than 4
microns in length, Figure 5-4. Whereas the CSAB#4 developed ettringite crystals that
are primarily less than 10 microns in length, Figure 5-4. The longer crystals of the
CSAB#4 may be more brittle and are unable to form a dense of a network as the shorter
crystals in the Commercial CSA.

95
Figure 5-4. SEM images of hydrated CSA cement: Top: Commercial CSA, 2500x
magnification; Bottom) CSAB#4, 1500x magnification.
96
The variation in debonding-energy density between OPC and CSA cement is likely
attributed to the difference in the morphological assemblage of hydrated cement phases
within the transition zone. The resistance to uniaxial pullout forces are focused on these
assemblages that populate the TZ.
Many toughness theories of composite materials have been developed mainly for those
with unidirectional fibers. Kim and Mai (Kim and Mai 1998) emphasized the various
origins of toughness in composites may be characterized by considering the sequence of
microscopic fracture events that lead to crack propagation macroscopically under
monotonic increasing loads, such as the single-fiber pullout test. The cracks in a cement
matrix can propagate along the fiber-matrix, referred to as longitudinal cracking; or
transversely through the fiber and matrix, referred to as transverse cracking. The
longitudinal cracking relies heavily on the physical and chemical adhesion between the
fiber and matrix; with an additional bond component related to frictional stresses (Najm
et al., 1994). The prevalent type of cracking depends on the properties of the interface
relative to the fiber and matrix (Kim and Mai, 1998). According to Kim and Mai (1998),
when a crack present in the matrix approaches an isolated fiber, the following failure
mechanisms may be expected to take place: 1) fiber-matrix interface debonding; 2) post-
debonding friction; 3) fiber fracture; 4) stress redistribution and 5) fiber pullout.
5.4.3. Fiber Bridging Stress
As a matrix cracks under an applied load the newly formed cracks will encounter an
embedded fiber which will either fracture or bridge the crack, the prevailing mode
depends on the interface properties. Fiber-crack deflection, deformation and pullout
97
within the bridging zone contribute to the overall toughness of the fiber-paste composite.
Toughness encompasses the energy absorbed by the composite, the inflicted energy
results from the opening of matrix cracks which causes an increasing stress on the fiber;
which corresponds to the fiber-bridging stress. Therefore researchers have focused on
improving the strength and toughness of discontinuous fiber composites by optimizing
fiber-matrix response to applied loads (Shah, 1991; Beyerlein et al., 2001). To achieve a
high composite strength the fiber-matrix bond needs to be strong; a strong interface
provides an effective stress transfer medium (Beyerlein et al., 2001; Jewell et al., 2015).
The fiber-bridging stress can be described by an equation modified from Li and Leung
(1992):
𝑃(𝛿) =𝜋
2√(1 + 𝜂)𝐸𝑓𝑑𝑓
3𝜏𝛿 (5-2)
With fiber diameter of 𝑑𝑓, fiber elastic modulus 𝐸𝑓, shear strength τ, fiber displacement
corresponding to peak load δ, and η = (𝑉𝑓𝐸𝑓)/(𝑉𝑚𝐸𝑚); where 𝑉𝑓 and 𝑉𝑚 are the fiber and
matrix volume fractions, and 𝐸𝑓 and 𝐸𝑚 are the fiber and matrix elastic modulus (Li and
Leung, 1992). The equation presented by Li and Leung (1992) accounted for the subbing
effect, originally reported by (Li et al., 1990), which accounts for increased bridging
forces due to an inclined fiber angle with respect to pullout direction. The snubbing
effect was not considered as the applied load is parallel to the length of the fiber for the
single-fiber pullout test.
Figure 5-5 shows the fiber bridging stress as determined from equation 5-2 for the coated
steel, plain steel, polypropylene and polyvinyl alcohol fibers, with respect to curing time,
embedded in an OPC matrix. The top portion of the figure illustrates the corresponding

98
fiber-matrix strain. The plain- and coated-steel fibers had a similar bridging stress at 1
day of approximately 100 MPa. However from 7 to 112 days of curing there was an
increase in bridging stress for the plain-steel fibers that paralleled the increasing matrix
strength; while the coated-steel fibers decreased in bridging stress over the same time.
An increasing fiber-bridging stress with decreasing fiber displacement, over time,
suggests the increasing matrix strength is more resistant to creating new fracture surfaces
and additional loading is focused on the fiber-matrix interface. The polyvinyl-alcohol
fibers increased in bridging stress from 1 day (4 MPa) to 56 days (16 MPa), and were
able to withstand larger strains before fiber pullout was initiated. The larger strains may
be attributed to a combination of the chemical bond and low elastic modulus allowing the
fiber to readily deform; absorbing additional energy over a greater distance. The plain-
steel fibers achieved a fiber-bridging stress of 107 MPa at 1 day and increasing to 151
MPa at 28 days before decreasing to 130 MPa at 112 days. The coated-steel fibers
demonstrated a decreasing trend in bridging stress from 1 day (106 MPa) to 112 days
(127 MPa). The bridging stress was reduced by approximately 50% during the 112 days.
The coated-steel fiber has a similar elastic modulus as the plain-steel fiber however the
coating, added for corrosion control, modifies the fiber surface thereby reducing the
effectiveness of the fiber-matrix bond which is demonstrated by the reduction in bridging
stress. The PP fibers maintained a fairly constant bridging stress through the 112 days of
curing; which may indicate a threshold to the bridging stress. Figure 5-5 highlights the
performance differences between the steel and synthetic fibers in the OPC matrix. Both
of the steel fibers show a decreasing trend, with time, in the strain capacity of the single-
fiber composite; however, the synthetic fibers did not exhibit a decreasing trend. The PP

99
fibers maintained consistent strain capacity, while the PVA fibers were able to sustain
greater strains with increasing time. Compared to the PP fiber the modulus of elasticity
of the PVA fiber increased from 5,000 MPa to 30,000 MPa and the tensile strength
increased from 600 MPa to 1200 MPa; the increased strength and stiffness in
combination with the strong hydrophilic bond that these fibers exhibit, allowed PVA
fibers to attain greater strains with increasing time. Polypropylene fibers are designed to
defibrillate, through this deformation mechanism the pullout resistance is fortified as the
fiber is gradually pulled into segments; lending to the consistent strain capacity.

100
Figure 5-5. Fiber bridging stress as a function of curing time in the OPC paste.
Figure 5-6 shows the fiber-bridging stress as determined from equation 2 for the coated
steel, plain steel, polypropylene and polyvinyl alcohol fibers, with respect to curing time,

101
embedded in the Commercial CSA cement matrix. The top portion of the figure
illustrates the corresponding fiber-matrix strain. Again the steel fibers demonstrated the
highest fiber-bridging stress from 1 to 112 days of curing. However, unlike the OPC
matrix where the plain-steel fibers achieved the highest bridging stress the coated-steel
fibers had the best ability to sustain additional fiber-bridging stresses from 1 to 112 days
of curing; decreasing from 178 MPa at 1 day to 122 MPa at 112 days. Additionally the
fiber-bridging stress increased by approximately 68% by embedding the fibers in the
Commercial CSA cement matrix, instead of the OPC matrix. The plain-steel fibers had a
similar decreasing trend as the coated-steel fibers; decreasing from 135 MPa (1 day) to 75
MPa (112 days). Polypropylene fibers experienced a positive increasing trend in
bridging stress from 1 to 112 days; 19 MPa to 28 MPa, respectively. Comparable to the
PP fibers, PVA fibers demonstrated an increasing trend to sustain bridging stresses from
1 day (7 MPa) to 21 days (17 MPa). The bridging stress then levelled off through 112
days of curing, ranging from 16 MPa to 17 MPa. Figure 5-6 shows similar strain profiles
for each fiber as was illustrated in Figure 5-5 for the OPC matrix; with the strain
increasing with time for the synthetic fibers, while the strain for the steel fibers decreases
with time. As the cementitious matrix increases in strength and stiffness over time
greater loads are required to create new fracture surfaces. The steel fibers contributed to
greater peaks loads more than the synthetic fibers due to their higher elastic modulus, see
Table 4-1 and Jewell et al. (2015). However the increased stiffness of the steel fibers
lead to fiber pullout at lower strains than the flexible synthetic fibers that would more
readily deform and achieve greater strains. However, the polypropylene fiber was able to
sustain greater strains in the Commercial CSA matrix. This may be explained by taking

102
into account the low elastic modulus (5000 MPa) and high fiber elongation (25%) this
monofilament fiber was able to transfer loads, that would otherwise focus on the fiber-
matrix bond, to the fiber itself which was able to withstand damage (by delamination of
the fiber surface) and yet maintain a sufficient bridging stress to allow for increased
strains. The PVA fibers increased the strain capacity in all three cements, this is
attributed to the fiber-matrix bonding behavior. As previously mentioned PVA fibers
chemical bond with the surrounding matrix, this bonding behavior is a unique property of
reinforcing fibers. The fiber-matrix bond provides a strong interface for transferring
loads to the fiber, thereby preserving the matrix. In regards to the increased strain
capacity seen in Figure 5-5, Figure 5-6 and Figure 5-7, the low elastic modulus of PVA
fibers (30,000 MPa) combined with the high tensile strength (1,200 MPa) provided an
excellent substrate to absorb the additional load over the greater strains. However, this
bonding behavior that is beneficial to increasing the fiber-bridging stress and strain
capacity is known to increase the frequency of fiber rupture; resulting from the
coalescence of applied stresses within the fiber and not within the fiber-matrix interface.
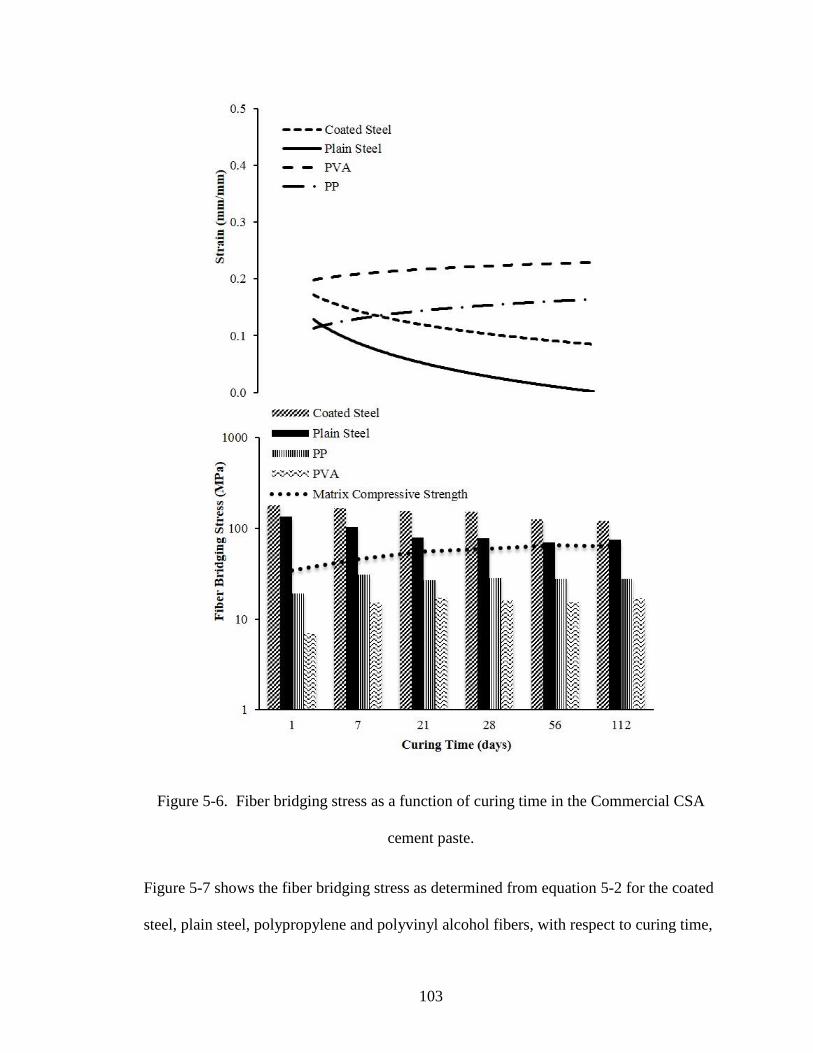
103
Figure 5-6. Fiber bridging stress as a function of curing time in the Commercial CSA
cement paste.
Figure 5-7 shows the fiber bridging stress as determined from equation 5-2 for the coated
steel, plain steel, polypropylene and polyvinyl alcohol fibers, with respect to curing time,

104
embedded in the CSAB#4 cement matrix, which was fabricated from coal combustion
byproducts (Chapter 3 and Jewell et al., 2015). The plain-steel and coated-steel fibers
maintained similar bridging stresses 1 to 112 days. However the coated-steel fibers
decreased from 1 day (144 MPa) to 112 days (87 MPa); while the plain-steel fibers
increased from 104 MPa to 148 MPa over the same time period. The polypropylene
fibers exhibited a decreasing trend in bridging stress 1 day (21 MPa) to 112 days (12
MPa); differs from the increasing trends seen in the OPC and Commercial CSA cement
matrix. The sudden change in bridging stress from one CSA cement to another is likely
explained by the morphology of the ettringite crystals. As was discussed in the hydrated
cement morphology section the Commercial CSA cement is comprised of short ettringite
crystals, while the CSAB#4 cement is comprised of long ettringite crystals. The PVA
fibers exhibited a preference for the long crystal structure with an increasing strain
capacity over time, which is reflected by the increasing bridging stress from 1 day (3
MPa) to 112 days (24 MPa).

105
Figure 5-7. Fiber bridging stress as a function of curing time in the CSAB#4 cement
paste.

106
5.4.4. Toughening Mechanisms
Composite toughness is expected to increase with crack-induced deformation attributed
to the breakdown of the fiber-matrix bond. However, the major toughening mechanism is
believed to result from fiber pullout (Kim and Mai, 1998). To influence the toughness of
a composite, fibers must effectively bridge and stop matrix cracks. Kim and Mai (1998)
described four primary factors that influence fracture toughness of composites which
include: 1) matrix deformation; 2) fiber rupture; 3) fiber-matrix debonding and multiple
cracking; and 4) fiber pullout.
Matrix deformation more commonly relates to ductile matrices and is considered
negligible for brittle OPC and CSA-cement matrices. Fiber rupture provides little
toughness to the system by means of plastic deformation of the fiber; however every fiber
contains flaws of varying sizes which develop into fracture planes leading to fiber
rupture. Fiber-matrix debonding and crack-induced deformation is governed by a
composites ability to promote multiple cracking. If the fiber-matrix bond is sufficiently
strong enough to resist fracture, the load path will redirect back to the matrix. This
process will continue until either fiber pullout or rupture occurs. Fiber pullout is the
primary toughening mechanism in composites. Complete pullout enables the full energy-
absorbing capacity of the embedded-fiber length. If the fiber-matrix bond is strong
enough to resist fracture normal to the pullout load, then multiple cracking is likely to
occur. Assuming that the fiber-matrix bond is not greater than the ultimate strength of
the fiber.

107
Composites made with brittle, high elastic modulus, fibers and matrices, i.e. steel and
CSA cement, can exhibit high composite toughness when failure occurs preferentially
along the fiber-matrix interface before fibers fracture (Chapter 4 and Jewell et al., 2015).
Most important toughening mechanisms are a direct result of the interface-related shear
failure which gives rise to an improved energy absorption (Li and Stang, 1997). Three
distinct groups were identified in Figure 5-8 based on the relationship between fiber
strain and fiber-bridging stress; the regions are identified as PVA, PP and Steel (both
coated and plain) fibers. Composites made with the high elastic modulus fibers exhibited
an increased capacity to dissipate damage from loading in the form of multiple cracking
before the onset of fiber pullout at early ages. However this behavior decreased with
increasing age of the fiber-matrix composite for the steel fibers. For the synthetic fibers,
both PP and PVA, there is an associated increase in fiber bridging stress and fiber strain
with increasing time.
Compared to the high elastic modulus of the steel fibers the low elastic modulus of the
polyvinyl-alcohol fibers sustained lower fiber-bridging stresses in conjunction with
higher fiber strains; particularly in the CSA cement pastes. The soft nature of
polypropylene fibers allow them to readily deform, particularly by delamination, which
provides a mechanism to absorb the energy emitted from matrix fractures. This allows
for greater fiber-bridging stresses than the PVA fibers; at the cost of lower strains.

108
Figure 5-8. Chart illustrating relationship between fiber strain and fiber-bridging stress.
5.5. Statistical Analysis
Each type of cement was analyzed statistically using a two-way general linear model
analysis of variance (GLM/ANOVA) (Cox and McCullagh, 1982; Silknitter et al., 1999;
Vano et al., 2006; McDonald, 2009). Factorial analysis of variance is a useful tool to
assess the effects of cement type and curing time for each fiber type. Specifically,
polynomial response curves were fit for each cement which related the dependent
variable, debonding-energy density, to curing time. Higher order terms were tested and
removed using backward elimination. The resulting model was tested for lack of fit. The
test for interaction of cement type and fiber type was used to determine whether there
was any significant differences in the relationship of fiber-matrix debonding-energy
density and curing time between cement types, including OPC and CSA cement
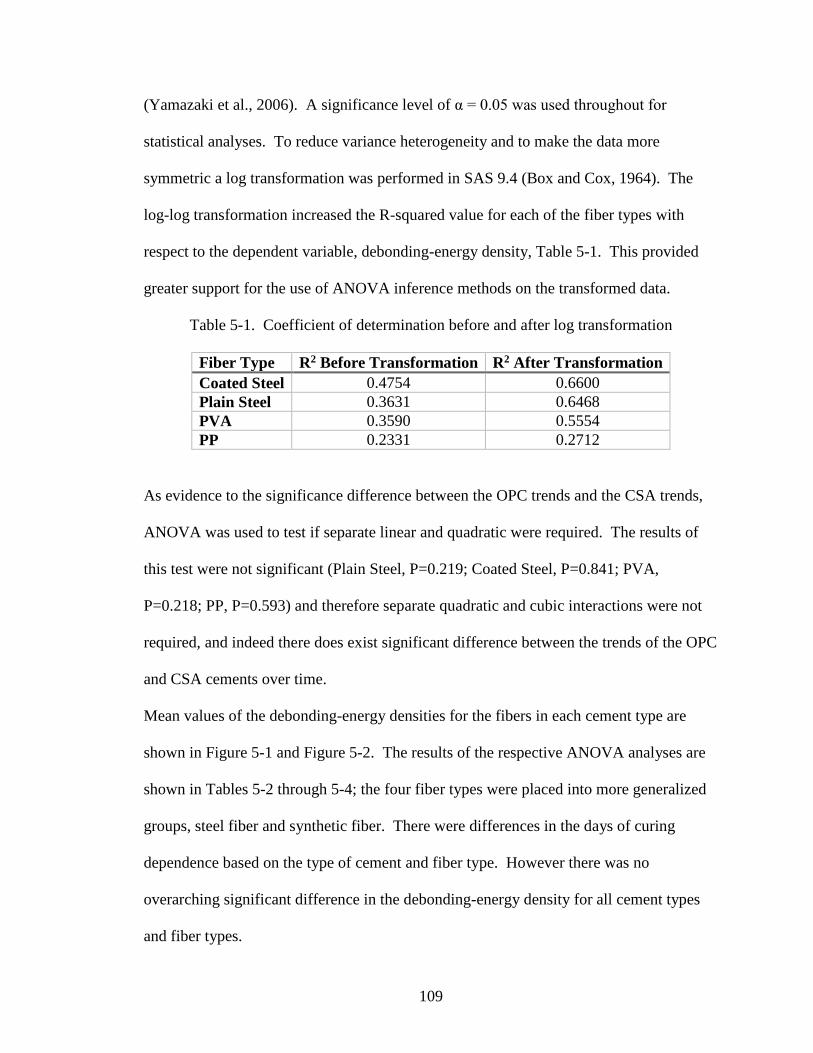
109
(Yamazaki et al., 2006). A significance level of α = 0.05 was used throughout for
statistical analyses. To reduce variance heterogeneity and to make the data more
symmetric a log transformation was performed in SAS 9.4 (Box and Cox, 1964). The
log-log transformation increased the R-squared value for each of the fiber types with
respect to the dependent variable, debonding-energy density, Table 5-1. This provided
greater support for the use of ANOVA inference methods on the transformed data.
Table 5-1. Coefficient of determination before and after log transformation
Fiber Type R2 Before Transformation R2 After Transformation
Coated Steel 0.4754 0.6600
Plain Steel 0.3631 0.6468
PVA 0.3590 0.5554
PP 0.2331 0.2712
As evidence to the significance difference between the OPC trends and the CSA trends,
ANOVA was used to test if separate linear and quadratic were required. The results of
this test were not significant (Plain Steel, P=0.219; Coated Steel, P=0.841; PVA,
P=0.218; PP, P=0.593) and therefore separate quadratic and cubic interactions were not
required, and indeed there does exist significant difference between the trends of the OPC
and CSA cements over time.
Mean values of the debonding-energy densities for the fibers in each cement type are
shown in Figure 5-1 and Figure 5-2. The results of the respective ANOVA analyses are
shown in Tables 5-2 through 5-4; the four fiber types were placed into more generalized
groups, steel fiber and synthetic fiber. There were differences in the days of curing
dependence based on the type of cement and fiber type. However there was no
overarching significant difference in the debonding-energy density for all cement types
and fiber types.

110
5.5.1. Steel Fiber Results
Steel fibers achieved a higher debonding-energy density than the synthetic fibers in both
the CSA and portland cements, Figures 5-9 and 5-10. Figure 5-11 shows the plot of the
ANOVA procedure for debonding-energy density with respect to plain-steel fibers. The
plot shows a positive-trending regression profile for the OPC matrix. There is interaction
between the two CSA cements and between the OPC and CSA cements. The nearly
linear, to positive-trending quadratic profile of the CSAB#4 and the positive-trending
profile of the Commercial CSA cements show interaction with the positive-trending
portland cement quadratic profile. This highlights statistical significance exists in
support of the hypothesis that fibers perform differently in CSA cements than they do in
portland cement, particularly based on a linear relationship (P<0.0001). Particularly,
statistical significance exists in the interaction between curing time, Log(Day), and
Cement Type (P<0.0001) for debonding-energy density, Table 5-2. Disregarding cement
type there exists significance between the day of curing and debonding-energy density (P
= 0.0039).
Table 5-2. ANOVA results for effect of cement type and levels of days of curing on
debonding-energy density for the plain-steel fiber
Source DF Type I SS Mean Square F Value Pr > F
c1 (contrast) OPC:CSAB#4 1 1.11008015 1.11008015 1.58 0.2125
Cement 1 49.01451910 49.01451910 65.72 <.0001
Log(Day) 1 6.19069431 6.19069431 8.81 0.0039
Log(Day)*Log(Day) 1 0.06232385 0.06232385 0.09 0.7667
c1*Log(Day) 1 0.40483858 0.40483858 0.58 0.4501
Log(Day)*Cement 1 47.59506216 23.79753108 67.13 <.0001
c1*Log(Day)*Log(Day) 1 0.22811706 0.22811706 0.32 0.5705
Log(Day)*Log(Day)*Cement 1 0.08425079 0.08425079 0.12 0.7301

111
Figure 5-9. Analysis of variance for debonding-energy density for the plain-steel fiber.
Figure 5-10 is a plot of the ANOVA model for coated-steel fibers with debonding-energy
density as the dependent variable. The Commercial CSA and CSAB#4 show differing
trending quadratic lines with interaction throughout the curing period. The CSAB#4
cement has a negative-trending quadratic line from 1 to 28 days of curing then becoming
positive trending out to 112 days of curing. The Commercial CSA and OPC have similar
positive-trending profiles from 1 to 56 days of curing before becoming negative trending
to 112 days. The trend of the CSAB#4 cement and the opposing trend of the portland
cement suggests cement type does have an effect on the debonding-energy density of the
coated-steel fiber-matrix system (P = 0.0253). Statistical significance exists between
linear coefficients with interaction between curing time and cement type (P = 0.0048).
-2
-1
0
1
2
3
4
5
0 1 2 3 4 5
Lo
g D
ebo
nd
ing-E
ner
gy D
ensi
ty
Log Curing Time
OPC
Commercial CSA
CSAB#4
OPC
Commercial CSA
CSAB#4

112
Table 5-3. ANOVA results for effect of cement type and levels of days of curing on
debonding-energy density for the coated-steel fiber
Source DF Type I SS Mean Square F Value Pr > F
c1 (contrast) OPC:CommCSA 1 29.98190363 29.98190363 51.09 <.0001
Cement 1 3.04597086 3.04597086 5.19 0.0253
Log(Day) 1 33.86704118 33.86704118 57.71 <.0001
Log(Day)*Log(Day) 1 7.32800511 7.32800511 12.49 0.0007
c1*Log(Day) 1 3.97697714 3.97697714 6.78 0.0110
Log(Day)*Cement 1 4.92657863 4.92657863 8.39 0.0048
c1*Log(Day)*Log(Day) 1 0.81217665 0.81217665 1.38 0.2429
Log(Day)*Log(Day)*Cement 1 8.34311459 8.34311459 14.22 0.0003
Figure 5-10. Analysis of variance for debonding-energy density for the coated-steel
fiber.
-2
-1
0
1
2
3
4
5
0 1 2 3 4 5
Lo
g D
ebo
nd
ing-E
ner
gy D
ensi
ty
Log Curing Time
OPC
Commercial CSA
CSAB#4
OPC
Commercial CSA
CSAB#4
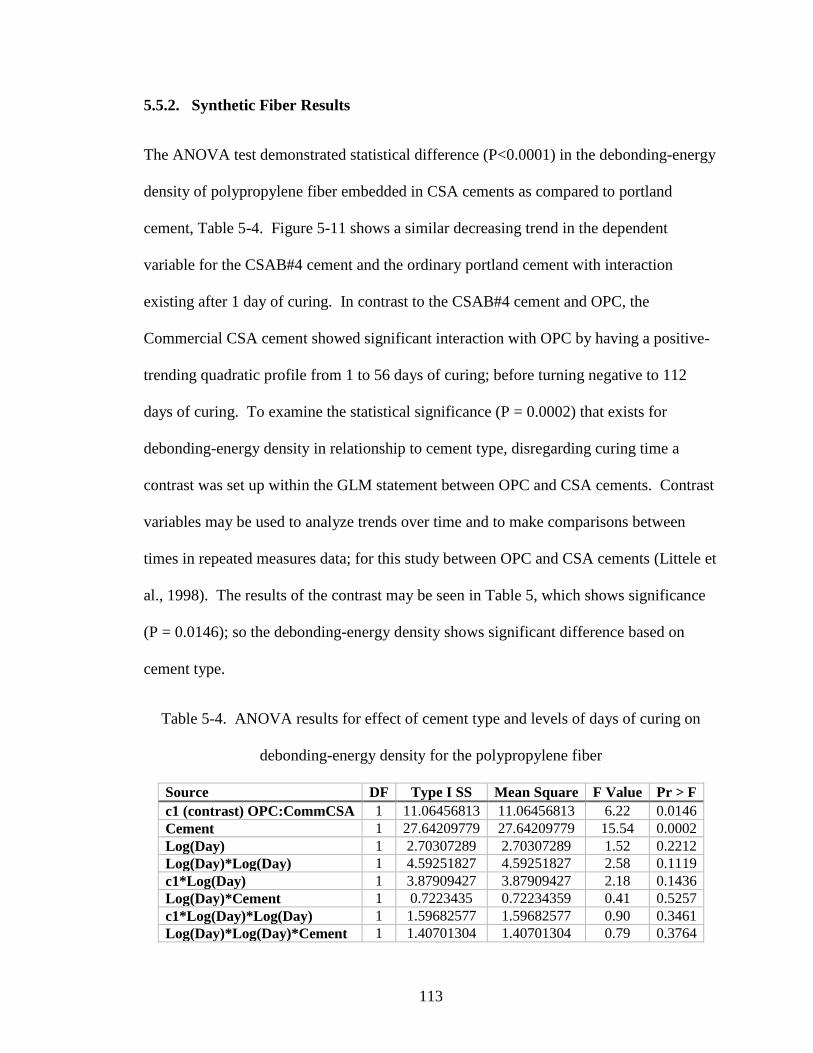
113
5.5.2. Synthetic Fiber Results
The ANOVA test demonstrated statistical difference (P<0.0001) in the debonding-energy
density of polypropylene fiber embedded in CSA cements as compared to portland
cement, Table 5-4. Figure 5-11 shows a similar decreasing trend in the dependent
variable for the CSAB#4 cement and the ordinary portland cement with interaction
existing after 1 day of curing. In contrast to the CSAB#4 cement and OPC, the
Commercial CSA cement showed significant interaction with OPC by having a positive-
trending quadratic profile from 1 to 56 days of curing; before turning negative to 112
days of curing. To examine the statistical significance (P = 0.0002) that exists for
debonding-energy density in relationship to cement type, disregarding curing time a
contrast was set up within the GLM statement between OPC and CSA cements. Contrast
variables may be used to analyze trends over time and to make comparisons between
times in repeated measures data; for this study between OPC and CSA cements (Littele et
al., 1998). The results of the contrast may be seen in Table 5, which shows significance
(P = 0.0146); so the debonding-energy density shows significant difference based on
cement type.
Table 5-4. ANOVA results for effect of cement type and levels of days of curing on
debonding-energy density for the polypropylene fiber
Source DF Type I SS Mean Square F Value Pr > F
c1 (contrast) OPC:CommCSA 1 11.06456813 11.06456813 6.22 0.0146
Cement 1 27.64209779 27.64209779 15.54 0.0002
Log(Day) 1 2.70307289 2.70307289 1.52 0.2212
Log(Day)*Log(Day) 1 4.59251827 4.59251827 2.58 0.1119
c1*Log(Day) 1 3.87909427 3.87909427 2.18 0.1436
Log(Day)*Cement 1 0.7223435 0.72234359 0.41 0.5257
c1*Log(Day)*Log(Day) 1 1.59682577 1.59682577 0.90 0.3461
Log(Day)*Log(Day)*Cement 1 1.40701304 1.40701304 0.79 0.3764

114
Figure 5-11. Analysis of variance for debonding-energy density for the polypropylene
fiber.
The trends of the debonding-energy density of the PVA fiber shows different sloping
regression trends up to 21 days of curing (Figure 5-12). The quadratic regression lines
for OPC and the Commercial CSA appear similar while the regression line for CSAB#4
has a more linear trend. However significance does exist between the quadratic
regression lines (P = 0.0570), suggesting the PVA fiber does perform differently in each
cement type and demonstrates dependence on the day of curing (Table 5-5). Regardless
of cement type the day of curing is significant (P<0.0001) on the debonding-energy
-2
-1
0
1
2
3
4
5
0 1 2 3 4 5
Lo
g D
ebo
nd
ing-E
ner
gy D
ensi
ty
Log Curing Time
OPC
Commercial CSA
CSAB#4
OPC
Commercial CSA
CSAB#4

115
density. Cement type is also statistically significant (P<0.0001), disregarding days of
curing.
Table 5-5. ANOVA results for effect of cement type and levels of days of curing on
debonding-energy density for the polyvinyl-alcohol fiber
Source DF Type I SS Mean Square F Value Pr > F
c1 (contrast) OPC:CommCSA 1 5.67705488 5.67705488 4.37 0.0398
Cement 1 0.39519155 0.39519155 0.30 0.5829
Log(Day) 1 89.10047515 89.10047515 68.56 <.0001
Log(Day)*Log(Day) 1 18.83660142 18.83660142 14.49 0.0003
c1*Log(Day) 1 0.68542558 0.68542558 0.53 0.4698
Log(Day)*Cement 1 10.43431886 10.43431886 8.03 0.0058
c1*Log(Day)*Log(Day) 1 1.55494458 1.55494458 1.20 0.2773
Log(Day)*Log(Day)*Cement 1 4.84663172 4.84663172 3.73 0.0570
Figure 5-12. Analysis of variance for debonding-energy density for the polyvinyl-alcohol
fiber.
-2
-1
0
1
2
3
4
5
0 1 2 3 4 5
Lo
g D
ebo
nd
ing-E
ner
gy D
ensi
ty
Log Curing Time
OPC
Commercial CSA
CSAB#4
OPC
Commercial CSA
CSAB#4

116
5.6. Conclusion
ANOVA results for debonding-energy density shows statistical significance in support of
the hypothesis that fibers perform differently in calcium sulfoaluminate cement as
compared to ordinary portland cement.
In this paper, the interfacial parameters of three fiber types and three different types of
cement were examined. The fiber-matrix bond performance was evaluated by analysis of
the debonding-energy density and fiber-bridging stress utilizing the single-fiber pullout
test to quantify peak load and corresponding displacement.
An important factor contributing to the bond strength between fiber and matrix was the
ability to transfer interfacial stress from fiber to matrix. The more rigid-dense
morphology of the CSA cement paste due to the ettringite crystal structure yielded higher
debonding-energy densities and fiber-bridging stresses for both steel and synthetic fibers;
with the exception of plain-steel fibers in the commercially available CSA cement, in
which there was a reduction in the debonding-energy density (Montgomery 1998). The
morphology of the C-S-H in the OPC matrix provided good bonding, though lacked the
strength and dense-structure found with ettringite in the CSA matrixes.
In summary, fibers embedded in CSA cement show a higher debonding-energy density
than fibers embedded in OPC. The increase in debonding-energy density is attributed to
the strength of ettringite and the associated morphology from the growth of the acicular
crystals. Therefore the combination of a stiffer matrix and the crack arresting ability of
fibers, the energy required for crack propagation was increased, as seen by the increase in
debonding-energy density. Steel fibers more readily attained debonding-energy density

117
energy than synthetic fibers in both CSA cement and OPC; due to the high modulus of
the fiber which is able to withstand multiple fiber-matrix deformations by redirecting the
stresses back into the matrix. The synthetic fibers achieved good debonding-energy
densities. Steel fibers are better suited to improve the debonding-energy density at higher
peak loads, while the synthetic fibers are best suited to improve debonding-energy
density at low peak load events.

118
CHAPTER 6 : INFLUENCE OF CEMENT TYPE ON FIBER-MATRIX
INTERFACE BOND STRENGTH
6.1. Introduction
This chapter presents the results of the interfacial bond strength developed at the interface
between reinforcing fibers embedded in a calcium sulfoaluminate (CSA) cement matrix,
utilizing the single-fiber pullout.
The stress transfer between fiber and matrix across the interface, under various loading
conditions, is a primary factor characterizing fiber composites (Kim and Mai, 1998). The
fiber matrix interface, though infinitesimally small, plays a major role in the overall
performance of the bulk composite (Li and Grubb, 1994). The properties of the interface
are controlled mainly by the chemical and morphological development between fiber and
matrix; which determines the overall compatibility, and mechanical behavior, of the two
materials (Stang et al., 1990; Kim and Mai, 1998). Fiber composites are targeted at
creating a reinforced cementitious material that can sustain large compressive and
flexural loads and exhibit increased toughness. The load-bearing capability of a
cementitious-fiber composite depends on how well the stress is transferred, which is
primarily controlled by the bonding characteristics at the interfacial transition zone (Kim
and Mai, 1998). As cementitious matrices continue to be engineered to perform at
ultrahigh compressive and flexural strengths an underlying need for the characterization
of how these enhanced systems interact with reinforcing fibers becomes more prevalent.
High-strength cementitious systems are brittle and exhibit low-energy absorption or
toughness as a result of their inability to sustain deformation and crack resistance. The

119
following research intends to illustrate how the fiber-matrix composite is influenced from
the utilization of high-strength cementitious systems, specifically calcium sulfoaluminate
cements; as compared to lower-strength portland cement systems. Moreover, there is a
need to better understand the pullout process and the energy absorbing mechanisms
associated with increased toughness in composites. This paper will evaluate the
contribution of the interface bond strength on the fiber pullout resistance.
The mechanical properties of a composite are defined by several parameters including the
fiber and matrix elastic modulus and tensile strength, fiber embedment length, aspect
ratio, volume fraction, fiber orientation, the surface roughness of the fiber (which
influences the interface with the matrix) and the interfacial bond strength. In addition to
strength another important factor is the ability for a fiber composite to dissipate fracture-
induced energy. A measure of this energy is referred to as the work of fracture, also
known as fracture toughness, and can be defined as the energy necessary to create new
fractured surface area (Kim and Mai, 1991). Generally, fiber composites will take on
additional loads after the first cracking of the matrix if the pull-out resistance of the
fibers, at the first crack, is greater than the load at first cracking. This concept of crack-
bridging, was first proposed by Marshall and Cox (1988) and is used to link the
interfacial bond and composite failure behavior (Marshall et al., 1985; Marshall and Cox,
1988; Li et al., 1997). Resistance to fiber debonding and pullout is primarily a function
of the fiber-matrix interface bond shear strength and the interface bond area (Gray, 1984).

120
To fully understand the performance of the entire composite, the contribution of each
component must be evaluated. This may be accomplished by analyzing the pullout
behavior of a single fiber embedded in a cementitious matrix. The contribution of the
interfacial bond between a single-reinforcing fiber and surrounding cement matrix, may
seem inconsequential to the overall performance of a fiber-reinforced composite.
However, that infinitesimally small transition zone is what governs the ultimate stress
and toughness of a composite when considering the volume of fibers present. The
microstructural development within the interfacial transition zone (ITZ) is governed by
cement hydration and hardening of the bonding system which defines the mechanical
properties of the fiber-matrix composite (Janotka et al., 2003).
A popular interface characterization test is the single-fiber pullout test (Takaku and
Arridge, 1973; Gray, 1984; Li and Grubb, 1994; Nairn et al., 2001). In the single-fiber
pullout test, an elastic fiber is embedded in an elastic cementitious matrix and pulled out
while the matrix is held in place (Figure 6-1). The maximum applied force, 𝑃𝑚𝑎𝑥,
required to debond the fiber is typically recorded as a function of time and displacement;
additionally, in this study it will also be related to curing time.
Figure 6-1. Fiber pullout specimen.

121
Fiber-reinforced composites (FRC) resist tensile forces through a composite action,
whereby part of the tensile force is resisted by the matrix, while the balance is taken by
the fibers (Naaman et al., 1991). The transmission of forces between the fiber and the
matrix is achieved through bond defined as the shearing stress at the interface between
the fiber and the surrounding matrix (Naaman et al., 1991; Subramani and Gaurav, 2012).
It is generally agreed that the fiber contribution to increasing the toughness of the
composite is primarily dictated by the mechanisms of fiber pullout (Naaman et al., 1991).
Toughness of a fiber-matrix composite refers to the work dissipated, or the total energy
absorbed prior to complete failure; or the critical potential energy release rate of a
composite specimen with a unit mJ (Brown et al., 2002).
The cement-fiber interfacial bond results from some combination of mechanical
interlocking of cement hydration products with the fiber surface and chemical reaction
between fiber and cement paste within the interstitial transition zone (Kim and Mai,
1998; Brown et al., 2002). In fiber reinforced composite materials, the principal factor
governing load transfer from the matrix to the fiber is the shear strength of the interfacial
bond between the two components(Naaman et al., 1991). Fractured specimens of fiber-
reinforced concrete shows that failure takes place primarily due to fiber pullout or
debonding. Generally fiber pullout rather than rupture confers a larger ductility to the
fiber reinforced composites (Li and Stang, 1997; Lin and Li, 1997). Ideally composites
will exhibit strain-hardening behavior achieved through multiple cracking of the
reinforced matrix. Unlike plain concrete, a fiber-reinforced concrete specimen does not
break immediately after initiation of the first crack. This has the effect of increasing the
work of fracture, or toughness.

122
The length and volume of fibers present in a concrete mix are critical in controlling the
flexural strength and toughness of the hardened concrete, including the prevention of
crack propagation. If the pullout resistance of the fibers is great enough when a crack
develops in the matrix, the composite will sustain greater external loading. Within the
cracked section, the matrix does not resist any tension and the fibers carry the entire load
taken by the composite. Bond stresses between the fiber and matrix provide a pathway
for additional stresses, from increasing loads on the composite, to pass from the fiber
back to the matrix. If these bond stresses do not exceed the bond strength, then the
developing energy may be released through additional matrix cracking. This process of
multiple cracking will continue until either the fibers fail or the accumulated local
debonding will lead to fiber pullout (Shah, 1991; Mehta and Monteiro, 2006).
6.2. Research Significance – Chapter 6
There is increasing interest in researching and utilizing UHPC as a means to lessen or
eliminate the need for reinforcing steel in the construction process. As cementitious
matrices continue to be engineered to perform at ultrahigh compressive and flexural
strengths there is an underlying need for the characterization of how these enhanced
systems interact with reinforcing fibers. High-strength cementitious systems are brittle
and exhibit low-energy absorption or toughness as a result of their inability to sustain
deformation and crack resistance. This study intends to illustrate how the fiber-matrix
composite is influenced from the utilization of high-strength cementitious systems,
specifically calcium sulfoaluminate cements. As compared to lower-strength systems,
like that of an ordinary portland cement. Moreover, there is a need to understand better

123
the pullout process and the energy absorbing mechanisms associated with increased
toughness in composites.
The most crucial link between the properties of fiber, matrix and fiber-matrix interface
and that of a composite is the crack bridging stress-crack opening relation. This relation
defines the ultimate stress and strain of a uniaxial tensile stress-strain curve and the
energy consumption due to fiber bridging, which in turn control the strength, ductility
and fracture toughness of a structural member (Lin and Li, 1997).
Therefore this paper presents the evaluation of the fiber-matrix interface by quantifying
the bond stress and thereby determining the toughness based on the strength and energy
criterion. Experimentally this was accomplished by fiber pullout in a CSA cement, and
portland cement matrix in context of material design under the guidance of micro-
mechanical tools. Specifically this study illustrates how the bond within the fiber-matrix
interface is governed by the use of material selection particularly the use of sulfate-based
cements when compared to silicate-based cements. The overarching goal is to provide
some guidance in properly selecting a combination of fiber and matrix to achieve an
effective interface in controlling damage in composites and enhancing the tolerance prior
to failure.
6.3. Experimental Program
The single-fiber pullout test was conducted to investigate the fiber-matrix bond stress
with respect to curing time. The major parameter investigated was the cement type and if
there was any significant influence on pullout resistance with varying types of reinforcing

124
fiber. The significance of cement-fiber combinations was determined with an analysis of
variance using SAS 9.4.
6.4. Experimental Results and Discussion
The influence of fiber and cement type on the interfacial shear stress was determined
from the analysis of load-deflection curves. The primary binder in CSA-cement systems
differ greatly from that in OPC systems, both chemically and physically. To evaluate the
influence of these different binders on the bond between cement and fiber the shear stress
was quantified and analyzed for statistically significant interactions with fiber type,
cement type and days of curing. The effect of cement and fiber type on the ability to
achieve maximum toughness a composite must exhibit high strength and ductility.
6.4.1. Influence of Hydrated Cement Morphology
The interfacial transition zone (ITZ) between the cement matrix and fiber plays a crucial
role in governing the performance of the fiber-matrix composite. The bond developed in
the ITZ between the fiber and matrix is strongly influenced on the nanostructure and
microstructure of the hydrated cement (Janotka et al., 2003). The cement paste structure
depends on the composition of the original cement grains, the starting water:cement ratio,
the temperature of hydration, and the presence of chemical admixtures at the time of
hydration (Hannant, 2000). Considering the entire paste structure, there is a wide range
of particle sizes and void spaces making each fiber-matrix bond unique. Each fiber-
matrix ITZ may be composed of unhydrated cement grains of irregular shape of
approximately 10 – 20 µm in size, the space between them filled with less than 1 µm
calcium silicate hydrates of complex forms including partly crystalline fibers and sheet-

125
like networks in which other phases are present like plates of calcium hydroxide, Figure
6-2 (Hannant, 2000).
Figure 6-2. SEM image of OPC paste showing irregular structure of CSH phases,
magnification is 9000x.
Whereas the CSA fiber-matrix transition zone is composed primarily of ettringite
crystals, an acicular crystal with a large aspect ratio, Figure 6-3 (Komatsu et al., 2009).
The variation in strength between the Commercial CSA and CSAB#4 cements is likely
attributed to the morphology of the ettringite crystal. The ettringite formed within the
Commercial CSA matrix are primarily less than 4 microns in length. Whereas the
CSAB#4 CSA developed ettringite crystals that are primarily less than 10 microns in
length. The larger aspect ratio of the ettringite produced by the CSAB#4 CSA may lend
to more brittle crystals and are unable to form as dense of a network as the shorter

126
crystals in the Commercial CSA. However, improved fiber-matrix bonding was
exhibited by the CSAB#4 CSA matrix, as discussed in the next section. A possibility for
the increased bond with PVA fibers is attributed to the fiber providing nucleation sites for
the crystallization of hydrated cement phases (Cadek et al., 2002; Bin et al., 2006; Naebe
et al., 2008).
Figure 6-3. SEM image of CSA cement paste showing acicular ettringite structure,
magnification is 1500x.
The differences in fiber-matrix bond strength between OPC and CSA cement is likely
attributed to the difference in the morphological assemblage of hydrated cement phases
within the interfacial transition zone. The resistance to uniaxial pullout forces are
focused on these assemblages that populate the ITZ.

127
6.4.2. Interface Shear Strength
The cement-fiber interfacial bond results from some combination of mechanical
interlocking of cement hydration products with the fiber surface and chemical reaction
between fiber and cement paste within the interfacial transition zone (Kim and Mai,
1998; Brown et al., 2002). In fiber reinforced composite materials, the principal factor
governing load transfer from the matrix to the fiber is the shear strength of the interfacial
bond between the two components. Broken specimens of fiber-reinforced concrete
shows that failure takes place primarily due to fiber pullout or debonding. Generally
fiber pullout rather than rupture suggests a larger ductility to the fiber reinforced
composites, which translates to greater toughness (Li and Stang, 1997; Lin and Li, 1997).
Uniform shear bond strength between the fiber and surrounding matrix is often assumed
in FRC models and the bond strength from pullout tests is frequently reported in terms of
the average value over the embedded fiber surface area (Pan, 1993; Kim and Mai, 1998;
Johnston, 2001; Nairn et al., 2001; Mehta and Monteiro, 2006; Subramani and Gaurav,
2012). Additionally many researchers, including Greszczuk (1969), have developed
models on the relationship between fiber-matrix interfacial shear stress and embedded
fiber length using the assumptions of the shear-lag theory, i.e. assuming that the axial
stresses in the matrix are negligible relative to those in the fiber and that the shear stresses
in the fiber are small compared to those in the matrix (Greszczuk, 1969). One conclusion
from these models allows for the assumption that complete fiber-matrix debonding takes
place when the maximum interfacial shear stress is equal to the maximum interfacial
bond shear strength. The interfacial shear strength, 𝜏𝑓, can be calculated from fiber
pullout experiments using:

128
(6-1) 𝜏𝑓 =𝑃𝑚𝑎𝑥
2𝜋𝑟𝑓𝑙𝑒
Where 𝑟𝑓 is the fiber radius and 𝑙𝑒 is the embedded fiber length. Physically this term is
the average interfacial shear stress at the time of failure (Gray, 1984; Kim et al., 2007).
By utilizing the shear-lag theory an analysis of the stress transfer from the fiber to the
matrix may be used to evaluate the toughening due to fiber bridging during fiber pullout
(Hsueh, 1988; Kim and Mai, 1998). The shear-lag model was first considered by Cox
(1952) where an elastic fiber is embedded in an elastic matrix which is subjected to
uniaxial tension (Cox, 1952). However early models assumed perfect bonding at the
interface between the fiber and matrix, of a fully embedded fiber in a matrix, and the
Poisson contraction in the lateral direction is the same in the fiber and matrix. More
recent variations of Cox’s shear-lag model (Kim and Mai, 1991; Naaman et al., 1991;
Zhou et al., 1993) are similar however they take into account the fiber end, which is
exposed and is subjected to external tensile stress in the fiber pullout test (Kim and Mai,
1991; Naaman et al., 1991; Zhou et al., 1993). Newer models consider the effect of fiber-
axial stress and interface shear stress throughout the length of the embedded fiber, which
takes into account the effects of differing Poisson ratios between fiber and matrix. While
the bridging stress in the fibers contribute to the toughening of the composite, it’s the
relative displacements in the loading direction of the fiber-matrix interface that are
necessary for the crack-opening displacement. Therefore debonding at the fiber-matrix
interface during fiber pullout and additionally frictional sliding between the fiber and
matrix are essential to characterizing the toughness of the composite.
When an axial load is placed on the fiber the induced stress is transferred from the fiber
to the adjacent matrix by means of the interfacial shear stress. As described by Hsueh

129
(1990), the load-displacement curve initially shows a linear relationship corresponding to
the elastic loading of the composite with a bonded interface (Hsueh, 1990). The linear
relationship terminates where an initial debonding stress at the fiber-matrix interface
occurs. After this point the interface stress increases with increasing debond length. The
debond stress reaches a maximum where complete debonding occurs along the full length
of the embedded fiber. After the maximum stress is reached fiber pullout initiates with
the stress continuously decreasing to zero until the fiber is completely pulled from the
matrix. An example load-displacement curve, from the single-fiber pullout test, is shown
in Figure 6-4.
Figure 6-4. Representative load-displacement highlighting key points in the fiber pullout
process.

130
6.4.3. Shear-Bond Stress
Composites made with brittle fibers, i.e. steel, and brittle matrices, i.e. CSA cement, can
exhibit high toughness when failure occurs preferentially along the fiber-matrix interface
before fibers fracture. Important toughening mechanisms are a direct result of the
interface-related shear failure which gives rise to an improved energy absorption through
fiber pullout (Stang et al., 1990; Li and Stang, 1997; Hsueh and Becher, 1998). A good
shear bond will contribute to direct cracks longitudinally along the fiber maximizing the
contribution of the fiber to preventing further crack propagation; thus promoting
improved energy toughness. Fiber pullout relies on mode II (i.e. shear) debonding at the
fiber-matrix interface which can be analyzed using a strength-based approach, or stress
criterion (Stang et al., 1990; Hsueh and Becher, 1998). This approach occurs when the
maximum interface shear stress from loading equals the interface shear strength, 𝜏𝑓;
which assumes that debonding will initiate at this stress level. A review of fiber pullout
theories, by Gray (1984) identified that the majority of papers concerning fiber pullout in
cementitious systems used the stress criterion theory (Gray, 1984). The alternative
approach is to use an energy-based approach through fracture mechanics.
On each of the testing days (1, 7, 21, 28, 56 and 112) there was a relationship between the
𝐸𝑓 𝐸𝑚⁄ ratio and shear bond stress Figures 6-5, 6-6, 6-7 and 6-8. A decrease in 𝐸𝑓 𝐸𝑚⁄
ratio was associated with an increase in shear-bond stress. The shear stresses in the fiber
increase with the decrease in the 𝐸𝑓 𝐸𝑚⁄ ratio over time. As the elastic modulus of the
matrix increases with curing time the 𝐸𝑓 𝐸𝑚⁄ ratio decreases Table 6-1. Therefore as the
matrix strengthens over time the composite becomes more effective in load transfer from
131
the fiber to the matrix when the fiber is stressed. The Commercial CSA and CSAB#4
CSA matrices followed a similar trend in each figure. However there was a
distinguishable difference in trends between the OPC matrix and CSA matrices, for both
the 𝐸𝑓 𝐸𝑚⁄ ratio and shear bond strength. The steel fibers achieved much greater shear
bond strengths than the synthetic fibers, throughout the range of curing time. After 112
days of curing the steel fibers reached approximately 25 – 35 MPa in the CSA cement
and 12 – 19 MPa in OPC (Figure 6-5 and Figure 6-6). While the synthetic fibers reached
approximately 1.5 – 3.0 MPa in the CSA cement and 1.2 – 2.0 MPa in OPC (Figure 6-7
and Figure 6-8).

132
Figure 6-5. Relationship between 𝐸𝑓 𝐸𝑚⁄ ratio and shear-bond stress of coated-steel
fibers.

133
Figure 6-6. Relationship between 𝐸𝑓 𝐸𝑚⁄ ratio and shear-bond stress of plain-steel fibers.

134
Figure 6-7. Relationship between 𝐸𝑓 𝐸𝑚⁄ ratio and shear-bond stress of PVA fibers.
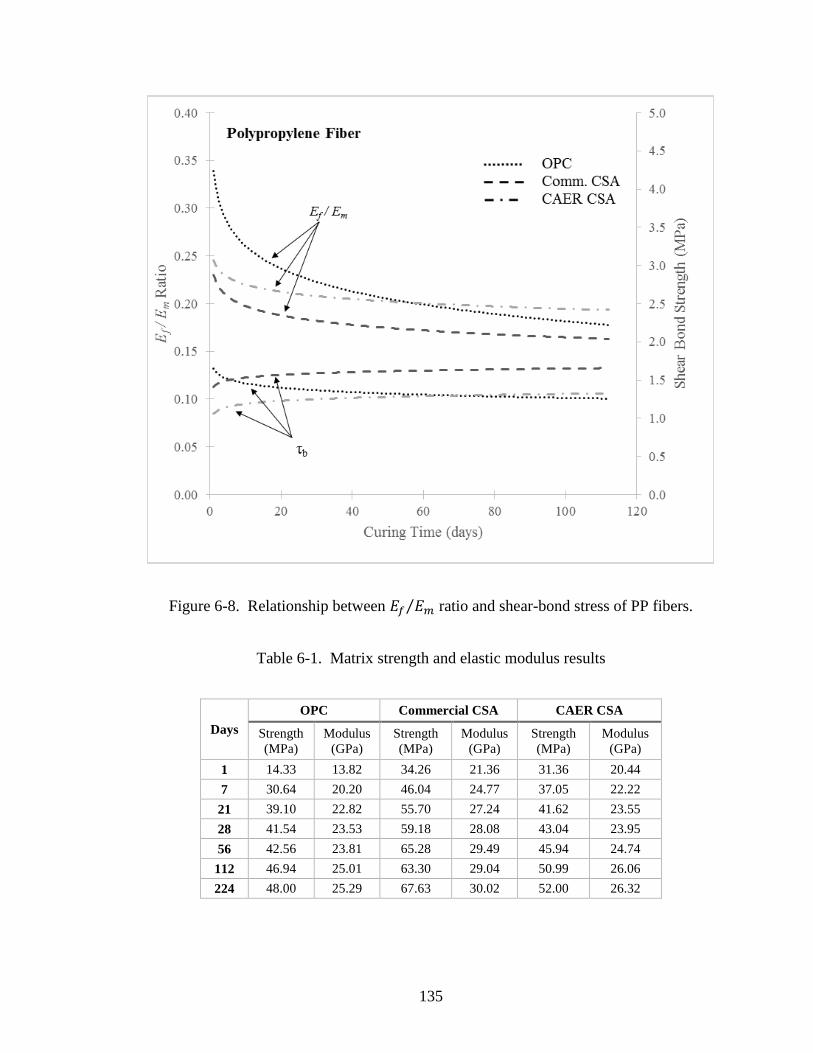
135
Figure 6-8. Relationship between 𝐸𝑓 𝐸𝑚⁄ ratio and shear-bond stress of PP fibers.
Table 6-1. Matrix strength and elastic modulus results
Days
OPC Commercial CSA CAER CSA
Strength
(MPa)
Modulus
(GPa)
Strength
(MPa)
Modulus
(GPa)
Strength
(MPa)
Modulus
(GPa)
1 14.33 13.82 34.26 21.36 31.36 20.44
7 30.64 20.20 46.04 24.77 37.05 22.22
21 39.10 22.82 55.70 27.24 41.62 23.55
28 41.54 23.53 59.18 28.08 43.04 23.95
56 42.56 23.81 65.28 29.49 45.94 24.74
112 46.94 25.01 63.30 29.04 50.99 26.06
224 48.00 25.29 67.63 30.02 52.00 26.32

136
6.4.4. Axial-Bond Stresses
Researchers evaluating the mechanical behavior of fiber-reinforced composites have
concluded that the optimal conditions for toughening of composites require debonding at
the fiber-matrix interfaces during fiber pullout, and frictional sliding between the fibers
and the matrix (Evans and McMeeking, 1986; Becher et al., 1988; Hsueh, 1990). During
fiber pullout, interfacial debonding begins at the intersection of the fiber and matrix,
where the interfacial shear stress is a maximum (Hsueh, 1990). To determine the effect
of bond forces between the fiber and matrix, in addition to the bond stress related to the
pullout force, the axial stress distribution 𝜎𝑓 in the fiber and the related interfacial shear
stress distribution 𝜏𝑖 are evaluated. The model equations for the axial stress distributions
were obtained from Hsueh (1990).
(6-2) 𝜎𝑓 = 𝑎2𝐸𝑓𝜎0
𝑎2𝐸𝑓+(𝑏2−𝑎2)𝐸𝑚[1 + (
𝑏2
𝑎2 − 1)𝐸𝑚
𝐸𝑓
exp(𝛼𝑧)−exp(−𝛼𝑧)
exp(𝛼𝑙𝑒)−exp(−𝛼𝑙𝑒)+
exp{−𝛼(𝑙𝑒−𝑧)}−exp{𝛼(𝑙𝑒−𝑧)}
exp(𝛼𝑙𝑒)−exp(−𝛼𝑙𝑒)]
(6-3) 𝜏𝑖 = −𝜎0 ([(
𝑏2
𝑎2−1)𝐸𝑚𝐸𝑓
exp(𝛼𝑧)−exp(−𝛼𝑧)
exp(𝛼𝑙𝑒)−exp(−𝛼𝑙𝑒)+
exp{−𝛼(𝑙𝑒−𝑧)}−exp{𝛼(𝑙𝑒−𝑧)}
exp(𝛼𝑙𝑒)−exp(−𝛼𝑙𝑒)]
2
𝑎[(1+𝑣𝑚){1+(
𝑏2
𝑎2−1)𝐸𝑚𝐸𝑓
}{𝑏2 𝑙𝑛(𝑏
𝑎)−
𝑏2−𝑎2
2}]
1/2 )
𝜎0 is the stress related to the maximum load applied at the surface (z = 𝑙𝑒), E and v are
Young’s modulus and Poisson’s ratio respectively and the subscripts f and m are for the
fiber and matrix respectively. The coefficient 𝛼 is defined in the following equation:
(6-4) 𝛼 =1
𝑎[
𝑎2𝐸𝑓+(𝑏2−𝑎2)𝐸𝑚
𝐸𝑓(1+𝑣𝑚){𝑏2ln (𝑏 𝑎⁄ )−(𝑏2−𝑎2)/2}]
1/2

137
The normalized axial stresses along the fiber are shown in Figure 6-9 and Figure 6-10 at
different ratios of 𝐸𝑓 𝐸𝑚⁄ , see Table 6-2, for coated-steel fibers embedded in an OPC
paste. Both Figure 6-9 and Figure 6-10 contain a smaller embedded chart representing a
highlighted section of the larger chart; providing greater detail. The axial bond and shear
stresses in the fiber decrease with the decrease in the 𝐸𝑓 𝐸𝑚⁄ ratio. This indicates that
low ratios of 𝐸𝑓 𝐸𝑚⁄ are more effective in load transfer from the fiber to the matrix when
the fiber is loaded; which is agreement with the findings of Hsueh (1988 and 1990). The
same trend was demonstrated by the higher elastic modulus CSA cement matrixes. A
maximum value for the interfacial shear stress is at the surface, z = 𝑙𝑒, where the fiber
enters the matrix. As can be seen in Figure 6-10, the intersection between the fiber and
surface of the paste plug is indicated on the normalized x-axis as z/a = 10. Figure 6-11
demonstrates the axial-stress trends demonstrated in Figures 6-9 and 6-10 (for coated-
steel fibers in OPC); however, additionally, the scope was expanded to include plain-
steel, PVA and PP fibers in OPC and CSA cement.
After initial debonding (Figure 6-4) frictional sliding occurs at the debonded interface.
On the assumption of Coulomb friction at the debonded interface, the interfacial
frictional stress results from the radial compressive stress at the interface (Hsueh, 1990).
Researchers have identified two sources of the radial stress at the fiber-matrix interface; a
net residual compressive stress as a result of differential shrinkage between the fiber and
surrounding composite and the stress due to Poisson’s contraction of the fiber in the
radial direction when the fiber is subjected to an axial tensile stress (Hsueh, 1990;
Subramani and Gaurav, 2012).

138
Figure 6-9. Normalized axial stress as a function of normalized axial position for the
Coated-Steel Fiber in OPC at different 𝐸𝑓 𝐸𝑚⁄ ratios.

139
Figure 6-10. Normalized interfacial shear stress as a function of normalized axial
position for the Coated-Steel Fiber in OPC at different 𝐸𝑓 𝐸𝑚⁄ ratios.
Table 6-2. 𝐸𝑓 𝐸𝑚⁄ ratios
Day
OPC Commercial CSA CAER CSA
Coated
Steel
Plain
Steel PVA PP
Coated
Steel
Plain
Steel PVA PP
Coated
Steel
Plain
Steel PVA PP
1 15.92 14.47 2.17 0.36 10.30 9.36 1.40 0.23 10.76 9.78 1.47 0.24
7 10.89 9.90 1.48 0.25 8.88 8.08 1.21 0.20 9.90 9.00 1.35 0.23
21 9.64 8.76 1.31 0.22 8.08 7.34 1.10 0.18 9.34 8.49 1.27 0.21
28 9.35 8.50 1.28 0.21 7.84 7.12 1.07 0.18 9.19 8.35 1.25 0.20
56 9.24 8.40 1.26 0.21 7.46 6.78 1.02 0.17 8.89 8.08 1.21 0.20
112 8.80 8.00 1.20 0.20 7.58 6.89 1.03 0.17 8.44 7.67 1.15 0.19

140
Figure 6-11. Influence of cement and fiber type on fiber-matrix axial stresses.
6.4.5. Influence of Interface Stresses on Composite Toughness
The toughness of a fiber-reinforced composite is influenced by the mechanical properties
of the fiber-matrix interface. For example, toughening of a composite is significantly
related to the ability of fibers to resist crack growth; thereby absorbing load-related
energy and redistributing that energy back into the matrix in the form of newly formed
cracks. The resulting interface stresses reflect the necessity for displacements in the
loading direction between the fiber and matrix. The displacements are necessary to
counteract the crack-opening displacement in the composite.
The shear-bond stresses discussed in the previous two sections directly influence the
overall toughness of the fiber-matrix composite. There is good agreement between the
shear-bond stress illustrated in Figures 6-5, 6-6, 6-7 and 6-8 with the toughness data

141
previously reported in Chapter 4 and by Jewell et al. (2015). The fiber pullout toughness
(i.e. energy consumption) increased with increasing curing time and increased shear-bond
strength (Figure 6-12). The one variation from this pattern exists with the polypropylene
fiber in OPC from 1 to 112 days of curing; any other combination of cement and fiber
shows an increase in shear-bond strength with time. Polypropylene fiber has the lowest
elastic modulus of 5.0 GPa, combined with OPC which has a lower elastic modulus than
CSA cement yields increased shear strengths. However the low elastic modulus allows
the fiber to readily deform by peeling away segments of the fiber surface, see Chapter 4
and Jewell et al., (2015).
The toughness of a composite increases as a function of the shear-bond strength, Figure
6-12. Figure 6-12 shows an inverse relationship between the energy consumption
(toughness) and the total fracture toughness of the composite. The energy absorbed
through fracturing of new surfaces reduces with increasing time and increasing shear-
bond strength. However the overall toughness of the composite increases with the same
increasing shear-bond strength suggesting the energy absorbed through fiber pullout, at
the fiber-matrix interface, is more dependent on frictional axial forces in addition to
deformation of the fiber itself.
Figure 6-12 also indicates a large difference in performance of steel fiber and synthetic
fibers with respect to energy consumption from fiber pullout. Synthetic fibers absorbed
between 1.0 and 10.0 mJ/mm3 from 1 to 112 days of curing, respectively; while the steel
fibers absorbed between 40.0 and 140.0 mJ/mm3 from 1 to 112 days, respectively.
However when considering fiber performance with respect to total fracture toughness
there exists a little difference between the steel and synthetic fibers; both fiber types

142
resulted in a total fracture toughness range within 8.0 to 16.0 MPa. The primary
difference resides in the shear-bond strength where synthetic fibers achieved fracture
toughness values at lower shear-bond strengths (1.0 – 3.0 MPa) and a tighter range. As
compared to the steel fibers with shear-bond strengths ranging from 3.0 to 25.0 MPa.
Figure 6-12. Comparing the relationship between energy consumption from total fiber
pullout to total fracture toughness as a function of interface shear bond strength.
Composite toughness and fracture toughness both infer the dissipation of work through
the creation of new surfaces. Many toughness theories of composite materials have been
developed mainly for those with unidirectional fibers. Kim and Mai (1998) emphasized
the various origins of toughness in composites may be characterized by considering the
sequence of microscopic fracture events that lead to crack propagation macroscopically
under monotonic increasing loads, such as the single-fiber pullout test. The prevalent
0
2
4
6
8
10
12
14
16
18
0
20
40
60
80
100
120
140
160
0 5 10 15 20 25 30
Tota
l F
ract
ure
Tou
gh
nes
s (M
Pa)
En
erg
y C
on
sum
pti
on
(m
J/m
m3)
Interface Shear Bond Strength (MPa)
OPC - Energy
CSA - Energy
OPC - Fracture
CSA - Fracture
Increasing Time
Steel FibersPolymer Fibers

143
type of cracking depends on the properties of the interface relative to the fiber and matrix
(Kim and Mai, 1998).
The research of Marston et al. (1974) and Atkins (1975) identified the contribution of
three major sources of fracture toughness, stress redistribution (Fr), fiber pullout (Fp) and
the generation of new surfaces (Fs) (Kim and Mai, 1998). The contribution of each
energy consuming component may be summed into the total fracture toughness (Ftot), of
the single-fiber-matrix composite.
(6-5) 𝐹𝑡𝑜𝑡 = 𝐹𝑟 + 𝐹𝑝 + 𝐹𝑠
(6-6) 𝐹𝑡𝑜𝑡 = 𝑉𝑓𝜎𝑓
𝜏𝑓[
𝜎𝑓𝑑
6(
1
4+
𝜎𝑓
𝐸𝑓) +
𝑅𝑚
2] + (1 − 𝑉𝑓)𝑅𝑚
Vf is the fiber volume fraction; 𝜎𝑓 is the ultimate strength of the fiber; 𝜏𝑓 is the shear bond
strength of the fiber and matrix.
6.5. Statistical Analysis
Each type of cement was analyzed statistically using a two-way general linear model
analysis of variance (GLM/ANOVA) (Cox and McCullagh, 1982; Silknitter et al., 1999;
Vano et al., 2006; McDonald, 2009). Factorial analysis of variance is a useful tool to
assess the effects of cement type and curing time for each fiber type. Specifically,
polynomial response curves were fit for each cement which related the dependent
variable, interface-shear strength, to curing time. Higher order terms were tested and
removed using backward elimination. The resulting model was tested for lack of fit. The
test for interaction of cement type and fiber type was used to determine whether there
was any significant differences in the relationship of fiber-matrix interface-shear strength

144
density and curing time between cement types, including OPC and CSA cement
(Yamazaki et al., 2006). A significance level of α = 0.05 was used throughout for
statistical analyses. To reduce variance heterogeneity and to make the data more
symmetric a log transformation was performed in SAS 9.4 (Box and Cox, 1964). The log
transformation increased the R-squared value for each of the fiber types with respect to
the dependent variable, interface-shear strength, Table 6-3. This provided greater support
for the use of ANOVA inference methods on the transformed data.
Table 6-3. Coefficient of determination before and after log transformation
Fiber Type R2 Before Transformation R2 After Transformation
Coated Steel 0.4856 0.7912
Plain Steel 0.3772 0.8683
PVA 0.4914 0.7220
PP 0.3145 0.3575
As evidence to the significance difference between the OPC trends and the CSA trends,
ANOVA was used to test if separate linear and quadratic were required. The results of
this test were not significant (Plain Steel, P=0.191; Coated Steel, P=0.117; PVA,
P=0.118; PP, P=0.140) and therefore separate quadratic and cubic interactions were not
required, and indeed there does exist significant difference between the trends of the OPC
and CSA cements over time.
Mean values of the interface-shear strength for the fibers in each cement type are shown
in Figures 6-5, 6-6, 6-7 and 6-8. The results of the respective ANOVA analyses are
shown in Tables 6-4 through 6-7; the four fiber types were placed into more generalized
groups, steel fiber and synthetic fiber. There were differences in the days of curing
dependence based on the type of cement and fiber type. However there was no

145
overarching significant difference in the interface-shear strength for all cement types and
fiber types.
6.5.1. Steel Fiber Results
Steel fibers achieved a higher shear-bond strength than the synthetic fibers in both the
OPC and CSA cement matrices. Figure 6-13 shows the log plot of the ANOVA
procedure for shear strength with respect to plain-steel fibers. The plot shows similar,
positive, trending regression profiles for both types of CSA cement. However the
ordinary portland cement regression profile shows interaction over the entire curing time.
The similar trends of the CSA cements along with the interaction of the OPC trend
reinforces that statistical significance exists between cements regardless of the curing
time (P<0.0001) and in regards to curing time between linear coefficients (P<0.0001).
This significance supports the hypothesis that a reinforcing fiber performs differently in
CSA cements than in ordinary portland cement. There is agreement with this finding for
each fiber type evaluated.
Table 6-4. Type I ANOVA for effect of cement type and levels of days of curing on
shear strength for the plain-steel fiber
Source DF Type I SS Mean Square F Value Pr > F
Cement 2 6726.453232 3363.226616 170.29 <.0001
Day 1 1256.426524 1256.426524 63.62 <.0001
Day*Day 1 1487.607937 1487.607937 75.32 <.0001
Day*Cement 2 621.286952 310.643476 15.73 <.0001
Day*Day*Cement 2 71.461673 35.730836 1.81 0.1704

146
Figure 6-13. Analysis of variance response curves of shear strength for the plain-steel
fiber.
Figure 6-14 shows a plot of the ANOVA model for coated-steel fibers with shear strength
as the dependent variable. The Commercial and CSAB#4 CSA cements show similar
positive-trending quadratic lines with increasing interaction associated with increasing
curing time. More importantly there is a large difference between the linear coefficients
of the CSA cements and the ordinary portland cement (P=0.0007). The similar trend of
the CSA cements and the opposing trend of the portland cement, again, suggests
statistical significance (P<0.0001) that cement type does effect the shear strength of the
fiber-matrix composite.
0.0
0.5
1.0
1.5
2.0
2.5
3.0
3.5
4.0
4.5
0 20 40 60 80 100 120
Lo
g I
nte
rfac
e-S
hea
r S
tren
gth
Curing Time (days)
OPC
Commercial CSA
CSAB#4
OPC
Commercial CSA
CSAB#4

147
Table 6-5. Type I ANOVA for effect of cement type and levels of days of curing on
shear strength for the coated-steel fiber
Source DF Type I SS Mean Square F Value Pr > F
Cement 2 2394.279332 1197.139666 63.66 <.0001
Day 1 506.225230 506.225230 26.92 <.0001
Day*Day 1 1266.966800 1266.966800 67.37 <.0001
Day*Cement 2 297.468273 148.734136 7.91 0.0007
Day*Day*Cement 2 96.322678 48.161339 2.56 0.0835
Figure 6-14. Analysis of variance response curves of shear stress for the coated-steel
fiber.
0.0
0.5
1.0
1.5
2.0
2.5
3.0
3.5
4.0
0 20 40 60 80 100 120
Lo
g I
nte
rfac
e-S
hea
r S
tren
gth
Curing Time (days)
OPC
Commercial CSA
CSAB#4
OPC
Commercial CSA
CSAB#4

148
6.5.2. Synthetic Fiber Results
The ANOVA test demonstrated statistically significant difference (P=0.0055) between
the shear strength of polypropylene fibers embedded in CSA cements as compared to the
same fiber embedded in ordinary portland cement, no accounting for curing time. Figure
15 depicts an increasing trend for the CSA cements to 56 days of curing after which each
cement type shows a decreasing trend. Interaction exists between each cement type of 1
day of curing, particularly between the CSA cements and OPC (P=0.0055). However as
compared to Figures 6-13 and 6-14 there is less statistical difference between CSA
cement and OPC for the polypropylene fiber with respect to curing time for both the
linear and quadratic coefficients (P=0.4003 and P=0.2237, respectively). However,
without consideration of cement type there is days of curing is significant with respect to
the dependent variable (P=0.0267).
Table 6-6. Type I ANOVA for effect of cement type and levels of days of curing on
shear stress for the polypropylene fiber
Source DF Type I SS Mean Square F Value Pr > F
Cement 2 2.49119434 1.24559717 5.56 0.0055
Day 1 0.53814899 0.53814899 2.40 0.1252
Day*Day 1 1.14147250 1.14147250 5.09 0.0267
Day*Cement 2 0.41523703 0.20761852 0.93 0.4003
Day*Day*Cement 2 0.68411897 0.34205949 1.53 0.2237

149
Figure 6-15. Analysis of variance response curves of shear stress for the polypropylene
fiber.
There is statistical significance (P=0.0230) between cement types with respect to the
dependent variable without consideration to the days of curing. The PVA fiber
demonstrated increasing quadratic trends for each cement type to 56 days before
decreasing to 112 days. Interaction exists after 1 day of curing between the OPC and
CSA cements, see Figure 6-16. This figure emphasizes that a reinforcing fiber will not
perform the same in calcium sulfoaluminate cement as they do in ordinary portland
cement.
-1.0
-0.5
0.0
0.5
1.0
1.5
0 20 40 60 80 100 120
Lo
g I
nte
rfac
e-S
hea
r S
tren
gth
Curing Time (days)
OPC
Commercial CSA
CSAB#4
OPC
Commercial CSA
CSAB#4

150
Table 6-7. Type I ANOVA for effect of cement type and levels of days of curing on
shear stress for the polyvinyl-alcohol fiber
Source DF Type I SS Mean Square F Value Pr > F
Cement 2 8.74460881 4.37230441 3.95 0.0230
Day 1 5.91172952 5.91172952 5.34 0.0233
Day*Day 1 19.14380669 19.14380669 17.30 <.0001
Day*Cement 2 1.50925435 0.75462717 0.68 0.5085
Day*Day*Cement 2 1.60415491 0.80207745 0.72 0.4875
Figure 6-16. Analysis of variance response curves of shear stress for the polyvinyl-
alcohol fiber.
-1.5
-1.0
-0.5
0.0
0.5
1.0
1.5
2.0
0 20 40 60 80 100 120
Lo
g I
nte
rfac
e-S
hea
r S
tren
gth
Curing Time (days)
OPC
Commercial CSA
CSAB#4
OPC
Commercial CSA
CSAB#4

151
6.6. Conclusion
This study examined the interface between four fiber types embedded in three different
types of cement. The fiber-matrix bond was evaluated by analysis of the interface shear
strength and fracture toughness related to single-fiber pullout.
1. An important factor contributing to the bond strength between fiber and matrix
was the ability to transfer interfacial stresses from fiber to matrix. The more
rigid-dense morphology of the CSA cement paste related to the ettringite crystal
structure yielded higher shear-bond strengths for both steel and synthetic fibers.
The morphology of the C-S-H in the OPC matrix provided a good fiber-matrix
bond, though lacked the strength and dense-structure found with ettringite in the
CSA matrices; this was evident by lower shear-bond strengths.
2. There are two ways to increase the effectiveness of reinforcing fibers, within
cementitious matrices, to protract the functional life of the composite and thereby
increasing the toughness; both of which involve decreasing the modulus of
elasticity ratio of fiber to matrix. First, for the same fiber type a higher modulus
cement matrix may be used, i.e. a calcium sulfoaluminate cement instead of an
ordinary portland cement. Second the age of the cement matrix will effectively
reduce the fiber-matrix elastic modulus ratio as the brittleness of the binder
increases.
3. ANOVA results for interfacial shear stress confirm that fibers embedded in
calcium sulfoaluminate cement do perform differently than the same type of
fibers embedded in ordinary portland cement.

152
CHAPTER 7 : CONCLUSIONS AND FUTURE WORK
7.1. General Conclusions
Based on the experiments performed in this dissertation several conclusions may be
drawn.
Chapter 2 focused on the development of a calcium sulfoaluminate cement fabricated
from coal combustion byproducts. A CSA cement was produced that performed similar
to a commercially available CSA cement.
Chapter 3 was centered on the evaluation of two primary parameters of the single-fiber
pullout test, peak load and toughness associated with complete fiber pullout. Results
demonstrated peak loads and overall toughness is enhanced (increased) by utilizing CSA
cement in place of ordinary portland cement as the base for the cementitious matrix. Steel
fibers achieved strengths much greater than those attained by the synthetic fibers, which
was associated with the high modulus of elasticity, and minimal elongation of the steel
fibers as compared to the softer synthetic fibers. By pairing a stiff fiber with a stiffer
cement than OPC, the CSA-cement/steel fiber combination proved to be an excellent
combination for a composite that may sustain high loads. As a result of increased loads
before the onset of fiber pullout a tougher material resulted with the steel fiber/CSA
cement combination. Even though the synthetic fibers did not achieve high peak loads
and were not as tough, these low modulus of elasticity fibers did improve the early-age
performance of the composite while demonstrating a more stable/consistent residual
strength after the onset of fiber pullout. The use of a CSA cement increased the peak

153
load and toughness of a fiber-matrix composite as compared to a composite fabricated
with OPC.
Chapter 4 and Chapter 5 concentrated on the multiple-cracking behavior, debonding-
energy prior to fiber pullout and the interfacial shear and bond stresses that exist at the
interface between fiber and matrix when applied to the single-fiber pullout test. An
increased debonding-energy density was developed in the CSA matrix as compared to the
portland matrix. The CSA matrix was better suited to absorb the energy inflicted on the
matrix, through the fiber, from a uniaxial load directed parallel to the embedded length of
the fiber. This increased energy absorption resulted in a larger energy density up to peak
load, after which point the fiber has become completely debonded from the surrounding
matrix and fiber pullout is initiated. In terms of multiple cracking, a larger energy
density before fiber pullout suggests the bond developed from the ettringite structure
within the transition zone favors the transfer of forces many times between the fiber and
matrix; thus influencing the multiple cracking behavior. Again pointing to the heart of
this research, reinforcing fibers perform differently in a calcium sulfoaluminate cement as
compared to an ordinary portland cement. The stress transition zone between the fiber
and matrix plays a pivotal role in defining the bond characteristics of a fiber-matrix
composite. Specifically the bond stresses and shear stresses developed within this zone
govern at what load and displacement a fiber will begin to debond, to be fully debonded,
to begin pullout, to whether frictional forces govern pullout or whether pseudo strain-
hardening of the composite will result. The research demonstrated in this dissertation
found that the utilization of CSA cements effectively reduced the fiber-matrix bond stress
and shear stress by lowering the fiber-matrix modulus of elasticity ratio. By utilizing a

154
higher modulus of elasticity matrix the effects are witnessed after only 1-day of curing,
this behavior continued as the matrix gained strength with time, effectively increasing the
modulus of elasticity with time. By lowering the fiber-matrix elastic modulus ratio the
stresses within the transition zone were lowered which increases the damage tolerant
behavior of the composite allowing for sustaining greater loads and creating a tougher
composite.
In summary from all of the research presented, it was determined that reinforcing fibers
chosen for an application with ordinary portland cement will not perform the same in a
calcium sulfoaluminate cement. The CSA cements, both commercially produced and that
produced in the laboratory from coal combustion byproducts, sustained higher peak loads
and produced a tougher fiber-matrix composite. This was true for both steel and synthetic
fibers.
7.2. Future Work
After having successfully demonstrated that cement type affects the performance of
embedded fibers, additional research should be considered to highlight
performance/behavior benefits of using CSA cements with fibers to identify unrealized
benefits or hidden dangers.
Additional research would include:
Test a suite of fibers to cover those that are commercially available; including
natural fibers, glass, carbon, etc…

155
Fibers in the presented research were straight, without any deformation.
Mechanically deformed fibers, i.e. hooked end, should be explored to see the
impact of the interaction between a CSA-based fiber composite.
Naturally the presented work should be scaled up to include multiple-fiber
composites to evaluate flexural strength, residual strength and compressive
strength performance. Additionally the effect of fiber inclination would need to be
evaluated as the matrix fracture zone around the fiber deformation would
certainly behave different in a CSA cement than for an OPC.
Specimens prepared in this study utilized only cement and water composites (i.e.
paste) to eliminate the effects of particle interaction from fine and coarse
aggregates.

156
APPENDICES
Appendix A : Statistical Analysis
Appendix A-1: List of factors and their levels for the single-fiber pullout test.
Test (levels) Factors
Cement Type Fiber Type Curing Days
1 OPC Polypropylene 1
2 OPC Polypropylene 7
3 OPC Polypropylene 21
4 OPC Polypropylene 28
5 OPC Polypropylene 56
6 OPC Polypropylene 112
7 OPC Polyvinyl Alcohol 1
8 OPC Polyvinyl Alcohol 7
9 OPC Polyvinyl Alcohol 21
10 OPC Polyvinyl Alcohol 28
11 OPC Polyvinyl Alcohol 56
12 OPC Polyvinyl Alcohol 112
13 OPC Cooper-Coated Steel 1
14 OPC Cooper-Coated Steel 7
15 OPC Cooper-Coated Steel 21
16 OPC Cooper-Coated Steel 28
17 OPC Cooper-Coated Steel 56
18 OPC Cooper-Coated Steel 112
19 OPC Plain Steel 1
20 OPC Plain Steel 7
21 OPC Plain Steel 21
22 OPC Plain Steel 28
23 OPC Plain Steel 56
24 OPC Plain Steel 112
25 Commercial CSA Polypropylene 1
26 Commercial CSA Polypropylene 7
27 Commercial CSA Polypropylene 21
28 Commercial CSA Polypropylene 28
29 Commercial CSA Polypropylene 56
30 Commercial CSA Polypropylene 112
31 Commercial CSA Polyvinyl Alcohol 1

157
Appendix A-1 (continued):
32 Commercial CSA Polyvinyl Alcohol 7
33 Commercial CSA Polyvinyl Alcohol 21
34 Commercial CSA Polyvinyl Alcohol 28
35 Commercial CSA Polyvinyl Alcohol 56
36 Commercial CSA Polyvinyl Alcohol 112
37 Commercial CSA Cooper-Coated Steel 1
38 Commercial CSA Cooper-Coated Steel 7
39 Commercial CSA Cooper-Coated Steel 21
40 Commercial CSA Cooper-Coated Steel 28
41 Commercial CSA Cooper-Coated Steel 56
42 Commercial CSA Cooper-Coated Steel 112
43 Commercial CSA Plain Steel 1
44 Commercial CSA Plain Steel 7
45 Commercial CSA Plain Steel 21
46 Commercial CSA Plain Steel 28
47 Commercial CSA Plain Steel 56
48 Commercial CSA Plain Steel 112
49 CAER CSA Polypropylene 1
50 CAER CSA Polypropylene 7
51 CAER CSA Polypropylene 21
52 CAER CSA Polypropylene 28
53 CAER CSA Polypropylene 56
54 CAER CSA Polypropylene 112
55 CAER CSA Polyvinyl Alcohol 1
56 CAER CSA Polyvinyl Alcohol 7
57 CAER CSA Polyvinyl Alcohol 21
58 CAER CSA Polyvinyl Alcohol 28
59 CAER CSA Polyvinyl Alcohol 56
60 CAER CSA Polyvinyl Alcohol 112
61 CAER CSA Cooper-Coated Steel 1
62 CAER CSA Cooper-Coated Steel 7
63 CAER CSA Cooper-Coated Steel 21
64 CAER CSA Cooper-Coated Steel 28
65 CAER CSA Cooper-Coated Steel 56
66 CAER CSA Cooper-Coated Steel 112
67 CAER CSA Plain Steel 1
68 CAER CSA Plain Steel 7
69 CAER CSA Plain Steel 21

158
Appendix A-1 (continued):
70 CAER CSA Plain Steel 28
71 CAER CSA Plain Steel 56
72 CAER CSA Plain Steel 112

159
APPE
ND
IX B
: SING
LE
-FIBE
R PU
LL
OU
T T
EST
DA
TA
Axial Stress Distribution
(MPa)
2.49E-02
1.97E-02
3.25E-02
6.89E-03
5.73E-02
7.47E-03
1.52E-02
9.95E-03
1.14E-02
2.67E-02
2.92E-02
1.46E-02
2.01E-02
3.81E-03
2.14E-02
Interfacial Shear Stress Distribution
(MPa)
-1.29E-04
-1.55E-04
1.34E-05
1.78E-04
-5.34E-04
1.95E-04
-7.71E-05
1.95E-04
9.44E-05
3.66E-05
4.59E-05
1.26E-04
1.49E-04
2.12E-04
1.37E-05
Bridging Stress (MPa)
115.19
102.01
119.92
42.66
149.81
96.74
119.68
63.93
67.55
121.03
126.07
73.54
83.07
33.24
125.84
Debonding-Energy Density
(mJ/mm3)
17.41
14.26
19.69
2.63
26.82
9.43
18.48
6.48
9.03
16.85
22.30
5.75
4.11
0.80
20.32
Interface Shear Stress (MPa)
3.23
2.43
6.08
2.64
3.97
6.54
3.13
8.72
4.53
8.05
10.47
8.33
13.81
5.98
6.68
Toughness (mJ)
42.57
36.93
91.17
40.19
47.86
16.28
28.43
68.19
20.72
74.59
139.24
52.23
135.18
73.93
76.34
Peak Load (N)
9.2
6.9
17.3
7.5
11.3
18.6
6.9
24.8
12.9
22.9
29.8
23.7
39.3
17
19
Fiber
Csteel
Csteel
Csteel
Csteel
Csteel
Csteel
Csteel
Csteel
Csteel
Csteel
Csteel
Csteel
Csteel
Csteel
Csteel
Cement
OPC
OPC
OPC
OPC
OPC
OPC
OPC
OPC
OPC
OPC
OPC
OPC
OPC
OPC
OPC
Day
1
1
1
1
1
7
7
7
7
7
21
21
21
21
21
Sample ID
SO1
SO2
SO3
SO4
SO5
SO6
SO7
SO8
SO9
SO10
SO11
SO12
SO13
SO14
SO15

160
Axial Stress Distribution
(MPa)
4.18E-02
3.72E-03
1.00E-02
3.31E-02
7.03E-03
1.48E-02
9.82E-03
8.98E-03
2.09E-02
7.97E-03
6.10E-03
9.83E-03
5.90E-03
1.48E-02
7.55E-03
Interfacial Shear Stress Distribution
(MPa)
1.69E-06
2.14E-04
2.01E-04
4.39E-05
2.05E-04
1.08E-04
1.79E-04
2.13E-04
1.45E-04
2.00E-04
2.06E-04
1.50E-04
2.12E-04
1.31E-04
1.39E-04
Bridging Stress (MPa)
116.63
32.94
54.87
92.80
45.75
77.05
55.98
51.34
85.74
49.09
42.91
58.73
41.92
74.31
52.39
Debonding-Energy Density
(mJ/mm3)
11.66
1.23
2.12
20.80
1.42
6.67
1.77
0.81
4.11
0.73
0.67
0.35
0.09
0.27
1.07
Interface Shear Stress (MPa)
12.83
6.64
14.02
12.16
10.54
7.91
10.05
16.41
14.90
11.28
11.35
7.98
12.55
10.05
5.52
Toughness (mJ)
141.11
69.77
52.11
144.89
72.94
56.93
90.55
129.82
30.31
84.80
124.19
105.84
113.74
121.31
92.37
Peak Load (N)
36.5
18.9
39.9
34.6
30
22.5
28.6
46.7
42.4
32.1
32.3
22.7
35.7
28.6
15.1
Fiber
Csteel
Csteel
Csteel
Csteel
Csteel
Csteel
Csteel
Csteel
Csteel
Csteel
Csteel
Csteel
Csteel
Csteel
Csteel
Cement
OPC
OPC
OPC
OPC
OPC
OPC
OPC
OPC
OPC
OPC
OPC
OPC
OPC
OPC
OPC
Day
28
28
28
28
28
56
56
56
56
56
112
112
112
112
112
Sample ID
SO16
SO17
SO18
SO19
SO20
SO21
SO22
SO23
SO24
SO25
SO26
SO27
SO28
SO29
SO30

161
Axial Stress Distribution
(MPa)
7.74E-04
3.08E-04
1.03E-03
6.98E-04
1.53E-03
7.64E-04
5.13E-04
6.86E-04
9.41E-04
9.15E-04
8.04E-04
3.07E-04
9.46E-04
5.69E-04
7.19E-04
Interfacial Shear Stress Distribution
(MPa)
5.14E-05
4.89E-08
4.43E-05
7.77E-05
3.29E-05
3.93E-05
1.83E-08
1.34E-05
2.17E-05
1.10E-05
3.14E-06
1.26E-05
1.65E-05
3.18E-05
3.07E-05
Bridging Stress (MPa)
15.66
19.85
18.57
13.77
23.74
17.34
29.41
19.47
21.22
23.10
25.80
13.42
22.67
15.83
17.90
Debonding-Energy Density
(mJ/mm3)
2.90
4.20
3.97
1.99
6.35
3.42
6.44
4.17
5.03
5.86
7.32
2.17
5.97
2.91
3.60
Interface Shear Stress (MPa)
1.33
0.44
1.73
1.33
2.46
1.89
1.08
1.52
2.16
2.01
1.94
0.77
2.41
1.55
1.95
Toughness (mJ)
29.69
2.46
50.11
39.90
77.91
70.88
28.08
28.76
65.18
50.13
62.04
15.35
81.43
31.28
46.35
Peak Load (N)
9
0.8
11.7
9
16.6
12.8
7.3
10.3
14.6
13.6
13.1
5.2
16.3
10.5
13.2
Fiber
PP
PP
PP
PP
PP
PP
PP
PP
PP
PP
PP
PP
PP
PP
PP
Cement
OPC
OPC
OPC
OPC
OPC
OPC
OPC
OPC
OPC
OPC
OPC
OPC
OPC
OPC
OPC
Day
1
1
1
1
1
7
7
7
7
7
21
21
21
21
21
Sample ID
PPO1
PPO2
PPO3
PPO4
PPO5
PPO6
PPO7
PPO8
PPO9
PPO10
PPO11
PPO12
PPO13
PPO14
PPO15

162
Axial Stress Distribution
(MPa)
6.33E-04
3.64E-04
4.32E-04
5.55E-04
5.21E-04
3.84E-04
5.80E-04
4.07E-04
5.40E-04
5.21E-04
8.06E-04
3.05E-04
1.28E-04
2.99E-04
3.81E-04
Interfacial Shear Stress Distribution
(MPa)
2.58E-08
5.93E-05
2.12E-06
2.70E-06
2.58E-08
8.99E-06
4.26E-06
3.53E-05
8.57E-06
4.95E-05
4.91E-09
7.97E-05
7.46E-05
5.89E-06
2.84E-06
Bridging Stress (MPa)
33.20
11.36
19.82
21.91
30.13
15.86
21.35
13.25
18.92
14.11
28.27
9.90
6.50
14.89
18.29
Debonding-Energy Density
(mJ/mm3)
6.68
1.13
3.48
5.58
7.62
3.01
5.32
3.09
4.28
2.23
6.90
1.12
0.00
2.09
4.06
Interface Shear Stress (MPa)
1.55
1.18
1.07
1.38
1.28
0.99
1.47
1.18
1.39
1.63
2.10
1.20
0.49
0.80
1.01
Toughness (mJ)
33.57
21.39
2.85
48.32
13.46
13.46
33.67
27.67
28.25
40.39
13.21
19.54
16.74
8.12
9.54
Peak Load (N)
10.5
6
0.8
9.3
6
6
9.9
8
9.4
18
14.2
8.1
3.3
5.4
6.8
Fiber
PP
PP
PP
PP
PP
PP
PP
PP
PP
PP
PP
PP
PP
PP
PP
Cement
OPC
OPC
OPC
OPC
OPC
OPC
OPC
OPC
OPC
OPC
OPC
OPC
OPC
OPC
OPC
Day
28
28
28
28
28
56
56
56
56
56
112
112
112
112
112
Sample ID
PPO16
PPO17
PPO18
PPO19
PPO20
PPO21
PPO22
PPO23
PPO24
PPO25
PPO26
PPO27
PPO28
PPO29
PPO30
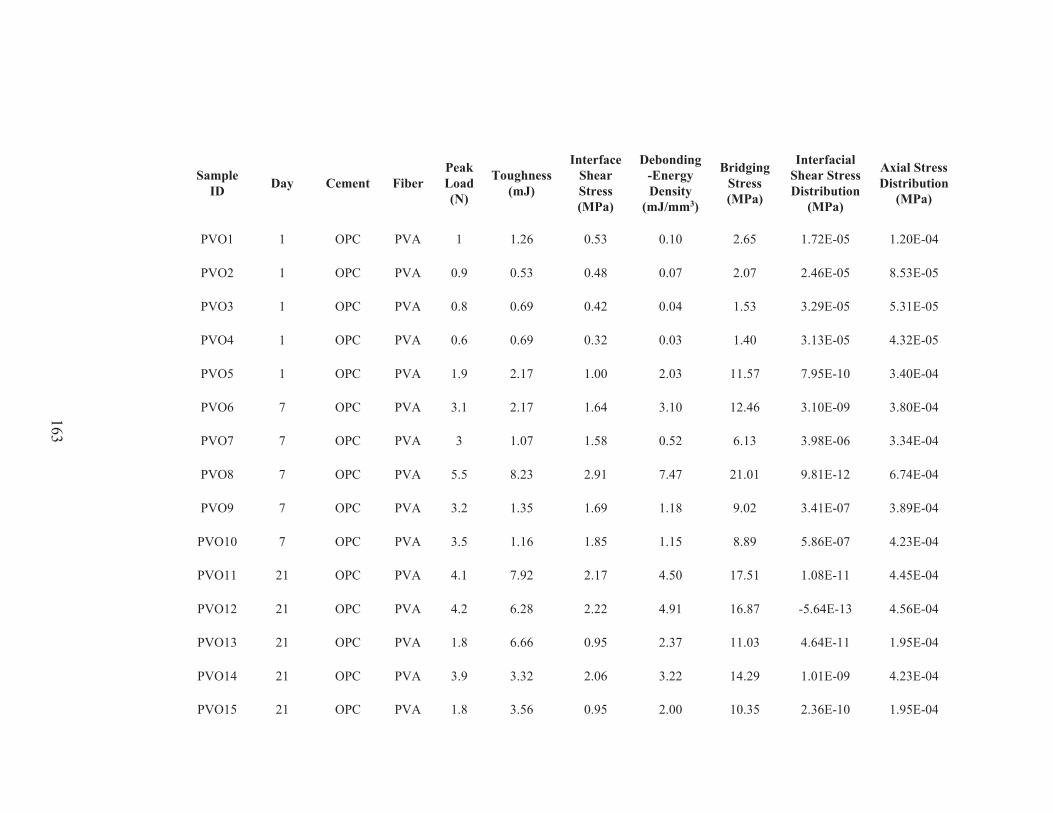
163
Axial Stress Distribution
(MPa)
1.20E-04
8.53E-05
5.31E-05
4.32E-05
3.40E-04
3.80E-04
3.34E-04
6.74E-04
3.89E-04
4.23E-04
4.45E-04
4.56E-04
1.95E-04
4.23E-04
1.95E-04
Interfacial Shear Stress Distribution
(MPa)
1.72E-05
2.46E-05
3.29E-05
3.13E-05
7.95E-10
3.10E-09
3.98E-06
9.81E-12
3.41E-07
5.86E-07
1.08E-11
-5.64E-13
4.64E-11
1.01E-09
2.36E-10
Bridging Stress (MPa)
2.65
2.07
1.53
1.40
11.57
12.46
6.13
21.01
9.02
8.89
17.51
16.87
11.03
14.29
10.35
Debonding-Energy Density
(mJ/mm3)
0.10
0.07
0.04
0.03
2.03
3.10
0.52
7.47
1.18
1.15
4.50
4.91
2.37
3.22
2.00
Interface Shear Stress (MPa)
0.53
0.48
0.42
0.32
1.00
1.64
1.58
2.91
1.69
1.85
2.17
2.22
0.95
2.06
0.95
Toughness (mJ)
1.26
0.53
0.69
0.69
2.17
2.17
1.07
8.23
1.35
1.16
7.92
6.28
6.66
3.32
3.56
Peak Load (N)
1
0.9
0.8
0.6
1.9
3.1
3
5.5
3.2
3.5
4.1
4.2
1.8
3.9
1.8
Fiber
PVA
PVA
PVA
PVA
PVA
PVA
PVA
PVA
PVA
PVA
PVA
PVA
PVA
PVA
PVA
Cement
OPC
OPC
OPC
OPC
OPC
OPC
OPC
OPC
OPC
OPC
OPC
OPC
OPC
OPC
OPC
Day
1
1
1
1
1
7
7
7
7
7
21
21
21
21
21
Sample ID
PVO1
PVO2
PVO3
PVO4
PVO5
PVO6
PVO7
PVO8
PVO9
PVO10
PVO11
PVO12
PVO13
PVO14
PVO15

164
Axial Stress Distribution
(MPa)
5.98E-04
4.94E-04
3.79E-04
2.95E-04
3.68E-04
4.06E-04
2.70E-04
3.93E-04
5.41E-04
4.57E-04
2.38E-04
2.38E-04
3.07E-04
1.78E-04
3.61E-04
Interfacial Shear Stress Distribution
(MPa)
1.04E-07
3.20E-08
1.42E-10
1.60E-11
2.36E-09
9.33E-09
-1.79E-10
2.21E-07
-1.38E-11
1.36E-08
7.40E-09
4.21E-10
1.22E-10
2.57E-08
5.63E-07
Bridging Stress (MPa)
12.85
15.77
15.83
14.17
13.88
12.56
18.66
9.77
25.13
13.03
9.85
11.38
13.62
10.89
9.60
Debonding-Energy Density
(mJ/mm3)
3.85
3.05
3.37
4.07
3.61
0.22
5.70
1.25
10.91
2.16
1.03
2.88
2.40
1.18
0.41
Interface Shear Stress (MPa)
3.01
2.48
1.90
1.48
1.85
2.06
1.37
2.01
2.75
2.32
1.27
1.27
1.64
0.95
1.95
Toughness (mJ)
2.45
2.10
9.58
7.43
2.76
8.30
5.85
1.93
7.27
2.34
1.63
0.86
2.01
1.05
1.86
Peak Load (N)
5.7
4.7
3.6
2.8
3.5
3.9
2.6
3.8
5.2
4.4
2.4
2.4
3.1
1.8
3.7
Fiber
PVA
PVA
PVA
PVA
PVA
PVA
PVA
PVA
PVA
PVA
PVA
PVA
PVA
PVA
PVA
Cement
OPC
OPC
OPC
OPC
OPC
OPC
OPC
OPC
OPC
OPC
OPC
OPC
OPC
OPC
OPC
Day
28
28
28
28
28
56
56
56
56
56
112
112
112
112
112
Sample ID
PVO16
PVO17
PVO18
PVO19
PVO20
PVO21
PVO22
PVO23
PVO24
PVO25
PVO26
PVO27
PVO28
PVO29
PVO30

165
Axial Stress Distribution
(MPa)
3.31E-02
1.45E-02
1.73E-02
5.24E-02
2.90E-02
1.29E-02
1.25E-02
2.06E-02
1.92E-02
2.83E-02
2.68E-02
3.88E-02
4.24E-02
4.04E-02
3.91E-02
Interfacial Shear Stress Distribution
(MPa)
-5.87E-05
1.05E-05
3.16E-06
-8.28E-05
2.50E-05
2.03E-05
-2.17E-05
1.46E-05
2.90E-05
4.41E-05
3.28E-05
2.97E-06
6.17E-05
5.84E-05
5.66E-05
Bridging Stress (MPa)
105.03
81.21
90.17
121.24
111.32
109.05
107.60
116.01
103.88
118.41
124.30
132.95
140.06
138.23
106.58
Debonding-Energy Density
(mJ/mm3)
28.32
7.69
2.46
43.25
11.55
10.39
11.83
50.59
12.32
16.47
7.23
48.61
16.92
28.98
22.58
Interface Shear Stress (MPa)
5.52
2.95
3.44
8.22
6.22
4.04
3.34
6.29
6.22
9.77
10.05
12.79
18.35
17.19
16.45
Toughness (mJ)
75.07
21.73
41.80
80.93
68.71
34.55
17.16
73.64
26.15
62.41
61.51
138.35
138.49
174.32
88.57
Peak Load (N)
15.7
8.4
9.8
23.4
17.7
8.5
6.5
17.9
17.7
27.8
28.6
36.4
52.2
48.9
46.8
Fiber
Psteel
Psteel
Psteel
Psteel
Psteel
Psteel
Psteel
Psteel
Psteel
Psteel
Psteel
Psteel
Psteel
Psteel
Psteel
Cement
OPC
OPC
OPC
OPC
OPC
OPC
OPC
OPC
OPC
OPC
OPC
OPC
OPC
OPC
OPC
Day
1
1
1
1
1
7
7
7
7
7
21
21
21
21
21
Sample ID
PSo1
PSo2
PSo3
PSo4
PSo5
PSo6
PSo7
PSo8
PSo9
PSo10
PSo11
PSo12
PSo13
PSo14
PSo15

166
Axial Stress Distribution
(MPa)
1.27E-02
1.49E-02
9.11E-02
4.01E-02
3.84E-02
4.03E-02
3.13E-02
3.45E-02
4.59E-02
4.08E-02
1.38E-02
1.41E-02
3.08E-02
5.41E-02
2.81E-02
Interfacial Shear Stress Distribution
(MPa)
1.88E-04
1.79E-04
-1.67E-05
1.84E-05
5.53E-05
2.14E-05
4.58E-05
9.89E-05
1.27E-05
4.84E-05
5.94E-05
6.13E-05
5.33E-05
2.15E-05
2.45E-05
Bridging Stress (MPa)
80.58
86.40
203.01
166.14
136.75
163.82
127.99
115.83
126.24
144.80
91.66
92.24
124.61
191.87
135.79
Debonding-Energy Density
(mJ/mm3)
3.42
2.97
66.15
37.89
20.40
42.22
4.04
20.59
44.09
25.02
10.26
10.83
21.43
76.18
22.22
Interface Shear Stress (MPa)
18.03
18.56
28.61
14.55
16.63
15.01
13.08
19.72
16.45
17.29
6.54
6.78
14.13
21.19
11.18
Toughness (mJ)
170.64
166.64
224.23
127.38
187.92
126.54
167.73
193.19
138.83
151.87
85.61
56.55
131.39
181.79
105.45
Peak Load (N)
51.3
52.8
81.4
41.4
47.3
42.7
37.2
56.1
46.8
49.2
18.6
19.3
40.2
60.3
31.8
Fiber
Psteel
Psteel
Psteel
Psteel
Psteel
Psteel
Psteel
Psteel
Psteel
Psteel
Psteel
Psteel
Psteel
Psteel
Psteel
Cement
OPC
OPC
OPC
OPC
OPC
OPC
OPC
OPC
OPC
OPC
OPC
OPC
OPC
OPC
OPC
Day
28
28
28
28
28
56
56
56
56
56
112
112
112
112
112
Sample ID
PSo16
PSo17
PSo18
PSo19
PSo20
PSo21
PSo22
PSo23
PSo24
PSo25
PSo26
PSo27
PSo28
PSo29
PSo30

167
Axial Stress Distribution
(MPa)
5.76E-02
5.66E-03
8.75E-03
1.71E-02
1.19E-02
3.83E-02
6.16E-02
6.07E-02
3.76E-02
4.71E-02
5.37E-02
3.77E-02
5.63E-02
4.46E-02
5.16E-02
Interfacial Shear Stress Distribution
(MPa)
2.07E-06
4.69E-05
5.84E-05
2.68E-05
5.14E-05
3.75E-05
4.69E-05
3.75E-05
7.00E-05
4.43E-05
1.84E-05
9.29E-05
1.03E-05
7.36E-05
4.29E-05
Bridging Stress (MPa)
214.19
194.52
165.36
132.73
182.84
151.98
185.65
191.41
134.69
163.87
194.39
129.35
123.87
147.61
175.76
Debonding-Energy Density
(mJ/mm3)
24.03
41.32
24.53
13.46
42.72
19.35
40.06
44.00
10.26
26.97
33.17
16.02
30.41
19.75
32.74
Interface Shear Stress (MPa)
16.10
1.90
3.09
5.27
4.08
14.45
24.32
22.92
16.73
18.35
20.53
21.76
20.77
22.74
22.21
Toughness (mJ)
111.16
4.82
30.13
50.92
32.86
118.32
164.86
158.80
100.22
149.20
109.65
132.29
100.21
180.28
198.41
Peak Load (N)
45.8
2.4
8.8
15
11.6
41.1
69.2
65.2
47.6
52.2
58.4
61.9
59.1
64.7
63.2
Fiber
Csteel
Csteel
Csteel
Csteel
Csteel
Csteel
Csteel
Csteel
Csteel
Csteel
Csteel
Csteel
Csteel
Csteel
Csteel
Cement
CommCSA
CommCSA
CommCSA
CommCSA
CommCSA
CommCSA
CommCSA
CommCSA
CommCSA
CommCSA
CommCSA
CommCSA
CommCSA
CommCSA
CommCSA
Day
1
1
1
1
1
7
7
7
7
7
21
21
21
21
21
Sample ID
SQ1
SQ2
SQ3
SQ4
SQ5
SQ6
SQ7
SQ8
SQ9
SQ10
SQ11
SQ12
SQ13
SQ14
SQ15

168
Axial Stress Distribution
(MPa)
3.71E-02
3.85E-02
5.60E-02
1.61E-02
7.06E-02
3.49E-02
2.78E-02
2.44E-02
2.78E-02
4.23E-02
3.24E-02
2.58E-02
1.99E-02
3.20E-02
3.58E-02
Interfacial Shear Stress Distribution
(MPa)
9.76E-05
8.28E-05
4.04E-05
1.80E-04
-6.62E-06
6.91E-05
1.08E-04
1.22E-04
1.01E-04
6.02E-05
5.65E-05
7.85E-05
9.55E-05
7.76E-05
5.18E-05
Bridging Stress (MPa)
127.56
134.56
186.05
103.12
208.07
133.95
108.87
119.26
110.43
151.43
133.85
112.00
94.32
125.02
142.93
Debonding-Energy Density
(mJ/mm3)
14.90
15.21
21.12
1.18
75.24
21.75
10.34
8.40
12.01
23.35
2.26
2.58
1.60
6.55
10.69
Interface Shear Stress (MPa)
23.02
21.62
24.60
24.92
24.99
19.09
19.93
19.82
18.87
21.90
16.12
14.71
12.73
18.12
17.34
Toughness (mJ)
86.17
96.55
171.11
86.17
176.43
99.86
103.36
100.12
102.66
147.83
114.85
98.21
126.24
104.65
111.21
Peak Load (N)
65.5
61.5
70
70.9
71.1
54.3
56.7
56.4
53.7
62.3
45.87
41.85
36.23
51.56
49.32
Fiber
Csteel
Csteel
Csteel
Csteel
Csteel
Csteel
Csteel
Csteel
Csteel
Csteel
Csteel
Csteel
Csteel
Csteel
Csteel
Cement
CommCSA
CommCSA
CommCSA
CommCSA
CommCSA
CommCSA
CommCSA
CommCSA
CommCSA
CommCSA
CommCSA
CommCSA
CommCSA
CommCSA
CommCSA
Day
28
28
28
28
28
56
56
56
56
56
112
112
112
112
112
Sample ID
SQ16
SQ17
SQ18
SQ19
SQ20
SQ21
SQ22
SQ23
SQ24
SQ25
SQ26
SQ27
SQ28
SQ29
SQ30

169
Axial Stress Distribution
(MPa)
4.44E-04
4.91E-04
6.70E-04
5.11E-04
6.45E-04
4.17E-04
7.73E-04
5.67E-04
5.42E-04
8.65E-04
5.05E-04
6.72E-04
5.51E-04
5.14E-04
3.94E-04
Interfacial Shear Stress Distribution
(MPa)
2.46E-05
1.02E-05
5.18E-06
3.65E-06
5.01E-06
4.94E-05
8.45E-10
2.12E-09
6.00E-06
9.27E-09
2.39E-06
3.10E-08
2.46E-06
1.49E-08
7.27E-05
Bridging Stress (MPa)
14.44
17.28
21.99
19.97
21.64
12.70
43.51
35.86
19.97
41.39
21.81
34.97
22.70
31.81
21.62
Debonding-Energy Density
(mJ/mm3)
2.41
3.25
5.68
4.72
5.51
3.74
50.63
15.98
4.49
20.40
5.39
15.01
6.19
3.83
0.65
Interface Shear Stress (MPa)
1.10
1.14
1.52
1.15
1.47
1.36
2.00
1.47
1.44
2.24
1.45
1.91
1.58
1.46
1.65
Toughness (mJ)
20.88
17.95
41.57
21.57
30.72
38.37
51.94
31.76
27.51
42.87
33.04
41.24
36.73
7.92
14.83
Peak Load (N)
7.4
7.7
10.3
7.8
9.9
9.2
13.5
9.9
9.7
15.1
9.8
12.9
10.7
3.1
4.4
Fiber
PP
PP
PP
PP
PP
PP
PP
PP
PP
PP
PP
PP
PP
PP
PP
Cement
CommCSA
CommCSA
CommCSA
CommCSA
CommCSA
CommCSA
CommCSA
CommCSA
CommCSA
CommCSA
CommCSA
CommCSA
CommCSA
CommCSA
CommCSA
Day
1
1
1
1
1
7
7
7
7
7
21
21
21
21
21
Sample ID
PPQ1
PPQ2
PPQ3
PPQ4
PPQ5
PPQ6
PPQ7
PPQ8
PPQ9
PPQ10
PPQ11
PPQ12
PPQ13
PPQ14
PPQ15

170
Axial Stress Distribution
(MPa)
4.84E-04
1.05E-03
7.40E-04
3.46E-04
7.93E-04
4.27E-04
5.91E-04
5.04E-04
6.33E-04
6.98E-04
4.82E-04
3.97E-04
5.71E-04
3.72E-04
4.24E-04
Interfacial Shear Stress Distribution
(MPa)
4.88E-06
1.71E-06
2.52E-06
8.05E-06
2.82E-10
3.86E-07
3.72E-06
6.55E-07
5.70E-06
3.35E-10
1.28E-08
6.04E-08
1.15E-09
3.67E-06
3.33E-07
Bridging Stress (MPa)
19.83
32.77
26.39
15.73
47.31
24.03
22.82
24.99
22.44
44.58
31.52
26.21
38.30
18.07
24.12
Debonding-Energy Density
(mJ/mm3)
4.68
12.66
7.23
2.91
36.26
6.66
5.80
7.26
5.67
52.60
9.43
6.84
17.57
2.53
4.94
Interface Shear Stress (MPa)
1.45
3.11
2.19
1.05
2.32
1.32
1.85
1.55
2.00
2.15
1.46
1.20
1.73
1.15
1.29
Toughness (mJ)
42.59
63.19
56.11
17.97
59.95
27.21
40.50
43.16
38.22
77.35
38.69
41.56
42.58
36.63
33.99
Peak Load (N)
9.8
21
14.8
7.1
15.7
8.9
12.5
10.5
13.5
14.5
9.87
8.12
11.69
7.74
8.69
Fiber
PP
PP
PP
PP
PP
PP
PP
PP
PP
PP
PP
PP
PP
PP
PP
Cement
CommCSA
CommCSA
CommCSA
CommCSA
CommCSA
CommCSA
CommCSA
CommCSA
CommCSA
CommCSA
CommCSA
CommCSA
CommCSA
CommCSA
CommCSA
Day
28
28
28
28
28
56
56
56
56
56
112
112
112
112
112
Sample ID
PPQ16
PPQ17
PPQ18
PPQ19
PPQ20
PPQ21
PPQ22
PPQ23
PPQ24
PPQ25
PPQ26
PPQ27
PPQ28
PPQ29
PPQ30

171
Axial Stress Distribution
(MPa)
1.57E-04
2.67E-04
1.51E-04
7.52E-05
1.02E-04
3.86E-04
6.00E-04
4.40E-04
4.50E-04
4.50E-04
7.73E-04
2.82E-04
3.91E-04
5.91E-04
4.45E-04
Interfacial Shear Stress Distribution
(MPa)
6.49E-06
6.22E-12
-2.68E-11
1.17E-05
1.37E-05
4.40E-07
1.03E-09
6.75E-13
1.84E-10
3.66E-09
3.85E-11
9.90E-12
1.45E-10
2.89E-10
1.94E-09
Bridging Stress (MPa)
3.91
13.59
12.43
2.42
2.73
9.11
17.32
19.31
16.18
14.07
23.01
14.57
15.56
18.59
14.78
Debonding-Energy Density
(mJ/mm3)
0.20
3.14
2.80
0.07
0.09
1.38
3.73
5.89
4.33
2.69
9.58
5.72
15.22
12.30
6.03
Interface Shear Stress (MPa)
0.85
1.22
0.69
0.48
0.69
2.06
3.17
2.32
2.38
2.38
4.49
1.64
2.27
3.43
2.59
Toughness (mJ)
2.87
12.54
7.11
1.29
2.68
1.54
4.41
7.80
4.32
3.95
10.53
8.39
2.30
11.11
4.40
Peak Load (N)
1.6
2.3
1.3
0.9
1.3
3.9
6
4.4
4.5
4.5
8.5
3.1
4.3
6.5
4.9
Fiber
PVA
PVA
PVA
PVA
PVA
PVA
PVA
PVA
PVA
PVA
PVA
PVA
PVA
PVA
PVA
Cement
CommCSA
CommCSA
CommCSA
CommCSA
CommCSA
CommCSA
CommCSA
CommCSA
CommCSA
CommCSA
CommCSA
CommCSA
CommCSA
CommCSA
CommCSA
Day
1
1
1
1
1
7
7
7
7
7
21
21
21
21
21
Sample ID
PVAQ1
PVAQ2
PVAQ3
PVAQ4
PVAQ5
PVAQ6
PVAQ7
PVAQ8
PVAQ9
PVAQ10
PVAQ11
PVAQ12
PVAQ13
PVAQ14
PVAQ15

172
Axial Stress Distribution
(MPa)
4.23E-04
7.32E-04
4.85E-04
4.50E-04
4.41E-04
4.45E-04
4.53E-04
2.54E-04
3.53E-04
2.93E-04
5.29E-04
4.69E-04
5.20E-04
3.33E-04
4.09E-04
Interfacial Shear Stress Distribution
(MPa)
2.02E-09
2.55E-09
2.55E-09
6.60E-11
3.04E-09
1.52E-11
4.42E-10
1.92E-06
-2.68E-13
9.40E-08
1.63E-12
5.58E-10
1.08E-09
1.57E-10
7.26E-10
Bridging Stress (MPa)
14.48
18.81
15.31
17.33
14.47
18.38
16.28
11.38
22.01
9.51
21.43
16.33
16.68
14.52
15.07
Debonding-Energy Density
(mJ/mm3)
1.22
4.35
1.56
5.27
0.93
4.47
3.84
0.51
6.73
0.97
9.50
5.46
4.42
1.84
3.04
Interface Shear Stress (MPa)
2.54
4.39
2.91
2.69
2.64
2.80
2.85
1.69
2.22
1.85
3.28
2.91
3.22
2.06
2.54
Toughness (mJ)
3.11
5.15
2.81
5.39
1.76
4.76
3.95
2.87
8.99
1.70
8.69
7.21
6.69
7.22
9.13
Peak Load (N)
4.8
8.3
5.5
5.1
5
5.3
5.4
3.2
4.2
3.5
6.2
5.5
6.1
3.9
4.8
Fiber
PVA
PVA
PVA
PVA
PVA
PVA
PVA
PVA
PVA
PVA
PVA
PVA
PVA
PVA
PVA
Cement
CommCSA
CommCSA
CommCSA
CommCSA
CommCSA
CommCSA
CommCSA
CommCSA
CommCSA
CommCSA
CommCSA
CommCSA
CommCSA
CommCSA
CommCSA
Day
28
28
28
28
28
56
56
56
56
56
112
112
112
112
112
Sample ID
PVAQ16
PVAQ17
PVAQ18
PVAQ19
PVAQ20
PVAQ21
PVAQ22
PVAQ23
PVAQ24
PVAQ25
PVAQ26
PVAQ27
PVAQ28
PVAQ29
PVAQ30

173
Axial Stress Distribution
(MPa)
2.81E-02
5.14E-02
4.50E-02
3.80E-02
4.22E-02
1.72E-02
2.60E-02
3.98E-02
2.07E-02
3.16E-02
2.18E-02
2.92E-02
1.72E-02
1.74E-02
1.06E-02
Interfacial Shear Stress Distribution
(MPa)
3.50E-05
3.61E-05
2.89E-05
7.26E-05
3.11E-05
1.31E-04
1.57E-04
5.71E-05
1.49E-04
4.78E-05
1.58E-04
1.43E-04
1.66E-04
1.69E-04
1.86E-04
Bridging Stress (MPa)
124.07
146.96
120.88
127.11
154.70
77.31
91.27
139.63
82.38
128.64
84.41
100.00
74.16
74.35
66.61
Debonding-Energy Density
(mJ/mm3)
18.92
38.93
58.16
20.29
31.14
4.05
5.70
26.05
6.24
18.97
5.80
10.94
4.73
0.89
1.00
Interface Shear Stress (MPa)
9.91
18.21
15.43
16.13
14.62
13.39
26.54
18.45
19.40
13.95
27.56
30.44
24.46
26.12
22.00
Toughness (mJ)
61.02
198.83
147.53
132.39
128.96
171.95
134.54
202.88
99.82
182.35
53.48
125.61
94.35
93.54
42.78
Peak Load (N)
28.2
51.8
43.9
45.9
41.6
38.1
75.5
52.5
55.2
39.7
78.4
86.6
69.6
74.3
62.6
Fiber
Psteel
Psteel
Psteel
Psteel
Psteel
Psteel
Psteel
Psteel
Psteel
Psteel
Psteel
Psteel
Psteel
Psteel
Psteel
Cement
CommCSA
CommCSA
CommCSA
CommCSA
CommCSA
CommCSA
CommCSA
CommCSA
CommCSA
CommCSA
CommCSA
CommCSA
CommCSA
CommCSA
CommCSA
Day
1
1
1
1
1
7
7
7
7
7
21
21
21
21
21
Sample ID
PSQ1
PSQ2
PSQ3
PSQ4
PSQ5
PSQ6
PSQ7
PSQ8
PSQ9
PSQ10
PSQ11
PSQ12
PSQ13
PSQ14
PSQ15

174
Axial Stress Distribution
(MPa)
1.69E-02
2.13E-02
9.43E-03
2.35E-02
1.00E-02
8.40E-03
1.34E-02
2.67E-02
1.35E-02
1.54E-02
1.73E-02
1.94E-02
1.98E-02
1.82E-02
1.35E-02
Interfacial Shear Stress Distribution
(MPa)
1.64E-04
1.54E-04
1.87E-04
1.42E-04
1.88E-04
1.79E-04
1.62E-04
1.48E-04
1.56E-04
1.71E-04
1.48E-04
1.57E-04
1.42E-04
1.54E-04
1.63E-04
Bridging Stress (MPa)
74.15
84.30
78.57
90.16
65.14
51.44
66.52
95.95
67.35
70.42
77.14
71.44
83.32
78.38
66.56
Debonding-Energy Density
(mJ/mm3)
4.17
5.73
0.68
0.83
0.33
1.69
0.98
1.25
0.41
1.34
0.42
2.14
1.52
0.83
0.25
Interface Shear Stress (MPa)
25.03
26.99
22.57
25.62
24.74
19.19
21.62
34.73
19.44
29.31
21.62
27.73
23.02
25.03
21.48
Toughness (mJ)
78.63
85.40
68.44
89.41
71.22
63.17
86.17
99.47
46.35
71.87
54.23
59.47
71.57
49.14
52.87
Peak Load (N)
71.2
76.8
64.2
72.9
70.4
54.6
61.5
98.8
55.3
83.4
61.5
78.9
65.5
71.2
61.1
Fiber
Psteel
Psteel
Psteel
Psteel
Psteel
Psteel
Psteel
Psteel
Psteel
Psteel
Psteel
Psteel
Psteel
Psteel
Psteel
Cement
CommCSA
CommCSA
CommCSA
CommCSA
CommCSA
CommCSA
CommCSA
CommCSA
CommCSA
CommCSA
CommCSA
CommCSA
CommCSA
CommCSA
CommCSA
Day
28
28
28
28
28
56
56
56
56
56
112
112
112
112
112
Sample ID
PSQ16
PSQ17
PSQ18
PSQ19
PSQ20
PSQ21
PSQ22
PSQ23
PSQ24
PSQ25
PSQ26
PSQ27
PSQ28
PSQ29
PSQ30

175
Axial Stress Distribution
(MPa)
2.07E-02
3.67E-02
3.68E-02
4.60E-02
2.17E-02
1.40E-02
1.89E-02
2.84E-02
1.64E-02
4.96E-02
2.07E-02
5.55E-02
1.82E-02
1.54E-02
2.27E-02
Interfacial Shear Stress Distribution
(MPa)
4.15E-05
5.87E-05
-2.11E-05
1.80E-05
3.20E-06
1.94E-04
1.02E-04
1.08E-04
4.49E-05
9.08E-05
1.72E-04
7.77E-05
1.75E-04
1.98E-04
1.77E-04
Bridging Stress (MPa)
105.13
132.55
180.79
172.44
127.40
84.86
86.99
105.45
94.36
144.31
81.89
159.02
86.55
78.44
85.25
Debonding-Energy Density
(mJ/mm3)
14.91
19.39
29.21
28.74
21.99
6.92
8.31
12.37
11.06
18.19
6.72
25.30
7.35
6.40
5.06
Interface Shear Stress (MPa)
6.47
12.37
9.07
13.04
5.83
15.15
8.86
13.85
5.69
21.76
19.16
24.29
17.43
20.35
22.07
Toughness (mJ)
97.99
110.23
123.65
128.36
56.74
171.85
83.11
127.89
62.67
177.52
159.61
107.25
119.48
109.12
112.87
Peak Load (N)
18.40
35.20
25.80
37.10
16.6
43.10
25.20
39.40
16.20
61.90
54.50
69.10
49.60
57.9
62.8
Fiber
Csteel
Csteel
Csteel
Csteel
Csteel
Csteel
Csteel
Csteel
Csteel
Csteel
Csteel
Csteel
Csteel
Csteel
Csteel
Cement
CSAB#4
CSAB#4
CSAB#4
CSAB#4
CSAB#4
CSAB#4
CSAB#4
CSAB#4
CSAB#4
CSAB#4
CSAB#4
CSAB#4
CSAB#4
CSAB#4
CSAB#4
Day
1
1
1
1
1
7
7
7
7
7
21
21
21
21
21
Sample ID
S4_1
S4_2
S4_3
S4_4
S4_5
S4_6
S4_7
S4_8
S4_9
S4_10
S4_11
S4_12
S4_13
S4_14
S4_15

176
Axial Stress Distribution
(MPa)
6.88E-02
5.78E-02
2.55E-02
2.21E-02
5.50E-02
4.48E-02
3.94E-02
3.97E-02
2.62E-02
4.69E-02
5.73E-02
5.23E-02
3.82E-02
4.09E-02
4.36E-02
Interfacial Shear Stress Distribution
(MPa)
9.07E-05
9.63E-05
1.62E-04
1.71E-04
1.29E-04
1.40E-04
1.42E-04
1.34E-04
1.60E-04
1.04E-04
6.55E-05
8.56E-05
1.08E-04
1.27E-04
9.92E-05
Bridging Stress (MPa)
92.14
105.85
92.34
84.95
102.70
85.31
105.88
90.80
74.48
108.95
69.93
103.93
81.10
75.17
106.31
Debonding-Energy Density
(mJ/mm3)
11.30
10.71
9.36
7.38
11.96
6.14
15.80
9.67
10.06
8.50
12.61
9.85
14.37
4.55
7.58
Interface Shear Stress (MPa)
33.14
28.82
21.62
20.88
34.62
32.55
29.10
27.38
23.13
25.62
26.43
27.17
23.09
28.79
24.78
Toughness (mJ)
201.14
161.73
148.39
213.31
188.96
203.49
199.48
171.19
165.98
176.15
200.14
206.11
184.26
192.44
189.34
Peak Load (N)
94.30
82.00
61.50
59.40
98.50
92.60
82.80
77.90
65.8
72.9
95.2
97.3
85.7
91.9
100.5
Fiber
Csteel
Csteel
Csteel
Csteel
Csteel
Csteel
Csteel
Csteel
Csteel
Csteel
Csteel
Csteel
Csteel
Csteel
Csteel
Cement
CSAB#4
CSAB#4
CSAB#4
CSAB#4
CSAB#4
CSAB#4
CSAB#4
CSAB#4
CSAB#4
CSAB#4
CSAB#4
CSAB#4
CSAB#4
CSAB#4
CSAB#4
Day
28
28
28
28
28
56
56
56
56
56
112
112
112
112
112
Sample ID
S4_16
S4_17
S4_18
S4_19
S4_20
S4_21
S4_22
S4_23
S4_24
S4_25
S4_26
S4_27
S4_28
S4_29
S4_30

177
Axial Stress Distribution
(MPa)
4.35E-04
1.30E-04
5.28E-04
2.80E-04
3.61E-04
3.89E-04
7.06E-04
4.34E-04
7.90E-04
2.91E-04
3.53E-04
6.41E-04
2.19E-04
5.19E-04
4.24E-04
Interfacial Shear Stress Distribution
(MPa)
9.44E-06
1.22E-04
-2.00E-10
1.06E-04
-3.78E-08
1.18E-05
3.29E-06
2.36E-05
5.44E-05
5.02E-05
1.75E-06
2.04E-05
8.26E-05
7.29E-05
2.95E-05
Bridging Stress (MPa)
16.30
5.74
39.33
8.67
37.26
15.19
23.93
14.46
16.87
10.40
18.27
18.16
8.26
13.04
13.91
Debonding-Energy Density
(mJ/mm3)
3.13
0.36
17.94
0.80
14.62
0.00
6.81
2.46
1.85
1.31
3.59
3.68
0.72
2.02
2.02
Interface Shear Stress (MPa)
0.96
0.52
1.13
1.01
0.77
0.95
1.66
1.11
2.34
0.84
0.87
1.72
0.81
1.82
1.18
Toughness (mJ)
19.32
15.74
34.49
27.50
13.87
42.68
50.62
27.90
37.63
18.91
18.57
24.81
13.21
21.47
16.62
Peak Load (N)
6.5
3.5
7.6
6.8
5.2
6.4
11.2
7.5
15.8
5.7
5.9
11.6
5.5
12.3
8.0
Fiber
PP
PP
PP
PP
PP
PP
PP
PP
PP
PP
PP
PP
PP
PP
PP
Cement
CSAB#4
CSAB#4
CSAB#4
CSAB#4
CSAB#4
CSAB#4
CSAB#4
CSAB#4
CSAB#4
CSAB#4
CSAB#4
CSAB#4
CSAB#4
CSAB#4
CSAB#4
Day
1
1
1
1
1
7
7
7
7
7
21
21
21
21
21
Sample ID
PP4_1
PP4_2
PP4_3
PP4_4
PP4_5
PP4_6
PP4_7
PP4_8
PP4_9
PP4_10
PP4_11
PP4_12
PP4_13
PP4_14
PP4_15
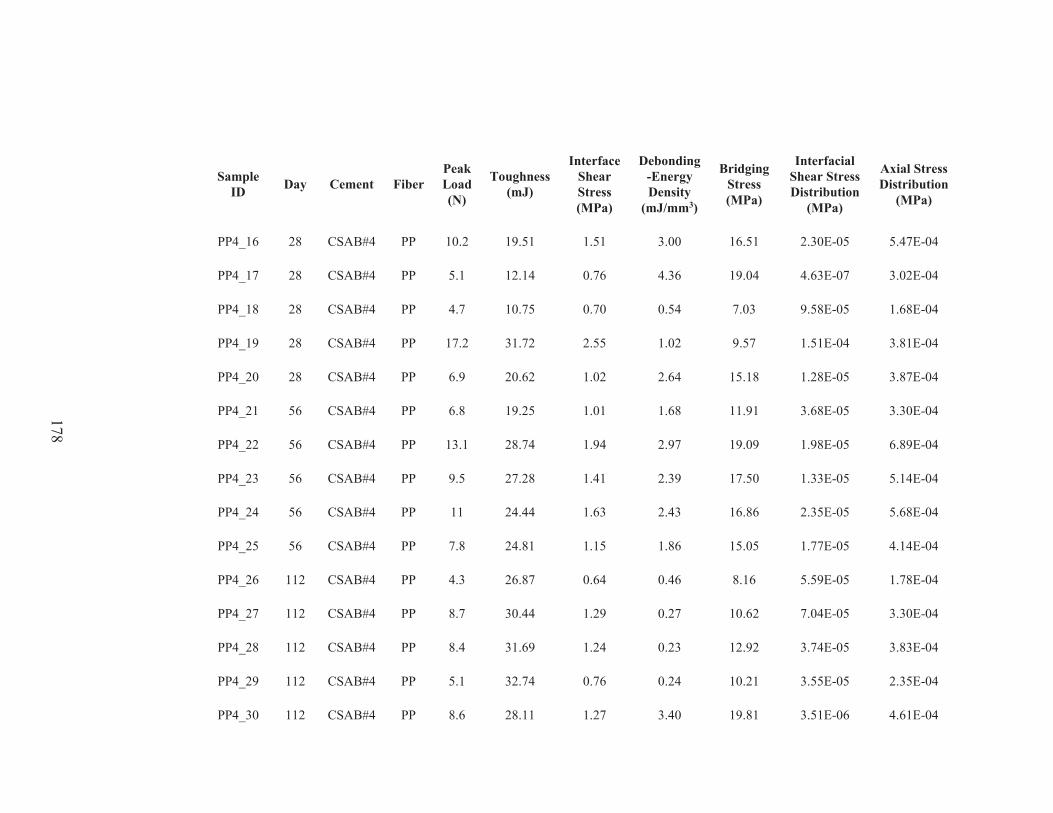
178
Axial Stress Distribution
(MPa)
5.47E-04
3.02E-04
1.68E-04
3.81E-04
3.87E-04
3.30E-04
6.89E-04
5.14E-04
5.68E-04
4.14E-04
1.78E-04
3.30E-04
3.83E-04
2.35E-04
4.61E-04
Interfacial Shear Stress Distribution
(MPa)
2.30E-05
4.63E-07
9.58E-05
1.51E-04
1.28E-05
3.68E-05
1.98E-05
1.33E-05
2.35E-05
1.77E-05
5.59E-05
7.04E-05
3.74E-05
3.55E-05
3.51E-06
Bridging Stress (MPa)
16.51
19.04
7.03
9.57
15.18
11.91
19.09
17.50
16.86
15.05
8.16
10.62
12.92
10.21
19.81
Debonding-Energy Density
(mJ/mm3)
3.00
4.36
0.54
1.02
2.64
1.68
2.97
2.39
2.43
1.86
0.46
0.27
0.23
0.24
3.40
Interface Shear Stress (MPa)
1.51
0.76
0.70
2.55
1.02
1.01
1.94
1.41
1.63
1.15
0.64
1.29
1.24
0.76
1.27
Toughness (mJ)
19.51
12.14
10.75
31.72
20.62
19.25
28.74
27.28
24.44
24.81
26.87
30.44
31.69
32.74
28.11
Peak Load (N)
10.2
5.1
4.7
17.2
6.9
6.8
13.1
9.5
11
7.8
4.3
8.7
8.4
5.1
8.6
Fiber
PP
PP
PP
PP
PP
PP
PP
PP
PP
PP
PP
PP
PP
PP
PP
Cement
CSAB#4
CSAB#4
CSAB#4
CSAB#4
CSAB#4
CSAB#4
CSAB#4
CSAB#4
CSAB#4
CSAB#4
CSAB#4
CSAB#4
CSAB#4
CSAB#4
CSAB#4
Day
28
28
28
28
28
56
56
56
56
56
112
112
112
112
112
Sample ID
PP4_16
PP4_17
PP4_18
PP4_19
PP4_20
PP4_21
PP4_22
PP4_23
PP4_24
PP4_25
PP4_26
PP4_27
PP4_28
PP4_29
PP4_30

179
Axial Stress Distribution
(MPa)
1.34E-04
2.09E-04
1.50E-04
1.23E-04
4.24E-05
5.35E-04
6.16E-05
6.84E-05
7.69E-05
3.68E-04
7.15E-04
5.78E-04
2.64E-04
4.94E-04
4.94E-04
Interfacial Shear Stress Distribution
(MPa)
9.10E-06
4.03E-06
7.48E-06
3.45E-06
1.79E-05
-3.43E-09
1.28E-05
2.01E-05
1.28E-05
1.65E-12
3.34E-11
7.71E-09
1.37E-06
3.30E-12
-9.38E-14
Bridging Stress (MPa)
3.37
4.84
3.70
3.80
1.65
26.41
2.17
2.07
2.42
16.77
21.51
15.13
6.54
19.31
21.57
Debonding-Energy Density
(mJ/mm3)
0.15
0.30
0.18
0.16
0.04
13.96
0.08
0.07
0.08
4.54
9.23
3.15
0.48
5.69
12.60
Interface Shear Stress (MPa)
0.74
1.00
0.79
0.58
0.32
2.54
0.42
0.63
0.53
1.74
3.59
2.91
1.37
2.48
2.48
Toughness (mJ)
1.34
1.37
1.64
0.90
0.31
21.94
0.60
2.42
1.62
16.34
12.00
3.39
0.55
5.88
17.70
Peak Load (N)
1.4
1.9
1.5
1.1
0.6
4.8
0.8
1.2
1
3.3
6.8
5.5
2.6
4.7
4.7
Fiber
PVA
PVA
PVA
PVA
PVA
PVA
PVA
PVA
PVA
PVA
PVA
PVA
PVA
PVA
PVA
Cement
CSAB#4
CSAB#4
CSAB#4
CSAB#4
CSAB#4
CSAB#4
CSAB#4
CSAB#4
CSAB#4
CSAB#4
CSAB#4
CSAB#4
CSAB#4
CSAB#4
CSAB#4
Day
1
1
1
1
1
7
7
7
7
7
21
21
21
21
21
Sample ID
PVA4_1
PVA4_2
PVA4_3
PVA4_4
PVA4_5
PVA4_6
PVA4_7
PVA4_8
PVA4_9
PVA4_10
PVA4_11
PVA4_12
PVA4_13
PVA4_14
PVA4_15

180
Axial Stress Distribution
(MPa)
3.00E-04
4.55E-04
6.72E-04
1.77E-03
5.58E-04
4.60E-04
3.00E-04
4.40E-04
5.31E-04
4.90E-04
3.90E-04
3.61E-04
4.94E-04
5.61E-04
3.90E-04
Interfacial Shear Stress Distribution
(MPa)
6.63E-11
3.80E-09
1.10E-11
2.24E-08
-2.76E-10
-9.30E-11
1.95E-11
-1.31E-12
4.30E-13
5.08E-14
-4.64E-12
-2.48E-13
-3.76E-12
4.61E-14
5.79E-13
Bridging Stress (MPa)
13.64
14.01
21.76
24.84
27.12
24.70
14.37
22.24
21.46
21.55
22.30
20.24
25.01
23.53
28.47
Debonding-Energy Density
(mJ/mm3)
0.99
10.52
6.23
6.57
11.30
11.48
9.86
6.86
5.51
6.13
8.26
6.01
10.87
7.89
6.06
Interface Shear Stress (MPa)
1.53
2.32
3.43
9.03
2.85
2.43
1.58
2.32
2.80
2.59
2.17
2.01
2.75
3.12
2.17
Toughness (mJ)
1.14
2.67
6.27
27.55
19.84
16.79
3.80
7.13
6.03
6.38
15.11
6.21
5.87
10.88
9.41
Peak Load (N)
2.9
4.4
6.5
17.1
5.4
4.6
3
4.4
5.3
4.9
4.1
3.8
5.2
5.9
4.1
Fiber
PVA
PVA
PVA
PVA
PVA
PVA
PVA
PVA
PVA
PVA
PVA
PVA
PVA
PVA
PVA
Cement
CSAB#4
CSAB#4
CSAB#4
CSAB#4
CSAB#4
CSAB#4
CSAB#4
CSAB#4
CSAB#4
CSAB#4
CSAB#4
CSAB#4
CSAB#4
CSAB#4
CSAB#4
Day
28
28
28
28
28
56
56
56
56
56
112
112
112
112
112
Sample ID
PVA4_16
PVA4_17
PVA4_18
PVA4_19
PVA4_20
PVA4_21
PVA4_22
PVA4_23
PVA4_24
PVA4_25
PVA4_26
PVA4_27
PVA4_28
PVA4_29
PVA4_30

181
REFERENCES
ACI, "Report on the Physical Properties and Durability of Fiber-Reinforced Concrete,"
ACI 5445R-10, March. 2010, pp. 35.
Arjunan P, Silsbee MR, Della MR, "Sulfoaluminate-belite cement from low-calcium fly
ash and sulfur-rich and other industrial by-products," Cement and Concrete Research, V.
29, No. 8. 1999, pp. 1305-11.
ASTM Standard C 109, 2011, “Standard Test Method for Compressive Strength of
Hydraulic Cement Mortars (Using 2-in. or [50-mm] Cube Specimens),” ASTM
International, West Conshohocken, PA, 2008, DOI: 10.1520/C0109_C0109M-11,
www.astm.org
Atkins AG, "Intermittent bonding for high toughness/ high strength composites," Journal
of Materials Science, V. 10, No. 5, 1975/05/01. 1975, pp. 819-32.
Aveston J, Cooper GA, Kelly A, "Single and Multiple Fracture," In: Proceedings of the
The Properties of Fiber Composites, Surrey, U.K., 1971, pp. 15-26.
Bartos P, "Review paper: Bond in fibre reinforced cements and concretes," International
Journal of Cement Composites and Lightweight Concrete, V. 3, No. 3. 1981, pp. 159-77.
Becher PF, Hsueh CH, Angelini P, Tiegs TN, "Toughening Behavior in Whisker‐Reinforced Ceramic Matrix Composites," Journal of the American Ceramic Society, V.
71, No. 12. 1988, pp. 1050-61.
Bentur A, Mindess S, Vondran G, "Bonding in polypropylene fibre reinforced concretes,"
International Journal of Cement Composites and Lightweight Concrete, V. 11, No. 3.
1989, pp. 153-8.
Beretka J, de Vito B, Santoro L, Sherman N, Valenti GL, "Hydraulic behaviour of
calcium sulfoaluminate-based cements derived from industrial process wastes," Cement
and Concrete Research, V. 23, No. 5. 1993, pp. 1205-14.
Bernardo G, Marroccoli M, Montagnaro F, Valenti GL, "Use of Fluidized Bed
Combustion Ash as Raw Feed in the Manufacture of Calcium Sulfoaluminate Cements,"
Fly Ash, Silica Fume, Slag, and Natural Pozzolans in Concrete, Malhotra VM, ed., 2004,
pp. 169-80.
Bernardo G, Telesca A, Valenti GL, "A porosimetric study of calcium sulfoaluminate
cement pastes cured at early ages," Cement and Concrete Research, V. 36, No. 6. 2006,
pp. 1042-7.
Betterman LR, Ouyang C, Shah SP, "Fiber-matrix interaction in microfiber-reinforced
mortar," Advanced Cement Based Materials, V. 2, No. 2. 1995, pp. 53-61.
Beyerlein IJ, Zhu YT, Mahesh S, "On the influence of fiber shape in bone-shaped short-
fiber composites," Composites Science and Technology, V. 61, No. 10. 2001, pp. 1341-
57.
182
Bin Y, Mine M, Koganemaru A, Jiang X, Matsuo M, "Morphology and mechanical and
electrical properties of oriented PVA-VGCF and PVA-MWNT composites," Polymer, V.
47, No. 4. 2006, pp. 1308-17.
Box GE, Cox DR, "An analysis of transformations," Journal of the Royal Statistical
Society Series B (Methodological). 1964, pp. 211-52.
Brandt AM, "Fibre reinforced cement-based (FRC) composites after over 40 years of
development in building and civil engineering," Composite Structures, V. 86, No. 1-3.
2008, pp. 3-9.
Brogren C, Karlsson HT, "Modeling the absorption of SO2 in a spray scrubber using the
penetration theory," Chemical Engineering Science, V. 52, No. 18. 1997, pp. 3085-99.
Brown ADR, "Application of Calcium Sulfoaluminate Cements in the 21st Century," In:
Proceedings of the Concrete 2000, Dundee, UK, 1993, pp. 1773-8.
Brown R, Shukla A, Natarajan KR, "Fiber Reinforcement of Concrete Structures,"
University of Rhode Island, Dept. of Chemical Engineering, City, 2002, pp. 51.
Brunner, E., Dette, H., and A. Munk, “Box-Type Approximations in Nonparametric
Factorial Designs,” Journal of the American Statistical Association, V. 92, 1997, pp.
1494-1502.
Cadek M, Coleman JN, Barron V, Hedicke K, Blau WJ, "Morphological and mechanical
properties of carbon-nanotube-reinforced semicrystalline and amorphous polymer
composites," Applied Physics Letters, V. 81, No. 27. 2002, pp. 5123-5.
Chan Y-W, Chu S-H, "Effect of silica fume on steel fiber bond characteristics in reactive
powder concrete," Cement and Concrete Research, V. 34, No. 7. 2004, pp. 1167-72.
Chanvillard, G., Aïtcin, P-C., "Pull-out behavior of corrugated steel fibers : Qualitative
and statistical analysis," Advanced Cement Based Materials, V. 4, No. 1. 1996, pp. 28-
41.
Chu TJ, Robertson RE, Najm H, Naaman AE, "Effects of poly(vinyl alcohol) on fiber
cement interfaces. Part II: Microstructures," Advanced Cement Based Materials, V. 1,
No. 3. 1994, pp. 122-30.
Cox HL, "The elasticity and strength of paper and other fibrous materials," British
Journal of Applied Physics, V. 3, No. 3. 1952, pp. 72.
Cox DR, McCullagh P, "A biometrics invited paper with discussion. Some aspects of
analysis of covariance," Biometrics. 1982, pp. 541-61.
Damtoft JS, Lukasik J, Herfort D, Sorrentino D, Gartner EM, "Sustainable development
and climate change initiatives," Cement and Concrete Research, V. 38, No. 2. 2008, pp.
115-27.

183
Evans AG, McMeeking RM, "On the toughening of ceramics by strong reinforcements,"
Acta Metallurgica, V. 34, No. 12. 1986, pp. 2435-41.
Fahlman BD, "What is Materials Chemistry?." Springer; 2011.
Gartner EM, Macphee DE, "A physico-chemical basis for novel cementitious binders,"
Cement and Concrete Research, V. 41, No. 7. 2011, pp. 736-49.
Glasser FP, Zhang L, "High-performance cement matrices based on calcium
sulfoaluminate-belite compositions," Cement and Concrete Research, V. 31, No. 12.
2001, pp. 1881-6.
Gray RJ, "Analysis of the effect of embedded fibre length on fibre debonding and pull-
out from an elastic matrix," Journal of Materials Science, V. 19, No. 3, 1984/03/01. 1984,
pp. 861-70.
Greszczuk L, "Theoretical studies of the mechanics of the fiber-matrix interface in
composites," Interfaces in composites, ASTM STP, V. 452. 1969, pp. 42-58.
Grier D, Jarabek E, Peterson R, Mergen L, McCarthy G, "Rietveld structure refinement
of carbonate and sulfite ettringite," Advances in X-ray Analysis, V. 45. 2002, pp. 194À9.
Hamoush S, Abu-Lebdeh T, Cummins T, Zornig B, "Pullout Characterizations of Various
Steel Fibers Embedded in Very High-Strength Concrete," American Journal of
Engineering and Applied Sciences, V. 3, No. 2. 2010, pp. 418-26.
Hannant DJ, "4.11 - Cement-based Composites," Comprehensive Composite Materials,
Kelly A, Zweben C, eds., Pergamon, Oxford, 2000, pp. 323-62.
Hartman MR, Berliner R, "Investigation of the structure of ettringite by time-of-flight
neutron powder diffraction techniques," Cement and Concrete Research, V. 36, No. 2,
2//. 2006, pp. 364-70.
Herrera-Franco PJ, Drzal LT, "Comparison of methods for the measurement of
fibre/matrix adhesion in composites," Composites, V. 23, No. 1. 1992, pp. 2-27.
Hertzberg RW, "Deformation and Fracture Mechanics of Engineering Materials." 4th ed.
Canada: John Wiley & Sons, Inc.; 1996.
Horikoshi, T., Ogawa, A., Saito, T., Hoshiro, H., "Properties of Polyvinylalcohol Fiber as
Reinforcing Materials for Cementitious Composites", Kuraray Co., Ltd., City, 2008, pp.
8.
Hsueh C-H, "Elastic load transfer from partially embedded axially loaded fibre to
matrix," Journal of Materials Science Letters, V. 7, No. 5, 1988/05/01. 1988, pp. 497-
500.
Hsueh C-H, "Interfacial debonding and fiber pull-out stresses of fiber-reinforced
composites," Materials Science and Engineering: A, V. 123, No. 1. 1990, pp. 1-11.

184
Hsueh CH, Becher PF, "Interfacial shear debonding problems in fiber-reinforced ceramic
composites," Acta Materialia, V. 46, No. 9. 1998, pp. 3237-45.
Ikeda K, "Cements along the join C4A3S-C2S," In: Proceedings of the 7th International
Congress on the Chemistry of Cement, Paris, 1980, pp. 31-6.
Janotka I, Krajci L, Ray A, Mojumdar SC, "The hydration phase and pore structure
formation in the blends of sulfoaluminate-belite cement with Portland cement," Cement
and Concrete Research, V. 33, No. 4. 2003, pp. 489-97.
Jewell RB, Mahboub KC, Robl TR, Bathke AC, "Interfacial Bond between Reinforcing
Fibers and Calcium Sulfoaluminate Cements: Fiber Pullout Characteristics," ACI
Materials Journal, V. 112, No. 1. 2015, pp. 39-48.
Johnston CD, "Fiber-Reinforced Cements and Concretes." Calgary: Gordon and Breach
Science Publishers; 2001.
Juenger MCG, Winnefeld F, Provis JL, Ideker JH, "Advances in alternative cementitious
binders," Cement and Concrete Research, V. 41, No. 12. 2011, pp. 1232-43.
Kanda T, Li VC, "Interface Property and Apparent Strength of High-Strength
Hydrophilic Fiber in Cement Matrix." ASCE; 1998.
Kim J-K, Kim J-S, Ha GJ, Kim YY, "Tensile and fiber dispersion performance of ECC
(engineered cementitious composites) produced with ground granulated blast furnace
slag," Cement and Concrete Research, V. 37, No. 7. 2007, pp. 1096-105.
Kim J-K, Mai Y-w, "High strength, high fracture toughness fibre composites with
interface control - A Review," Composites Science and Technology, V. 41, No. 4. 1991,
pp. 333-78.
Kim J, Mai Y, "Engineered Interfaces in Fiber Reinforced Composites." New York:
Elsevier; 1998.
Komatsu R, Mizukoshi N, Makida K, Tsukamoto K, "In-situ observation of ettringite
crystals," Journal of Crystal Growth, V. 311, No. 3. 2009, pp. 1005-8.
Leung CKY, Li VC, "Applications of a two-way debonding theory to short fibre
composites," Composites, V. 21, No. 4. 1990, pp. 305-17.
Li VC, Fischer G, "Reinforced ECC - An Evolution From Materials to Structures," In:
Proceedings of the First FIB Congress, Osaka, Japan, 2002, pp. 18.
Li VC, Kanda T, Lin Z, "The Influence of Fiber/Matrix Interface Properties on
Complementary Energy and Composite Damage Tolerance," In: Proceedings of the Key
Engineering Materials: Proceedings, 3rd Conf on Frac & Strength of Solids, Hong Kong,
1997, pp. 9.
Li V, Leung C, "Steady-State and Multiple Cracking of Short Random Fiber
Composites," Journal of Engineering Mechanics, V. 118, No. 11. 1992, pp. 2246-64.

185
Li VC, Stang H, "Interface property characterization and strengthening mechanisms in
fiber reinforced cement based composites," Advanced Cement Based Materials, V. 6, No.
1. 1997, pp. 1-20.
Li VC, Wu H-C, "Conditions for Pseudo Strain-Hardening in Fiber Reinforced Brittle
Matrix Composites," Applied Mechanics Reviews, V. 45, No. 8. 1992, pp. 390-8.
Li Z-F, Grubb DT, "Single-fibre polymer composites," Journal of Materials Science, V.
29, No. 1, 1994/01/01. 1994, pp. 189-202.
Lin Z, Li VC, "Crack bridging in fiber reinforced cementitious composites with slip-
hardening interfaces," Journal of the Mechanics and Physics of Solids, V. 45, No. 5.
1997, pp. 763-87.
Littell, R, Henry, P, Ammerman, C, “Statistical Analysis of Repeated Measures Data
Using SAS Procedures,” Journal of Animal Science, V. 76. 1998, pp. 1216-31.
Majling J, Znásik P, Gabrisová A, Svetík S, "The influence of anhydrite activity upon the
hydration of calcium sulphoaluminate cement clinker," Thermochimica Acta, V. 92.
1985, pp. 349-52.
Markovic I, "High-Performance Hybrid-Fibre Concrete-Development and Utilisation,"
Book High-Performance Hybrid-Fibre Concrete-Development and Utilisation, (Doctoral
Dissertation), Delft University of Technology, City, 2006, pp. 228.
Marroccoli M, Nobili M, Telesca A, Valenti GL, "Early Hydration of Calcium
Sulfoaluminate-Based Cements for Structural Applications." London: Taylor & Francis
Group; 2007.
Marshall DB, Cox BN, "A J-integral method for calculating steady-state matrix cracking
stresses in composites," Mechanics of Materials, V. 7, No. 2. 1988, pp. 127-33.
Marshall DB, Cox BN, Evans AG, "The mechanics of matrix cracking in brittle-matrix
fiber composites," Acta Metallurgica, V. 33, No. 11. 1985, pp. 2013-21.
Marston TU, Atkins AG, Felbeck DK, "Interfacial fracture energy and the toughness of
composites," Journal of Materials Science, V. 9, No. 3, 1974/03/01. 1974, pp. 447-55.
McDonald JH, "Handbook of biological statistics." Sparky House Publishing Baltimore,
MD; 2009.
Mehta PK, "Mechanism of expansion associated with ettringite formation," Cement and
Concrete Research, V. 3, No. 1. 1973, pp. 1-6.
Mehta PK, Monteiro PJM, "Concrete, Microstructure, Properties and Materials." 3rd ed.:
McGraw-Hill, USA; 2006.
Mobasher B, Cheng Yu L, "Effect of interfacial properties on the crack propagation in
cementitious composites," Advanced Cement Based Materials, V. 4, No. 3-4. 1996, pp.
93-105.
186
Mobasher B, Stang H, Shah SP, "Microcracking in fiber reinforced concrete," Cement
and Concrete Research, V. 20, No. 5. 1990, pp. 665-76.
Montgomery MD, "How does cement stabilisation work?." Stabilised Soil Research
Progress Report (SSRPR2). Warwick: School of Engineering Development Technology
Unit, University of Warwick, Warwick; 1998.
Moore A, Taylor HFW, "Crystal Structure of Ettringite," Nature, V. 218, No. 5146,
06/15/print. 1968, pp. 1048-9.
Naaman AE, Namur GG, Alwan JM, Najm HS, "Fiber Pullout and Bond Slip. I:
Analytical Study," Journal of Structural Engineering, V. 117, No. 9. 1991, pp. 2769-90.
Naebe M, Lin T, Staiger MP, Dai L, Wang X, "Electrospun single-walled carbon
nanotube/polyvinyl alcohol composite nanofibers: structure-property relationships,"
Nanotechnology, V. 19, No. 30. 2008, pp. 8.
Nairn JA, "A variational mechanics analysis of the stresses around breaks in embedded
fibers," Mechanics of Materials, V. 13, No. 2. 1992, pp. 131-54.
Nairn JA, Liu C-H, Mendels DA, Zhandarov S, "Fracture Mechanics Analysis of the
Single-Fiber Pull-Out Test and the Microbond Test Including The Effects of Friction and
Thermal Stresses," In: Proceedings of the 16th Ann Tech Conf of the Amer Soc
Composites, VPI, Blacskburg, VA, 2001, pp. 12.
Najm H, Naaman AE, Chu TJ, Robertson RE, "Effects of poly(vinyl alcohol) on fiber
cement interfaces. Part I: Bond stress-slip response," Advanced Cement Based Materials,
V. 1, No. 3. 1994, pp. 115-21.
Neville, A.M., "Properties of Concrete." Fourth ed. Singapore: Pearson Education Ltd.;
1995.
Pan N, "Theoretical Modeling and Analysis of Fiber-pull-out Behaviour from a Bonded
Fibrous Matrix: The Elastic-bond Case," Journal of the Textile Institute, V. 84, No. 3.
1993, pp. 472-85.
Pitkethly MJ, Doble JB, "Characterizing the fibre/matrix interface of carbon fibre-
reinforced composites using a single fibre pull-out test," Composites, V. 21, No. 5. 1990,
pp. 389-95.
Redon C, Li VC, Wu C, Hoshiro H, Saito T, Ogawa A, "Measuring and Modifying
Interface Properties of PVA Fibers in ECC Matrix," Journal of Materials in Civil
Engineering, V. 13, No. 6. 2001, pp. 399-406.
Richardson IG, "The nature of C-S-H in hardened cements," Cement and Concrete
Research, V. 29, No. 8. 1999, pp. 1131-47.
Roy DM, Silsbee MR, Xie Z, "Influences of Surplus SO3 in FBC Ash on Formation of
Belite-Rich Sulfoaluminate Clinker," Book Influences of Surplus SO3 in FBC Ash on
Formation of Belite-Rich Sulfoaluminate Clinker, Editor, ed.^eds., City, 1999, pp. 5.

187
Sahu S, Majling Jn, "Preparation of sulphoaluminate belite cement from fly ash," Cement
and Concrete Research, V. 24, No. 6. 1994, pp. 1065-72.
Schneider M, Romer M, Tschudin M, Bolio H, "Sustainable cement production-present
and future," Cement and Concrete Research, V. 41, No. 7. 2011, pp. 642-50.
Shah SP, "Do Fibers Increase the Tensile Strength of Cement-Based Matrixes?,"
American Concrete Institute Materials Journal, V. 88, No. 6, Nov-Dec 1991, pp. 595-602.
Sherman N, Beretka J, Santoro L, Valenti GL, "Long-term behaviour of hydraulic
binders based on calcium sulfoaluminate and calcium sulfosilicate," Cement and
Concrete Research, V. 25, No. 1. 1994, pp. 113-26.
Silknitter KO, Wisnowski JW, Montgomery DC, "The analysis of covariance: a useful
technique for analysing quality improvement experiments," Quality and reliability
engineering international, V. 15, No. 4. 1999, pp. 303-16.
Stang H, Li Z, Shah SP, "Pullout Problem: Stress versus Fracture Mechanical Approach,"
Journal of Engineering Mechanics, V. 116, No. 10. 1990, pp. 2136-50.
Stark J, Bollmann K, "Delayed ettringite formation in concrete," NORDIC CONCRETE
RESEARCH-PUBLICATIONS-, V. 23. 2000, pp. 4-28.
Stark J, Möser B, Bellmann F, "Nucleation and growth of C-S-H phases on mineral
admixtures," Advances in Construction Materials 2007, Grosse C, ed., Springer Berlin
Heidelberg, 2007, pp. 531-8.
Stengel, T., "Fibre Reinforced Civil Engineering Materials: A Model for Fibre Pull-Out
Based on Tribological Mechanisms and Contact Mechanics", 2010, pp. 9.
Subramani S, Gaurav N, "Fiber-Matrix Interface Characterization through the Microbond
Test," International Journal Aeronautical and Space Sciences, V. 13, No. 3. 2012, pp.
282-95.
Takaku A, Arridge RGC, "The effect of interfacial radial and shear stress on fibre pull-
out in composite materials," Journal of Physics D: Applied Physics, V. 6, No. 17. 1973,
pp. 2038.
Taylor HFW, "Cement Chemistry." 2nd ed. London: Thomas Telford; 1997.
Taylor HFW, Famy C, Scrivener KL, "Delayed ettringite formation," Cement and
Concrete Research, V. 31, No. 5. 2001, pp. 683-93.
Torre AFdl, Aranda MAG, Aza Moya AHd, Aza Pendas Sd, Pena Castro MdP, "Belite
Portland Clinkers. Synthesis and Mineralogical Analysis," Bol Soc Esp Ceram, V. 44,
No. 3, May. 2005, pp. 185-91.
Ukrainczyk N, Frankoviæ Mihelj N, Šipušić J, "Calcium Sulfoaluminate Eco-Cement
from Industrial Waste," Chemical and Biochemical Engineering Quarterly, V. 27, No. 1.
2013, pp. 83-93.

188
van Zijl GP, "Durability under mechanical load–micro-crack formation (ductility),"
Durability of Strain-Hardening Fibre-Reinforced Cement-Based Composites (SHCC),
Springer, 2011, pp. 9-39.
Vano M, Goracci C, Monticelli F, Tognini F, Gabriele M, Tay F, et al., "The adhesion
between fibre posts and composite resin cores: the evaluation of microtensile bond
strength following various surface chemical treatments to posts," International
Endodontic Journal, V. 39, No. 1. 2006, pp. 31-9.
Wang Y, Li VC, Backer S, "Modelling of fibre pull-out from a cement matrix,"
International Journal of Cement Composites and Lightweight Concrete, V. 10, No. 3.
1988, pp. 143-9.
Wille K, Naaman AE, "Pullout Behavior of High-Strength Steel Fibers Embedded in
Ultra-High-Performance Concrete," ACI Materials Journal, V. 109, No. 4, July 1. 2012,
pp. 479-88.
Winnefeld F, Lothenbach B, "Hydration of calcium sulfoaluminate cements --
Experimental findings and thermodynamic modelling," Cement and Concrete Research,
V. In Press, Corrected Proof. 2010.
Woodson RD, "Chapter 2 - Concrete Materials," Concrete Portable Handbook,
Butterworth-Heinemann, Boston, 2012, pp. 5-18.
Xu Q, Stark J, "Early hydration of ordinary Portland cement with an alkaline shotcrete
accelerator," Advances in cement research, V. 17, No. 1. 2005, pp. 1-8.
Xu S, Zhang X, "Determination of fracture parameters for crack propagation in concrete
using an energy approach," Engineering Fracture Mechanics, V. 75, No. 15. 2008, pp.
4292-308.
Yamazaki T, Schricker SR, Brantley WA, Culbertson BM, Johnston W, "Viscoelastic
behavior and fracture toughness of six glass-ionomer cements," The Journal of prosthetic
dentistry, V. 96, No. 4. 2006, pp. 266-72.
Yang E-H, Wang S, Yang Y, Li VC, "Fiber-bridging constitutive law of engineered
cementitious composites," Journal of advanced concrete technology, V. 6, No. 1. 2008,
pp. 181-93.
Zhang L, Glasser FP, "Modern Concrete Materials: Binders, Additions and Admixtures."
London: Thomas Telford Publishing; 1999.
Zhang L, Su M, Wang Y, "Development of the use of sulfo- and ferroaluminate cements
in China," Advances in Cement Research, V. 11, No. 1, January, 1. 1999, pp. 15-21.
Zhou L-M, Kim J-K, Mai Y-W, "Micromechanical characterisation of fibre/matrix
interfaces," Composites Science and Technology, V. 48, No. 1–4. 1993, pp. 227-36.
Zucchini A, Hui CY, "Detailed analysis of the fibre pull-out test," Journal of Materials
Science, V. 31, No. 21. 1996, pp. 5631-41.

190
VITA
Robert Benjamin Jewell (Bob)
RESEARCH INTERESTS
Research Interests include process development for ash beneficiation including ash
sampling techniques, the fabrication of new low energy, low CO2 emitting construction
materials including cements and concretes from coal by products. Additional interests
include the development of smart energy-harvesting cementitious materials for civil
engineering structures.
EDUCATION
Ph.D., Civil Engineering, 2015, University of Kentucky, Lexington, Kentucky.
M.S., Geology, 2004, University of Kentucky, Lexington, Kentucky.
B.S., Geology, 2002, University of Kentucky, Lexington, Kentucky.
GRADUATE ADVISOR
Prof. Kamyar Mahboub, PhD advisor, Civil Engineering, University of Kentucky.
EXPERIENCE
2002-2004 Research Assistant, Environmental and Coal Technologies Group, Center
for Applied Energy Research, University of Kentucky.
2004-2012 Scientist I – Research, Center for Applied Energy Research, University of
Kentucky.

191
2012-Present Associate Research Scientist, Center for Applied Energy Research,
University of Kentucky.
SYNERGISTIC ACTIVITIES
Delegate, Asian Coal Ash Association: Utilization of Dry Scrubber Materials in Portland
Cement Concrete, Coal Ash Asia Conference, Shuozhou, Shanxi Province, China,
September, 2014.
Lecturer, Coal Combustion Products Utilization and Management: A Practical
Workshop, April 2014, Lexington, KY.
Delegate, Asian Coal Ash Association: An Overview of Fluidized Bed Combustion Spent
Bed Material Utilization in the U.S., Coal Ash Asia Conference, Shuozhou, Shanxi
Province, China, September, 2013.
Lecturer, Coal Combustion Products Utilization and Management: A Practical
Workshop, October 2012, Lexington, KY.
Co-organizer and speaker for the World of Coal Ash Conference and Coal Ash Short
Course, 2007 – present.
Organizer for UK CAER Outreach Program to Elementary-age children, 2004 – present.
Development of Tekcrete Fast® and Teckcrete Fast M®. Working with a team that
included Peter Mills of Minova USA, developed and jointly patented an ultrafast strength
developing shotcrete for mining and civil engineering. This product is helping provide
added safety in mines with weak and unstable roof conditions.

192
GRANTS AND CONTRACTS
Active Grants
Jewell, R. (PI). “Ettringite, a Novel Piezoelectric Source Crystal for Energy Harvesting
Materials”, National Science Foundation, $309,737, 8/1/14-7/30/17.
Jewell, R. (PI). “Use of Spray Dryer Absorber Material as a Replacement for Portland
Cement in Concrete”, Electric Power Research Institute, $151,964, 5/1/13-10/30/14.
Jewell, R. (PI). “Evaluation of Dry Flue Gas Desulfurization Byproducts in Cement
Applications”, Lonjing Environment Technology Co., Ltd., $25,000, 1/3/14-7/30/14.
Jewell, R. (PI). “Evaluation of Pure Ettringite/MWCNT Array Layered Composite for
Piezoelectric Effect”, Seed Grant from the University of Kentucky Center for Applied
Energy Research, $34,976, 2/28/14-7/28/14.
Completed Grants
Robl, T. (PI), Rathbone, R. (Co-PI), Jewell, R. (Co-PI). “Center for Coal-Derived Low
Energy Materials for Sustainable Construction”, U.S. Department of Energy/NETL,
$913,985, Kentucky Energy and Environment Cabinet, $114,248, 2008.
Robl, T. (PI), Rathbone, R. (Co-PI), Jewell, R. (Co-PI). “Rapidly Deployable System for
the Structural Stabilization of Shock Damaged Structures”, Department of Homeland
Security/NIHS, $991,408.

193
PATENTS
Mills, P., Robl, T., Rathbone, R., Jewell, R., Cementitious Composites, U.S. Patent
Application Publication, US 2012/0145044 A1, July 14, 2012.
PUBLICATIONS
Jewell, R.B., Mahboub, K.C., Robl, T.L., Bathke, A.C., “Interfacial Bond between
Reinforcing Fibers and Calcium Sulfoaluminate Cements: Fiber Pullout Characteristics,”
ACI Materials Journal, 111(1-6), 2014.
Jewell, R. "Micromechanics and Complementary Energy of Fibers Embedded in a Low-
Energy CSA Cement Matrix," World of Coal Ash, Apr. 23-25, Lexington, KY, 2013.
Muh-Cheng, M.W, Jiang, Y., Su. Q., Robl, T., Jewell R., Butalia, T.S., Zhang, W.,
Wolfe, W., Dry FGD By-Product Characteristics and Utilization – International
Perspective, World of Coal Ash, Lexington, KY, 2013.
Robl, T., Jewell, R., Oberlink, A., Value Added and Advance Uses for Coal Combustion
Fly Ash, in Proceedings of the Asian Coal Ash Conference, held in Shuozhou City,
Shanxi Province, China, September, 2013.
Jewell, R., Oberlink, A., Robl, T., An Overview of Fluidized Bed Combustion Spent Bed
Material Utilization in the U.S., in Proceedings of the Asian Coal Ash Conference, held
in Shuozhou City, Shanxi Province, China, September, 2013.
Jewell, R.B., Mahboub, K.C., Robl, T.L., Interfacial Bond between Reinforcing Fibres
and CSA Cements: An Examination of its Influence on Fibre Pullout Characteristics, in

194
Proceedings of the Concrete in a Low Carbon Era Conference, held at the University of
Dundee, Scotland, UK, 2012.
Jewell, R.B., Oberlink, A., Robl, T., Rapidly Deployable System Including a CSA
Gunite Material for the Structural Stabilization of Shock Damaged Structures, in
Proceedings of the Concrete in a Low Carbon Era Conference, held at the University of
Dundee, Scotland, UK, 2012.
Silva, L.F.O.; Jasper, A.; Andrade, M.L.; Sampaio, C.H.; Dai, S.; Li., X.; Li, T.; Chen,
W.; Wang, X.; Liu, H.; Zhao, L.; Hopps, S.G.; Jewell, R.B.; Hower, J.C. "Applied
investigation on the interaction of hazardous elements binding on ultrafine and
nanoparticles in Chinese anthracite-derived fly ash," The Science of the Total
Environment, 419, 250-264, 2012.
Duvallet, T.; Rathbone, R. F.; Henke, K. R.; Jewell, R. B. "Low-Energy, Low CO2-
Emitting Cements Produced from Coal Combustion By-Products and Red Mud," World
of Coal Ash: Science Applications and Sustainability, May 4-7, Lexington, KY, WOCA
2009 Proceedings, CD, 2009.
Jewell, R.; Robl, T.; Rathbone, R.; Groppo, J.; Hower, J.C. "The sedimentation,
stratigraphy and petrography of a coal-ash pond in Carroll County, Kentucky," World of
Coal Ash: Science Applications and Sustainability, May 4-7, Lexington, KY, WOCA
2009 Proceedings, CD, 2009.
Jewell, R. B.; Rathbone, R. F.; Robl, T. L.; Henke, K. R. "Fabrication and Testing of
CSAB Cements in Mortar and Concrete that Utilize Circulating Fluidized Bed

195
Combustion Byproducts," World of Coal Ash: Science Applications and Sustainability,
May 4-7, Lexington, KY, WOCA 2009 Proceedings, CD, 2009.
Jewell, R.B.; Rathbone, R.F. "Optical Properties of Coal Combustion Byproducts for
Particle-Size Analysis by Laser Diffraction," Coal Combustion and Gasification Products
(CCGP) 1, http://www.coalcgp-journal.org/papers/2009/CCGP-D-09-00001-Jewell.pdf,
2009.
Jewell, R.; Rathbone, R.; Robl, T. "The Fabrication of Value Added Cement Products
from Circulating Fluidized Bed Combustion Ash," 2007 World of Coal Ash Conference
(WOCA) May 7-10, Covington, KY, Proceedings CD, Paper 90, 2007.
Jewell, R.B. "Digital Mapping of the Sedimentation and Stratigraphy of a Coal-ash Pond
Using Vibracore and Ground-penetrating Radar Analysis," Regional Geological Society
of America Meeting, Mar 24-27, Tyson's Corner, Virginia, Geological Society of
America Abstracts with Programs, 36(2) 136, 2004.
Jewell, R. B. Lexington, KY, The Sedimentation, Stratigraphy, and Petrography of a
Coal-Ash Pond in Carroll County, Kentucky, Masters Thesis, University of Kentucky,
156 leaves, 2004.
Jewell, R. "Vibracore Sampling in a Coal Ash Pond," 2003 International Ash Utilization
Symposium, Oct. 20-22, Lexington, KY, 2003.

196
PUBLICATIONS (IN PROGRESS OR SUBMITTED FOR PEER REVIEW)
Jewell, R.B.; Rathbone, R.; Robl, T.L.; Duvallet, T., Mahboub, K.C., “Fabrication and
Testing of Low-Energy CSAB Cements that Utilize Circulating Fluidized Bed
Combustions Byproducts,” Coal Combustion and Gasification Products (CCPG) Journal,
2015.
Jewell, R.B.; Mahboub, K.C.; Robl, T.L.; (et al.), “Influence of Cement on Multiple
Cracking Behavior in Fiber Composites,” American Society of Civil Engineers (ASCE),
Materials Journal, 2015.
Jewell, R.B.; Mahboub, K.C.; Robl, T.L.; (et al.), “Influence of Cement Type on Fiber-
Matrix Interface Bond Strengths,” American Society of Civil Engineers (ASCE),
Materials Journal, 2015.