influence of aggregate characteristics on concrete … · nist technical note 1963 influence of...
TRANSCRIPT

NIST Technical Note 1963
Influence of Aggregate Characteristics
on Concrete Performance
Dale P. Bentz
Joshua Arnold
Michael J. Boisclair
Scott Z. Jones
Paul Rothfeld
Paul E. Stutzman Jussara Tanesi
Mengesha Beyene
Haejin Kim
Jose Muñoz
Ahmad Ardani
This publication is available free of charge from:
https://doi.org/10.6028/NIST.TN.1963

NIST Technical Note 1963
Influence of Aggregate Characteristics
on Concrete Performance
Dale P. Bentz
Joshua Arnold
Michael J. Boisclair
Scott Z. Jones
Paul Rothfeld
Paul E. Stutzman
Materials and Structural Systems Division
Engineering Laboratory
Jussara Tanesi
Mengesha Beyene
Haejin Kim
Jose Muñoz
SES Group and Associates
Ahmad Ardani
Federal Highway Administration
This publication is available free of charge from:
https://doi.org/10.6028/NIST.TN.1963
May 2017
U.S. Department of Commerce
Wilbur L. Ross, Jr., Secretary
National Institute of Standards and Technology
Kent Rochford, Acting NIST Director and Under Secretary of Commerce for Standards and Technology
Certain commercial entities, equipment, or materials may be identified in this
document in order to describe an experimental procedure or concept adequately.
Such identification is not intended to imply recommendation or endorsement by the
National Institute of Standards and Technology, nor is it intended to imply that the
entities, materials, or equipment are necessarily the best available for the purpose.
National Institute of Standards and Technology Technical Note 1963
Natl. Inst. Stand. Technol. Tech. Note 1963, 109 pages (May 2017)
CODEN: NTNOEF
This publication is available free of charge from:
https://doi.org/10.6028/NIST.TN.1963
iii
This
pu
blic
atio
n is
availa
ble
free o
f charg
e fro
m: h
ttps://d
oi.o
rg/1
0.6
028
/NIS
T.T
N.1
963
ABSTRACT
While the influence of paste properties on concrete performance has been extensively studied and
in many cases reduced to quantitative relationships (e.g., Abram’s law), that between aggregate
characteristics and concrete performance has not been investigated in detail. Based on previous research
that demonstrated significant strength differences for two similar concrete mixtures, one prepared with
limestone aggregates and the other with siliceous gravel, a joint study between the National Institute of
Standards and Technology (NIST) and the Federal Highway Administration (FHWA) was initiated to
explore in detail the influence of aggregate source, mineralogy, and material properties on concrete
performance. Eleven aggregates of differing mineralogy were identified and obtained both for bulk
characterization and for incorporation into two concrete mixtures. The first concrete mixture was based on
a 100 % ordinary Type I/II portland cement (OPC), while the second consisted of a ternary 60:30:10
volumetric blend of this cement with 30 % of a Class C fly ash and 10 % of a fine limestone powder. This
latter sustainable mixture had exhibited exemplary performance in a previous study. Aggregates were
characterized with respect to mechanical and thermomechanical properties, geometrical characteristics, and
surface energies. For the prepared concretes, mechanical, thermomechanical, and electrical properties were
measured at different ages out to 91 d and microstructural examinations were conducted to examine the
interfaces between aggregates and cement paste. Concrete performance varied widely amongst the different
aggregates, with the (range/average) ratio for 28-d compressive strength being 0.32 for the OPC concretes
and 0.37 for those based on the ternary blend binder. With the exceptions of relating concrete modulus to
aggregate modulus and concrete coefficient of thermal expansion (CTE) to aggregate CTE, weak
correlations were generally obtained between a single aggregate characteristic and concrete performance
properties. Models to predict 28-d compressive strength based on the aggregates’ CTE (and aggregate
absorption in the case of the ternary blend mixtures) provided predictions with a relative standard error
(standard error/mean) of about 7 %. It is suggested that aggregate and binder characteristics control the
bond between aggregates and paste. Then, for most properties, concrete performance is primarily controlled
by the level of this bonding, a characteristic that was only assessed in an indirect manner in the present
study. Research using non-linear ultrasonic measurements to better assess this bonding in specimens
remaining from the present study is currently underway.
Keywords: Aggregate mineralogy; aggregate shape; aggregate texture; bond; coefficient of thermal
expansion (CTE); interfacial transition zone (ITZ); modulus; strength.

iv
This
pu
blic
atio
n is
availa
ble
free o
f charg
e fro
m: h
ttps://d
oi.o
rg/1
0.6
028
/NIS
T.T
N.1
963

v
This
pu
blic
atio
n is
availa
ble
free o
f charg
e fro
m: h
ttps://d
oi.o
rg/1
0.6
028
/NIS
T.T
N.1
963
TABLE OF CONTENTS Abstract ................................................................................................................................................. iii
Table of Contents ................................................................................................................................... v
List of Tables ........................................................................................................................................ vi
List of Figures ...................................................................................................................................... vii
Introduction ............................................................................................................................................ 1
Materials and Testing ............................................................................................................................. 3
Aggregate Sources ............................................................................................................................. 3
Testing performed at TFHRC ........................................................................................................ 4
Testing performed at NIST ............................................................................................................ 7
Mixture Proportions ........................................................................................................................... 9
Concrete and Paste Evaluation ......................................................................................................... 11
Testing Performed at TFHRC ...................................................................................................... 11
Testing performed at NIST (SEM Preparation and Analysis) ..................................................... 12
Results .................................................................................................................................................. 13
Aggregate Characteristics ................................................................................................................ 13
Petrographic Description of Rock Types ..................................................................................... 13
Aggregate Properties .................................................................................................................... 19
Rock (Core) Properties................................................................................................................. 24
Concrete Properties .......................................................................................................................... 27
Fresh Concrete Properties ............................................................................................................ 27
Concrete Mechanical Properties .................................................................................................. 30
Hardened Concrete Resistivity..................................................................................................... 36
Hardened Concrete Coefficient of Thermal Expansion ............................................................... 39
Concrete Mechanical Properties in Relation to Aggregate Characteristics ..................................... 42
Concrete Compressive Strength ................................................................................................... 45
Concrete Splitting Tensile Strength ............................................................................................. 61
Concrete Flexural Strength .......................................................................................................... 62
Summary and Prospectus ..................................................................................................................... 63
References ............................................................................................................................................ 65
Appendix A. Aggregate Reactivity as Assessed by Isothermal Calorimetry and ICP-AES Analysis . 70
Appendix B. Plots of 28-d Compressive Strength vs. Individual Aggregate Characteristics .............. 75
Appendix C. Representative SEM Images from Concrete Mixtures ................................................... 78
Appendix D. X-ray Diffraction Scans of Selected Aggregates ............................................................ 94
vi
This
pu
blic
atio
n is
availa
ble
free o
f charg
e fro
m: h
ttps://d
oi.o
rg/1
0.6
028
/NIS
T.T
N.1
963
LIST OF TABLES Table 1. List of aggregate quarry locations and rock types for the present study. ........................................ 3
Table 2 - Concrete Mixture Proportions ..................................................................................................... 10
Table 3. Summary of Aggregate Mineralogy ............................................................................................. 18
Table 4. Bulk properties of aggregates used in the present study.B ............................................................ 19
Table 5. AIMS characteristics of aggregates used in the present study (Coarse/Coarse + Fine).C,D .......... 20
Table 6. Surface energies, modulus, and CTE of aggregates used in the present study. ............................ 21
Table 7. Density, static modulus of elasticity, compressive and tensile strengths, and CTE of rock coresG
.................................................................................................................................................................... 24
Table 8. Dynamic transverse and longitudinal modulus of elasticity of rock coresH.................................. 24
Table 9. Mechanical Properties of OPC Concrete, Mortar, and Paste Mixtures ......................................... 31
Table 10. Mechanical Properties of Ternary Blend Concrete, Mortar, and Paste Mixtures ....................... 32
Table 11. 28-d and 91-d Electrical Resistivities of the Hardened Concretes .............................................. 36
Table 12. Measured CTE for the OPC and Ternary Blend Concretes, Mortars, and Pastes ....................... 39
Table 13. Fitting of OPC concrete mechanical properties to linear model based on aggregate CTE. ........ 59
vii
This
pu
blic
atio
n is
availa
ble
free o
f charg
e fro
m: h
ttps://d
oi.o
rg/1
0.6
028
/NIS
T.T
N.1
963
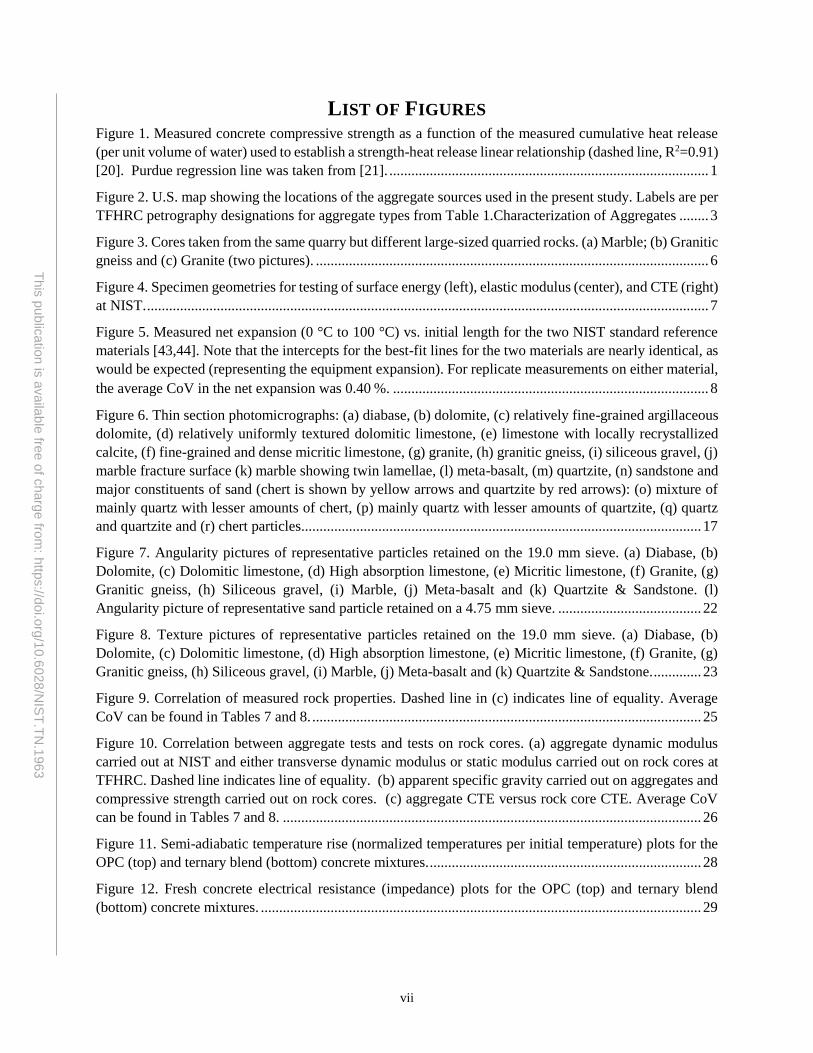
LIST OF FIGURES Figure 1. Measured concrete compressive strength as a function of the measured cumulative heat release
(per unit volume of water) used to establish a strength-heat release linear relationship (dashed line, R2=0.91)
[20]. Purdue regression line was taken from [21]. ....................................................................................... 1
Figure 2. U.S. map showing the locations of the aggregate sources used in the present study. Labels are per
TFHRC petrography designations for aggregate types from Table 1.Characterization of Aggregates ........ 3
Figure 3. Cores taken from the same quarry but different large-sized quarried rocks. (a) Marble; (b) Granitic
gneiss and (c) Granite (two pictures). ........................................................................................................... 6
Figure 4. Specimen geometries for testing of surface energy (left), elastic modulus (center), and CTE (right)
at NIST. ......................................................................................................................................................... 7
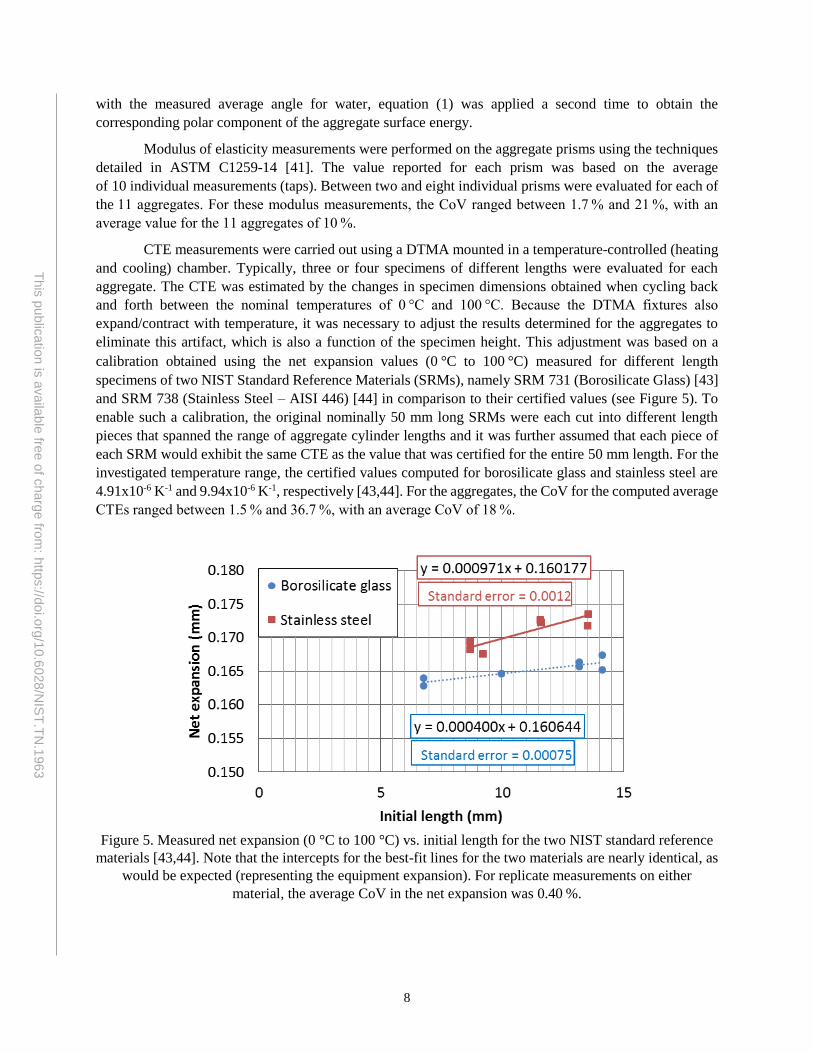
Figure 5. Measured net expansion (0 °C to 100 °C) vs. initial length for the two NIST standard reference
materials [43,44]. Note that the intercepts for the best-fit lines for the two materials are nearly identical, as
would be expected (representing the equipment expansion). For replicate measurements on either material,
the average CoV in the net expansion was 0.40 %. ...................................................................................... 8
Figure 6. Thin section photomicrographs: (a) diabase, (b) dolomite, (c) relatively fine-grained argillaceous
dolomite, (d) relatively uniformly textured dolomitic limestone, (e) limestone with locally recrystallized
calcite, (f) fine-grained and dense micritic limestone, (g) granite, (h) granitic gneiss, (i) siliceous gravel, (j)
marble fracture surface (k) marble showing twin lamellae, (l) meta-basalt, (m) quartzite, (n) sandstone and
major constituents of sand (chert is shown by yellow arrows and quartzite by red arrows): (o) mixture of
mainly quartz with lesser amounts of chert, (p) mainly quartz with lesser amounts of quartzite, (q) quartz
and quartzite and (r) chert particles............................................................................................................. 17
Figure 7. Angularity pictures of representative particles retained on the 19.0 mm sieve. (a) Diabase, (b)
Dolomite, (c) Dolomitic limestone, (d) High absorption limestone, (e) Micritic limestone, (f) Granite, (g)
Granitic gneiss, (h) Siliceous gravel, (i) Marble, (j) Meta-basalt and (k) Quartzite & Sandstone. (l)
Angularity picture of representative sand particle retained on a 4.75 mm sieve. ....................................... 22
Figure 8. Texture pictures of representative particles retained on the 19.0 mm sieve. (a) Diabase, (b)
Dolomite, (c) Dolomitic limestone, (d) High absorption limestone, (e) Micritic limestone, (f) Granite, (g)
Granitic gneiss, (h) Siliceous gravel, (i) Marble, (j) Meta-basalt and (k) Quartzite & Sandstone. ............. 23
Figure 9. Correlation of measured rock properties. Dashed line in (c) indicates line of equality. Average
CoV can be found in Tables 7 and 8. .......................................................................................................... 25
Figure 10. Correlation between aggregate tests and tests on rock cores. (a) aggregate dynamic modulus
carried out at NIST and either transverse dynamic modulus or static modulus carried out on rock cores at
TFHRC. Dashed line indicates line of equality. (b) apparent specific gravity carried out on aggregates and
compressive strength carried out on rock cores. (c) aggregate CTE versus rock core CTE. Average CoV
can be found in Tables 7 and 8. .................................................................................................................. 26
Figure 11. Semi-adiabatic temperature rise (normalized temperatures per initial temperature) plots for the
OPC (top) and ternary blend (bottom) concrete mixtures. .......................................................................... 28
Figure 12. Fresh concrete electrical resistance (impedance) plots for the OPC (top) and ternary blend
(bottom) concrete mixtures. ........................................................................................................................ 29

viii
This
pu
blic
atio
n is
availa
ble
free o
f charg
e fro
m: h
ttps://d
oi.o
rg/1
0.6
028
/NIS
T.T
N.1
963
Figure 13. Later age compressive strength vs. 1-d compressive strength for the OPC and ternary blend
concretes. Average CoV can be found in Tables 9 and 10. ........................................................................ 33
Figure 14. 28-d compressive strength of ternary blend concretes vs. corresponding OPC concrete. Average
CoV can be found in Tables 9 and 10. Blue line is fit to all the data, while red line is fit to the seven indicated
aggregates, omitting high absorption limestone and three limestones (including marble). Black dashed line
indicates a one-to-one correspondence. ...................................................................................................... 33
Figure 15. Isothermal calorimetry of aggregates in OPC or ternary pore solution. Cumulative heat over time
of (a) marble; (b) micritic limestone and (c) high absorption limestone. ................................................... 34
Figure 16. 28-d and 91-d splitting tensile strength vs. compressive strength. Recommended ACI coefficient
is 0.56 (instead of 0.62) [65]. Linear relation shown in box is for 28-d data for both ternary and OPC
mixtures. Average CoV can be found in Tables 9 and 10. ......................................................................... 34
Figure 17. Modulus of rupture vs. compressive strength at 28 d and 91 d for the 22 concrete mixtures.
Average CoV can be found in Tables 9 and 10. ......................................................................................... 35
Figure 18. Electrical resistivity and qualitative chloride penetrability classification as per
AASHTO T358 [59]. Average CoV can be found in Table 11. ................................................................. 37
Figure 19. Measured electrical resistivity vs. compressive strength for the OPC and ternary blend concretes
at ages of 28 d and 91 d. Average CoV can be found in Tables 9, 10, and 11. .......................................... 38
Figure 20. Concrete CTE vs. aggregate CTE for the OPC and ternary blend concrete mixtures. Average
CoV can be found in Tables 6 and 12. Model lines correspond to a simple additive model, assuming
aggregate and mortar volume fractions of 0.39 and 0.58. Dashed lines indicate best linear fits. ............... 40
Figure 21. Concrete CTE vs. rock core CTE for the OPC and ternary blend concrete mixtures. Average
CoV can be found in Tables 7 and 12. ........................................................................................................ 41
Figure 22. Concrete 28-d and 91-d elastic modulus vs. aggregate elastic modulus for all the aggregates.
Fitted lines include all the data at a given age, except for the siliceous gravel and meta-basalt. Average CoV
can be found Tables 6, 9, and 10................................................................................................................. 44
Figure 23. (a) Ratio of aggregate and paste moduli of elasticity at 28 d and 91 d, (b) effect of Eagg/Epaste on
compressive strength of OPC mixtures at 7 d, 28 d, and 91 d and (c) effect of Eagg/Epaste on compressive
strength of ternary blend mixtures at 7 d, 28 d, and 91 d. Average CoV can be found in Tables 9 and 10.47
Figure 24. Cumulative heat over time of diabase and quartzite & sandstone aggregates in OPC pore solution.
Information on uncertainty is provided at the bottom of page 4. ................................................................ 47
Figure 25. (a) Transmitted light thin section photomicrographs of weakly metamorphosed sandstone. The
darker laminations appear developed parallel to the bedding plane (shown by dashed lines). Length of field
of view is 1 mm. (b) Stereo-photomicrographs showing example of dominant fracture patterns (both
through and around coarse aggregates) in the 28-d cylinders. Length of field of view is 61 mm. ............ 48
Figure 26. Cumulative heat over time of carbonate aggregates in (a) OPC pore solution and (b) ternary pore
solution. ....................................................................................................................................................... 48
Figure 27. Stereo-photomicrographs showing examples of dominant fracture patterns, after compressive
strength testing. Yellow arrows indicate fracture around aggregate, green indicate socket of aggregate
(aggregate was completely detached from paste) and red indicate fracture through the aggregate. Scale
shown at the corner is in 0.25 mm increments. Underscore values indicate testing ages of 1 d, 7 d, 28 d, or

ix
This
pu
blic
atio
n is
availa
ble
free o
f charg
e fro
m: h
ttps://d
oi.o
rg/1
0.6
028
/NIS
T.T
N.1
963
91 d of mixtures containing: (a) micritic limestone, (b) high absorption limestone, (c) granite and (d)
siliceous gravel............................................................................................................................................ 51
Figure 28. Thin section photomicrographs showing of high absorption limestone concrete samples tested at
different ages (a) OPC mixture tested at 1 d. Locally discontinuous cracks/gaps at the ITZ (b) ternary
mixture tested at 1 d. Extensive areas with gaps between aggregate and paste, (c) OPC mixture tested at 28
d. Locally discontinuous cracks/gaps at the ITZ (d) ternary mixture tested at 28 d. Gaps/cracks at the ITZ,
(e) OPC mixture tested at 91 d. Good bond between aggregate and paste, (f) ternary mixture tested at 91 d.
Gaps/cracks still present at ITZ. Gaps/Cracks at ITZ are circled in yellow or indicated by arrows. .......... 52
Figure 29. Stereo-photomicrographs of samples, showing fractures surfaces through the aggregate. Scale
shown at the corner is in 0.25 mm increments: (a) dolomitic limestone ternary mixture tested at 91 d and
(b) and (c) micritic limestone OPC mixture and ternary mixtures, respectively, tested at 28 d. (d)
Transmitted light thin section photomicrographs of argillaceous dolomitic limestone containing thin darker
lamination. Length of field of view in image (d) is 1 mm. ......................................................................... 53
Figure 30. Stereo-photomicrographs showing fracture surfaces of granite mixtures tested at 91 d (a) OPC
mixture (failure through the aggregate), (b) ternary mixture (failure around the aggregate), (c) ternary
mixture (failure around and through the aggregate) and (d) zoom in of image in (c). Scale shown at the
corners in images (a), (b), and (c) is in 0.25 mm increments. ..................................................................... 54
Figure 31. Relation between rock compressive strength and concrete compressive strength. ................... 54
Figure 32. Stereo-photomicrographs of samples tested at 91 d: (a) meta-basalt OPC mixture with failure
through the aggregate, (b) meta-basalt OPC mixture with failure around the aggregate and lack of bond and
(c) meta-basalt ternary mixture with failure around the aggregate and lack of bond. Scale shown at the
corner is in 0.25 mm increments. ................................................................................................................ 55
Figure 33. Cumulative heat over time of siliceous gravel in OPC pore solution or ternary pore solution. 55
Figure 34. Stereo-photomicrographs of granitic gneiss samples tested at 91 d (a) OPC mixture and (b)
ternary mixture. Scale shown at the corner is in 0.25 mm increments. ...................................................... 56
Figure 35. 28-d compressive strength vs. CTE for the OPC concrete mixtures. Dotted blue line indicates
best linear fit for all the data. Dashed grey line indicates best linear fit when siliceous gravel data (lower
right point) is excluded from the analysis. Error bars indicate one standard deviation for two cylinders
broken from each mixture. CoV for CTE can be found in Testing section on page 8. ............................... 58
Figure 36. Predicted 28-d compressive strength vs. measured values for the ternary blend concrete mixtures.
The dashed line indicates what would be a one-to-one relationship between measured and predicted values.
.................................................................................................................................................................... 59
Figure 37. Photographs of OPC beam specimens tested for flexural strength at 28 d (left) and 91 d (right),
respectively. (a) and (b) with marble aggregate, (c) and (d) with dolomitic limestone aggregate. ............. 62
Figure 38. Ion concentrations in solutions exposed to aggregates over time. Charts on the left show all the
OPC mixtures tested, while charts on the right show only the carbonate aggregates exposed to OPC
solutions. Error bars indicate one standard deviation for three replicate specimens. ................................. 71
Figure 39. Ion concentrations in OPC and ternary solutions that have been exposed to aggregates over time.
Error bars indicate one standard deviation for three replicate specimens. .................................................. 72
x
This
pu
blic
atio
n is
availa
ble
free o
f charg
e fro
m: h
ttps://d
oi.o
rg/1
0.6
028
/NIS
T.T
N.1
963
Figure 40. Cumulative heat over time of aggregates in OPC pore solution (a) carbonate aggregates and (b)
non-carbonate aggregates. ........................................................................................................................... 73
Figure 41. Cumulative heat over time of aggregates in ternary pore solution (a) carbonate aggregates and
(b) non-carbonate aggregates. ..................................................................................................................... 74
Figure 42. 28-d compressive strength vs. aggregate coefficient of thermal expansion (CTE) of the 11
aggregates for the OPC and ternary blend concretes. ................................................................................. 75
Figure 43. 28-d compressive strength vs. absorption of the 11 aggregates for the OPC and ternary blend
concretes. .................................................................................................................................................... 75
Figure 44. 28-d compressive strength vs. aggregate elastic modulus of the 11 aggregates for the OPC and
ternary blend concretes. .............................................................................................................................. 76
Figure 45. 28-d compressive strength vs. specific gravity of the 11 aggregates for the OPC and ternary
blend concretes. Standard errors are 4.06 MPa and 3.81 MPa for OPC and ternary blends, respectively. 76
Figure 46. 28-d compressive strength vs. aggregate surface energy, dispersive (left) and polar (right)
components, for the OPC and ternary blend concretes. Standard errors for linear fits in the case of dispersive
surface energy are 3.73 MPa and 4.1 MPa for the OPC and ternary blends, respectively.......................... 77
Figure 47. 28-d compressive strength vs. CAAT (left) and Texture (right) parameters from the AIMS
analysis of each of the 11 aggregates for the OPC and ternary blend concretes. ........................................ 77
Figure 48. BE image for siliceous gravel concrete prepared with OPC. .................................................... 78
Figure 49. Ca-Si-Al RGB pseudo-color image for OPC siliceous gravel concrete. ................................... 79
Figure 50. BE image for siliceous gravel concrete prepared with the ternary blend. ................................. 80
Figure 51. Ca-Si-Al RGB pseudo-color image for ternary blend siliceous gravel concrete. ...................... 81
Figure 52. BE image for dolomitic limestone concrete prepared with OPC. .............................................. 82
Figure 53. Ca-Si-Al RGB pseudo-color image for OPC dolomitic limestone concrete. ............................ 83
Figure 54. BE image for dolomitic limestone concrete prepared with the ternary blend. .......................... 84
Figure 55. Ca-Si-Al RGB pseudo-color image for ternary blend dolomitic limestone concrete. ............... 85
Figure 56. BE image for meta-basalt concrete prepared with OPC. ........................................................... 86
Figure 57. Ca-Si-Al RGB pseudo-color image for OPC meta-basalt concrete. .......................................... 87
Figure 58. BE image for meta-basalt concrete prepared with the ternary blend. ........................................ 88
Figure 59. Ca-Si-Al RGB pseudo-color image for ternary blend meta-basalt concrete. ............................ 89
Figure 60. BE image for high absorption limestone concrete prepared with OPC. .................................... 90
Figure 61. Ca-Si-Al RGB pseudo-color image for OPC high absorption limestone concrete. ................... 91
Figure 62. BE image for high absorption limestone concrete prepared with the ternary blend. ................. 92
Figure 63. Ca-Si-Al RGB pseudo-color image for ternary blend high absorption limestone concrete. ..... 93
1
This
pu
blic
atio
n is
availa
ble
free o
f charg
e fro
m: h
ttps://d
oi.o
rg/1
0.6
028
/NIS
T.T
N.1
963
INTRODUCTION Control and enhancement of the properties of concrete have been two longstanding concerns of the
construction community. Performance of concrete mixtures is often specified/guaranteed in a prescriptive
fashion by selecting specific combinations of cement (type), supplementary cementitious materials (SCMs
such as fly ash and blast furnace slag), and chemical admixtures (high range water reducing agents, air
entrainers, etc.). While some attention is paid to aggregate gradation to assure proper flow and avoid
segregation issues, generally less consideration is given to the mineralogy of the (coarse) aggregates, as
designers are often limited to what is available locally. Still, it is well known from previous studies [1-12]
that coarse aggregate type can have a significant impact on properties and performance of concrete. This
impact depends on the microstructure of the interfacial transition zone that is formed between coarse
aggregates and the surrounding mortar [10, 13-16], and particularly on the level of bond established
between these two. This bond can be influenced by both physical (roughness, shape, angularity) and
chemical (reactivity) attributes of the aggregates [4,5,17,18].
The impetus for the present study was a previous comparison of compressive strengths obtained
for similar concretes prepared with either a siliceous-based gravel or a limestone coarse aggregate [19].
When strength was plotted against cumulative heat release (as measured via isothermal calorimetry) as
shown in Figure 1, straight line relationships were obtained for both concretes, but at a similar heat release
(degree of hydration), the strengths of the mixtures prepared with limestone were consistently and
significantly higher than those of the concretes prepared with the siliceous aggregates (gravel). The current
study extends this comparison to encompass aggregates obtained from 11 different quarries located
throughout the U.S. and used to prepare concretes based on two binders: one is a 100 % ordinary portland
cement (OPC) concrete and the other is a ternary blend of 60 % cement, 30 % Class C fly ash, and 10 %
fine limestone powder on a volume basis.
Figure 1. Measured concrete compressive strength as a function of the measured cumulative heat release
(per unit volume of water) used to establish a strength-heat release linear relationship (dashed line,
R2=0.91) [20]. Purdue regression line was taken from [21].
2
This
pu
blic
atio
n is
availa
ble
free o
f charg
e fro
m: h
ttps://d
oi.o
rg/1
0.6
028
/NIS
T.T
N.1
963
Previous evaluation of the influence of aggregates on concrete properties has been limited to only
a few aggregate properties and has never included so many different aggregate
mineralogies [2,5,10,12,22-27], as in the current study. This study is a collaboration between the National
Institute of Standards and Technology (NIST) and the Turner Fairbank Highway Research Center (TFHRC)
and presents an extensive characterization of these 11 sources of aggregates (ten crushed stones and one
gravel) aimed to provide the basis for a better understanding of which aggregate properties play a role in
the concrete’s mechanical performance.

3
This
pu
blic
atio
n is
availa
ble
free o
f charg
e fro
m: h
ttps://d
oi.o
rg/1
0.6
028
/NIS
T.T
N.1
963
MATERIALS AND TESTING
AGGREGATE SOURCES
Eleven different aggregates were obtained from quarries located throughout the U.S., with the
major concentration being on the east coast, and particularly in the MD-VA corridor. Table 1 summarizes
the aggregate types per the petrographic analysis performed at TFHRC, while a map showing the quarry
locations is provided in Figure 2.
Table 1. List of aggregate quarry locations and rock types for the present study.
Quarry Location Aggregate Type (TFHRC petrography)
Leesburg, VA Diabase
Wappinger Falls, NY Dolomite
West Lafayette, IN Dolomitic limestone
Ottawa, KS High absorption limestone
Harrisonburg, VA Micritic limestone
Morrison, CO Granite
North Garden, VA Granitic gneiss
Waldorf, MD Siliceous gravel
Harpers Ferry, WV Marble*
Charlottesville, VA Metabasalt**
Hillsville, VA Quartzite & Sandstone * Sometimes called Blue Stone or Limestone. Thin sections show it is a dolomitic marble. ** Sometimes called Green Stone or Basalt. Thin sections show it is a meta-basalt.
Figure 2. U.S. map showing the locations of the aggregate sources used in the present study. Labels are
per TFHRC petrography designations for aggregate types from Table 1.

4
This
pu
blic
atio
n is
availa
ble
free o
f charg
e fro
m: h
ttps://d
oi.o
rg/1
0.6
028
/NIS
T.T
N.1
963
CHARACTERIZATION OF AGGREGATES
TESTING PERFORMED AT TFHRC
Aggregates were characterized with respect to unit weight (ASTM C29-09), specific gravity, and
absorption (ASTM C127-12) characteristics following the standard ASTM procedures [28,29]. They were
further characterized with respect to their shape and texture using the aggregate imaging analysis system
(AIMS2, a second generation of AIMS) originally developed by Masad [30,31] and in accordance with
AASHTO TP81-12 [32]. Per the definitions provided in AASHTO TP81-12 [32], angularity relates to the
variations at the particle boundary that influence the overall shape, while sphericity refers to the overall
three-dimensional shape. In addition, texture is described as the relative smoothness/roughness of the
surface features and the CAAT is a combined angularity and texture value that is computed as 10 times the
texture + one half of the angularity [30].
The AIMS2 system uses a digital camera mounted to a variable magnification microscope,
providing a maximum field of view of 53.7 mm x 71.6 mm (0.044 mm per pixel) down to a field of view
of 4 mm x 5.4 mm (0.0033 mm per pixel). Backlighting is used to capture particle silhouettes for angularity
analysis, while oblique top lighting is used to capture surface features in black and white images for texture
analysis. The two-dimensional angularity images are also used to capture the overall particle dimensions
along the major (longest) and minor (shortest) axes. The third particle dimension is established by the
position of the focal plane determined while capturing the texture image at the surface of the particle. The
gradient vector and wavelet analysis methods are used to quantify angularity and surface texture,
respectively [30,31].
Petrographic examination of the coarse aggregates was performed in accordance with a modified
form of ASTM C295 [33]. Representative coarse aggregate particles were selected from each coarse
aggregate supply. The samples were then placed into separate rubber molds and embedded in epoxy resin.
After hardening of the epoxy, each embedded sample was cut with a low-speed, diamond-rimmed saw,
finely ground, and placed on a glass microscope slide using epoxy. The thickness of the mounted samples
was reduced to approximately 20 µm to 30 m. The resulting thin sections were studied using a polarized-
light (petrographic) microscope at magnifications up to 400X to identify each aggregate type and their
mineralogical composition.
In addition, the chemical interaction between selected coarse aggregates and the two cementitious
binders was inferred by isothermal calorimetry (ASTM C1679 [34]) and inductively coupled plasma atomic
emission spectroscopy (ICP-AES). Synthetic pore solution was created using a procedure adapted from
Tasong et al. [3] and Lawrence [35]. First, 75 g of cementitious materials (OPC or ternary blend) were
gradually added to 300 mL of deionized water and stirred in a sealed container for about 2 h. Then, the
resultant solution was filtered through a 10 µm filter.
Each aggregate to be evaluated was crushed to pass through a sieve with 200 µm openings. A 10-g
sample of the aggregate was thoroughly mixed with 40 mL of solution and brought to 25 °C ± 2 °C before
isothermal calorimetry testing. Two samples per mixture were tested, with masses of 7.0 g ± 0.5 g.
Isothermal calorimetry was carried out at 25 °C for 7 d and measured heat flows and cumulative heat release
were normalized by the mass of the solution. Previously, the average absolute difference between replicate
specimens of hydrating cement paste has been reported as 2.5 x 10⁻⁵ W/g (cement) for measurements
conducted between 1 h and 7 d after mixing [19].
The same sample preparation described above (synthetic pore solution with aggregates) was also
used for ICP-AES testing. Samples were kept at laboratory conditions and daily manually agitated until the

5
This
pu
blic
atio
n is
availa
ble
free o
f charg
e fro
m: h
ttps://d
oi.o
rg/1
0.6
028
/NIS
T.T
N.1
963
ages of testing of 7 d and 28 d, and then filtered through a 1 µm filter. The liquid fraction was vacuum
filtered and diluted by a known volume and then the elemental (ion) concentration was determined by
ICP-AES. The accuracy of each set of measurements was controlled by calibrating the ICP-AES and
running a check standard at the beginning and the end of each batch of analyses. Three replicates were
tested at each age for selected mixtures: OPC mixtures with dolomitic limestone, micritic limestone,
quartzite & sandstone, marble, meta-basalt or siliceous gravel and ternary blends with dolomitic limestone
or quartzite & sandstone. Samples containing only OPC solution and ternary blend solution were tested as
soon as they were prepared to obtain their respective baselines.
For selected sources (granitic gneiss, diabase, dolomitic limestone, micritic limestone, marble,
meta-basalt, and granite), cores were obtained from large-sized quarried rocks (boulder size) to directly
assess the rocks’ mechanical properties, as well as their coefficient of thermal expansion (CTE). In some
cases, although the large-sized quarried rocks were obtained from the same source, they were visually
different (Figure 3), implying that the crushed aggregates were often a mixture of different rocks.
The large-sized quarried rocks had an average height between 200 mm and 300 mm, with masses
that varied from about 35 kg to 70 kg. Coring took place using a water-cooled diamond coring drill at speeds
that varied from 47 rad/s to 94 rad/s. The core diameter was about 70 mm (nominal core drill bit was 3 in.,
yielding a 2.75 in. core). Each core was then cut to a 177.8 mm ± 2.5 mm section with a slab saw cooled
with food grade mineral oil. The position of these cross cuts was chosen to minimize the number of visible
cracks on the final sample. Cores used for testing complied with AASHTO T22 [36] for perpendicularity
and parallelism of ends. Cores were then washed with warm soapy water to remove the mineral oil and
dried in an oven at 50 °C for 16 h to 20 h. Cores were subsequently saturated in tap water until they achieved
the saturation criterion specified in AASHTO T336 [37].
Cores were tested for compressive strength, static elastic modulus and Poisson’s ratio at room
temperature in accordance with ASTM D7012 [38], for splitting tensile strength per ASTM D3967 [39]
and for dynamic modulus of elasticity and dynamic modulus of rigidity per ASTM C215 [40]. Density was
obtained for a dry condition by measuring the dimensions and masses of the specimens. The CTE of the
cores was obtained following AASHTO T336 [37]. Two cores were tested for compressive strength, static
elastic modulus and Poisson’s ratio and CTE, while 3 cores were tested for splitting tensile strength. When
a clear difference in large-sized quarried rocks from the same source was observed (granite and marble for
example), the number of replicates was doubled, but due to a lack of cores, the splitting tensile strength was
not determined. Six replicates were tested for the dynamic modulus of elasticity, with exception of the
granite and marble, which had 10 and 8 replicates tested, respectively. The dynamic modulus of elasticity
was determined both after the drying process and after the saturation process, described earlier.

6
This
pu
blic
atio
n is
availa
ble
free o
f charg
e fro
m: h
ttps://d
oi.o
rg/1
0.6
028
/NIS
T.T
N.1
963
Figure 3. Cores taken from the same quarry but different large-sized quarried rocks. (a) Marble; (b)
Granitic gneiss and (c) Granite (two pictures).
(a)
(b)
(c) (c)

7
This
pu
blic
atio
n is
availa
ble
free o
f charg
e fro
m: h
ttps://d
oi.o
rg/1
0.6
028
/NIS
T.T
N.1
963
TESTING PERFORMED AT NIST
For each of the aggregates, a set of samples retained on the 25-mm sieve was obtained. Specimens
were handpicked from this selection for further preparation prior to measurements of contact angle/surface
energy, dynamic elastic modulus, and CTE. A subset of the specimens was first cut using a diamond-blade
laboratory saw with water as the lubricant to obtain flat and smooth surfaces for the contact angle
measurements. For these specimens, the cut surface was polished with 120-grit silicon carbide paper. Some
of the single-cut specimens were further cut and polished to produce prismatic specimens (typically a few
mm thick with a length of 20 mm to 40 mm and a width of 3 mm to 12 mm) for the measurement of elastic
modulus using sonic (frequency) techniques (ASTM C1259-14 [41]). For CTE measurements, other
aggregates were cored (by wet drilling with tap water) to obtain small cylinders typically 8 mm to 15 mm
in length, with a diameter of about 7.2 mm. These cylindrical cores were subsequently polished as needed
to obtain two flat and parallel faces for mounting in the differential thermo-mechanical analyzer (DTMA)
that was used to obtain CTE values. Example specimen geometries for the various tests conducted at NIST
are provided in Figure 4.
Figure 4. Specimen geometries for testing of surface energy (left), elastic modulus (center), and CTE
(right) at NIST.
Contact angles were assessed using either water (polar) or diiodomethane (nonpolar) and an
automated contact angle analyzer. Drop sizes of 5 µL and 3 µL were used for the water and diiodomethane,
respectively. Aggregates were mounted to a positioning table using modeling clay, with their flat, smooth
surface facing upwards. Typically, four different rock surfaces were evaluated for each aggregate, with four
drops of each liquid applied per surface. Prior to the first measurement and when switching liquids, the rock
surface was cleaned using ethanol and dried. Using the automated angle measurements provided by the
equipment, angles were recorded immediately after contact and after 1 min and 2 min. For the analysis to
follow, surface energies were calculated based on the immediate readings. Angle measurements for each
liquid were subsequently averaged, after discarding obvious outliers. Typical coefficients of variation
(CoV) for these measurements were on the order of 12 % for both the water and the diiodomethane. To
convert the average angle measurements for the two liquids to estimated polar and dispersive surface energy
components, the Young-Owens-Wendt equation was employed [42]:
𝛾𝐿×(1+cos 𝜃)
2×√𝛾𝐿𝐷
= √ 𝛾𝐿
𝑃
𝛾𝐿𝐷 ×√𝛾𝑆
𝑃 + √𝛾𝑆𝐷 (1)
where θ is the measured contact angle (average), γD and γP refer to the dispersive and polar components of
the surface energy γ, respectively and the subscripts L and S refer to liquid and solid (aggregate). The
surface energy values utilized for water (polar – 51 mJ/m2, dispersive – 21.8 mJ/m2) and diiodomethane
(polar – 0 mJ/m2, dispersive – 50.8 mJ/m2) were taken from Boulange and Sterczynskia [42].
Computationally, equation (1) was first applied to the data obtained using diiodomethane to obtain the
dispersive component of the aggregate surface energy. Using this computed dispersive component along
8
This
pu
blic
atio
n is
availa
ble
free o
f charg
e fro
m: h
ttps://d
oi.o
rg/1
0.6
028
/NIS
T.T
N.1
963
with the measured average angle for water, equation (1) was applied a second time to obtain the
corresponding polar component of the aggregate surface energy.
Modulus of elasticity measurements were performed on the aggregate prisms using the techniques
detailed in ASTM C1259-14 [41]. The value reported for each prism was based on the average
of 10 individual measurements (taps). Between two and eight individual prisms were evaluated for each of
the 11 aggregates. For these modulus measurements, the CoV ranged between 1.7 % and 21 %, with an
average value for the 11 aggregates of 10 %.
CTE measurements were carried out using a DTMA mounted in a temperature-controlled (heating
and cooling) chamber. Typically, three or four specimens of different lengths were evaluated for each
aggregate. The CTE was estimated by the changes in specimen dimensions obtained when cycling back
and forth between the nominal temperatures of 0 °C and 100 °C. Because the DTMA fixtures also
expand/contract with temperature, it was necessary to adjust the results determined for the aggregates to
eliminate this artifact, which is also a function of the specimen height. This adjustment was based on a
calibration obtained using the net expansion values (0 °C to 100 °C) measured for different length
specimens of two NIST Standard Reference Materials (SRMs), namely SRM 731 (Borosilicate Glass) [43]
and SRM 738 (Stainless Steel – AISI 446) [44] in comparison to their certified values (see Figure 5). To
enable such a calibration, the original nominally 50 mm long SRMs were each cut into different length
pieces that spanned the range of aggregate cylinder lengths and it was further assumed that each piece of
each SRM would exhibit the same CTE as the value that was certified for the entire 50 mm length. For the
investigated temperature range, the certified values computed for borosilicate glass and stainless steel are
4.91x10⁻⁶ K-1 and 9.94x10⁻⁶ K-1, respectively [43,44]. For the aggregates, the CoV for the computed average
CTEs ranged between 1.5 % and 36.7 %, with an average CoV of 18 %.
Figure 5. Measured net expansion (0 °C to 100 °C) vs. initial length for the two NIST standard reference
materials [43,44]. Note that the intercepts for the best-fit lines for the two materials are nearly identical, as
would be expected (representing the equipment expansion). For replicate measurements on either
material, the average CoV in the net expansion was 0.40 %.

9
This
pu
blic
atio
n is
availa
ble
free o
f charg
e fro
m: h
ttps://d
oi.o
rg/1
0.6
028
/NIS
T.T
N.1
963
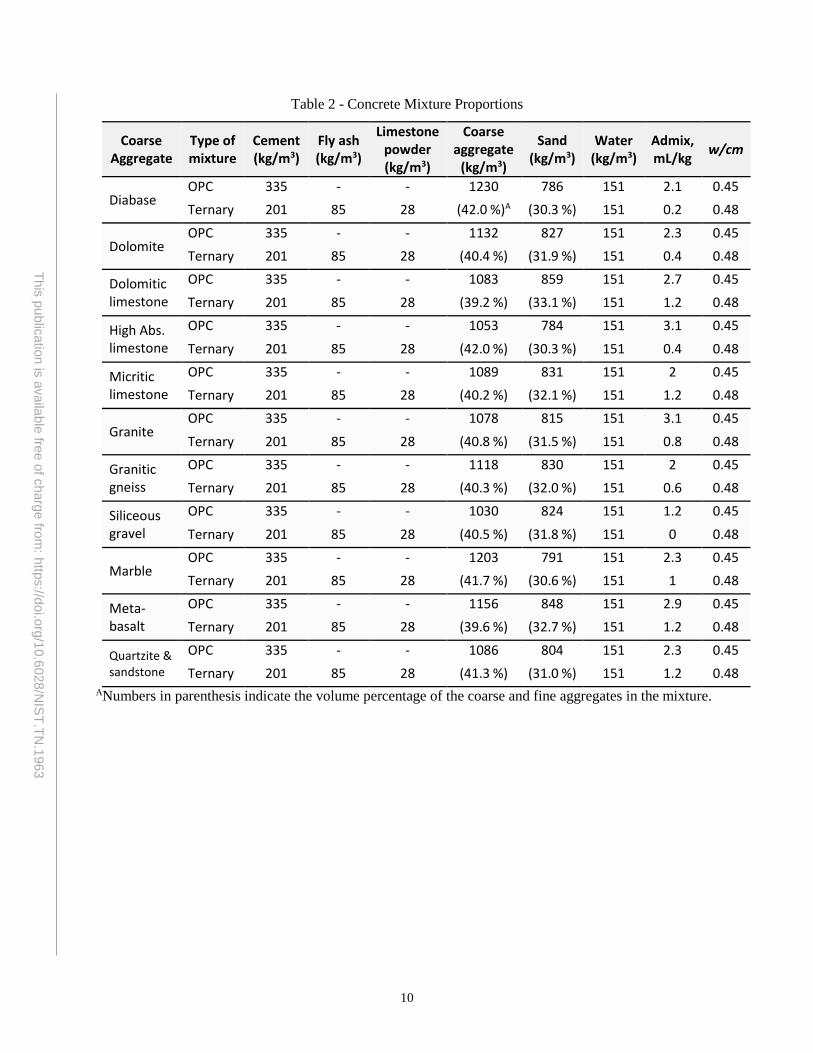
MIXTURE PROPORTIONS
A total of 22 concrete mixtures were prepared, two each for the 11 different coarse aggregates. For
each aggregate, one mixture contained a binder that was 100 % ordinary portland cement (OPC) (ASTM
C150 type I/II [45]), while the other was a 60:30:10 volumetric ternary blend of the same ordinary portland
cement as used in the 100 % OPC mixtures, an ASTM C618 Class C fly ash [46], and a limestone
powder [20]. The OPC had a reported Blaine fineness of 377 m2/kg, 0.5 % equivalent alkalis and a
calculated Bogue phase composition of 54.3 % C3S, 14.6 % C2S, 7.3 % C3A, and 9.6 % C4AF, with a
reported limestone content of 3.6 %, all of which are mass percentages [20]. The Class C fly ash had a
density of 2630 kg/m3, a median particle size of 10.3 µm, and a total CaO content of 24.6 % by mass, and
is hydraulic [20]. A fine limestone powder with a median particle diameter of 0.7 µm, 90 % finer than 2 µm,
and 65 % finer than 1 µm was also used in the ternary blends. It had a reported density of 2710 kg/m3 and
reported CaCO3 and MgCO3 contents of 98 % and 1 % by mass, respectively [20].
All coarse aggregates were sieved and recombined to keep the same gradation for all the mixtures.
For the gradation chosen, the percentages successively retained on sieves of size 19 mm, 12.5 mm, 9.5 mm,
4.75 mm, and 2.36 mm were 10.8 %, 45.1 %, 24.5 %, 19.0 %, and 0.6 %, respectively. Then before use, the
coarse aggregates were washed to eliminate any other particles that could interfere in the results. For all
concretes, the fine aggregate was a natural silica sand having a density of 2610 kg/m3, water absorption
of 1.1 %, and a fineness modulus of 2.82. The sand was used above saturated-surface-dry (SSD) conditions,
while the coarse aggregates were used below SSD, except for the high absorption limestone that was soaked
in water for a minimum of 48 h and then drained prior to mixing. The moisture content of the aggregates
was determined and considered for the required amount of mixing water.
The OPC mixtures were designed based on a non-air entrained mixture with a cement content
of 335 kg/m3 and a w/c=0.45 (water content of 151 kg/m3). A Type A-F water-reducing admixture was used
and its dosage was adjusted to produce mixtures with a 25-mm slump (representative of a typical paving
concrete mixture). The coarse and fine aggregate contents were calculated per ACI 211-91 [47], except for
the mixture containing siliceous gravel, as ACI 211-91 would yield a much higher volume of coarse
aggregate, compared to the other mixtures. The ternary mixtures had the same proportions as their
respective OPC mixture (for each individual aggregate), but the volume of the OPC was replaced by the
ternary blend (Table 2). Two mortar and two paste mixtures were prepared with the same mixture
proportions as the concrete, by eliminating the coarse aggregate or both aggregates for the mortar and paste,
respectively.
10
This
pu
blic
atio
n is
availa
ble
free o
f charg
e fro
m: h
ttps://d
oi.o
rg/1
0.6
028
/NIS
T.T
N.1
963
Table 2 - Concrete Mixture Proportions
Coarse Aggregate
Type of mixture
Cement (kg/m3)
Fly ash (kg/m3)
Limestone powder (kg/m3)
Coarse aggregate
(kg/m3)
Sand (kg/m3)
Water (kg/m3)
Admix, mL/kg
w/cm
Diabase OPC 335 - - 1230 786 151 2.1 0.45
Ternary 201 85 28 (42.0 %)A (30.3 %) 151 0.2 0.48
Dolomite OPC 335 - - 1132 827 151 2.3 0.45
Ternary 201 85 28 (40.4 %) (31.9 %) 151 0.4 0.48
Dolomitic limestone
OPC 335 - - 1083 859 151 2.7 0.45
Ternary 201 85 28 (39.2 %) (33.1 %) 151 1.2 0.48
High Abs. limestone
OPC 335 - - 1053 784 151 3.1 0.45
Ternary 201 85 28 (42.0 %) (30.3 %) 151 0.4 0.48
Micritic limestone
OPC 335 - - 1089 831 151 2 0.45
Ternary 201 85 28 (40.2 %) (32.1 %) 151 1.2 0.48
Granite OPC 335 - - 1078 815 151 3.1 0.45
Ternary 201 85 28 (40.8 %) (31.5 %) 151 0.8 0.48
Granitic gneiss
OPC 335 - - 1118 830 151 2 0.45
Ternary 201 85 28 (40.3 %) (32.0 %) 151 0.6 0.48
Siliceous gravel
OPC 335 - - 1030 824 151 1.2 0.45
Ternary 201 85 28 (40.5 %) (31.8 %) 151 0 0.48
Marble OPC 335 - - 1203 791 151 2.3 0.45
Ternary 201 85 28 (41.7 %) (30.6 %) 151 1 0.48
Meta-basalt
OPC 335 - - 1156 848 151 2.9 0.45
Ternary 201 85 28 (39.6 %) (32.7 %) 151 1.2 0.48
Quartzite & sandstone
OPC 335 - - 1086 804 151 2.3 0.45
Ternary 201 85 28 (41.3 %) (31.0 %) 151 1.2 0.48 ANumbers in parenthesis indicate the volume percentage of the coarse and fine aggregates in the mixture.
11
This
pu
blic
atio
n is
availa
ble
free o
f charg
e fro
m: h
ttps://d
oi.o
rg/1
0.6
028
/NIS
T.T
N.1
963
CONCRETE AND PASTE EVALUATION
TESTING PERFORMED AT TFHRC
Concrete mixtures were prepared and cast per ASTM C192 [48] and temperature, slump, air content
and unit weight were determined per ASTM C1064 [49], ASTM C143 [50], ASTM C231 [51], and
ASTM C138 [52], respectively. Uniaxial electrical resistance of the fresh concrete was measured for the
first 24 h by using a special attachment to connect to two screw rods inserted into the fresh concrete [53].
Semi-adiabatic calorimetry was carried out for the first 24 h on two 100 mm by 200 mm cylinders [54]. For
this technique, for 18 concrete mixtures like the ones prepared in this study, the average maximum CoV
between two replicate specimens from a single concrete batch has been determined to be 0.7 %.
Concrete cylinders were stored in a temperature-regulated bath of saturated lime water until the
time of testing. Determination of concrete mechanical properties included: compressive strength
(ASTM C39 [55]) and static modulus of elasticity (ASTM C469 [56]) on 100 mm by 200 mm cylinders,
using unbonded caps, at ages of 1 d, 7 d, 28 d and 91 d; splitting tensile strength on 100 mm by 200 mm
cylinders (ASTM C496 [57]) at 28 d and 91 d and flexural strength (ASTM C78 [58]) on 100 mm
by 100 mm by 355 mm prisms at 28 d and 91 d. The number of replicates for compressive strength and
modulus of elasticity was two, while for splitting tensile strength and flexural strength, three specimens
were tested per age. The two paste mixtures were also cast into 100 mm by 200 mm cylinders, cured, and
subsequently tested for static modulus of elasticity at 7 d, 28 d, and 91 d.
Surface resistance (per AASHTO T358 [59]) of the hardened concrete cylinders
(100 mm x 200 mm) was measured using a 4-point (Wenner) probe with a probe spacing of 38 mm. The
measured surface resistivity values were divided by the appropriate geometry correction factor (1.95) for
100 mm by 200 mm cylindrical specimens (as opposed to the probe’s default geometry setting for
measuring the resistivity of a large flat slab). Two replicates from each mixture were tested at ages of 28 d
and 91 d.
Concrete CTE was determined on 100 mm by 178 mm cylinders following AASHTO T336 [37].
Two replicates were tested per mixture at ages exceeding 100 d, with exception of the OPC and ternary
mixtures containing siliceous gravel, which were tested between 47 d and 49 d.
Concrete cylinders tested in compression at 1 d, 7 d, 28 d and 91 d and prisms tested in flexure
at 28 d and 91 d were visually examined and photographed. Subsequently, fractured surfaces of each broken
cylinder were examined using a stereo-microscope at magnifications up to 90X. The nature of the fracture
patterns, especially the dominant fracture pattern with respect to the coarse aggregates was documented and
close-up photomicrographs were taken. Paste-aggregate interface quality, as well as the bond between them,
was qualitatively evaluated through stereomicroscopic examination.
Some of the concrete cylinders tested for compressive strength, especially from early ages (1 d
and 7 d), were selected to be further examined to compare the strength behavior of OPC and ternary
mixtures. Specimens containing high absorption limestone also received additional testing, since the
compressive strength ratio between ternary and OPC mixtures prepared with the high absorption limestone
was much lower than that from mixtures with any other aggregate. Two representative rectangular blocks
were cut from an area of interest of each selected cylinder, placed on individual glass microscope slides
with epoxy, and reduced to a thickness of approximately 20 µm. These thin sections were studied using a
petrographic polarized light microscope (PLM) at magnifications up to 400X, primarily to examine the
distribution and size of the limestone fillers, as well as to evaluate the relative degree of hydration of
portland cement and fly ash particles.

12
This
pu
blic
atio
n is
availa
ble
free o
f charg
e fro
m: h
ttps://d
oi.o
rg/1
0.6
028
/NIS
T.T
N.1
963
TESTING PERFORMED AT NIST (SEM PREPARATION AND ANALYSIS)
Paste-aggregate interface quality, as well as the bond between them, was qualitatively evaluated
through scanning electron microscopy (SEM) analysis. After compressive strength testing, (broken)
concrete cylinders were sawn to form disks approximately 3 mm to 5 mm thick. Smaller specimens
appropriate for SEM analysis were obtained by scoring and breaking the disks into pieces to fit into 25 mm
diameter silicone SEM molds. Specimens were oven dried at 65 ºC for 24 h, then subsequently placed onto
a small amount of the low-viscosity LR White resin that intruded the pore space via capillary suction.
After 2 h of intrusion, samples were fully immersed in the LR White resin and placed under a moderate
vacuum to remove any remaining air voids within the sample. The resin was then oven-cured at 65 ºC
for 24 h.
Hardened resin-impregnated samples were ground flat using 120-grit silicon carbide paper.
Samples were ground further using 400-, 600-, and 1200-grit silicon carbide paper. After the final grinding
step, specimens were polished using a series of diamond pastes with diamond particles of nominal diameters
of 9 µm, 6 µm, 3 µm, 1 µm, and 0.25 µm. Upon completion of polishing, specimens were rinsed with both
ethanol and acetone to remove any residual polishing compound.
Polished specimens were coated with a conductive layer of carbon using an evaporative coater in
preparation for SEM imaging. Imaging settings were chosen to maximize specimen throughput, while
maintaining resolution of fine-grained features. An excitation voltage of 13 keV, a probe current of
approximately 2 nA, and a working distance of 13 mm yielded high-contrast backscattered electron (BE)
images, as well as energy-dispersive X-ray (EDX) images of the major elemental constituents. BE images
and the total EDX counts for each element of interest were recorded as 16-bit TIFF grayscale images.
Pseudo-color images for highlighting bulk chemistry were generated using the elemental EDX images of
calcium, silicon, and aluminum for the red, green, and blue color channels, respectively.
Using stage automation, BE/EDX image sets were acquired at four distinct locations along an
overlapping two-by-two grid. The four sets of images were then stitched together to create a single image
using the ImageJ plugin MIST [60]. Using the silicon image as a reference, the MIST algorithm determined
the translations and rotations necessary to stitch the image into a single image; the stitching was then
executed for the other EDX images, as well as the BE image, using the same set of translations and rotations.
The result is a 1.8 mm by 1.4 mm stitched image which provides a broader view of the aggregate and
interfacial transition zones (ITZ). Stitched images for selected concretes of interest are shown in
Appendix C.
For a few of the aggregates, X-ray diffraction (XRD) scans over a two-theta range of 4° to 75° were
conducted to identify crystalline components. The measured patterns for these aggregates are provided in
Appendix D.
13
This
pu
blic
atio
n is
availa
ble
free o
f charg
e fro
m: h
ttps://d
oi.o
rg/1
0.6
028
/NIS
T.T
N.1
963
RESULTS
AGGREGATE CHARACTERISTICS
PETROGRAPHIC DESCRIPTION OF ROCK TYPES
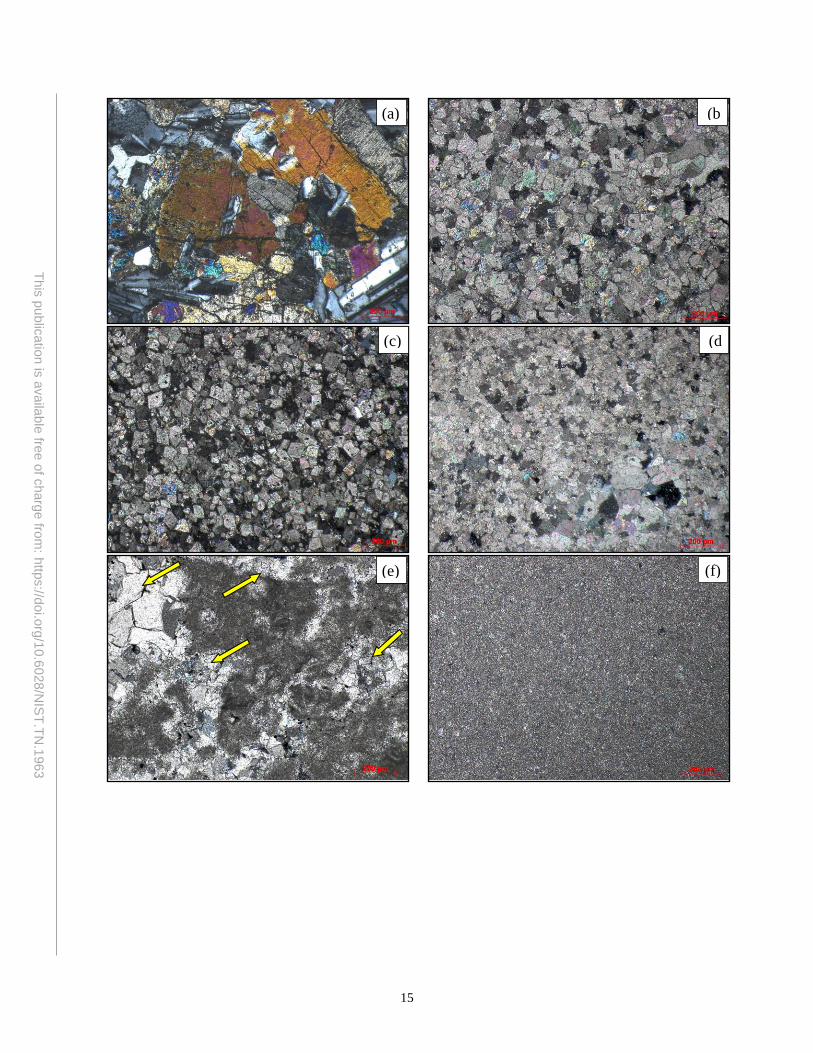
• Diabase:
The diabase (Figure 6a) was a dark gray, medium-grained, somewhat dense diabase/dolerite,
consisting mainly of plagioclase feldspar and pyroxene. The proportions of feldspar and pyroxene appeared
to vary from particle to particle.
• Dolomite:
The dolomite exhibited slight textural and mineralogical variations: medium to coarse-grained
dolomite (Figure 6b), and, what appeared to be relatively, a fine-grained dolomite (Figure 6c). This fine-
grained dolomite contained a fine-grained argillaceous/clayey matrix. Additionally, some aggregate
particles contained relatively large (non-reactive) traces of detrital quartz grains.
• Dolomitic limestone:
This aggregate (Figure 6d) was a somewhat dense dolomitic limestone with a uniform texture
(medium-grained).
• High absorption limestone:
The observed limestone particles were predominantly a micritic limestone containing sparse fossil
remains (Figure 6e). However, a few slightly coarse dolomitic limestone particles, as well as argillaceous
limestone particles, were observed. In some of the micritic limestone particles, the original fine-grained
micrite (microcrystalline calcite) matrix appeared to have recrystallized locally into a relatively granular
calcite matrix (sparite). The sparite matrix appeared to have a relatively higher inter-granular porosity than
the finer and denser micrite matrix. Some of the open spaces, either in the matrix or within the fossil
remains, were filled with coarser secondary calcite/sparite.
• Micritic limestone:
This aggregate was a somewhat dense, fine-grained micritic limestone (Figure 6f), with local thin
intercalated layers/lamination of argillaceous limestone. The argillaceous limestone laminations were
dolomitic and contained other miscellaneous materials, including dark dissolution materials, small quartz
grains, and miscellaneous iron minerals.
• Granite:
The granite was composed mainly of quartz and feldspar (Figure 6g), with lesser but appreciable
amounts of biotite, associated locally with some muscovite. Muscovite without association of biotite was
also observed locally in some of the aggregate particles. The relative proportions of biotite and muscovite
appeared to vary from particle to particle (Figure 6g).
• Granitic gneiss:
The granitic gneiss was composed mainly of quartz and feldspar with lesser amounts of biotite and
muscovite and trace amounts of secondary minerals including calcite, epidote, and sericite (Figure 6h). The
micaceous minerals formed a separate local band/layer in the rock. In some aggregate particles, most of the

14
This
pu
blic
atio
n is
availa
ble
free o
f charg
e fro
m: h
ttps://d
oi.o
rg/1
0.6
028
/NIS
T.T
N.1
963
calcium-rich plagioclase feldspars were altered into fine-grained, sodic-rich plagioclase, epidote,
muscovite, calcite, scapolite, and zeolite.
• Siliceous gravel:
The siliceous gravel was composed of coarse-grained quartz and quartzite-quartz crystals
(Figure 6i), exhibiting undulose extinction and lobate grain boundaries, an indication that the quartz grains
were strained and thus the rock can be designated as quartzite.
• Marble:
The marble (Figure 6j) exhibited a conspicuous twin lamella resulting from the deformation of the
original dolomitic limestone (Figure 6k). Finer-grained portions, consisting of darker argillaceous materials
and traces of strained quartz were observed locally.
• Meta-basalt:
This rock was found to be a fine to medium-grained metamorphosed basalt (meta-basalt). It
consisted mainly of feldspar with some secondary minerals, including amphiboles (hornblende and
actinolite) and chlorite (Figure 6l). Other secondary minerals, including calcite and epidote, were also
observed. The calcite occurred as veinlets, which apparently formed in the cracks and because of local
alteration of the minerals associated with epidote. Some particles also contained local veinlets of
recrystallized quartz and miscellaneous opaque minerals.
• Quartzite & Sandstone:
This aggregate was a mixture of quartzite & sandstone. The quartzite consisted mainly of quartz
and feldspars with traces of amphibole and mica (Figure 6m). A uniform medium-grained texture was
observed. On the other hand, the sandstone consisted mainly of a combination of sand-sized quartz and
feldspar clasts (Figure 6n). It also contained lesser amounts of a microcrystalline quartz, cemented in an
argillaceous/clayey matrix. Traces of calcite and black miscellaneous ferruginous materials were also
observed in the matrix of the rock.
• Sand:
The natural sand consisted mainly of quartz with lesser amounts of chert (Figure 6o), but also
contained lesser amounts of fine and coarse-grained ferruginous sandstone, granitic rock, and feldspar, as
well as quartzite/strained quartz (Figures 6p and 6q) and chert (Figure 6r).
Table 3 summarizes the major and minor mineralogy of the aggregates used in this study.
15
This
pu
blic
atio
n is
availa
ble
free o
f charg
e fro
m: h
ttps://d
oi.o
rg/1
0.6
028
/NIS
T.T
N.1
963
(c) (d
)
(e) (f)
(a) (b
)
16
This
pu
blic
atio
n is
availa
ble
free o
f charg
e fro
m: h
ttps://d
oi.o
rg/1
0.6
028
/NIS
T.T
N.1
963
(g
)
(h
)
(k
) (l)
(i) (j)

17
This
pu
blic
atio
n is
availa
ble
free o
f charg
e fro
m: h
ttps://d
oi.o
rg/1
0.6
028
/NIS
T.T
N.1
963
Figure 6. Thin section photomicrographs: (a) diabase, (b) dolomite, (c) relatively fine-grained
argillaceous dolomite, (d) relatively uniformly textured dolomitic limestone, (e) limestone with locally
recrystallized calcite, (f) fine-grained and dense micritic limestone, (g) granite, (h) granitic gneiss, (i)
siliceous gravel, (j) marble fracture surface (k) marble showing twin lamellae, (l) meta-basalt, (m)
quartzite, (n) sandstone and major constituents of sand (chert is shown by yellow arrows and quartzite by
red arrows): (o) mixture of mainly quartz with lesser amounts of chert, (p) mainly quartz with lesser
amounts of quartzite, (q) quartz and quartzite and (r) chert particles.
(o
)
(p
)
(q
) (r)
(m) (n
)

18
This
pu
blic
atio
n is
availa
ble
free o
f charg
e fro
m: h
ttps://d
oi.o
rg/1
0.6
028
/NIS
T.T
N.1
963
Table 3. Summary of Aggregate Mineralogy
Rock Type Major minerals Minor minerals
Diabase* Plagioclase feldspar and pyroxene N/A
Dolomite* Dolomite and calcite Argillaceous/clayey
constituents
Dolomitic limestone* Calcite Dolomite
High absorption limestone*
Calcite Dolomite, argillaceous
materials
Micritic limestone* Calcite Thin layers of argillaceous
materials, quartz
Granite* Quartz and feldspar Biotite
Granitic gneiss* Quartz and feldspar Biotite and muscovite
Siliceous gravel:
quartzite/quartz ** Silica N/A
Marble* Calcite Strained quartz
Meta-basalt* Feldspar Amphibole and chlorite
Quartzite & Sandstone*
Quartz and feldspar
Sandstone also contains some clayey/argillaceous matrix
Calcite and micaceous
minerals
Sand: mainly quartz with some quartzite & chert**
Silica Ferruginous materials in the
sandstone
* Manufactured/Crushed stone ** Natural aggregate N/A not applicable

19
This
pu
blic
atio
n is
availa
ble
free o
f charg
e fro
m: h
ttps://d
oi.o
rg/1
0.6
028
/NIS
T.T
N.1
963
AGGREGATE PROPERTIES
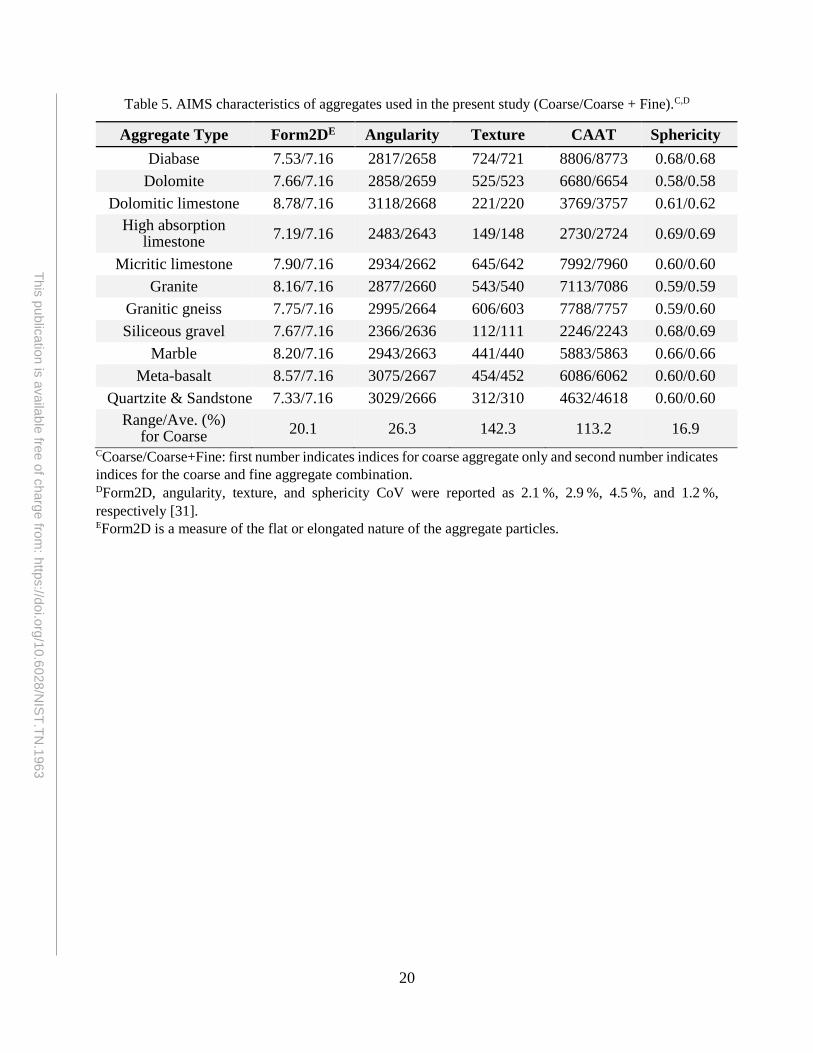
The measured aggregate characteristics are summarized in Tables 4, 5, and 6 for bulk properties,
shape and texture measures, and contact angle/modulus/CTE measurements, respectively. In addition to the
measured average values for each aggregate, the variation amongst the aggregates, as indicated by the ratio
of the range to the overall average for each property is indicated, as it was envisioned that those properties
with the most variation might be good candidates for influencing the measured performance characteristics
of the produced concretes. Conversely, if a property is constant across different aggregate types, the study
will not be able to determine if it has any effect on concrete performance. Properties that vary most
significantly in Tables 4, 5, and 6 include absorption (Table 4), texture and CAAT (Table 5), and polar
surface energy, elastic modulus, and CTE (Table 6).
Table 4. Bulk properties of aggregates used in the present study.B
BFor bulk unit weight, specific gravity, and absorption, the average CoV was 0.1 %, 0.1 %, and 3.4 %,
respectively.
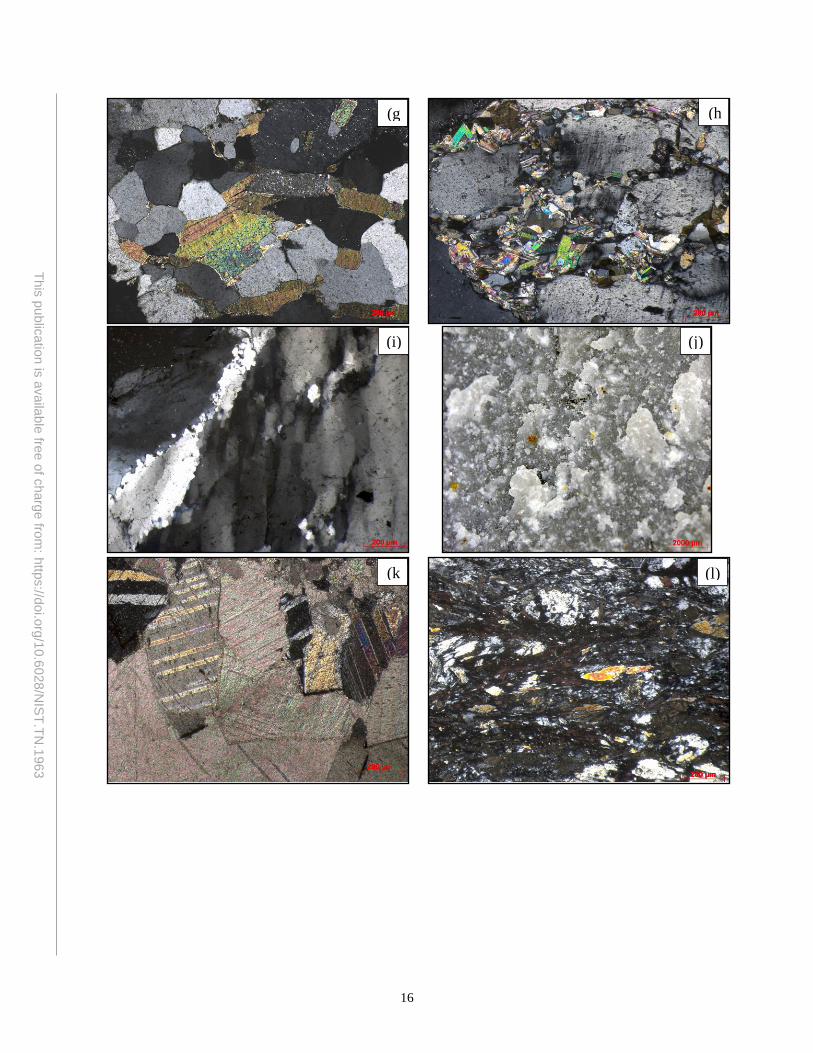
Figure 7 and Figure 8 provide representative images of angularity and texture, respectively,
obtained by AIMS for particles retained on the 19.0 mm sieve. Angularity of natural sand particles retained
on the 4.75 mm sieve is also provided. In Figure 7, the siliceous gravel appears much smoother than any of
the other aggregates and this observation is quantitatively confirmed in Table 5, where the gravel exhibits
the lowest texture and CAAT indices. Similarly, the images and measurements indicate that the high
absorption limestone ranks second in terms of “smoothness.”
Aggregate Type
Bulk unit weight
(oven dry,
kg/m3)
Specific
gravity (SSD)
Apparent
specific
gravity
Absorption
(%)
Diabase 1808 2.94 2.97 0.51
Dolomite 1665 2.82 2.84 0.44
Dolomitic limestone 1593 2.78 2.81 0.59
High absorption
limestone 1548 2.58
2.71 2.98
Micritic limestone 1601 2.72 2.73 0.33
Granite 1585 2.66 2.69 0.68
Granitic gneiss 1645 2.80 2.83 0.60
Siliceous gravel 1653 2.57 2.64 1.67
Marble 1769 2.89 2.91 0.31
Meta-basalt 1700 2.94 2.97 0.48
Quartzite & Sandstone 1596 2.65 2.69 0.87
Range/Average (%) 15.8 13.5 11.9 310.2
20
This
pu
blic
atio
n is
availa
ble
free o
f charg
e fro
m: h
ttps://d
oi.o
rg/1
0.6
028
/NIS
T.T
N.1
963
Table 5. AIMS characteristics of aggregates used in the present study (Coarse/Coarse + Fine).C,D
Aggregate Type Form2DE Angularity Texture CAAT Sphericity
Diabase 7.53/7.16 2817/2658 724/721 8806/8773 0.68/0.68
Dolomite 7.66/7.16 2858/2659 525/523 6680/6654 0.58/0.58
Dolomitic limestone 8.78/7.16 3118/2668 221/220 3769/3757 0.61/0.62
High absorption limestone
7.19/7.16 2483/2643 149/148 2730/2724 0.69/0.69
Micritic limestone 7.90/7.16 2934/2662 645/642 7992/7960 0.60/0.60
Granite 8.16/7.16 2877/2660 543/540 7113/7086 0.59/0.59
Granitic gneiss 7.75/7.16 2995/2664 606/603 7788/7757 0.59/0.60
Siliceous gravel 7.67/7.16 2366/2636 112/111 2246/2243 0.68/0.69
Marble 8.20/7.16 2943/2663 441/440 5883/5863 0.66/0.66
Meta-basalt 8.57/7.16 3075/2667 454/452 6086/6062 0.60/0.60
Quartzite & Sandstone 7.33/7.16 3029/2666 312/310 4632/4618 0.60/0.60
Range/Ave. (%) for Coarse
20.1 26.3 142.3 113.2 16.9
CCoarse/Coarse+Fine: first number indicates indices for coarse aggregate only and second number indicates
indices for the coarse and fine aggregate combination. DForm2D, angularity, texture, and sphericity CoV were reported as 2.1 %, 2.9 %, 4.5 %, and 1.2 %,
respectively [31]. EForm2D is a measure of the flat or elongated nature of the aggregate particles.

21
This
pu
blic
atio
n is
availa
ble
free o
f charg
e fro
m: h
ttps://d
oi.o
rg/1
0.6
028
/NIS
T.T
N.1
963
Table 6. Surface energies, modulus, and CTE of aggregates used in the present study.
Aggregate
Type
Dispersive
surface
energy
(mJ/m2)
Polar
surface
energy
(mJ/m2)
Total
surface
energy
(mJ/m2)
Elastic
modulus
(GPa)
CTE
(µε/°C)
Diabase 36.1 13.3 49.4 67.6 (16.6 %)F 4.6
Dolomite 38.3 12.4 50.7 73.4 (3.4 %) 8.0
Dolomitic
limestone 36.7 3.3 40.0 79.4 (11.5 %)
8.4
High absorption limestone
36.6 7.8 44.4 44.1 (14.6 %)
7.0
Micritic
limestone 37.2 2.5 39.7 71.6 (12.1 %)
5.0
Granite 37.8 11.2 49.0 54.4 (9.8 %) 9.2
Granitic gneiss 35.8 14.0 49.8 40 (21.0 %) 10.5
Siliceous
gravel 29.1 11.4 40.5 97.3 (4.6 %)
11.3
Marble 32.5 9.2 41.7 102.1 (4.2 %) 8.1
Meta-basalt 42.3 19.7 62.0 92.4 (9.2 %) 6.3
Quartzite &
Sandstone 39.3 27.3 66.6 62.9 (1.7 %)
10.1
Range/Ave. (%)
36.2 206.5 55.4 87.0
83.3
FNumber in parenthesis indicates CoV for measured elastic modulus.

22
This
pu
blic
atio
n is
availa
ble
free o
f charg
e fro
m: h
ttps://d
oi.o
rg/1
0.6
028
/NIS
T.T
N.1
963
Figure 7. Angularity pictures of representative particles retained on the 19.0 mm sieve. (a) Diabase, (b)
Dolomite, (c) Dolomitic limestone, (d) High absorption limestone, (e) Micritic limestone, (f) Granite, (g)
Granitic gneiss, (h) Siliceous gravel, (i) Marble, (j) Meta-basalt and (k) Quartzite & Sandstone. (l)
Angularity picture of representative sand particle retained on a 4.75 mm sieve.
(a) (b) (c)
(d) (e) (f)
(g) (h) (i)
(j) (k) (1)
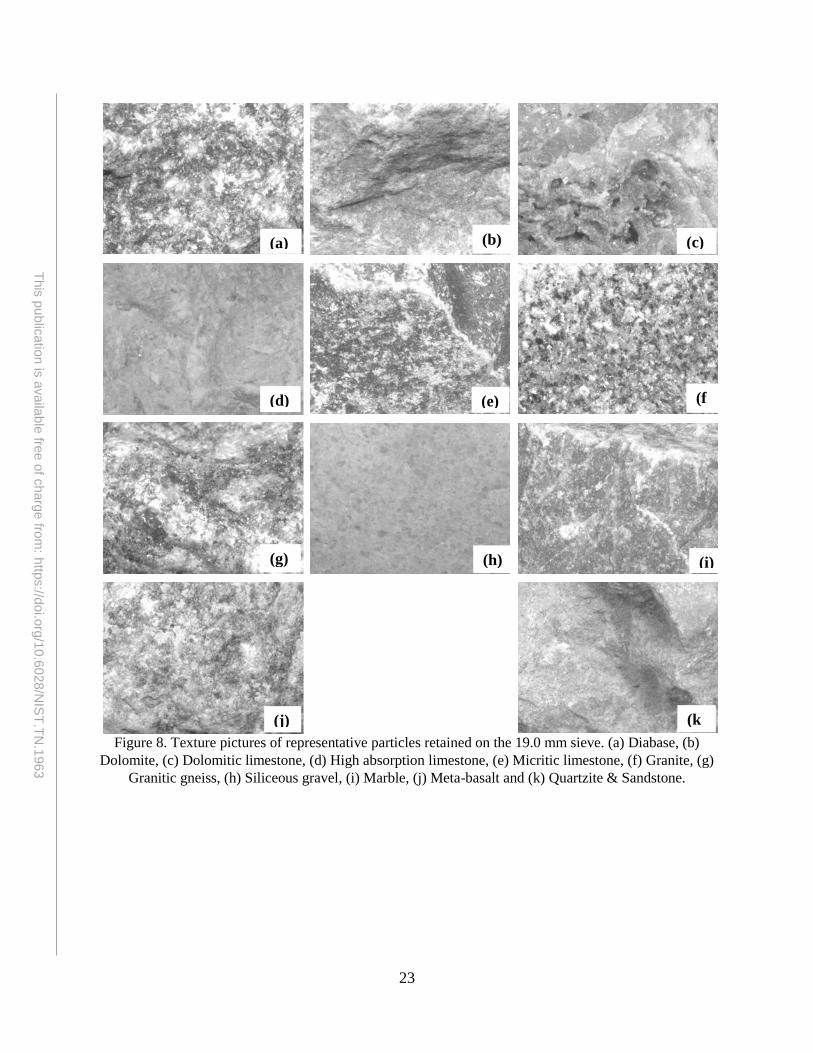
23
This
pu
blic
atio
n is
availa
ble
free o
f charg
e fro
m: h
ttps://d
oi.o
rg/1
0.6
028
/NIS
T.T
N.1
963
Figure 8. Texture pictures of representative particles retained on the 19.0 mm sieve. (a) Diabase, (b)
Dolomite, (c) Dolomitic limestone, (d) High absorption limestone, (e) Micritic limestone, (f) Granite, (g)
Granitic gneiss, (h) Siliceous gravel, (i) Marble, (j) Meta-basalt and (k) Quartzite & Sandstone.
(a) (b) (c)
(d) (e) (f
)
(g) (h) (i)
(j) (k
)

24
This
pu
blic
atio
n is
availa
ble
free o
f charg
e fro
m: h
ttps://d
oi.o
rg/1
0.6
028
/NIS
T.T
N.1
963
ROCK (CORE) PROPERTIES
The measured properties of selected rocks, measured on cores obtained from large-sized quarried
rocks are presented in Tables 7 and 8. The properties that varied the most were the compressive strength
and the longitudinal dynamic modulus of elasticity. Most of the properties measured on the cores did not
correlate well with one another, except for what is shown in Figure 9. From Figure 9a and 9b, it appears
that the data for the micritic limestone CTE may not be accurate, since once this rock is excluded, good
correlations are obtained between CTE and density or CTE and rock modulus of elasticity, with an
estimated standard error of 0.59 µ/°C (7.7 %) and 0.24 µ/°C (3.2 %), respectively. Figure 9c shows a
promising correlation between modulus of elasticity obtained by static and dynamic measurements
(standard error of 4.7 GPa or 4.8 %), although static tests consistently yielded lower values than the dynamic
ones. Although a good correlation was not found between rock density and compressive strength (Figure
9d – standard error of 33.9 MPa or 19.6 %), there is a definite trend between these two rock properties.
Table 7. Density, static modulus of elasticity, compressive and tensile strengths, and CTE of rock coresG
GFor density, static modulus of elasticity, Poisson ratio, compressive strength, tensile strength, and CTE,
the average CoV was 0.2 %, 1.1 %, 2.2%, 7.9 %, 6.3 %, and 0.9 %, respectively.
Table 8. Dynamic transverse and longitudinal modulus of elasticity of rock coresH
Rock Type Dynamic modulus of elasticity
Transverse (GPa) Longitudinal (GPa)
Diabase 97.9 7.0
Micritic limestone 78.8 9.1
Granite 70.6 11.0
Granitic gneiss 59.2 16.9
Marble 88.4 -
Meta-basalt 93.2 7.1
Range/Average (%) 47.6 96.6 HFor transverse dynamic modulus of elasticity and longitudinal dynamic modulus of elasticity, the average
CoV was 1.8 % and 5.2 %, respectively.
Rock Type Density
(kg/m3)
Static Compressive
strength
(MPa)
Tensile
strength
(MPa)
CTE
(µε/°C) Modulus of
elasticity
(GPa)
Poisson
ratio
Diabase 3010 87 0.24 265 21 5.9
Micritic
limestone 2710 70 0.28 112 14 4.5
Granite 2650 56 0.22 163 19 8.6
Granitic gneiss 2810 48 0.23 116 13 8.7
Marble 2830 81 0.26 182 18 8.1
Meta-basalt 2980 74 0.34 191 14 7.1
Range/Average
(%) 12.7 56.0 46.5 89.4 48.8 58.8

25
This
pu
blic
atio
n is
availa
ble
free o
f charg
e fro
m: h
ttps://d
oi.o
rg/1
0.6
028
/NIS
T.T
N.1
963
Figure 9. Correlation of measured rock properties. Dashed line in (c) indicates line of equality. Average
CoV can be found in Tables 7 and 8.
Figure 10 shows that some of the rock properties can be estimated from aggregate testing. As seen
in Figure 10a, when the average aggregate dynamic modulus is used for all aggregates, two aggregates
(diabase and marble) seem not to follow the same trends as the others. From the limited available data
presented in Figure 10b, it does appear that the compressive strengths of the rocks can be estimated from
their apparent specific gravities, with an estimated standard error of 33.9 MPa or 19.8 %. Out of the 6 rocks
tested, granite was the only one that did not follow the same trend as the others and was therefore eliminated
from the correlation analysis, confirming that some problems may have occurred when determining the
granite’s compressive strength, as already suggested in Figure 9d.
Regarding CTE, Figure 10c shows a good agreement between the results obtained in aggregate
testing and those on cores, with an estimated standard error of 0.33 µε/°C or 4.3 %, when the micritic
limestone is excluded. Micritic limestone (rock) CTE testing may have also presented problems since both
in Figures 9a and 9b and in Figure 10c, it does not follow the expected trends. It is important to point out
that the CTE is dependent on the testing temperature range [60] and since the aggregates were tested
between 0 °C and 100 °C, while the cores were evaluated between 10 °C to 50 °C, a 1:1 correlation was not
necessarily expected. Still, a generally good agreement is observed between the values obtained on the bulk
cores and the small cylinders using the two different measurement techniques, considering the average CoV
of 18 % for the NIST CTE data. Conversely, for the CTE measurements performed at TFHRC on the cores
removed from the large-sized quarried rocks, the maximum CoV was only 0.9 %.
(a
)
(b
)
(c
)
(d
)

26
This
pu
blic
atio
n is
availa
ble
free o
f charg
e fro
m: h
ttps://d
oi.o
rg/1
0.6
028
/NIS
T.T
N.1
963
Figure 10. Correlation between aggregate tests and tests on rock cores. (a) aggregate dynamic modulus
carried out at NIST and either transverse dynamic modulus or static modulus carried out on rock cores at
TFHRC. Dashed line indicates line of equality. (b) apparent specific gravity carried out on aggregates
and compressive strength carried out on rock cores. (c) aggregate CTE versus rock core CTE. Average
CoV can be found in Tables 7 and 8.
(a
)
(b
)
(c
)

27
This
pu
blic
atio
n is
availa
ble
free o
f charg
e fro
m: h
ttps://d
oi.o
rg/1
0.6
028
/NIS
T.T
N.1
963
CONCRETE PROPERTIES
FRESH CONCRETE PROPERTIES
As the concretes were cast over a more than six-month period, the fresh concrete temperature
exhibited some variation due to changes in the environment of the rooms where material storage and casting
took place. Specifically, the minimum and maximum fresh temperatures were 19.9 °C and 23.0 °C,
respectively. The measured temperature rises for the OPC and ternary concrete mixture semi-adiabatic
specimens are provided in Figure 11. To reduce any dispersion in the data due to the variable starting
temperatures and exposure environments (curing), the data are plotted as the temperature rise relative to the
minimum temperature experienced by each individual mixture. With this correction, data for many of the
mixtures appears quite similar, particularly for the ternary blend concretes. Both concretes based on granite
appear as outliers in Figure 11, as the starting temperature (by the time the semi-adiabatic cylinder was
prepared from the fresh mixture) of the OPC granite-based concrete was only 19.1 °C, while that of the
ternary blend was 19.4 °C but quickly rose to about 21.5 °C when placed in its curing environment. By
comparison, the initial temperature of the semi-adiabatic specimen for the OPC quartzite & sandstone-
based concrete was 23.1 °C.
The measured electrical resistance (impedance) for a subset of the fresh concrete mixtures is
provided in Figure 12. While most of the mixtures exhibit a similar response, for both the OPC and ternary
blend concretes, those mixtures prepared with the quartzite & sandstone coarse aggregate produce results
that are somewhat different, as was also the case for their semi-adiabatic temperature responses in
Figure 11. For the OPC mixtures in Figure 12, the granite also appears somewhat distinct from most of the
mixtures (as was again the case for its semi-adiabatic response in Figure 11 as discussed above). When
comparing the semi-adiabatic temperature rise results to the measured electrical resistance of the fresh
concrete mixtures, a reasonable correlation (standard errors of 0.1 h to 0.2 h) is observed between the time
required to reach 80 % (OPC mixtures except for siliceous gravel and granite) to 90 % (ternary blends
except for siliceous gravel) of the peak temperature and the inflection point in the electrical resistance
response, with both occurring in the 9 h to 12 h time range. Previously, the first local minimum in the
electrical resistance response has been used to successfully anticipate the initial setting time of both
concrete [53] and paste [62] mixtures.
The variation in air content among the concrete mixtures was minimal with an average air content
of 2.8 %, with individual mixtures ranging from 2.1 % to 3.8 %. Similarly, the average slump was 53 mm
with a range of 32 mm to 76 mm. No systematic differences were observed when comparing the slumps
and air contents of the OPC concretes to their ternary blend counterparts.

28
This
pu
blic
atio
n is
availa
ble
free o
f charg
e fro
m: h
ttps://d
oi.o
rg/1
0.6
028
/NIS
T.T
N.1
963
Figure 11. Semi-adiabatic temperature rise (normalized temperatures per initial temperature) plots for the
OPC (top) and ternary blend (bottom) concrete mixtures.
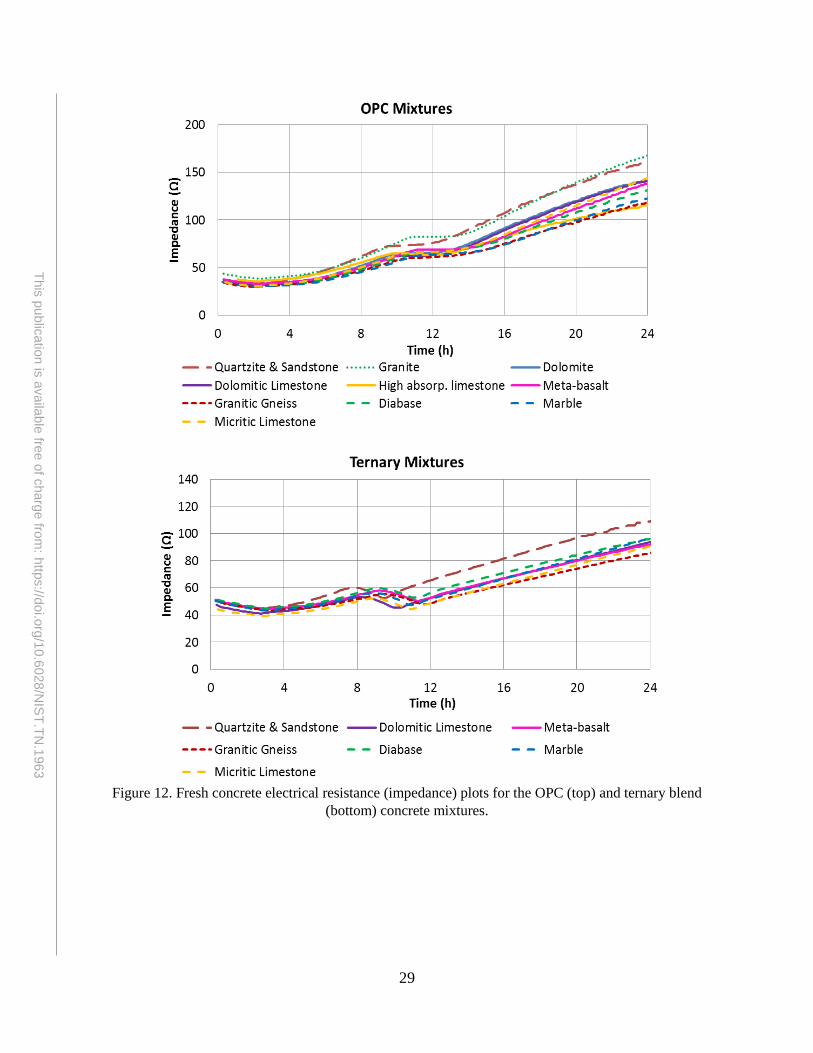
29
This
pu
blic
atio
n is
availa
ble
free o
f charg
e fro
m: h
ttps://d
oi.o
rg/1
0.6
028
/NIS
T.T
N.1
963
Figure 12. Fresh concrete electrical resistance (impedance) plots for the OPC (top) and ternary blend
(bottom) concrete mixtures.

30
This
pu
blic
atio
n is
availa
ble
free o
f charg
e fro
m: h
ttps://d
oi.o
rg/1
0.6
028
/NIS
T.T
N.1
963
Concrete Mechanical Properties
The measured mechanical properties for the OPC and ternary blend concrete mixtures are provided
in Tables 9 and 10, respectively, along with the measured variation in each property at each age for each
binder type. Aggregate type has the largest influence (range/average) at 1 d, but there is still significant
variation in all measured strengths and moduli out to 91 d. At the later ages, the measured variation in
strengths is generally greater for the ternary blend concretes than for those based on an OPC binder, in
agreement with previous results [63].
The ability to infer later age strength from 1 d values is illustrated in Figure 13. A reasonable
correlation between later ages and 1 d strength is observed for both the OPC and ternary blend concretes,
but the value of the standard error for the linear fit increases progressively from 7 d through 28 d to 91 d,
exhibiting values of 1.8 MPa, 2.9 MPa, and 3.7 MPa, respectively. Relative to the average strength across
all aggregate types at each age, these standard errors correspond to values of 5.4 %, 6.6 %, and 7.0 %,
respectively. If one considers the component pastes (OPC or ternary) to be nominally of the same strengths
in the different aggregate concretes, the variation in strength should be mainly due to the microstructure
and bond of the ITZ paste to the much stronger aggregate (Table 7). The relative influence of this
microstructural feature on measured strength decreases with specimen age (range values in Tables 9
and 10), so that it is not surprising that the correlation of later age strength with the 1 d values also decreases
at the later ages of 28 d and 91 d.
It is also informative to compare the strengths of the ternary blend concretes to their corresponding
OPC counterparts, as shown in Figure 14 for 28 d compressive strength. While data from most of the
concrete mixtures falls on a straight line, there are two types of exceptions. For most of the carbonate
aggregates, the ternary blend exhibits a higher than expected strength, while the opposite is found for the
high absorption limestone. While no definitive explanation is provided, the isothermal calorimetry results
for the pore solutions with ground aggregate particles (Figure 15) show that marble and micritic limestone
appear to be more reactive in ternary pore solution than in OPC pore solution, while high absorption
limestone does not show much reaction with the ternary pore solution. More information on aggregate
reactivity can be found in appendix A. This additional reactivity could enhance the formation of the
hydrated calcium carbonate-calcium hydroxide compounds observed in the interface between carbonate
aggregates and cement paste by Monteiro and Mehta [14]. Shannon et al. [63,64] have also observed higher
than expected strengths when using portland limestone cements (PLC) instead of OPC for concretes
prepared with fly ash or slag (hence ternary blends) and with a variety of aggregates, particularly limestones.
Conversely, it is unclear at this time why the ternary blend combined with the high absorption limestone
has produced such a low strength concrete.
Figure 16 provides a comparison of the 28 d and 91 d splitting tensile strengths to their counterpart
compressive strengths. It can be observed that an ACI-type relationship [65], but with a coefficient of 0.62
instead of the expected 0.56, provides a reasonable description of the relationship between these two
measures. However, as shown in the plot, a simple linear relation would provide an equally adequate fitting
of the experimental data produced in this study. Similarly, Figure 17 shows three commonly used models
to predict modulus of rupture from the measured compressive strength. ACI 363-1 [66] fits the data better,
independent of testing age and binder composition, while both ACI 363-2 and ACI 318-14 [65]
considerably underestimate the measured modulus of rupture. In addition, the latter two models
underestimate the ternary mixtures more than they do the OPC mixtures and the 28 d specimens more than
the 91 d ones.

31
This
pu
blic
atio
n is
availa
ble
free o
f charg
e fro
m: h
ttps://d
oi.o
rg/1
0.6
028
/NIS
T.T
N.1
963
Table 9. Mechanical Properties of OPC Concrete, Mortar, and Paste Mixtures
Aggregate Compressive Strength (MPa) Elastic Modulus (GPa)
Splitting Tensile
Strength (MPa)
Flexural Strength (MPa)
1 d 7 d 28 d 91 d 1 d 7 d 28 d 91 d 28 d 91 d 28 d 91 d
Average CoVI 2.5 % 1.5 % 1.9 % 2.9 % 5.5 % 3.3 % 3.6 % 1.7 % 5.3 % 4.8 % 3.1 % 3.7 %
Diabase 18.5 40.9 53.7 61.1 33.7 38.4 40.9 44.8 4.88 5.07 6.12 6.34
Dolomite 21.0 39.4 50.3 57.7 28.4 35.8 45.8 46.3 4.18 5.06 6.19 7.25
Dolomitic limestone 23.1 41.9 52.5 60.1 32.9 45.2 47 48.8 4.34 5.23 6.53 7.24
High absorption limestone 23.8 42.6 52.7 58.7 23.5 30.4 34.2 34.8 4.26 4.73 6.37 6.45
Micritic limestone 17.0 38.4 50.5 58 29.4 39.4 41.7 46.9 3.72 4.63 6.54 6.85
Granite 22.6 41.5 52.4 60.3 23.5 29.1 32.6 35.1 4.26 4.74 5.93 6.55
Granitic gneiss 16.3 34.5 46.3 51.4 19.6 25.5 27.6 30.7 3.99 4.31 5.75 5.83
Siliceous gravel 9.8 31 37.9 46.4 20.6 28.9 33.6 34.8 3.72 4.19 5.89 6.01
Marble 19.3 41.8 51.1 60.7 30.9 39.9 49.3 51.6 4.66 5.12 6.37 7.14
Meta-basalt 19.3 37.8 51.1 59.3 18.1 29.9 31.7 35.1 4.61 5.01 6.73 6.79
Quartzite & Sandstone 19.2 38.5 48.4 57.7 27 35.6 33.6 40.4 4.77 5.14 5.93 6.58
Range/Ave. (%) 73.3 29.8 31.8 25.4 59.5 57.3 57.1 51.1 26.9 21.6 15.9 21.4
Mortar 27.0 30.6
Paste 12.2 13.7 15.4
IIndicates the average of the CoV determined for measurements performed on each mixture at a given age.

32
This
pu
blic
atio
n is
availa
ble
free o
f charg
e fro
m: h
ttps://d
oi.o
rg/1
0.6
028
/NIS
T.T
N.1
963
Table 10. Mechanical Properties of Ternary Blend Concrete, Mortar, and Paste Mixtures
Aggregate Compressive Strength (MPa) Elastic Modulus (GPa)
Splitting Tensile
Strength (MPa)
Flexural Strength (MPa)
1 d 7 d 28 d 91 d 1 d 7 d 28 d 91 d 28 d 91 d 28 d 91 d
Average CoV 2.8 % 1.7 % 2.8 % 1.9 % 7.6 % 3.4 % 3.3 % 1.2 % 5.4 % 4.2 % 4.0 % 3.3 %
Diabase 6.6 26.5 39.3 50.7 25.1 35.6 38.7 43.0 3.49 5.53 5.56 6.17
Dolomite 7.9 27.7 37.7 48.0 18.3 31.4 37.9 43.7 4.30 4.59 6.62 7.18
Dolomitic limestone 10.6 29.6 42.3 51.1 24.3 38.6 44.3 48.9 3.73 4.14 6.37 7.11
High absorption limestone 7.6 25.4 33.2 41.3 14.8 25.1 29.0 31.0 3.16 3.35 5.59 5.76
Micritic limestone 9.3 31.3 44.0 51.8 22.6 37.0 42.4 44.6 4.39 5.35 6.17 7.19
Granite 8.6 29.1 39.0 48.7 16.7 25.1 29.5 32.4 3.94 4.20 5.88 6.79
Granitic gneiss 6.6 26.0 36.7 45.9 14.4 23.6 25.0 29.3 3.41 4.45 5.08 5.34
Siliceous gravel 6.1 22.4 29.7 40.2 17.0 26.2 30.3 34.4 3.22 4.05 4.71 5.03
Marble 8.0 31.3 43.2 56.9 22.4 37.2 42.8 47.6 4.87 5.05 6.62 7.10
Meta-basalt 8.1 28.0 39.0 43.4 17.7 27.4 32.3 35.5 4.19 4.99 5.70 6.14
Quartzite & Sandstone 8.4 30.0 40.9 50.4 21.8 31.2 33.4 40.4 4.4 4.11 5.16 6.58
Range/Ave. (%) 56.3 32.0 37.0 34.8 55.0 48.8 54.9 50.0 43.7 48.1 33.3 33.8
Mortar 27.7 32.2
Paste 8.7 10.8 13.7

33
This
pu
blic
atio
n is
availa
ble
free o
f charg
e fro
m: h
ttps://d
oi.o
rg/1
0.6
028
/NIS
T.T
N.1
963
Figure 13. Later age compressive strength vs. 1-d compressive strength for the OPC and ternary blend
concretes. Average CoV can be found in Tables 9 and 10.
Figure 14. 28-d compressive strength of ternary blend concretes vs. corresponding OPC concrete.
Average CoV can be found in Tables 9 and 10. Blue line is fit to all the data, while red line is fit to the
seven indicated aggregates, omitting high absorption limestone and three limestones (including marble).
Black dashed line indicates a one-to-one correspondence.

34
This
pu
blic
atio
n is
availa
ble
free o
f charg
e fro
m: h
ttps://d
oi.o
rg/1
0.6
028
/NIS
T.T
N.1
963
Figure 15. Isothermal calorimetry of aggregates in OPC or ternary pore solution. Cumulative heat over
time of (a) marble; (b) micritic limestone and (c) high absorption limestone.
Figure 16. 28-d and 91-d splitting tensile strength vs. compressive strength. Recommended ACI
coefficient is 0.56 (instead of 0.62) [65]. Linear relation shown in box is for 28-d data for both ternary and
OPC mixtures. Average CoV can be found in Tables 9 and 10.
(b
)
(a
)
(c
)
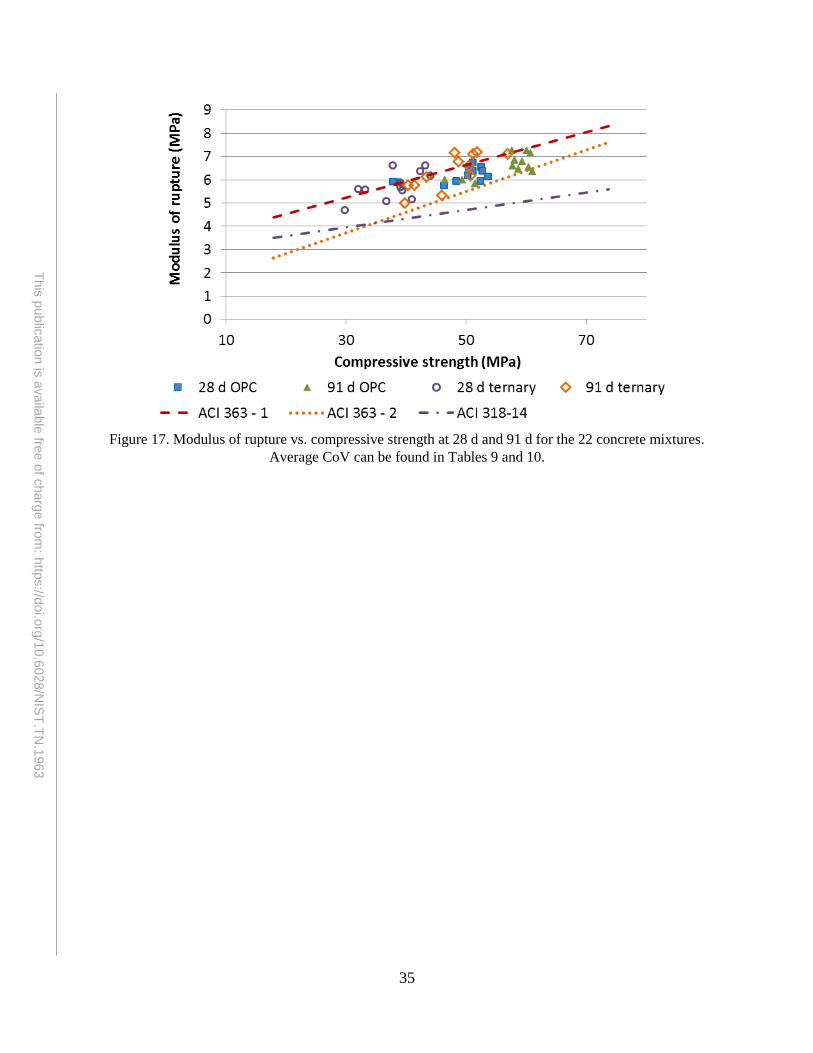
35
This
pu
blic
atio
n is
availa
ble
free o
f charg
e fro
m: h
ttps://d
oi.o
rg/1
0.6
028
/NIS
T.T
N.1
963
Figure 17. Modulus of rupture vs. compressive strength at 28 d and 91 d for the 22 concrete mixtures.
Average CoV can be found in Tables 9 and 10.

36
This
pu
blic
atio
n is
availa
ble
free o
f charg
e fro
m: h
ttps://d
oi.o
rg/1
0.6
028
/NIS
T.T
N.1
963
HARDENED CONCRETE RESISTIVITY
The measured electrical resistivities of the hardened concrete cylinders at ages of 28 d and 91 d are
provided in Table 11. Both a size correction and the recommended correction for limewater curing [59,67]
were applied to the measured data to produce the values shown in the table. Usually, if an aggregate is not
prone to alkali-silica reaction (ASR) or freeze-thaw damage and spalling, the aggregate effect on concrete
durability is ignored. Nevertheless, the results presented in Table 11 demonstrate the important role that
aggregates may play in influencing concrete durability. It is not expected that the concretes produced with
the same aggregates but different binders (OPC or ternary) will produce identical resistivity values, due to
the significant influence of pore solution resistivity on concrete resistivity [59,67].
Table 11. 28-d and 91-d Electrical Resistivities of the Hardened Concretes
Aggregate
OPC concrete Ternary Blend Concrete
28 d
(kΩ·cm)
91 d
(kΩ·cm)
28 d
(kΩ·cm)
91 d
(kΩ·cm)
Average CoV 3.7 % 1.3 % 3.6 % 0.7 %
Diabase 6.1 8.0 5.8 N.A.
Dolomite 5.2 8.1 7.2 16.2
Dolomitic limestone 6.3 9.3 7.6 19.1
High absorption limestone 4.2 6.6 4.8 9.9
Micritic limestone 6.7 9.4 9.1 22.3
Granite 5.8 7.1 6.8 16.0
Granitic gneiss 4.1 5.8 6.3 16.4
Siliceous gravel 4.6 6.7 6.0 16.4
Marble 5.4 8.0 7.3 20.6
Meta-basalt 5.5 7.5 7.1 16.8
Quartzite & Sandstone 5.0 7.5 6.9 18.6
Range/Ave (%) 48.6 47.1 63.2 72.0
For every aggregate, except for the diabase at 28 d, the measured resistivities for the ternary blend
concrete were significantly higher than those for the OPC concrete, particularly at the testing age of 91 d.
The combination of a reactive (Class C) fly ash with a fine limestone powder in the ternary blend binder
produces concretes with a high degree of pore refinement that therefore exhibit a significantly higher
electrical resistivity [20], implying a lower diffusivity for chlorides and other deleterious ions [68], at a
similar compressive strength level as that found in the OPC (control) concretes.
There was also a larger variation of electrical resistivity (range/average) amongst the aggregates
for the ternary blend concretes at both testing ages. Overall, aggregate selection has a significant influence
on the electrical resistivity, especially in ternary mixtures, likely via its influence on the interfacial transition
zone microstructure and the established level of bonding between aggregate and paste, as well as the effect
of the rock’s microstructure and its own resistivity.
In terms of aggregates, the OPC and ternary blend concretes prepared with the micritic limestone
provided the highest resistivity at both testing ages, while the lowest resistivities were provided by the
granitic gneiss and the high absorption limestone in the OPC and ternary blend concretes, respectively.

37
This
pu
blic
atio
n is
availa
ble
free o
f charg
e fro
m: h
ttps://d
oi.o
rg/1
0.6
028
/NIS
T.T
N.1
963
These same two mixtures also produced the second lowest compressive strengths at the ages of 28 d
and 91 d, with only the concretes based on siliceous gravel providing lower values. Weak, porous interfaces
should contribute to both reduced strengths and reduced resistivities as they can provide preferential
pathways for both crack propagation and electrical (ion) transport. The porous nature of the high absorption
limestone may have also contributed to the low resistivity measured for OPC and ternary blend concretes
prepared with it.
In practice, more important than the nominal surface resistivity values obtained in tests is the
classification of each mixture in terms of their susceptibility to chloride penetration, as presented in
AASHTO T358 [59]. Figure 18 shows that, at 28 d, all OPC mixtures, independent of the aggregate
employed, were classified as high penetrability mixtures, except for the micritic limestone mixture. At 91 d,
all OPC mixtures, except for the mixture based on granitic gneiss, exhibited a moderate chloride
penetrability.
Conversely, very few ternary mixtures are classified in the high penetrability range at 28 d: only
the diabase, high absorption limestone, granitic gneiss, and siliceous gravel mixtures. The other 7 mixtures
were in the moderate penetrability range. At 91 d, a much wider spread of penetrability classifications was
found, depending on the aggregate used: the high absorption limestone mixture was in the moderate range
but micritic limestone and marble mixtures were in the very low range, while the remaining 8 mixtures
were in the low range.
Figure 18. Electrical resistivity and qualitative chloride penetrability classification as per
AASHTO T358 [59]. Average CoV can be found in Table 11.
The measured electrical resistivities are plotted against the corresponding measured compressive
strengths in Figure 19. No overarching relationship is found between resistivity and strength in agreement
with previous results [20], and the relative standard errors are similar for the ternary blends (0.77 kΩ·cm
or 11.3 % at 28 d and 2.33 kΩ·cm or 13.5 % at 91 d) and the OPC mixtures (0.78 kΩ·cm or 14.5 % at 28 d
and 0.98 kΩ·cm or 12.8 % at 91 d).

38
This
pu
blic
atio
n is
availa
ble
free o
f charg
e fro
m: h
ttps://d
oi.o
rg/1
0.6
028
/NIS
T.T
N.1
963
Figure 19. Measured electrical resistivity vs. compressive strength for the OPC and ternary blend
concretes at ages of 28 d and 91 d. Average CoV can be found in Tables 9, 10, and 11.
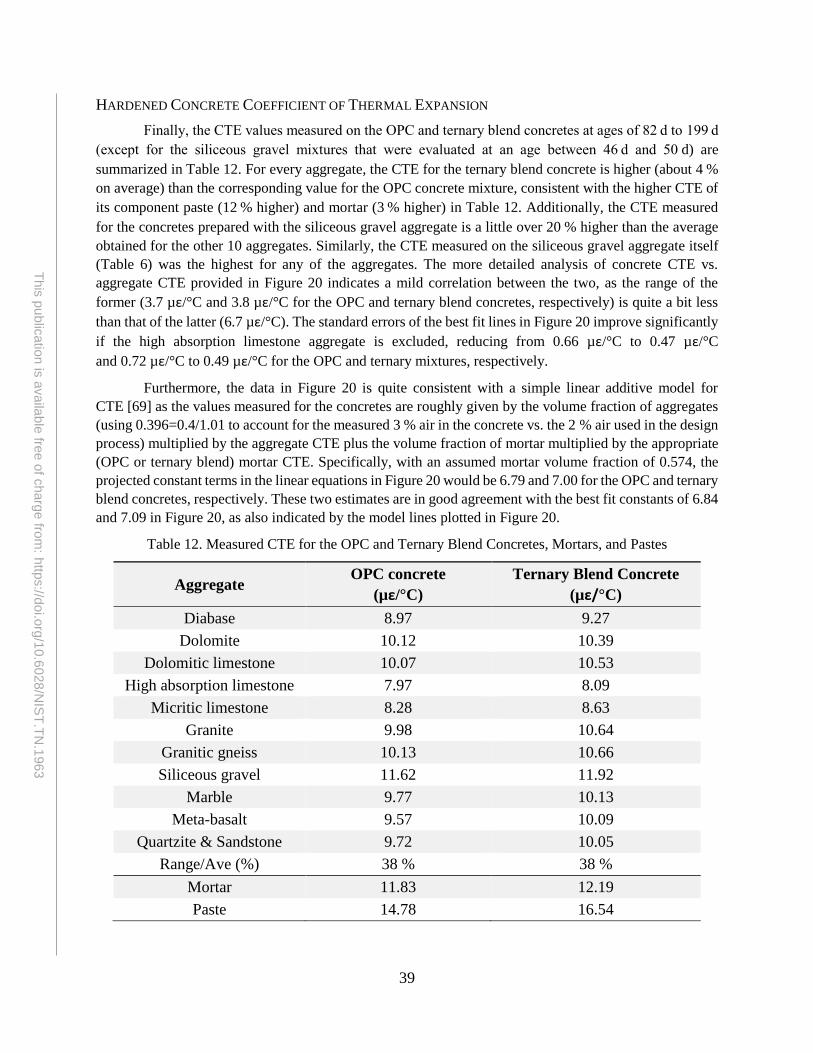
39
This
pu
blic
atio
n is
availa
ble
free o
f charg
e fro
m: h
ttps://d
oi.o
rg/1
0.6
028
/NIS
T.T
N.1
963
HARDENED CONCRETE COEFFICIENT OF THERMAL EXPANSION
Finally, the CTE values measured on the OPC and ternary blend concretes at ages of 82 d to 199 d
(except for the siliceous gravel mixtures that were evaluated at an age between 46 d and 50 d) are
summarized in Table 12. For every aggregate, the CTE for the ternary blend concrete is higher (about 4 %
on average) than the corresponding value for the OPC concrete mixture, consistent with the higher CTE of
its component paste (12 % higher) and mortar (3 % higher) in Table 12. Additionally, the CTE measured
for the concretes prepared with the siliceous gravel aggregate is a little over 20 % higher than the average
obtained for the other 10 aggregates. Similarly, the CTE measured on the siliceous gravel aggregate itself
(Table 6) was the highest for any of the aggregates. The more detailed analysis of concrete CTE vs.
aggregate CTE provided in Figure 20 indicates a mild correlation between the two, as the range of the
former (3.7 µε/°C and 3.8 µε/°C for the OPC and ternary blend concretes, respectively) is quite a bit less
than that of the latter (6.7 µε/°C). The standard errors of the best fit lines in Figure 20 improve significantly
if the high absorption limestone aggregate is excluded, reducing from 0.66 µε/°C to 0.47 µε/°C
and 0.72 µε/°C to 0.49 µε/°C for the OPC and ternary mixtures, respectively.
Furthermore, the data in Figure 20 is quite consistent with a simple linear additive model for
CTE [69] as the values measured for the concretes are roughly given by the volume fraction of aggregates
(using 0.396=0.4/1.01 to account for the measured 3 % air in the concrete vs. the 2 % air used in the design
process) multiplied by the aggregate CTE plus the volume fraction of mortar multiplied by the appropriate
(OPC or ternary blend) mortar CTE. Specifically, with an assumed mortar volume fraction of 0.574, the
projected constant terms in the linear equations in Figure 20 would be 6.79 and 7.00 for the OPC and ternary
blend concretes, respectively. These two estimates are in good agreement with the best fit constants of 6.84
and 7.09 in Figure 20, as also indicated by the model lines plotted in Figure 20.
Table 12. Measured CTE for the OPC and Ternary Blend Concretes, Mortars, and Pastes
Aggregate OPC concrete
(µε/°C)
Ternary Blend Concrete
(µε/°C)
Diabase 8.97 9.27
Dolomite 10.12 10.39
Dolomitic limestone 10.07 10.53
High absorption limestone 7.97 8.09
Micritic limestone 8.28 8.63
Granite 9.98 10.64
Granitic gneiss 10.13 10.66
Siliceous gravel 11.62 11.92
Marble 9.77 10.13
Meta-basalt 9.57 10.09
Quartzite & Sandstone 9.72 10.05
Range/Ave (%) 38 % 38 %
Mortar 11.83 12.19
Paste 14.78 16.54

40
This
pu
blic
atio
n is
availa
ble
free o
f charg
e fro
m: h
ttps://d
oi.o
rg/1
0.6
028
/NIS
T.T
N.1
963
Figure 20. Concrete CTE vs. aggregate CTE for the OPC and ternary blend concrete mixtures. Average
CoV can be found in Tables 6 and 12. Model lines correspond to a simple additive model, assuming
aggregate and mortar volume fractions of 0.39 and 0.58. Dashed lines indicate best linear fits.
When considering the limited CTE data available for six of the rock cores (Table 7), there is a good
correlation between the concrete CTE and the rock core CTE (Figure 21), with quite low standard errors.
One of the reasons for the better correlation may have been due to the much lower CoV of the rock core
CTE tests than the ones performed on the extracted aggregates. Once again, the coefficients determined for
the linear fits are consistent with a simple additive model relating concrete CTE to those of the component
materials (aggregate and mortar). Another important aspect to point out is that the models in Figures 20
and 21 would be applicable only to mixtures using the same materials and volumetric proportions as in this
study, but are important to show the clear role of the aggregate on the concrete CTE for a specific mixture
design.
Aggregate CTE (µε/°C)

41
This
pu
blic
atio
n is
availa
ble
free o
f charg
e fro
m: h
ttps://d
oi.o
rg/1
0.6
028
/NIS
T.T
N.1
963
Figure 21. Concrete CTE vs. rock core CTE for the OPC and ternary blend concrete mixtures. Average
CoV can be found in Tables 7 and 12.
Rock core CTE (µε/°C)

42
This
pu
blic
atio
n is
availa
ble
free o
f charg
e fro
m: h
ttps://d
oi.o
rg/1
0.6
028
/NIS
T.T
N.1
963
CONCRETE MECHANICAL PROPERTIES IN RELATION TO AGGREGATE
CHARACTERISTICS
It was envisioned that some reasonable correlations would be found between measured aggregate
characteristics and concrete mechanical properties for the concretes prepared with the different source
aggregates, providing a better understanding of which aggregate characteristics have an impact on the
concrete mechanical performance and, in particular, on the bond between aggregate and paste. For example,
the bond between ITZ and aggregate is, for normal strength concretes, the weakest link of the composite
and where failure usually initiates but, on the other hand, proper bond is essential for a composite,
heterogeneous material, such as concrete, to act in a monolithic manner [24]. This bond is affected by
aggregate properties, such as texture (Figure 8), modulus of elasticity, CTE, porosity, absorption, and
possibly surface energy, as well as by matrix (and ITZ) properties, such as modulus of elasticity, possible
chemical affinity/reactivity with the aggregate, porosity, strength and preferential alignment of hydration
products at the interface with the aggregate [2,12,22-25]. As an example, significant differences in the
measured bond strength in mixtures with different aggregates were observed by Tasong et al. [3-5] which
they attributed to the roughness of the aggregate surface (texture), as well as the physical-chemical bond
between the hydrating cement paste and the aggregate, due to chemical reactions.
A physical bond or mechanical adhesion is provided, for example, by the shape characteristics of
the aggregate through a physical “lock and key” effect, redistribution of stresses and increased surface
area [17], and also by the surface texture and porosity that promote an interlock effect [18], but these
contributions depend on the applied stress magnitude [70].
Since CAAT combines shape and texture, it is interesting to examine the results in Table 5. If only
shape and texture played a role, the lowest compressive strengths should be found in the siliceous gravel
and high absorption limestone mixtures, while the highest strengths should be found with micritic limestone
and diabase. While siliceous gravel did indeed present the lowest strengths at all ages and for the two
different binders, high absorption limestone presented one of the highest strengths among the OPC
mixtures. In terms of high strengths, micritic limestone presented one of the highest strengths only in ternary
mixtures and diabase only in OPC mixtures after 28 d. So, clearly aggregate characteristics other than shape
and texture contribute to contribute to concrete performance.
Of course, adhesion is also influenced by chemical bonding and it has been previously proposed
that surface energy could be used as one means to assess this bonding [18,71-73]. Natural aggregates
contain active sites (chemical surface energy components) where sorption occurs, which are dependent on
the individual minerals at the surface. These sites are either non-polar or polar. Non-polar surfaces bond
via dispersion forces, the weakest of van der Waals’ three forces, while polar surfaces may also provide
bonding via dipole-dipole and hydrogen bonding interactions.
In this study, the non-polar surface energies of siliceous gravel, granitic gneiss, diabase, granite
and dolomite were lower than the values typically found in the literature [71-73]. Comparing the different
aggregates, siliceous gravel was significantly lower than the other 10 aggregates, indicating a lower affinity
to bond with paste through dispersion forces. Most of the other aggregates, except for the meta-basalt,
presented similar non-polar surface energies, while meta-basalt showed a much higher one. The non-polar
component of the carbonate aggregates (marble, dolomite, and limestones) varied from 32.5 mJ/m2
to 38.3 mJ/m2, so considering the CoV of the measurement, they should behave differently in terms of
dispersion forces.

43
This
pu
blic
atio
n is
availa
ble
free o
f charg
e fro
m: h
ttps://d
oi.o
rg/1
0.6
028
/NIS
T.T
N.1
963
Besides the non-polar sites, there may also be polar sites that react with the paste, forming a stronger
bond. Some of these sites are pH dependent, such as the ones found in some silicates, clays, micas and
carbonates. Among the aggregates studied, the polar surface energy varied much more than the non-polar
one, from 2.5 mJ/m2, for micritic limestone, to 27.3 mJ/m2, for quartzite & sandstone. Dolomitic limestone
also presented a very low polar surface energy (3.3 mJ/m2). Considering only the carbonate aggregates, the
polar component varied from 2.5 mJ/m2 to 13.3 mJ/m2. Among the limestones, micritic limestone and
dolomitic limestone presented similar values, while the high absorption limestone presented the highest.
For all 11 aggregates, the non-polar surface energy component was larger than the polar one. However,
since the non-polar one did not vary as much as the polar one amongst the aggregates (range/average in
Table 6), the latter is expected to be more important when comparing aggregates and their influence on
concrete performance.
Considering surface energy (total including non-polar and polar components), micritic and
dolomitic limestone, siliceous gravel, and marble would be expected to present the poorest mechanical
behavior among the aggregates, while meta-basalt and quartzite & sandstone the highest. Nevertheless, this
hypothesis was not strictly confirmed. While siliceous gravel mixtures underperformed the other mixtures
in all strength tests (compressive, splitting and flexural), micritic and dolomitic limestones, as well as
marble, performed very well and outperformed meta-basalt in most cases. Moreover, quartzite & sandstone
did not show the best mechanical behavior either. Surface energy only assesses the potential contribution
of (weak) van der Waals forces to bonding. If an actual chemical reaction is occurring between the
aggregates and the binder or if the binder reaction products are precipitating directly on the aggregate
surface, the potentially larger contribution of these two mechanisms to bonding will not be indicated by
surface energy measurements. This may help explain that while surface energy measurements have proven
useful for predicting performance of asphaltic (less reactive binder) concretes [18,70] and bonding of
asphalt-coated particles to cementitious materials [74,75], they did not provide useful predictions of
mechanical performance in the present study.
Thus, while it was envisioned that some reasonable correlations would be found between measured
aggregate characteristics and mechanical properties for the concretes prepared with the different source
aggregates, the complexity of the bonding between aggregate and paste generally precluded such
identification. Instead, few such correlations were found, the lack of which is exemplified by the plots in
Appendix B that show 28-d compressive strength plotted vs. individual aggregate characteristics, with little
if any correlation observed in nearly all cases (slopes near 0 in many cases). However, as shown in
Figure 22, when the siliceous gravel and meta-basalt data were omitted from the analysis, a reasonable
linear correlation was observed between the measured elastic modulus of the concrete (Econc) and that of
the corresponding coarse aggregate (Eagg), for modulus measurements conducted after either 28 d (standard
error of 3.6 GPa or 9.5 %) or 91 d (standard error of 2.9 GPa or 7.1 %) of curing. There are two data points
for each age and aggregate modulus in Figure 22, corresponding to the OPC and ternary blend mixtures,
with the elastic modulus of the OPC mixture generally exceeding that of the one based on the ternary blend
binder (by an average of 9 % at 28 d, but only 4 % at 91 d). In comparison, on average, the 28-d compressive
strengths of the OPC mixtures were 29 % higher than those of the corresponding ternary blend mixtures
(Figure 14). The coefficients for the best linear fits in Figure 22 can again be compared to those from a
simple linear additive model for concrete modulus. However, the agreement between the best linear fit and
the additive model would not be as good as in the case of CTE, as the slopes of 0.358 and 0.344 are a bit
lower than the coarse aggregate fraction and the constant terms of 14.80 and 17.49 are also lower than the
mortar fraction (0.58) times the measured mortar moduli of about 27 GPa and 31 GPa at 28 d and 91 d,
respectively.
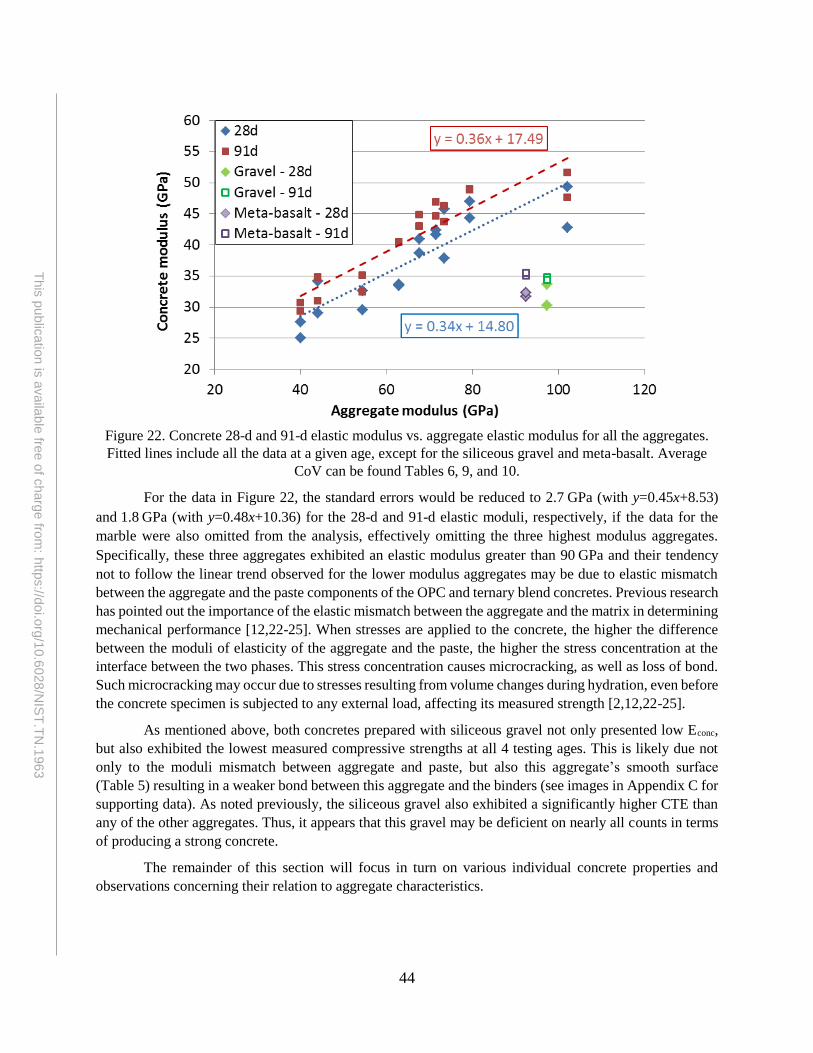
44
This
pu
blic
atio
n is
availa
ble
free o
f charg
e fro
m: h
ttps://d
oi.o
rg/1
0.6
028
/NIS
T.T
N.1
963
Figure 22. Concrete 28-d and 91-d elastic modulus vs. aggregate elastic modulus for all the aggregates.
Fitted lines include all the data at a given age, except for the siliceous gravel and meta-basalt. Average
CoV can be found Tables 6, 9, and 10.
For the data in Figure 22, the standard errors would be reduced to 2.7 GPa (with y=0.45x+8.53)
and 1.8 GPa (with y=0.48x+10.36) for the 28-d and 91-d elastic moduli, respectively, if the data for the
marble were also omitted from the analysis, effectively omitting the three highest modulus aggregates.
Specifically, these three aggregates exhibited an elastic modulus greater than 90 GPa and their tendency
not to follow the linear trend observed for the lower modulus aggregates may be due to elastic mismatch
between the aggregate and the paste components of the OPC and ternary blend concretes. Previous research
has pointed out the importance of the elastic mismatch between the aggregate and the matrix in determining
mechanical performance [12,22-25]. When stresses are applied to the concrete, the higher the difference
between the moduli of elasticity of the aggregate and the paste, the higher the stress concentration at the
interface between the two phases. This stress concentration causes microcracking, as well as loss of bond.
Such microcracking may occur due to stresses resulting from volume changes during hydration, even before
the concrete specimen is subjected to any external load, affecting its measured strength [2,12,22-25].
As mentioned above, both concretes prepared with siliceous gravel not only presented low Econc,
but also exhibited the lowest measured compressive strengths at all 4 testing ages. This is likely due not
only to the moduli mismatch between aggregate and paste, but also this aggregate’s smooth surface
(Table 5) resulting in a weaker bond between this aggregate and the binders (see images in Appendix C for
supporting data). As noted previously, the siliceous gravel also exhibited a significantly higher CTE than
any of the other aggregates. Thus, it appears that this gravel may be deficient on nearly all counts in terms
of producing a strong concrete.
The remainder of this section will focus in turn on various individual concrete properties and
observations concerning their relation to aggregate characteristics.
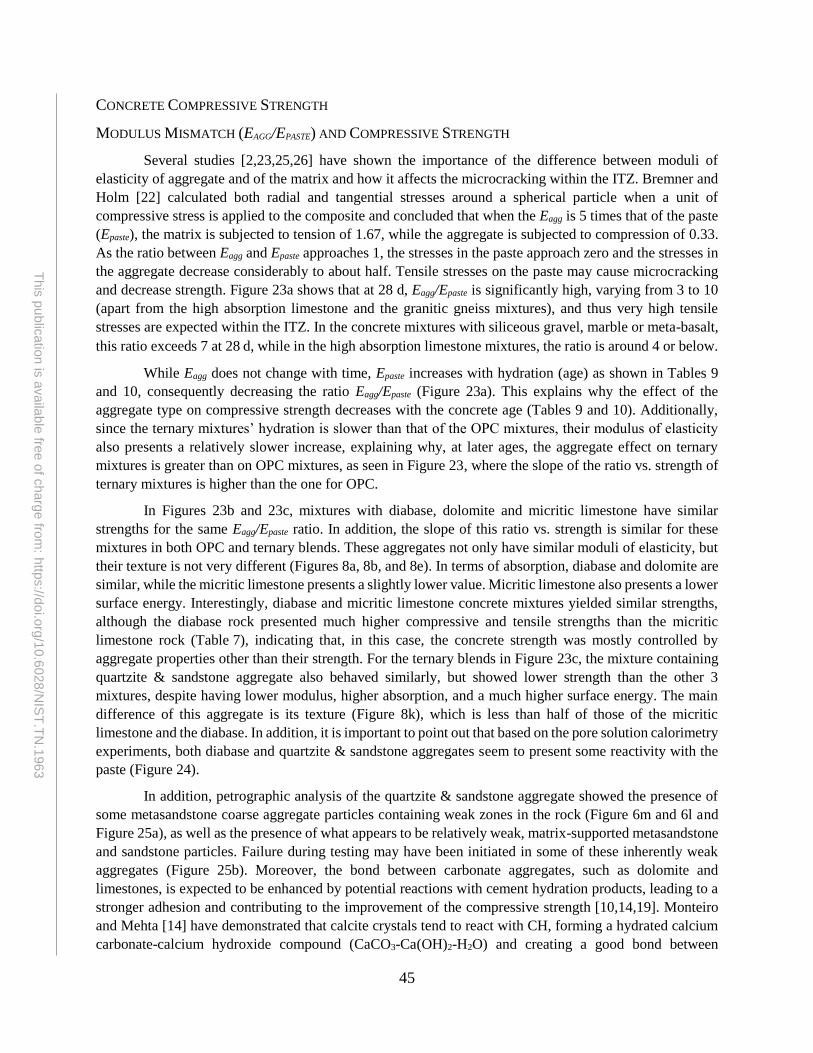
45
This
pu
blic
atio
n is
availa
ble
free o
f charg
e fro
m: h
ttps://d
oi.o
rg/1
0.6
028
/NIS
T.T
N.1
963
CONCRETE COMPRESSIVE STRENGTH
MODULUS MISMATCH (EAGG/EPASTE) AND COMPRESSIVE STRENGTH
Several studies [2,23,25,26] have shown the importance of the difference between moduli of
elasticity of aggregate and of the matrix and how it affects the microcracking within the ITZ. Bremner and
Holm [22] calculated both radial and tangential stresses around a spherical particle when a unit of
compressive stress is applied to the composite and concluded that when the Eagg is 5 times that of the paste
(Epaste), the matrix is subjected to tension of 1.67, while the aggregate is subjected to compression of 0.33.
As the ratio between Eagg and Epaste approaches 1, the stresses in the paste approach zero and the stresses in
the aggregate decrease considerably to about half. Tensile stresses on the paste may cause microcracking
and decrease strength. Figure 23a shows that at 28 d, Eagg/Epaste is significantly high, varying from 3 to 10
(apart from the high absorption limestone and the granitic gneiss mixtures), and thus very high tensile
stresses are expected within the ITZ. In the concrete mixtures with siliceous gravel, marble or meta-basalt,
this ratio exceeds 7 at 28 d, while in the high absorption limestone mixtures, the ratio is around 4 or below.
While Eagg does not change with time, Epaste increases with hydration (age) as shown in Tables 9
and 10, consequently decreasing the ratio Eagg/Epaste (Figure 23a). This explains why the effect of the
aggregate type on compressive strength decreases with the concrete age (Tables 9 and 10). Additionally,
since the ternary mixtures’ hydration is slower than that of the OPC mixtures, their modulus of elasticity
also presents a relatively slower increase, explaining why, at later ages, the aggregate effect on ternary
mixtures is greater than on OPC mixtures, as seen in Figure 23, where the slope of the ratio vs. strength of
ternary mixtures is higher than the one for OPC.
In Figures 23b and 23c, mixtures with diabase, dolomite and micritic limestone have similar
strengths for the same Eagg/Epaste ratio. In addition, the slope of this ratio vs. strength is similar for these
mixtures in both OPC and ternary blends. These aggregates not only have similar moduli of elasticity, but
their texture is not very different (Figures 8a, 8b, and 8e). In terms of absorption, diabase and dolomite are
similar, while the micritic limestone presents a slightly lower value. Micritic limestone also presents a lower
surface energy. Interestingly, diabase and micritic limestone concrete mixtures yielded similar strengths,
although the diabase rock presented much higher compressive and tensile strengths than the micritic
limestone rock (Table 7), indicating that, in this case, the concrete strength was mostly controlled by
aggregate properties other than their strength. For the ternary blends in Figure 23c, the mixture containing
quartzite & sandstone aggregate also behaved similarly, but showed lower strength than the other 3
mixtures, despite having lower modulus, higher absorption, and a much higher surface energy. The main
difference of this aggregate is its texture (Figure 8k), which is less than half of those of the micritic
limestone and the diabase. In addition, it is important to point out that based on the pore solution calorimetry
experiments, both diabase and quartzite & sandstone aggregates seem to present some reactivity with the
paste (Figure 24).
In addition, petrographic analysis of the quartzite & sandstone aggregate showed the presence of
some metasandstone coarse aggregate particles containing weak zones in the rock (Figure 6m and 6l and
Figure 25a), as well as the presence of what appears to be relatively weak, matrix-supported metasandstone
and sandstone particles. Failure during testing may have been initiated in some of these inherently weak
aggregates (Figure 25b). Moreover, the bond between carbonate aggregates, such as dolomite and
limestones, is expected to be enhanced by potential reactions with cement hydration products, leading to a
stronger adhesion and contributing to the improvement of the compressive strength [10,14,19]. Monteiro
and Mehta [14] have demonstrated that calcite crystals tend to react with CH, forming a hydrated calcium
carbonate-calcium hydroxide compound (CaCO3-Ca(OH)2-H2O) and creating a good bond between
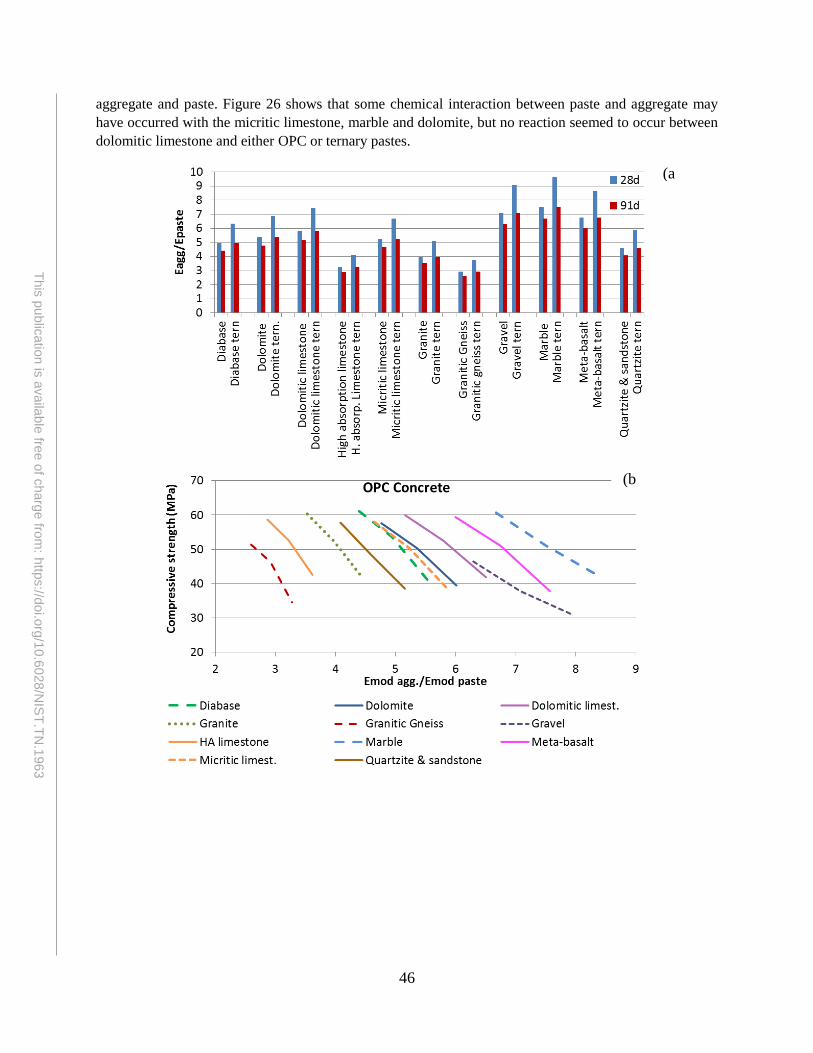
46
This
pu
blic
atio
n is
availa
ble
free o
f charg
e fro
m: h
ttps://d
oi.o
rg/1
0.6
028
/NIS
T.T
N.1
963
aggregate and paste. Figure 26 shows that some chemical interaction between paste and aggregate may
have occurred with the micritic limestone, marble and dolomite, but no reaction seemed to occur between
dolomitic limestone and either OPC or ternary pastes.
(a
)
(b
)

47
This
pu
blic
atio
n is
availa
ble
free o
f charg
e fro
m: h
ttps://d
oi.o
rg/1
0.6
028
/NIS
T.T
N.1
963
Figure 23. (a) Ratio of aggregate and paste moduli of elasticity at 28 d and 91 d, (b) effect of Eagg/Epaste on
compressive strength of OPC mixtures at 7 d, 28 d, and 91 d and (c) effect of Eagg/Epaste on compressive
strength of ternary blend mixtures at 7 d, 28 d, and 91 d. Average CoV can be found in Tables 9 and 10.
Figure 24. Cumulative heat over time of diabase and quartzite & sandstone aggregates in OPC pore
solution. Information on uncertainty is provided at the bottom of page 4.
(c
)
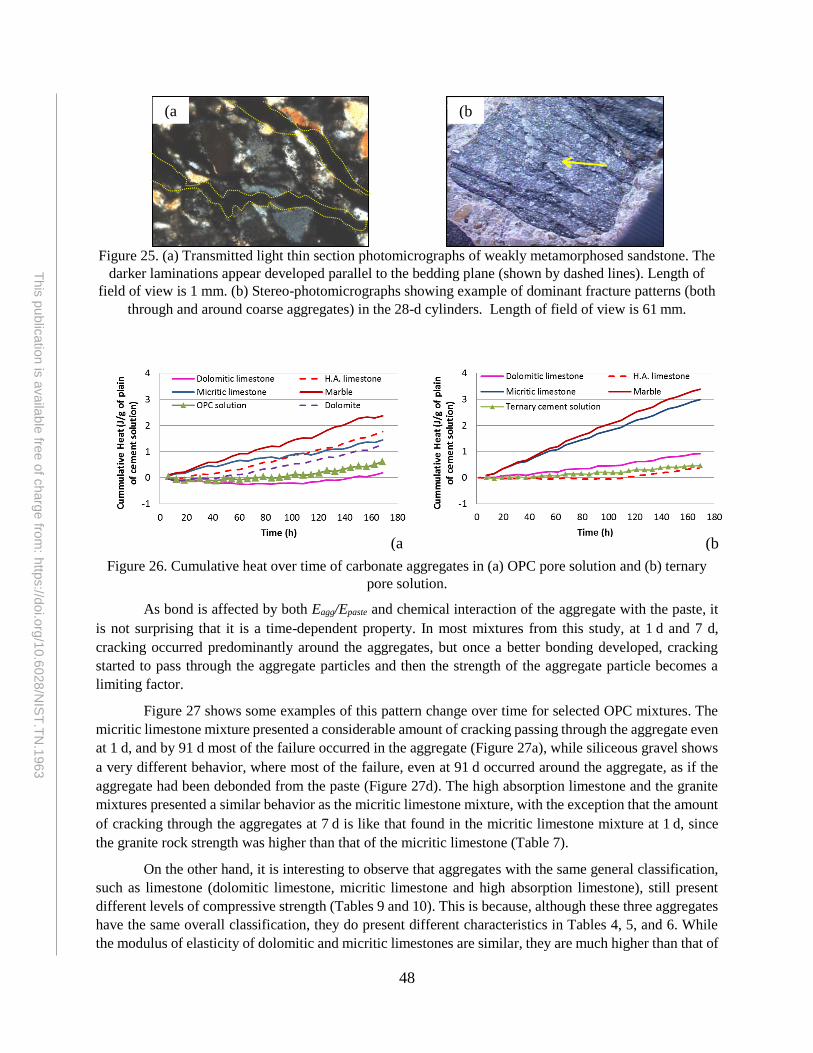
48
This
pu
blic
atio
n is
availa
ble
free o
f charg
e fro
m: h
ttps://d
oi.o
rg/1
0.6
028
/NIS
T.T
N.1
963
Figure 25. (a) Transmitted light thin section photomicrographs of weakly metamorphosed sandstone. The
darker laminations appear developed parallel to the bedding plane (shown by dashed lines). Length of
field of view is 1 mm. (b) Stereo-photomicrographs showing example of dominant fracture patterns (both
through and around coarse aggregates) in the 28-d cylinders. Length of field of view is 61 mm.
Figure 26. Cumulative heat over time of carbonate aggregates in (a) OPC pore solution and (b) ternary
pore solution.
As bond is affected by both Eagg/Epaste and chemical interaction of the aggregate with the paste, it
is not surprising that it is a time-dependent property. In most mixtures from this study, at 1 d and 7 d,
cracking occurred predominantly around the aggregates, but once a better bonding developed, cracking
started to pass through the aggregate particles and then the strength of the aggregate particle becomes a
limiting factor.
Figure 27 shows some examples of this pattern change over time for selected OPC mixtures. The
micritic limestone mixture presented a considerable amount of cracking passing through the aggregate even
at 1 d, and by 91 d most of the failure occurred in the aggregate (Figure 27a), while siliceous gravel shows
a very different behavior, where most of the failure, even at 91 d occurred around the aggregate, as if the
aggregate had been debonded from the paste (Figure 27d). The high absorption limestone and the granite
mixtures presented a similar behavior as the micritic limestone mixture, with the exception that the amount
of cracking through the aggregates at 7 d is like that found in the micritic limestone mixture at 1 d, since
the granite rock strength was higher than that of the micritic limestone (Table 7).
On the other hand, it is interesting to observe that aggregates with the same general classification,
such as limestone (dolomitic limestone, micritic limestone and high absorption limestone), still present
different levels of compressive strength (Tables 9 and 10). This is because, although these three aggregates
have the same overall classification, they do present different characteristics in Tables 4, 5, and 6. While
the modulus of elasticity of dolomitic and micritic limestones are similar, they are much higher than that of
(a
)
(b
)
(b
)
(a
)

49
This
pu
blic
atio
n is
availa
ble
free o
f charg
e fro
m: h
ttps://d
oi.o
rg/1
0.6
028
/NIS
T.T
N.1
963
the high absorption limestone. In terms of the angularity index, high absorption limestone presented the
lowest value, followed by micritic limestone, while dolomitic limestone showed the highest index of all
three aggregates. High absorption limestone presented a higher polar surface energy, and is thus expected
to have more affinity to interact with the paste via van der Waals forces. On the other hand, in terms of
texture index, while the high absorption limestone remained the lowest, the highest index was found in the
micritic limestone. In addition, the absorption of dolomitic limestone was significantly higher than that of
the micritic limestone.
The high absorption limestone presented one of the highest strengths among all mixtures, but only
when OPC was used, even though this aggregate is not expected to have high strength (unfortunately, cores
were not available to measure its strength). On the other hand, when a ternary blend was used, the same
aggregate presented one of the lowest strengths. The difference in behavior due to the cementitious
materials may have been because the improved bond between the high absorption limestone and the paste
is a result of the chemical interaction between the calcite from the aggregate and the CH from the paste [14].
Aggregates in this study presented different reactivity for OPC and ternary pore solution (Figure 26). Figure
26b shows no reaction between high absorption limestone and the ternary pore solution, while Figure 26a
shows that high absorption limestone reacted well with the OPC solution, which is expected to have higher
amounts of CH than the ternary solution. The thin section photomicrographs of the OPC tested specimens
(Figure 28c and 28e) show a high quality, dense ITZ for the OPC mixture (see also Figure 60 in Appendix
C). At 1 d (Figure 28a), only local cracks/gaps around the aggregate can be found. In contrast, thin section
photomicrographs of ternary blend tested specimens (Figures 28b, 28d, and 28f) show much more porous,
variable quality and less dense ITZ (see also Figure 62 in Appendix C). Large gaps between aggregate and
paste were found at all ages, but they became narrower and more discontinuous with time. Even at 91 d,
cracks/gaps around the aggregate can still be observed (Figure 28f). The ternary blend bond with this
specific aggregate may have been adversely affected for at least three reasons:
1. A previous study [76] using the same materials showed that ternary blends had much less CH
available to react with the aggregates than OPC mixtures (in that study on pastes with w/c = 0.35,
CH was quantified as 18.7 % and 26.0 % at 7 d for the ternary blend and OPC, respectively).
2. The kinetics of such reaction depends on the surface area of the carbonate and the diffusion paths
for other species, such as alumina [77]. Thus, in the ternary mixture, CH is expected to react
preferentially with the much higher surface area fine limestone and the reaction with the coarse
aggregate may be reduced, if not eliminated.
3. Adhesion between aggregate and paste depends not only on the aggregate surface energy, but also
on the interfacial energy between paste and aggregate and the affinity between them.
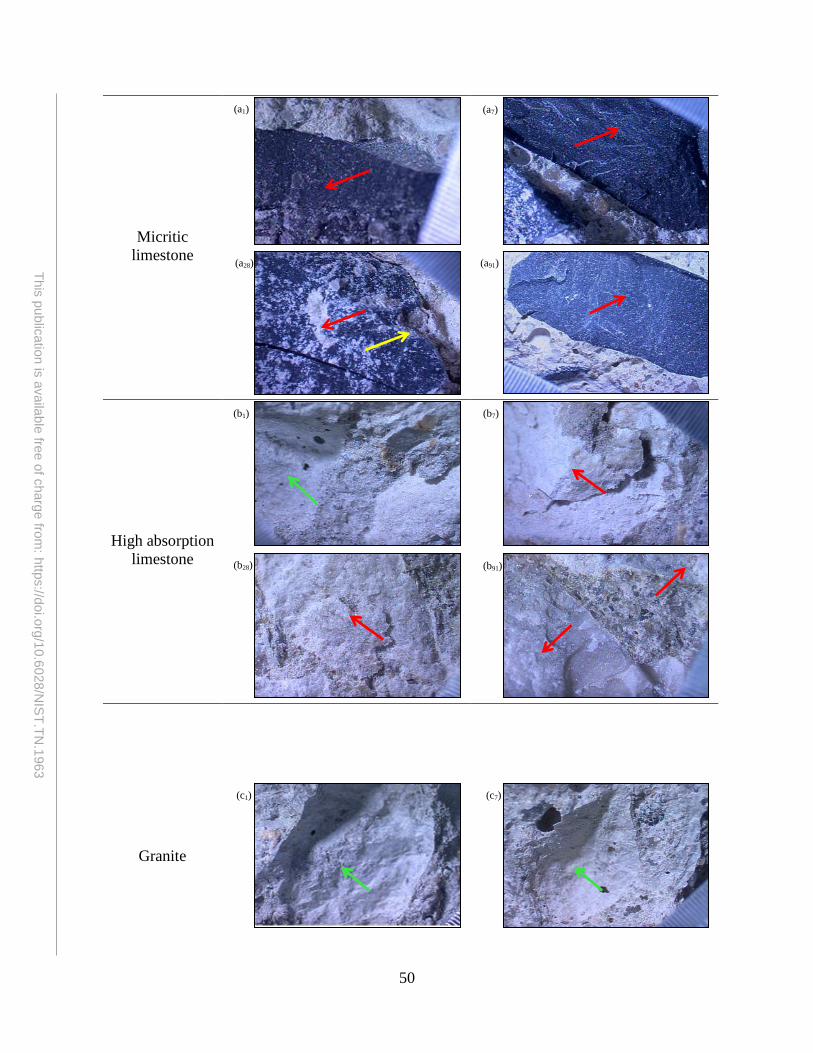
50
This
pu
blic
atio
n is
availa
ble
free o
f charg
e fro
m: h
ttps://d
oi.o
rg/1
0.6
028
/NIS
T.T
N.1
963
Micritic
limestone
High absorption
limestone
Granite
(a1) (a7)
(a28) (a91)
(b91) (b28)
(b1) (b7)
(c1) (c7)

51
This
pu
blic
atio
n is
availa
ble
free o
f charg
e fro
m: h
ttps://d
oi.o
rg/1
0.6
028
/NIS
T.T
N.1
963
Siliceous gravel
Figure 27. Stereo-photomicrographs showing examples of dominant fracture patterns, after compressive
strength testing. Yellow arrows indicate fracture around aggregate, green indicate socket of aggregate
(aggregate was completely detached from paste) and red indicate fracture through the aggregate. Scale
shown at the corner is in 0.25 mm increments. Underscore values indicate testing ages of 1 d, 7 d, 28 d, or
91 d of mixtures containing: (a) micritic limestone, (b) high absorption limestone, (c) granite and (d)
siliceous gravel.
The dolomitic limestone mixtures had one of the highest strengths among all mixtures (including
OPC, ternary blends and all aggregates), even though isothermal calorimetry up to 7 d did not show any
signs of chemical reaction between aggregate and paste (Figure 26). Figures 52 and 54 in Appendix C show
a high quality, dense ITZ at the coarse aggregate surface, for both OPC and ternary mixtures. This was
confirmed by stereomicroscopic examination which showed that, at later ages, failure in the dolomitic
limestone mixtures occurred mostly through aggregates, with evidence of good bond between paste and
aggregates (Figure 29a).
The micritic limestone OPC mixture showed a lower compressive strength than the dolomitic
limestone one at all ages, despite showing some evidence of chemical reaction with paste (Figure 26),
whereas when a ternary binder was used, the mixtures with these two aggregates presented comparable
strengths. In the micritic limestone, especially in the OPC mixture, where the binder strength may have
surpassed the aggregate strength, it was observed that failure occurred through the aggregate (Figures 29b
and 29c), in areas of relatively weak non-durable argillaceous dolomitic limestone particles locally
containing relatively thin dark laminations (Figure 29d). On the other hand, in the ternary blend, the strength
of the binder was not as high as for the OPC concrete, so the micritic limestone mixture could reach a
(d1) (d7)
(d91) (d28)
(c28) (c91)

52
This
pu
blic
atio
n is
availa
ble
free o
f charg
e fro
m: h
ttps://d
oi.o
rg/1
0.6
028
/NIS
T.T
N.1
963
similar strength as the dolomitic limestone mixture. From this analysis, it is evident that a general aggregate
description is insufficiently precise to predict the mechanical behavior of the concrete, even when a dense
ITZ is observed microscopically.
Figure 28. Thin section photomicrographs showing of high absorption limestone concrete samples tested
at different ages (a) OPC mixture tested at 1 d. Locally discontinuous cracks/gaps at the ITZ (b) ternary
mixture tested at 1 d. Extensive areas with gaps between aggregate and paste, (c) OPC mixture tested at
28 d. Locally discontinuous cracks/gaps at the ITZ (d) ternary mixture tested at 28 d. Gaps/cracks at the
ITZ, (e) OPC mixture tested at 91 d. Good bond between aggregate and paste, (f) ternary mixture tested at
91 d. Gaps/cracks still present at ITZ. Gaps/Cracks at ITZ are circled in yellow or indicated by arrows.
A previous study [23] has shown that mixtures with granite aggregate presented a significantly
lower compressive strength than mixtures with limestone or diabase, attributed to the low strength of the
granite. However, in the present study, the granite OPC mixture had a compressive strength comparable to
those of the diabase and dolomitic and high absorption limestone mixtures (Table 9). In contrast, the granite
ternary mixture presented a much lower compressive strength than the dolomitic and micritic limestones
mixtures, even though the granite aggregate had a lower modulus of elasticity, higher surface energy, and
lower texture index than the other two aggregates. The diabase ternary mixture also presented a much lower
strength than the dolomitic and micritic limestones mixtures, even though the diabase and the granite rocks
had a higher strength than the micritic limestone (Table 7). Stereomicroscope observation showed a good
bond between granite and the OPC matrix with through the aggregate and some around the aggregate
failures (Figure 30a), while the granite ternary mixture failed mostly due to lack of bond (Figures 30b, 30c,
and 30d). This confirms that the rock strength may not always be the limiting aggregate property for
concrete strength. If the aggregate strength were the aggregate property governing the concrete strength,
Coarse Aggregate
Coarse Aggregate
Coarse Aggregate
Coarse Aggregate
Coarse Aggregate
Coarse Aggregate
Mortar
Mortar
Mortar Mortar
Mortar
Mortar
(a) (b)
(c) (d)
(e) (f)
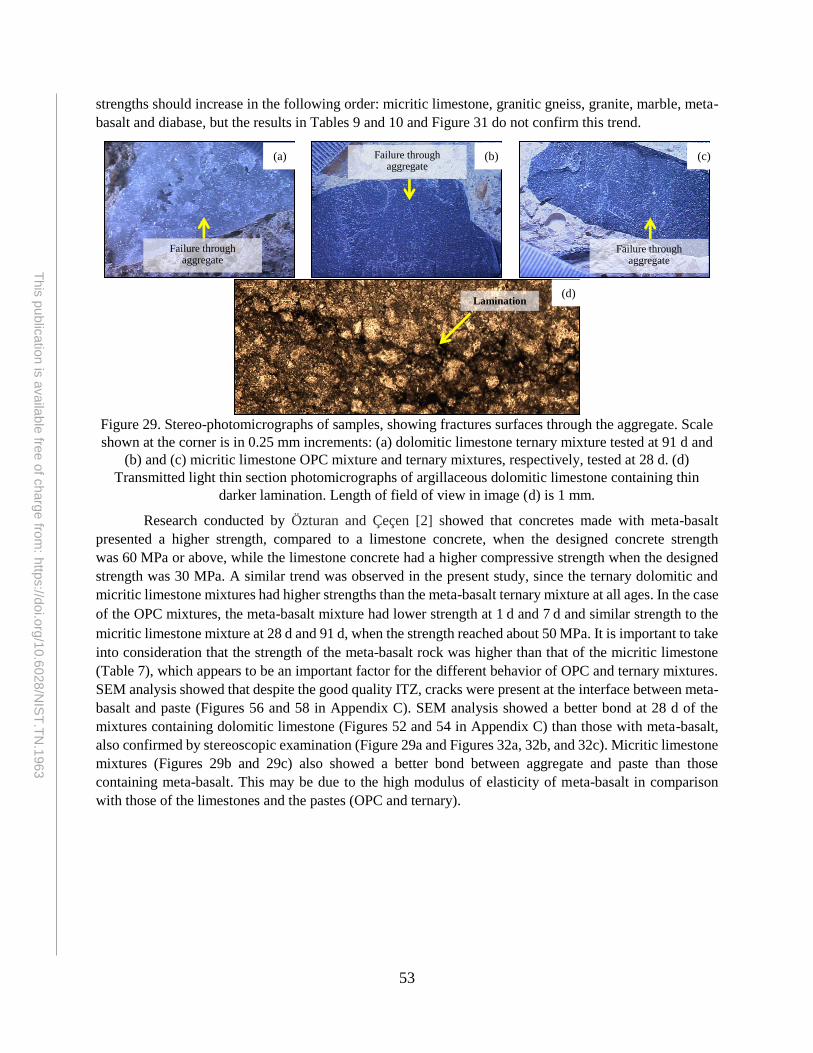
53
This
pu
blic
atio
n is
availa
ble
free o
f charg
e fro
m: h
ttps://d
oi.o
rg/1
0.6
028
/NIS
T.T
N.1
963
strengths should increase in the following order: micritic limestone, granitic gneiss, granite, marble, meta-
basalt and diabase, but the results in Tables 9 and 10 and Figure 31 do not confirm this trend.
Figure 29. Stereo-photomicrographs of samples, showing fractures surfaces through the aggregate. Scale
shown at the corner is in 0.25 mm increments: (a) dolomitic limestone ternary mixture tested at 91 d and
(b) and (c) micritic limestone OPC mixture and ternary mixtures, respectively, tested at 28 d. (d)
Transmitted light thin section photomicrographs of argillaceous dolomitic limestone containing thin
darker lamination. Length of field of view in image (d) is 1 mm.
Research conducted by Özturan and Çeçen [2] showed that concretes made with meta-basalt
presented a higher strength, compared to a limestone concrete, when the designed concrete strength
was 60 MPa or above, while the limestone concrete had a higher compressive strength when the designed
strength was 30 MPa. A similar trend was observed in the present study, since the ternary dolomitic and
micritic limestone mixtures had higher strengths than the meta-basalt ternary mixture at all ages. In the case
of the OPC mixtures, the meta-basalt mixture had lower strength at 1 d and 7 d and similar strength to the
micritic limestone mixture at 28 d and 91 d, when the strength reached about 50 MPa. It is important to take
into consideration that the strength of the meta-basalt rock was higher than that of the micritic limestone
(Table 7), which appears to be an important factor for the different behavior of OPC and ternary mixtures.
SEM analysis showed that despite the good quality ITZ, cracks were present at the interface between meta-
basalt and paste (Figures 56 and 58 in Appendix C). SEM analysis showed a better bond at 28 d of the
mixtures containing dolomitic limestone (Figures 52 and 54 in Appendix C) than those with meta-basalt,
also confirmed by stereoscopic examination (Figure 29a and Figures 32a, 32b, and 32c). Micritic limestone
mixtures (Figures 29b and 29c) also showed a better bond between aggregate and paste than those
containing meta-basalt. This may be due to the high modulus of elasticity of meta-basalt in comparison
with those of the limestones and the pastes (OPC and ternary).
Lamination
Failure through aggregate
Failure through aggregate
Failure through aggregate
(a) (b) (c)
(d)
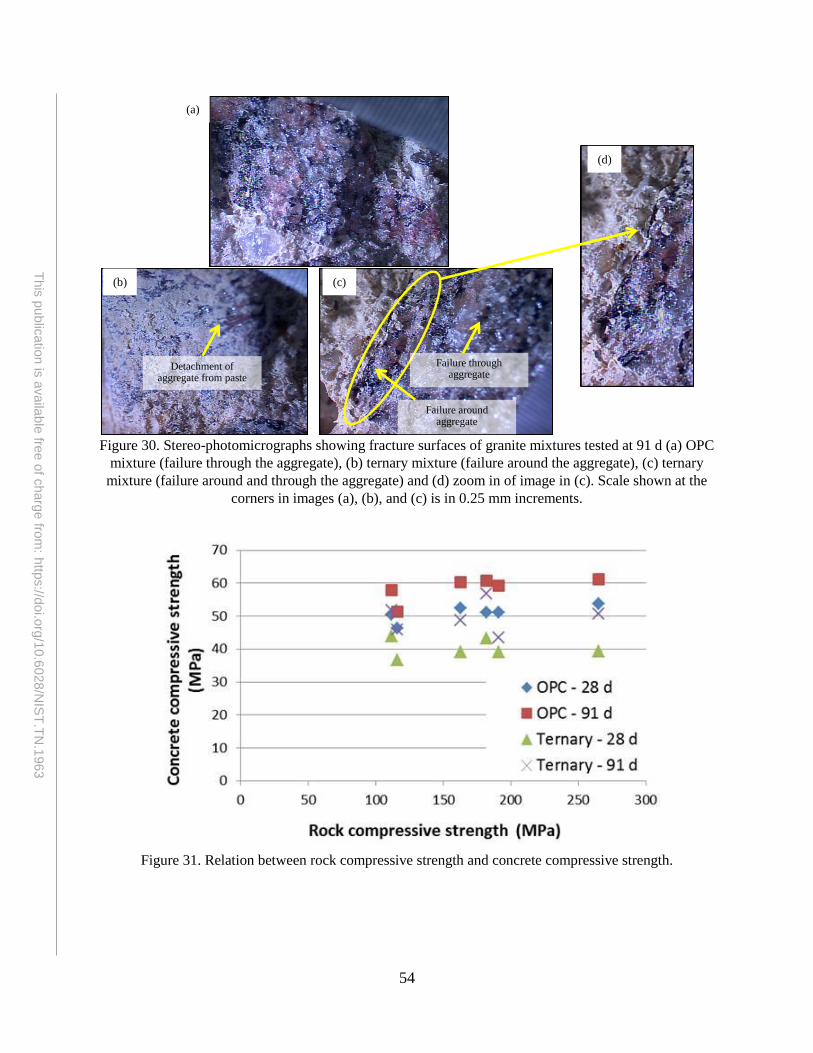
54
This
pu
blic
atio
n is
availa
ble
free o
f charg
e fro
m: h
ttps://d
oi.o
rg/1
0.6
028
/NIS
T.T
N.1
963
Figure 30. Stereo-photomicrographs showing fracture surfaces of granite mixtures tested at 91 d (a) OPC
mixture (failure through the aggregate), (b) ternary mixture (failure around the aggregate), (c) ternary
mixture (failure around and through the aggregate) and (d) zoom in of image in (c). Scale shown at the
corners in images (a), (b), and (c) is in 0.25 mm increments.
Figure 31. Relation between rock compressive strength and concrete compressive strength.
(a)
(b) (c)
(d)
Detachment of aggregate from paste
Failure around aggregate
Failure through aggregate

55
This
pu
blic
atio
n is
availa
ble
free o
f charg
e fro
m: h
ttps://d
oi.o
rg/1
0.6
028
/NIS
T.T
N.1
963
Figure 32. Stereo-photomicrographs of samples tested at 91 d: (a) meta-basalt OPC mixture with failure
through the aggregate, (b) meta-basalt OPC mixture with failure around the aggregate and lack of bond
and (c) meta-basalt ternary mixture with failure around the aggregate and lack of bond. Scale shown at the
corner is in 0.25 mm increments.
Siliceous gravel mixtures always provided the lowest compressive strengths, attributable to the
deficient bond between aggregate and paste. No sign of chemical interaction between siliceous gravel and
paste was found (Figure 33). After strength testing, stereomicroscope observation of specimens showed
signs of lack of bond at all ages (Figure 27 d1, d7, d28, d91). In addition, SEM analyses of specimens tested
at 28 d indicated localized layers of CH at the aggregate surface and a porous ITZ (Figures 48 and 50 in
Appendix C), confirming this poor bond. This deficient bond was due to two main factors: siliceous gravel’s
high modulus of elasticity and CTE (Table 6) and low texture index, or smooth surface (Table 5 and
Figure 8h). This is agreement with other studies [2,19,23] in which gravel has also shown lower strengths
in comparison to other aggregate types.
Figure 33. Cumulative heat over time of siliceous gravel in OPC pore solution or ternary pore solution.
Low strengths were also noted in the granitic gneiss mixtures, but not due to a deficient bond, since
this aggregate has a low modulus of elasticity and a high texture index (Figure 8g), but more likely due to
the aggregate’s low strength (Table 7) and high CTE (Table 6). This was confirmed by the stereomicroscope
observation of the specimens after testing that showed failure through the aggregates (Figures 34a and 34b),
due to the granitic gneiss’ low strength attributed to the presence of weak planes, in the form of alternating
bands of micaceous minerals and feldspar and quartz (Figure 6h).
(a) (c) (b)

56
This
pu
blic
atio
n is
availa
ble
free o
f charg
e fro
m: h
ttps://d
oi.o
rg/1
0.6
028
/NIS
T.T
N.1
963
Figure 34. Stereo-photomicrographs of granitic gneiss samples tested at 91 d (a) OPC mixture and (b)
ternary mixture. Scale shown at the corner is in 0.25 mm increments.
(b) (a)

57
This
pu
blic
atio
n is
availa
ble
free o
f charg
e fro
m: h
ttps://d
oi.o
rg/1
0.6
028
/NIS
T.T
N.1
963
CTE MISMATCH (CTEAGG/CTEPASTE) AND COMPRESSIVE STRENGTH
While the modulus mismatch may, in some cases, play a predominant role in bonding (especially
in laboratory conditions where the concrete temperature gradients are low), the mismatch between the CTE
of the aggregate and that of the paste can affect bonding in the same way and therefore cannot be ignored.
Nevertheless, the relationship between aggregate CTE and concrete strength is not so simple to quantify.
Firstly, this is because aggregate characteristics, such as morphology of the rock, i.e. density of grains and
lamination, not only affect CTE of an aggregate, but also its modulus of elasticity and strength, which
ultimately also have an impact on concrete strength. Zunino et al. [9] proposed a model that quantifies the
stresses developed at the ITZ based on both the CTE and the modulus of elasticity mismatch. According to
this model, the higher the temperature gradient and the CTE mismatch, the higher the stresses and
consequently the risk of microcracking that would likely reduce measured strength as well.
In the current study, for the OPC mixtures, the difference between the CTE of aggregate and paste
ranged from about 3.5 µε/°C to 10.2 µε/°C at 7 d. However, between the time of concrete maximum
temperature (as measured by semi-adiabatic calorimetry and shown in Figure 11) and the time specimens
were placed in the water tank, this CTE mismatch is expected to be significantly higher than these estimates,
because the paste CTE around setting time can be up to twice that of the hardened material (Tables 9
and 10) [78]. On the other hand, the temperature gradients of these mixtures during the first 24 h varied
between 9 °C to 15 °C, which are considered relatively low, but could still potentially produce strains
registering several hundred microstrains (which of course could be significantly reduced by the high
creep/compliance of the young material). Because of this temperature gradient and the higher paste CTE,
as temperature rises from its initial value, stresses in the radial direction of the aggregate paste interface
will develop, while the paste strength is still very low, potentially leading to microcracks within the mortar
phase surrounding the coarse aggregate particles. Later when the concrete cools, the paste will shrink more
than the aggregates, again generating substantial stresses within the ITZ regions. Among the OPC mixtures,
the highest strains due to the temperature history were likely developed by the high absorption, diabase and
micritic limestone mixtures. On the other hand, these thermally induced strains were partially counteracted
by the lower mismatch between the Eagg and the Epaste values for these aggregates, in comparison to the other
mixtures, which may explain why their strength was not severely affected.

58
This
pu
blic
atio
n is
availa
ble
free o
f charg
e fro
m: h
ttps://d
oi.o
rg/1
0.6
028
/NIS
T.T
N.1
963
LINEAR MODELS FOR COMPRESSIVE STRENGTH
In developing models for the 28-d compressive strength, it should be kept in mind that the standard
errors for the OPC and ternary blend mixtures are 4.7 MPa and 4.5 MPa, respectively, if a model based on
a single (constant) value, e.g., the average measured compressive strength across all aggregate types, were
to be employed. For the OPC concrete mixtures, as shown in Figure 35, the “best” linear model for 28-d
compressive strength was found when the values were regressed against the measured CTEs of the
component aggregates. The standard error for this model is 3.4 MPa, which would decrease to 1.8 MPa if
the data to the far lower right (siliceous gravel aggregate data point) were excluded from the analysis. For
the ternary blends, the linear model included both aggregate absorption and CTE as variables, resulting in
the following equation to predict 28-d compressive strength for all 11 aggregates (see Figure 36):
σ(28-d, MPa) = 46.81 - 3.59*Absorption - 0.632*CTE (2)
where Absorption is given in percent and the CTE is given in µε/°C, with a standard error of 2.9 MPa. For
both types of concrete, aggregates with a higher CTE produce lower strengths. With relative standard errors
(standard error divided by average strength) of 6.8 % and 7.5 % for the OPC and ternary blend models,
respectively, both are moderately successful in predicting the resultant compressive strength of the concrete
from the measured characteristics of the coarse aggregates, as also seen by comparing their standard errors
to the value of about 4.5 MPa obtained by simply assuming the average compressive strength to be the
predicted response for all aggregate types. The presented models do offer some improvement in this regard,
but are still far from ideal.
Figure 35. 28-d compressive strength vs. CTE for the OPC concrete mixtures. Dotted blue line indicates
best linear fit for all the data. Dashed grey line indicates best linear fit when siliceous gravel data (lower
right point) is excluded from the analysis. Error bars indicate one standard deviation for two cylinders
broken from each mixture. CoV for CTE can be found in Testing section on page 8.
Model development has first focused on 28-d compressive strength as that is the benchmark
measure by which concrete is normally evaluated. As illustrated in Table 13, the other measured mechanical
properties of the OPC concretes were even less well described by aggregate characteristics such as CTE. In
most cases, minimal improvement over the default model of assuming a single (constant) value for the
measured property (e.g., equal to its average value) is obtained when including the aggregate CTE as an
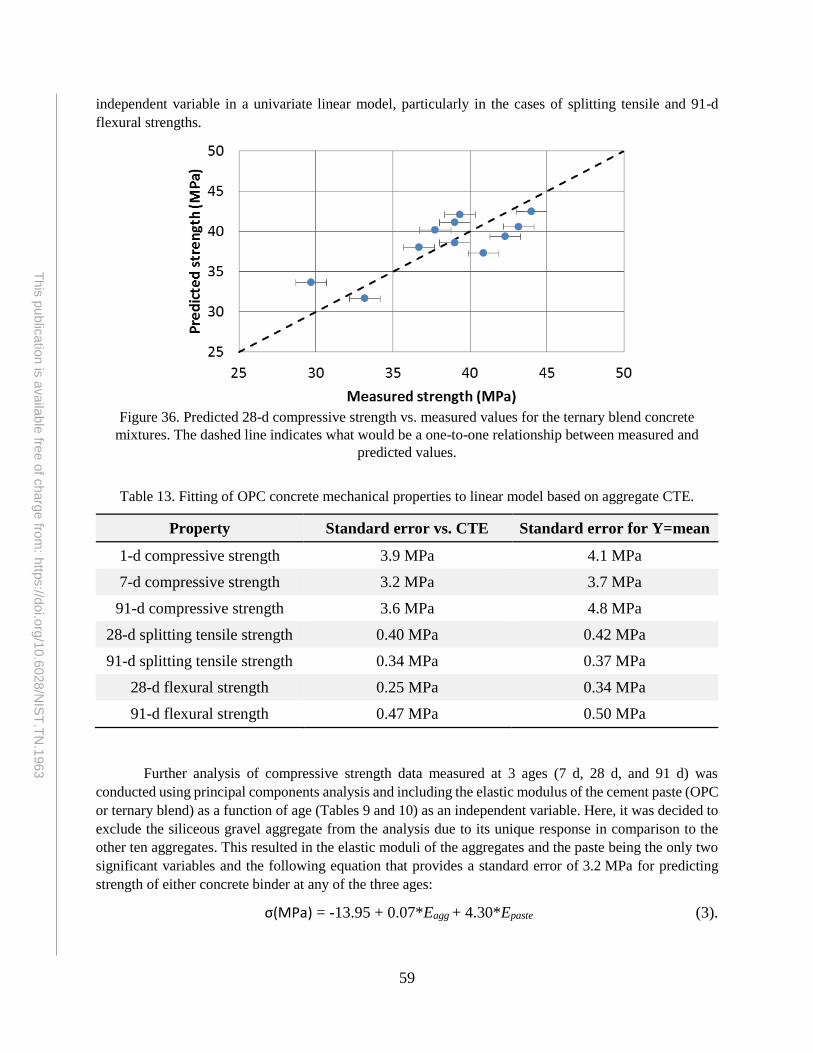
59
This
pu
blic
atio
n is
availa
ble
free o
f charg
e fro
m: h
ttps://d
oi.o
rg/1
0.6
028
/NIS
T.T
N.1
963
independent variable in a univariate linear model, particularly in the cases of splitting tensile and 91-d
flexural strengths.
Figure 36. Predicted 28-d compressive strength vs. measured values for the ternary blend concrete
mixtures. The dashed line indicates what would be a one-to-one relationship between measured and
predicted values.
Table 13. Fitting of OPC concrete mechanical properties to linear model based on aggregate CTE.
Property Standard error vs. CTE Standard error for Y=mean
1-d compressive strength 3.9 MPa 4.1 MPa
7-d compressive strength 3.2 MPa 3.7 MPa
91-d compressive strength 3.6 MPa 4.8 MPa
28-d splitting tensile strength 0.40 MPa 0.42 MPa
91-d splitting tensile strength 0.34 MPa 0.37 MPa
28-d flexural strength 0.25 MPa 0.34 MPa
91-d flexural strength 0.47 MPa 0.50 MPa
Further analysis of compressive strength data measured at 3 ages (7 d, 28 d, and 91 d) was
conducted using principal components analysis and including the elastic modulus of the cement paste (OPC
or ternary blend) as a function of age (Tables 9 and 10) as an independent variable. Here, it was decided to
exclude the siliceous gravel aggregate from the analysis due to its unique response in comparison to the
other ten aggregates. This resulted in the elastic moduli of the aggregates and the paste being the only two
significant variables and the following equation that provides a standard error of 3.2 MPa for predicting
strength of either concrete binder at any of the three ages:
σ(MPa) = -13.95 + 0.07*Eagg + 4.30*Epaste (3).

60
This
pu
blic
atio
n is
availa
ble
free o
f charg
e fro
m: h
ttps://d
oi.o
rg/1
0.6
028
/NIS
T.T
N.1
963
In equation (3), both linear coefficients are positive, indicating that an increase in either aggregate
modulus or paste modulus will increase measured compressive strength at the 3 ages, but significantly more
so (61x) for an increase in paste modulus. This implies that the mechanical properties of the paste
component of the concrete are paramount to its mechanical performance, with those of the aggregates being
a secondary, but nonetheless significant, contributor, particularly at a given age for a given binder, when
the value of Epaste is fixed.
61
This
pu
blic
atio
n is
availa
ble
free o
f charg
e fro
m: h
ttps://d
oi.o
rg/1
0.6
028
/NIS
T.T
N.1
963
CONCRETE SPLITTING TENSILE STRENGTH
The splitting tensile strengths of OPC mixtures varied from 3.7 MPa to 4.9 MPa at 28 d and
from 4.2 MPa to 5.2 MPa at 91 d (Table 9), with ranges equivalent to 27 % and 22 % of the average value
at each age. The splitting tensile strength of the ternary mixtures at 28 d ranged from 3.2 MPa to 4.9 MPa
and at 91 d, they varied from 3.4 MPa to 5.5 MPa (Table 10), with ranges equivalent to 44 % and 48 % of
the average value at each age, again confirming that the ternary mixtures are more sensitive to the aggregate
type. While the same level of aggregate effect was observed on compressive and splitting tensile strengths
of OPC at the same ages, the effect of aggregate type on the ternary mixtures’ splitting tensile strength was
more pronounced than on their compressive strength.
Stereoscopic examination showed that fracture patterns change depending on how the specimens
are loaded (compressive strength, splitting tensile strength, or flexural strength). Part of these differences
are due to the loading direction in relation to the casting direction [79]. In compressive strength testing, the
load is applied in the same direction as the specimen’s casting, while in splitting tensile strength testing,
the load is applied perpendicularly to the casting direction. In addition, the effect of the ITZ and the bond
between paste and aggregate depends on the loading mode. This was evidenced by the fact that the fracture
patterns (through aggregate or around the aggregates) changed with age and the type of cementitious
materials used (OPC or ternary blend binder), that is, the paste strength.
High absorption limestone presented one of the lowest splitting tensile strengths among the ternary
mixtures, just as with compressive strength. On the other hand, the strength of the OPC high absorption
limestone mixture was medium range and like that of the dolomitic limestone mixture. The splitting tensile
strength of the micritic limestone mixture followed the same trend as the compressive strength: the strength
of the OPC micritic limestone mixture was much lower than those of the high absorption and dolomitic
limestone mixtures, while that of the ternary micritic limestone mixture was higher than the ones with the
other two limestones. This suggests that the optimization of aggregate type will depend on the binder type
as well. Siliceous gravel or granitic gneiss mixtures always provided the lowest splitting tensile strengths,
as was observed with their compressive strengths.
At the age of 28 d, the following equation was identified for splitting tensile strength (σt) for both
binder types via principal components analysis, once again excluding the siliceous gravel data:
σt (MPa) = 1.26 – 0.012*Absorption + 0.047*CTE + 0.015*Eagg + 0.126*Epaste (4)
with a standard error of 0.34 MPa. This represents a minor improvement over the previously presented
models (Table 13) for OPC mixtures only, that included siliceous gravel and were based on the overall
average value at 28 d (standard error of 0.42 MPa) or the measured CTE of the aggregates (standard error
of 0.40, for σt = 4.71 - 0.050*CTE). As with the 28-d compressive strength, the most significant variables
were identified as aggregate absorption, CTE, and modulus, along with the modulus of the binder (paste)
component of the concrete.

62
This
pu
blic
atio
n is
availa
ble
free o
f charg
e fro
m: h
ttps://d
oi.o
rg/1
0.6
028
/NIS
T.T
N.1
963
CONCRETE FLEXURAL STRENGTH
The flexural strengths of OPC mixtures varied from 5.8 MPa to 6.7 MPa at 28 d and from 5.8 MPa
to 7.2 MPa at 91 d. These ranges, in relation to the average value, were lower than what was obtained for
the compressive strength and the splitting tensile strength. The ternary blends’ flexural strengths varied
from 4.7 MPa to 6.6 MPa at 28 d and from 5.0 MPa to 7.2 MPa at 91 d. These ranges, in relation to the
average value, were about the same as the compressive strength and lower than the splitting tensile strength.
Thus, it appears that flexural strength is less sensitive to the different aggregates than the splitting tensile
strength, which was expected since the load in flexural strength testing is applied parallel to the casting
direction, as in the case of compressive strength testing [79].
The lowest flexural strengths were also found in mixtures containing siliceous gravel and granitic
gneiss, as occurred with compressive and splitting tensile strengths (Tables 9 and 10). The dolomitic
limestone and marble mixtures showed high strengths in both OPC and ternary blend mixtures, even though
these aggregates presented a low texture index (Figures 8c and 8i) and a medium to high modulus of
elasticity. A factor that may have contributed to their high strength is a better bond due to the chemical
reaction between the calcite in the aggregate and components of the hydrated cement, as reported by
others [2,10,23,25,26]. Figure 37 shows that most of the fracture occurred through the aggregates,
indicating a good bond between aggregate and paste. Other carbonate aggregates, such as dolomite and
micritic limestone, presented high strengths as well, as they had not only the contribution of the possible
chemical reaction, but also higher texture indices (Figures 8b and 8e).
Figure 37. Photographs of OPC beam specimens tested for flexural strength at 28 d (left) and 91 d (right),
respectively. (a) and (b) with marble aggregate, (c) and (d) with dolomitic limestone aggregate.
(c) (d)
(b) (a)
63
This
pu
blic
atio
n is
availa
ble
free o
f charg
e fro
m: h
ttps://d
oi.o
rg/1
0.6
028
/NIS
T.T
N.1
963
SUMMARY AND PROSPECTUS The objectives of this exploratory project were to examine the impact of aggregate type on concrete
performance and to identify aggregate characteristics that have the largest impact on this performance. The
results have demonstrated that for similar mixture proportions, the selection of coarse aggregates can have
a measurable influence on concrete performance, in terms of both mechanical and transport (i.e., electrical
resistivity) properties. For example, for 28-d compressive strength, the range over the average value was
on the order of 35 % for both the OPC and ternary blend concrete mixtures for the 11 aggregate types
examined in the present study.
Associating a single aggregate characteristic with these performance variations was less successful.
Concrete modulus was one exception to this rule as a reasonable prediction of concrete modulus could be
obtained based on the aggregate modulus, particularly when two specific aggregates (siliceous gravel and
meta-basalt) were excluded from this analysis. Linear models were developed to predict 28-d compressive
strength, based on CTE for the OPC concretes and on CTE and absorption for the ternary blend concretes,
but the quality of their predictions was far from ideal. Predictions for splitting tensile and flexural strengths
offered only slight improvements over a single value (average) model. Each measured concrete property is
influenced in a unique manner by a different combination of aggregate characteristics.
Nonetheless, a great deal of data was generated in this study and noteworthy observations that
should be highlighted include:
1) The incompatibility of certain paste and aggregate properties, namely modulus of elasticity and
CTE, likely promote the development of interfacial stresses, potentially causing microcracking,
weakening the bond between the two phases, and lowering the measured concrete strength.
2) For both binders, the siliceous gravel aggregate produced low strength concretes, which exhibited
a low electrical resistivity as well. This is likely due to weaker bonding between paste/mortar and
coarse aggregate in this composite material.
3) The high absorption limestone produced unexpectedly low strengths (and resistivities) in the
ternary blend concrete mixture, for reasons unknown at the present time.
4) Similarly, in the OPC concretes, the granitic gneiss produced the lowest electrical resistivities and
the second lowest compressive strengths at 28 d and 91 d (after the siliceous gravel).
5) For three of the other concretes based on carbonate aggregates (limestones and marble), the
strengths exhibited by the ternary blends were unexpectedly high relative to those exhibited by the
OPC mixtures, in agreement with results from a previous study [63,64].
6) The micritic limestone produced OPC and ternary blend concretes with the highest measured
electrical resistivities, suggestive of a low diffusivity, potentially high durability concrete. These
concretes had strengths that were in the upper quartile for the ternary blend but in the lower one for
OPC, illustrating that strength should not be used to infer resistivity (durability) and vice versa.
7) These results demonstrate that selection of an optimum aggregate for a specific concrete application
will also require knowledge of the binder to be used, as some aggregates performed better with the
OPC concrete than they did in the ternary blends, and vice versa.
The present study did not provide any direct assessments of the level of bond between aggregates and
paste/mortar and it is likely this parameter that greatly influences mechanical (and to a lesser extent
transport) properties of the produced concrete. Clearly, both aggregate and binder characteristics will

64
This
pu
blic
atio
n is
availa
ble
free o
f charg
e fro
m: h
ttps://d
oi.o
rg/1
0.6
028
/NIS
T.T
N.1
963
influence this bonding level. In the future, it is planned to assess the bonding level in some of the remaining
cylinders from each concrete mixture using non-linear ultrasonic techniques, in the hopes that such
measurements on these concretes can be related to the established database (Tables 9 and 10) of their
measured mechanical properties.
65
This
pu
blic
atio
n is
availa
ble
free o
f charg
e fro
m: h
ttps://d
oi.o
rg/1
0.6
028
/NIS
T.T
N.1
963
REFERENCES
1) French, C.W., and Mokhtarzadeh, A., “High Strength Concrete: Effects of Materials, Curing and Test
Procedures on Short-Term Compressive Strength,” PCI Journal, 38 (3), 76-87, 1993.
2) Özturan, T., and Çeçen, C., “Effect of Coarse Aggregate Type on Mechanical Properties of Concrete
with Different Strengths,” Cement and Concrete Research, 27 (2), 165-170, 1997.
3) Tasong, W.A., Cripps, J.C., and Lynsdale, C.J., “Aggregate-Cement Chemical Interactions,” Cement
and Concrete Research, 28 (7), 1037-1048, 1998.
4) Tasong, W.A., Lynsdale, C.J., and Cripps, J.C., “Aggregate-Cement Paste Interface Part I. Influence of
Aggregate Geochemistry,” Cement and Concrete Research, 29, 1019-1025, 1999.
5) Tasong, W.A., Lynsdale, C.J., and Cripps, J.C., “Aggregate-Cement Paste Interface. II: Influence of
Aggregate Physical Properties,” Cement and Concrete Research, 28 (10), 1453-1465, 1998.
6) Quiroga, P.N., and Fowler, D.W., “The Effects of Aggregates Characteristics on the Performance of
Portland Cement Concrete,” Report ICAR 104-1F, August 2004.
7) Al-Oraimi, S.K., Taha, R., and Hassan, H.F., “The Effect of the Mineralogy of Coarse Aggregate on the
Mechanical Properties of High-Strength Concrete,” Construction and Building Materials, 20, 499-503,
2006.
8) Rocco, C., and Elices, M., “Effect of Aggregate Shape on the Mechanical Properties of a Simple
Concrete,” Engineering Fracture Mechanics, 76 (2), 286-298, 2008.
9) Zunino, F., Castro, J., and Lopez, M., “Thermo-mechanical Assessment of Concrete Microcracking
Damage Due to Early-Age Temperature Rise,” Construction and Building Materials, 81, 140-153, 2015.
10) Kamali-Bernard, S., Keinde, D., and Bernard, F., “Effect of Aggregate Type on the Concrete
Matrix/Aggregates Interface and Its Influence on the Overall Mechanical Behavior. A Numerical Study,”
Key Engineering Materials, 617, 14-17, 2014.
11) Liu, Y., and Presuel-Moreno, F., “Effect of Elevated Temperature Curing on Compressive Strength and
Electrical Resistivity of Concrete with Fly Ash and Ground-Granulated Blast-Furnace Slag,” ACI Materials
Journal, 111 (5), 531-541, 2014.
12) Beushausen, H., and Dittmer, T., “The Influence of Aggregate Type of the Strength and Elastic Modulus
of High Strength Concrete,” Construction and Building Materials, 74, 132-139, 2015.
13) Grandet, J., and Ollivier, J.P., “Etude de la Formation du Monocarboaluminate de Calcium Hydrate au
Contact d’un Granulat Calcaire dans une Pate de Ciment Portland,” Cement and Concrete Research, 10,
759-770, 1980.
14) Monteiro, P.J.M., and Mehta, P.K., “Interaction between Carbonate Rock and Cement Paste,” Cement
and Concrete Research, Vol. 16 (2), 127-134, 1986.
15) Bentz, D.P., Stutzman, P.E., and Garboczi, E.J., “Experimental and Simulation Studies of the Interfacial
Zone in Concrete,” Cement and Concrete Research, 22 (5), 891-902, 1992.
16) Hussin, A., and Poole, C., “Petrography Evidence of the Interfacial Transition Zone (ITZ) in the Normal
Strength Concrete Containing Granitic and Limestone Aggregates,” Construction and Building Materials,
25, 2298-2303, 2011.
17) Pocius, A.V., Adhesion and Adhesives Technology: An Introduction. Carl Hanser Verlag GmbH Co
KG, 2012.

66
This
pu
blic
atio
n is
availa
ble
free o
f charg
e fro
m: h
ttps://d
oi.o
rg/1
0.6
028
/NIS
T.T
N.1
963
18) Miller, C., Vasconcelos, K., Little, D., and Bhasin, A., “Investigating Aspects of Aggregate Properties
that Influence Asphalt Mixtures Performance,” Research Report for DTFH61-06-C-00021, Texas A&M
University at College Station and The University of Texas at Austin, Texas, 2011.
19) Bentz, D.P., Ardani, A., Barrett, T., Jones, S.Z., Lootens, D., Peltz, M.A., Sato, T., Stutzman, P.E.,
Tanesi, J., and Weiss, W.J., “Multi-Scale Investigation of the Performance of Limestone in Concrete,”
Construction and Building Materials, 75, 1-10, 2015.
20) Bentz, D.P., Tanesi, J., and Ardani, A., “Ternary Blends for Controlling Cost and Carbon Content,”
Concrete International, 35 (8), 51-59, 2013.
21) Bentz, D.P., Barrett, T., de la Varga, I., and Weiss, W.J., “Relating Compressive Strength to Heat
Release in Mortars,” Advanced Civil Engineering Materials, 1 (1), 1-14, 2012,
doi:10.1520/ACEM20120002.
22) Bremner, T., and Holm, T., “Elastic Compatibility and the Behavior of Concrete,” ACI Materials
Journal, 83 (2), 244-250, 1986.
23) Aïtcin, P.-C., and Mehta, P., “Effect of Coarse Aggregate Characteristics on Mechanical Properties of
High-Strength Concrete,” ACI Materials Journal, 87 (2), 103-107, 1990.
24) Neville, A., “Aggregate Bond and Modulus of Elasticity of Concrete,” ACI Materials Journal, 94 (1),
71-74, 1997.
25) Sengul, O., Tasdemir, C., and Tasdemir, M., “Influence of Aggregate Type of Mechanical Behavior of
Normal- and High-Strength Concretes,” ACI Materials Journal, 99 (6), 528-533, 2002.
26) Swamy, R., “Aggregate-Matrix Interaction in Concrete Systems,” Solids Mechanics and Engineering
Design in Civil Engineering Materials, 301-315, 1969.
27) Bloem, D.L. and Gaynor, R.D., “Effects of Aggregate Properties on Strength of Concrete,” ACI
Journal, Proceedings, 60 (10), 1429-1456, 1963.
28) ASTM International, ASTM C29-09 Standard Test Method for Bulk Density (“Unit Weight”) and
Voids in Aggregate, ASTM International, West Conshohocken, PA, 5 pp., 2009.
29) ASTM International, ASTM C127-12 Standard Test Method for Relative Density, Relative Density
(Specific Gravity), and Absorption of Coarse Aggregate, ASTM International, West Conshohocken, PA, 6
pp., 2012.
30) Masad, E., “Aggregate Imaging System (AIMS): Basics and Applications,” Report FHWA/TX-05/5-
1707-01-1, Department of Transportation, 2005.
31) Gates, L., Masad, E., Pyle, R., and Bushee, F., “Aggregate Imaging Measurements System 2 (AIMS2):
Final Report,” FHWA-HIG-11-030, FHWA, Department of Transportation, 2011.
32) AASHTO, AASHTO TP81-12 Determining Aggregate Shape Properties by Means of Digital Image
Analysis, American Association of State and Highway Transportation Officials, 2012.
33) ASTM International, ASTM C295/C295M-12 Standard Guide for Petrographic Examination of
Aggregates for Concrete, ASTM International, West Conshohocken, PA, 9 pp., 2012.
34) ASTM International, ASTM C1679-14 Standard Practice for Measuring Hydration Kinetics of
Hydraulic Cementitious Mixtures Using Isothermal Calorimetry, ASTM International, West
Conshohocken, PA, 15 pp., 2014.
35) Lawrence, C.D., “Changes in Composition of Aqueous Phase during Hydration of Cement Pastes and
Suspensions,” in Proceedings of a Symposium on the Structure of Portland Cement Paste and Concrete,
Highway Research Board, Special Report 90, Washington, D.C., 378-391, 1966.
67
This
pu
blic
atio
n is
availa
ble
free o
f charg
e fro
m: h
ttps://d
oi.o
rg/1
0.6
028
/NIS
T.T
N.1
963
36) AASHTO, AASHTO T22-14 Standard Method of Test for Compressive Strength of Cylindrical
Concrete Specimens, American Association of State and Highway Transportation Officials, 2014.
37) AASHTO, AASHTO T336-15 Standard Method of Test for Coefficient of Thermal Expansion of
Hydraulic Cement Concrete, American Association of State and Highway Transportation Officials, 2015.
38) ASTM International, ASTM D7012-14 Standard Test Methods for Compressive Strength and Elastic
Moduli of Intact Rock Core Specimens under Varying States of Stress and Temperatures, ASTM
International, West Conshohocken, PA, 9 pp., 2014.
39) ASTM International, ASTM D3967-08 Standard Test Method for Splitting Tensile Strength of Intact
Rock Core Specimens, ASTM International, West Conshohocken, PA, 4 pp., 2008.
40) ASTM International, ASTM C215-14 Standard Test Method for Fundamental Transverse,
Longitudinal, and Torsional Resonant Frequencies of Concrete Specimens, ASTM International, West
Conshohocken, PA, 7 pp., 2014.
41) ASTM International, ASTM C1259-14 Standard Test Method for Dynamic Young’s Modulus, Shear
Modulus, and Poisson’s Ratio for Advanced Ceramics by Impulse Excitation of Vibration, ASTM
International, West Conshohocken, PA, 17 pp. 2014.
42) Boulange, L., and Sterczynskia, F., “Study of the Interaction between Bitumen and Various Aggregates
Used in Road Construction,” Journal of Adhesion Science and Technology, Vol. 26 (1-3), 163-173, 2012.
43) National Institute of Standards and Technology, Certificate of Analysis, Standard Reference Material
738, Stainless Steel (AISI 446), Thermal Expansion, 1993 (revision of certificate dated 11-17-86).
44) National Institute of Standards and Technology, Certificate, Standard Reference Material 731,
Borosilicate Glass, Thermal Expansion, 1993 (revision of certificate dated 7-31-72).
45) ASTM International, ASTM C150/C150M-15 Standard Specification for Portland Cement, ASTM
International, West Conshohocken, PA, 9 pp., 2015.
46) ASTM International, ASTM C618-15 Standard Specification for Coal Fly Ash and Raw or Calcined
Natural Pozzolan for Use in Concrete, ASTM International, West Conshohocken, PA, 5 pp., 2015.
47) ACI, ACI 211.1-91: Standard Practice for Selecting Proportions for Normal, Heavyweight, and Mass
Concrete (Reapproved 2009), American Concrete Institute, Farmington Hills, MI, 2009.
48) ASTM International, ASTM C192/C192M-15 Standard Practice for Making and Curing Concrete Test
Specimens in the Laboratory, ASTM International, West Conshohocken, PA, 8 pp. 2015.
49) ASTM International, ASTM C1064/C1064M-12 Standard Test Method for Temperature of Freshly
Mixed Hydraulic-Cement Concrete, ASTM International, West Conshohocken, PA, 3 pp., 2012.
50) ASTM International, ASTM C143/C143M-15 Standard Test Method for Slump of Hydraulic-Cement
Concrete, ASTM International, West Conshohocken, PA, 4 pp., 2015.
51) ASTM International, ASTM C231/C231M-14 Standard Test Method for Air Content of Freshly Mixed
Concrete by the Pressure Method, ASTM International, West Conshohocken, PA, 9 pp., 2014.
52) ASTM International, ASTM C138/C138M-14 Standard Test Method for Density (Unit Weight), Yield,
and Air Content (Gravimetric) of Concrete, ASTM International, West Conshohocken, PA, 4 pp., 2014.
53) Bentz, D.P., Jones, S.Z., and Snyder, K.A., “Design and Performance of Ternary Blend High-Volume
Fly Ash Concretes of Moderate Slump,” Construction and Building Materials, 84, 409-415, 2015.
54) ASTM International, ASTM C1753-15 Standard Practice for Evaluating Early Hydration of Hydraulic
Cementitious Mixtures Using Thermal Measurements, ASTM International, West Conshohocken, PA, 19
pp., 2015.
68
This
pu
blic
atio
n is
availa
ble
free o
f charg
e fro
m: h
ttps://d
oi.o
rg/1
0.6
028
/NIS
T.T
N.1
963
55) ASTM International, ASTM C39/C39M-15 Standard Test Method for Compressive Strength of
Cylindrical Concrete Specimens, ASTM International, West Conshohocken, PA, 7 pp., 2015.
56) ASTM International, ASTM C469/C469M-14 Standard Test Method for Static Modulus of Elasticity
and Poisson’s Ratio of Concrete in Compression, ASTM International, West Conshohocken, PA, 5 pp.,
2014.
57) ASTM International, ASTM C496/C496M-11 Standard Test Method for Splitting Tensile Strength of
Cylindrical Concrete Specimens, ASTM International, West Conshohocken, PA, 5 pp., 2011.
58) ASTM International, ASTM C78/C78M-15b Standard Test Method for Flexural Strength of Concrete
(Using Simple Beam with Third-Point Loading), ASTM International, West Conshohocken, PA, 4 pp.,
2015.
59) AASHTO, AASHTO T-358 Standard Method of Test for Surface Resistivity Indication of Concrete’s
Ability to Resist Chloride Ion Penetration, American Association of State Highway Transportation
Officials, 2015.
60) Blattner, T., et. al., “A Hybrid CPU-GPU System for Stitching of Large Scale Optical Microscopy
Images,” 2014 International Conference on Parallel Processing, Minneapolis, MN, 2014.
61) Tanesi, J., Crawford, G., Nicolaescu, M., Meininger, R., and Gudimettla, J., “New AASHTO 336-09
Coefficient of Thermal Expansion Test Method: How Will It Affect You?” Transportation Research
Record: Journal of the Transportation Research Board, No. 2164, Transportation Research Board of
National Academies, Washington, D.C., 2010.
62) Bentz, D.P., Snyder, K.A., and Ahmed, A., “Anticipating the Setting Time of High-Volume Fly Ash
Concretes Using Electrical Measurements: Feasibility Studies Using Pastes,” Journal of Materials in Civil
Engineering, 27 (3), 04014129-1-6, 2015.
63) Shannon, J., Howard, I., and Cost, V., “Potential of Portland-Limestone Cement to Improve
Performance of Concrete Made with High Slag Cement and Fly Ash Replacement Rates,” ASTM Journal
of Testing and Evaluation, 45 (3), 1-17, 2017.
64) Shannon, J., Howard, I., Cost, V., and Wilson, W., “Benefits of Portland-Limestone Cement for
Concrete with Round Gravel Aggregates and Higher Fly Ash Replacement Rates,” TRB 94th Annual
Meeting Compendium of Papers, Report #15-4049, 17 pp., 2015.
65) American Concrete Institute and International Organization for Standardization, ACI 318-14: Building
Code Requirements for Structural Concrete and Commentary, ACI, Farmington Hills, MI, 2014.
66) American Concrete Institute and International Organization for Standardization, ACI 363R-10: Report
on High-Strength Concrete, ACI, Farmington Hills, MI, 2010.
67) Morris, W., Moreno, E.I., and Sagüés, A.A., “Practical Evaluation of Resistivity of Concrete in Test
Cylinders Using a Wenner Array Probe,” Cement and Concrete Research, 26 (12), 1779-1787, 1996.
68) Jones, S.Z., Bentz, D.P., Snyder, K.A., Martys, N.S., Hussey, D.S., and Jacobson, D.L., “Service Life
Modeling of Reinforced High Volume Fly Ash (HVFA) Concrete Structures Containing Cracks,”
Proceedings International Concrete Sustainability Conference, Miami, FL, 15 pp., May 2015.
69) Vegard, L., “Die Konstitution der Mischkristalle und die Raumfüllung der Atome,” Zeitschrift für
Physik, 5, 17-26, 1921.
70) Hefer, A., and Little, D., “Adhesion in Bitumen-Aggregate Systems and Quantification of the Effects
of Water on the Adhesive Bond,” Research Report ICAR-505-1, 205 p., 2005.
71) Miller, C.M., “Adhesion and the Surface Energy Components of Natural Minerals and Aggregates,”
Ph.D., Texas A&M University, 2010.

69
This
pu
blic
atio
n is
availa
ble
free o
f charg
e fro
m: h
ttps://d
oi.o
rg/1
0.6
028
/NIS
T.T
N.1
963
72) Lyne, Å.L., Krivosheeva, O., and Birgisson, B., “Adhesion Between Bitumen and Aggregate:
Implementation of Spectroscopic Ellipsometry Characterization and Estimation of Hamaker’s Constant,”
Materials and Structures, 46 (10), 1737-1745, 2013.
73) Jones, D.R., SHRP Materials Reference Library: Asphalt Cements: A Concise Data Compilation. Vol.
1. Washington, D.C.: Strategic Highway Research Program, National Research Council, 1993.
74) Brand, A.S., and Roesler, J.R., “Bonding in Cementitious Materials with Asphalt-Coated Particles:
Part I – The Interfacial Transition Zone,” Construction and Building Materials, 130, 171-181, 2017.
75) Brand, A.S., and Roesler, J.R., “Bonding in Cementitious Materials with Asphalt-Coated Particles:
Part II – Cement-Asphalt Chemical Interactions,” Construction and Building Materials, 130, 182-182,
2017.
76) Bentz, D.P., “Activation Energies of High-Volume Fly Ash Ternary Blends: Hydration and Setting,”
Cement and Concrete Composites, 53, 214-223, 2014.
77) Matschei, T., Lothenbach, B., and Glasser, F.P., “The Role of Calcium Carbonate in Cement
Hydration,” Cement and Concrete Research, 37 (4), 551-558, 2007.
78) Loser, R., Münch, B., and Lura, P., “A Volumetric Technique for Measuring the Coefficient of Thermal
Expansion of Hardening Cement Paste and Mortar,” Cement and Concrete Research, 40 (7), 1138-1147,
2010.
79) Mindess, S., Young, J.F., and Darwin, D., Concrete, 2nd edition, Pearson, New York, 2002.

70
This
pu
blic
atio
n is
availa
ble
free o
f charg
e fro
m: h
ttps://d
oi.o
rg/1
0.6
028
/NIS
T.T
N.1
963
APPENDIX A. AGGREGATE REACTIVITY AS ASSESSED BY
ISOTHERMAL CALORIMETRY AND ICP-AES ANALYSIS
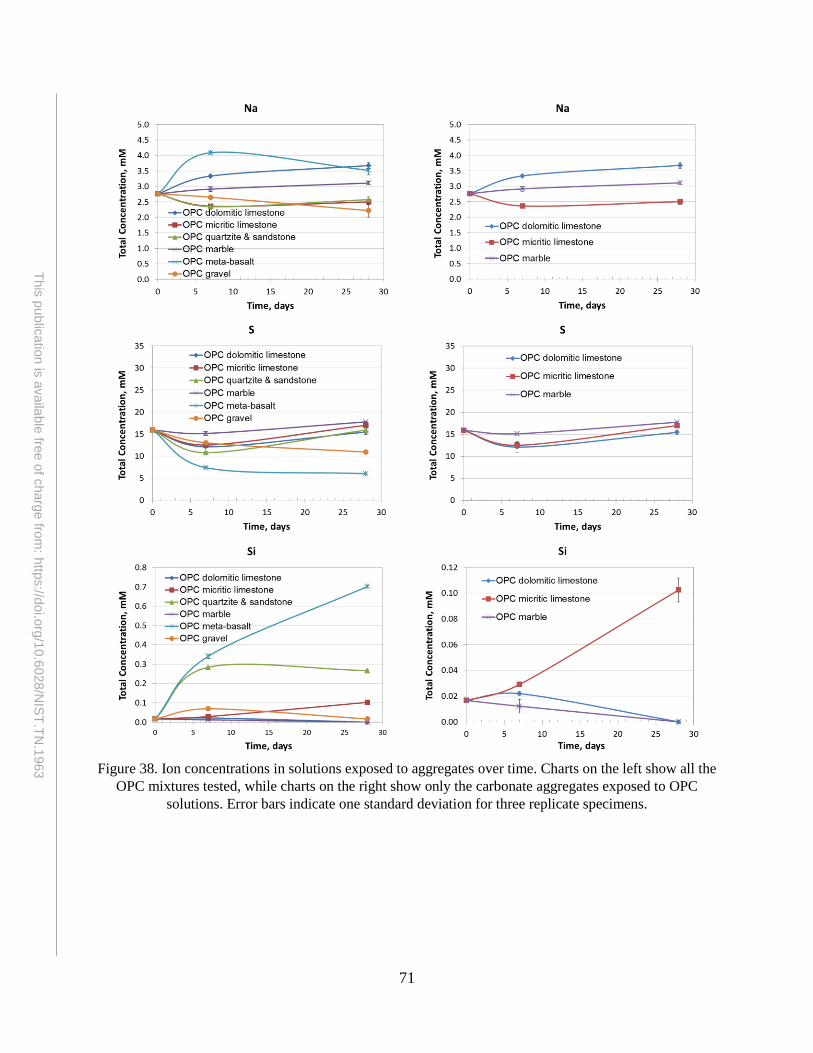
71
This
pu
blic
atio
n is
availa
ble
free o
f charg
e fro
m: h
ttps://d
oi.o
rg/1
0.6
028
/NIS
T.T
N.1
963
Figure 38. Ion concentrations in solutions exposed to aggregates over time. Charts on the left show all the
OPC mixtures tested, while charts on the right show only the carbonate aggregates exposed to OPC
solutions. Error bars indicate one standard deviation for three replicate specimens.
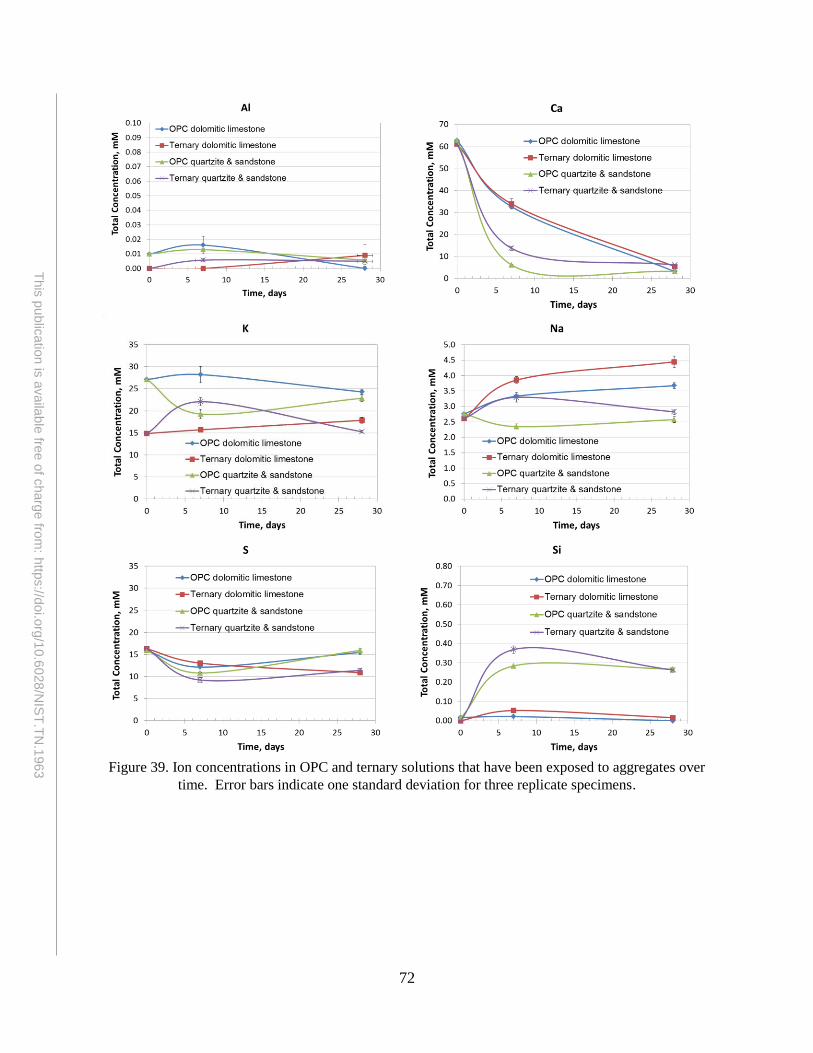
72
This
pu
blic
atio
n is
availa
ble
free o
f charg
e fro
m: h
ttps://d
oi.o
rg/1
0.6
028
/NIS
T.T
N.1
963
Figure 39. Ion concentrations in OPC and ternary solutions that have been exposed to aggregates over
time. Error bars indicate one standard deviation for three replicate specimens.

73
This
pu
blic
atio
n is
availa
ble
free o
f charg
e fro
m: h
ttps://d
oi.o
rg/1
0.6
028
/NIS
T.T
N.1
963
Figure 40. Cumulative heat over time of aggregates in OPC pore solution (a) carbonate aggregates and (b)
non-carbonate aggregates.
(a)
(b)

74
This
pu
blic
atio
n is
availa
ble
free o
f charg
e fro
m: h
ttps://d
oi.o
rg/1
0.6
028
/NIS
T.T
N.1
963
Figure 41. Cumulative heat over time of aggregates in ternary pore solution (a) carbonate aggregates and
(b) non-carbonate aggregates.
(a)
(b)
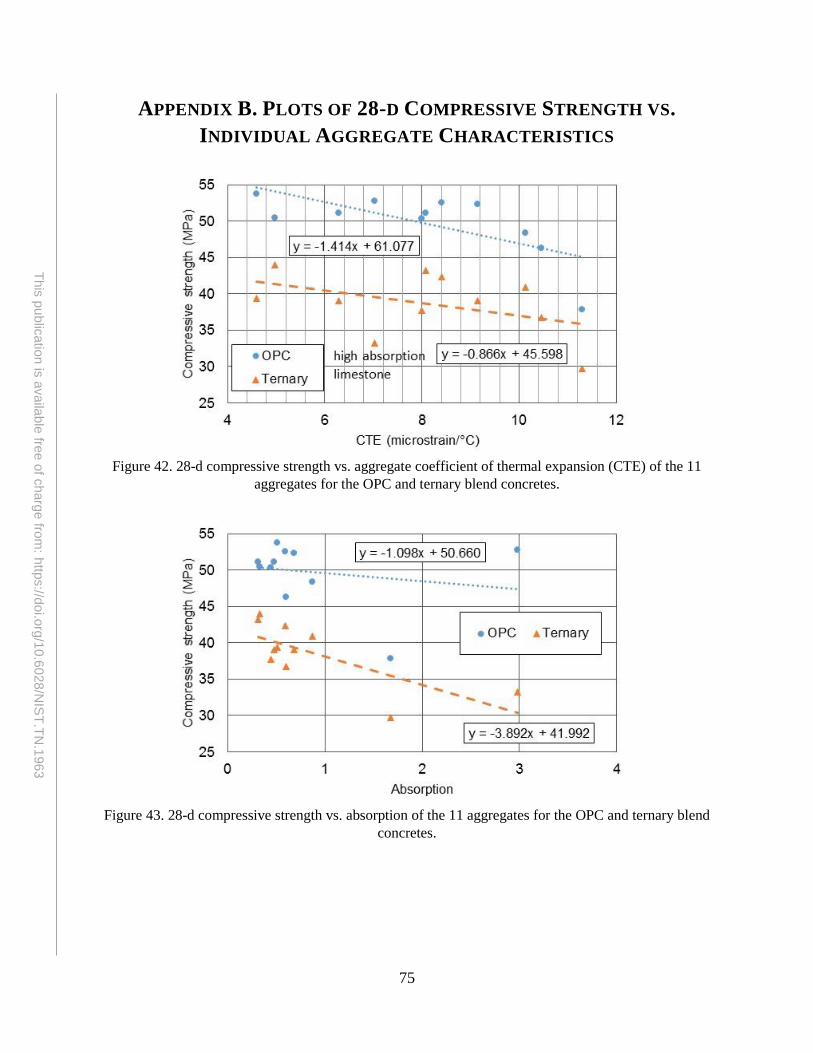
75
This
pu
blic
atio
n is
availa
ble
free o
f charg
e fro
m: h
ttps://d
oi.o
rg/1
0.6
028
/NIS
T.T
N.1
963
APPENDIX B. PLOTS OF 28-D COMPRESSIVE STRENGTH VS.
INDIVIDUAL AGGREGATE CHARACTERISTICS
Figure 42. 28-d compressive strength vs. aggregate coefficient of thermal expansion (CTE) of the 11
aggregates for the OPC and ternary blend concretes.
Figure 43. 28-d compressive strength vs. absorption of the 11 aggregates for the OPC and ternary blend
concretes.

76
This
pu
blic
atio
n is
availa
ble
free o
f charg
e fro
m: h
ttps://d
oi.o
rg/1
0.6
028
/NIS
T.T
N.1
963
Figure 44. 28-d compressive strength vs. aggregate elastic modulus of the 11 aggregates for the OPC and
ternary blend concretes.
Figure 45. 28-d compressive strength vs. specific gravity of the 11 aggregates for the OPC and ternary
blend concretes. Standard errors are 4.06 MPa and 3.81 MPa for OPC and ternary blends, respectively.

77
This
pu
blic
atio
n is
availa
ble
free o
f charg
e fro
m: h
ttps://d
oi.o
rg/1
0.6
028
/NIS
T.T
N.1
963
Figure 46. 28-d compressive strength vs. aggregate surface energy, dispersive (left) and polar (right)
components, for the OPC and ternary blend concretes. Standard errors for linear fits in the case of
dispersive surface energy are 3.73 MPa and 4.1 MPa for the OPC and ternary blends, respectively.
Figure 47. 28-d compressive strength vs. CAAT (left) and Texture (right) parameters from the AIMS
analysis of each of the 11 aggregates for the OPC and ternary blend concretes.

78
This
pu
blic
atio
n is
availa
ble
free o
f charg
e fro
m: h
ttps://d
oi.o
rg/1
0.6
028
/NIS
T.T
N.1
963
APPENDIX C. REPRESENTATIVE SEM IMAGES FROM CONCRETE
MIXTURES
Siliceous Gravel Concretes:
Figure 48. BE image for siliceous gravel concrete prepared with OPC.
Some localized “layers” of CH can be seen at the aggregate and sand grain surfaces, with a generally porous
ITZ at the coarse aggregate surface (top).
Gravel
Sand
Sand
Sand Sand
Sand
Sand
Sand Sand
Sand
Sand

79
This
pu
blic
atio
n is
availa
ble
free o
f charg
e fro
m: h
ttps://d
oi.o
rg/1
0.6
028
/NIS
T.T
N.1
963
Figure 49. Ca-Si-Al RGB pseudo-color image for OPC siliceous gravel concrete.
CH is apparent as bright red inclusions within the paste, some localized at aggregate surfaces.
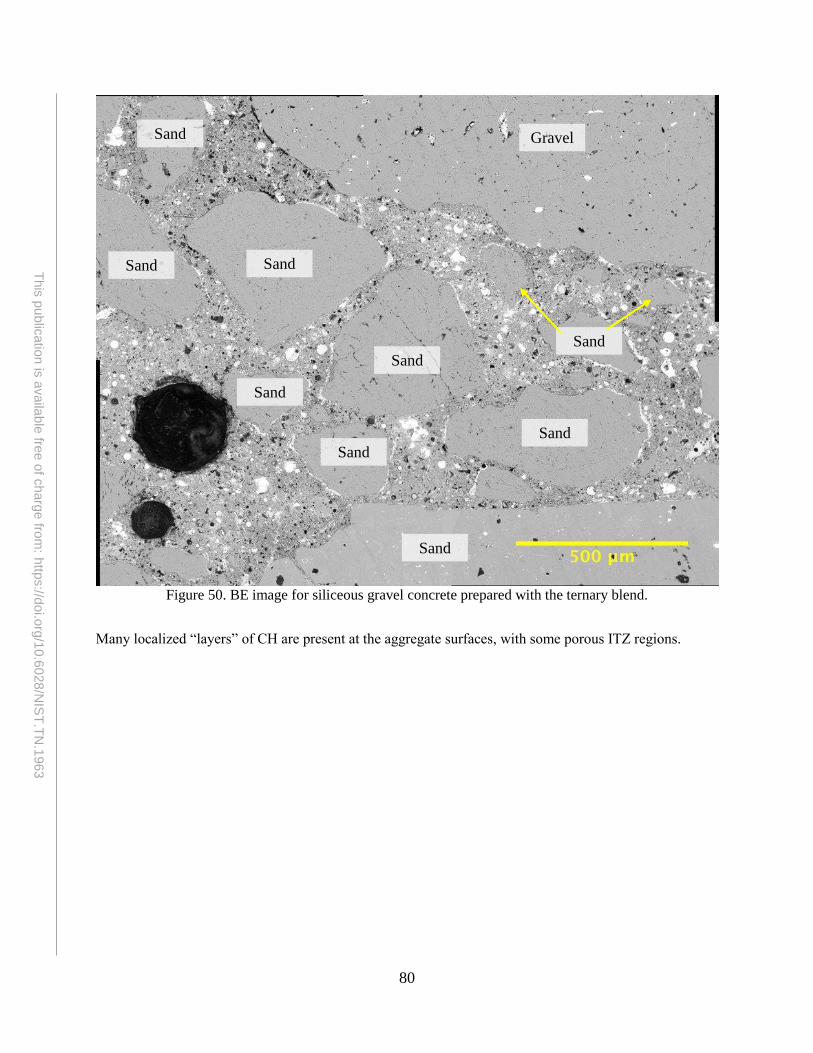
80
This
pu
blic
atio
n is
availa
ble
free o
f charg
e fro
m: h
ttps://d
oi.o
rg/1
0.6
028
/NIS
T.T
N.1
963
Figure 50. BE image for siliceous gravel concrete prepared with the ternary blend.
Many localized “layers” of CH are present at the aggregate surfaces, with some porous ITZ regions.
Sand
Sand
Sand Sand
Sand
Sand
Sand
Sand
Gravel
Sand

81
This
pu
blic
atio
n is
availa
ble
free o
f charg
e fro
m: h
ttps://d
oi.o
rg/1
0.6
028
/NIS
T.T
N.1
963
Figure 51. Ca-Si-Al RGB pseudo-color image for ternary blend siliceous gravel concrete.
CH is apparent as bright red inclusions in the paste, some localized at aggregate surfaces. Calcium
aluminosilicate and aluminosilicate fly ash phases are visible as rounded purple and blue/green particles
within the paste.

82
This
pu
blic
atio
n is
availa
ble
free o
f charg
e fro
m: h
ttps://d
oi.o
rg/1
0.6
028
/NIS
T.T
N.1
963
Dolomitic Limestone Concretes:
Figure 52. BE image for dolomitic limestone concrete prepared with OPC.
There is a high quality ITZ at the coarse aggregate surface, but there are still some CH regions around sand
grains. Cracks are present as specimen was taken from a broken compressive strength cylinder.
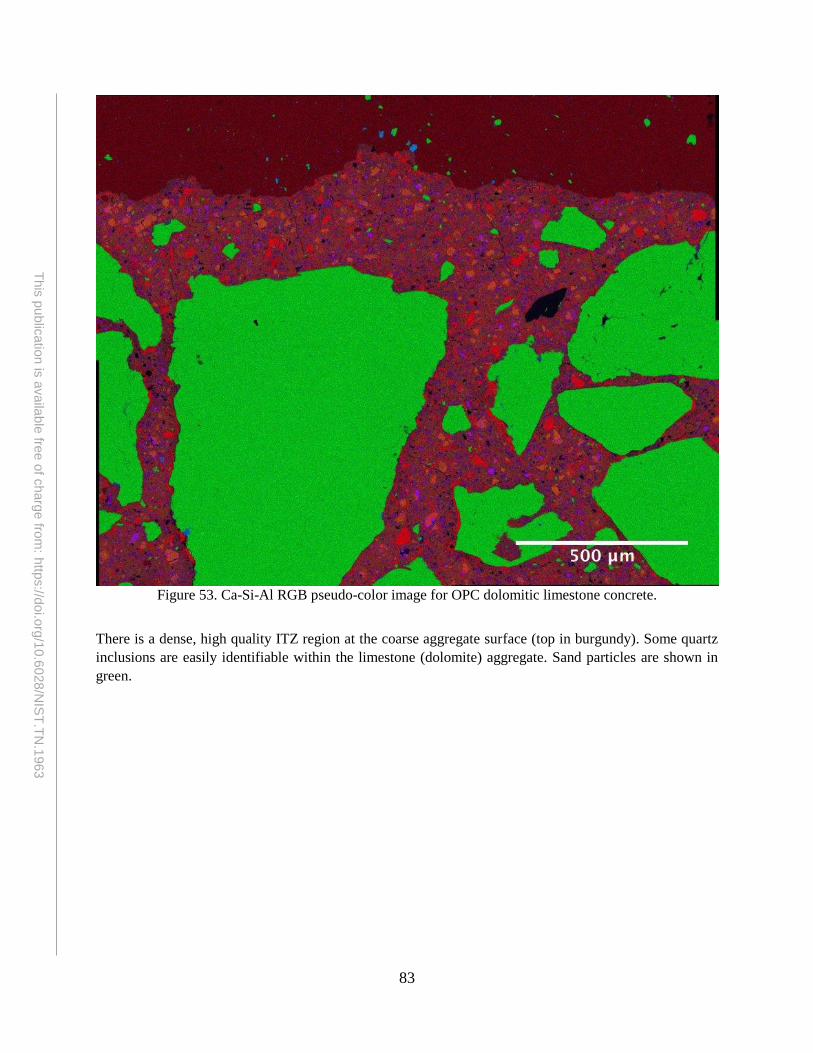
83
This
pu
blic
atio
n is
availa
ble
free o
f charg
e fro
m: h
ttps://d
oi.o
rg/1
0.6
028
/NIS
T.T
N.1
963
Figure 53. Ca-Si-Al RGB pseudo-color image for OPC dolomitic limestone concrete.
There is a dense, high quality ITZ region at the coarse aggregate surface (top in burgundy). Some quartz
inclusions are easily identifiable within the limestone (dolomite) aggregate. Sand particles are shown in
green.

84
This
pu
blic
atio
n is
availa
ble
free o
f charg
e fro
m: h
ttps://d
oi.o
rg/1
0.6
028
/NIS
T.T
N.1
963
Figure 54. BE image for dolomitic limestone concrete prepared with the ternary blend.
There is a generally dense ITZ, but with localized CH formation; some CH regions are present around sand
grains as well. Cracks are present as specimen was taken from a broken compressive strength cylinder.

85
This
pu
blic
atio
n is
availa
ble
free o
f charg
e fro
m: h
ttps://d
oi.o
rg/1
0.6
028
/NIS
T.T
N.1
963
Figure 55. Ca-Si-Al RGB pseudo-color image for ternary blend dolomitic limestone concrete.
CH is apparent as bright red inclusions in the paste, some localized at aggregate surfaces. Calcium
aluminosilicate and aluminosilicate fly ash phases are visible as rounded purple and blue/green particles
within the paste. Sand is shown in green and dolomitic limestone in burgundy (at top).

86
This
pu
blic
atio
n is
availa
ble
free o
f charg
e fro
m: h
ttps://d
oi.o
rg/1
0.6
028
/NIS
T.T
N.1
963
Meta-Basalt Concretes:
Figure 56. BE image for meta-basalt concrete prepared with OPC.
There is a generally high quality ITZ at the coarse aggregate surface, but with a crack running along that
interface. There are still some CH regions around sand grains. Cracks are present as specimen was taken
from a broken compressive strength cylinder.
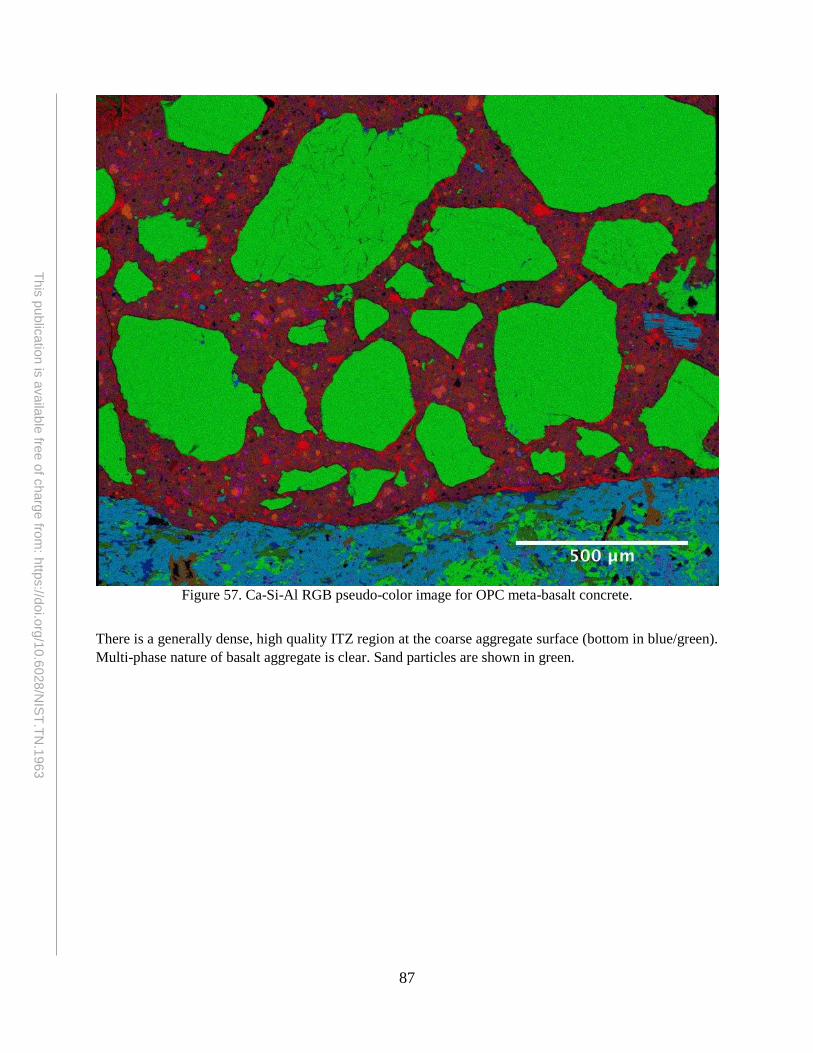
87
This
pu
blic
atio
n is
availa
ble
free o
f charg
e fro
m: h
ttps://d
oi.o
rg/1
0.6
028
/NIS
T.T
N.1
963
Figure 57. Ca-Si-Al RGB pseudo-color image for OPC meta-basalt concrete.
There is a generally dense, high quality ITZ region at the coarse aggregate surface (bottom in blue/green).
Multi-phase nature of basalt aggregate is clear. Sand particles are shown in green.

88
This
pu
blic
atio
n is
availa
ble
free o
f charg
e fro
m: h
ttps://d
oi.o
rg/1
0.6
028
/NIS
T.T
N.1
963
Figure 58. BE image for meta-basalt concrete prepared with the ternary blend.
There is a very high quality ITZ at the coarse aggregate surface (bottom). Cracks are present as specimen
was taken from a broken compressive strength cylinder.

89
This
pu
blic
atio
n is
availa
ble
free o
f charg
e fro
m: h
ttps://d
oi.o
rg/1
0.6
028
/NIS
T.T
N.1
963
Figure 59. Ca-Si-Al RGB pseudo-color image for ternary blend meta-basalt concrete.
There is a very high quality ITZ region at the coarse aggregate surface (bottom). Multi-phase nature of
basalt aggregate is clear. Calcium aluminosilicate and aluminosilicate fly ash phases are visible as rounded
purple and blue/green particles within the paste. Sand particles are shown in green and meta-basalt in
navy/dark green (at bottom).
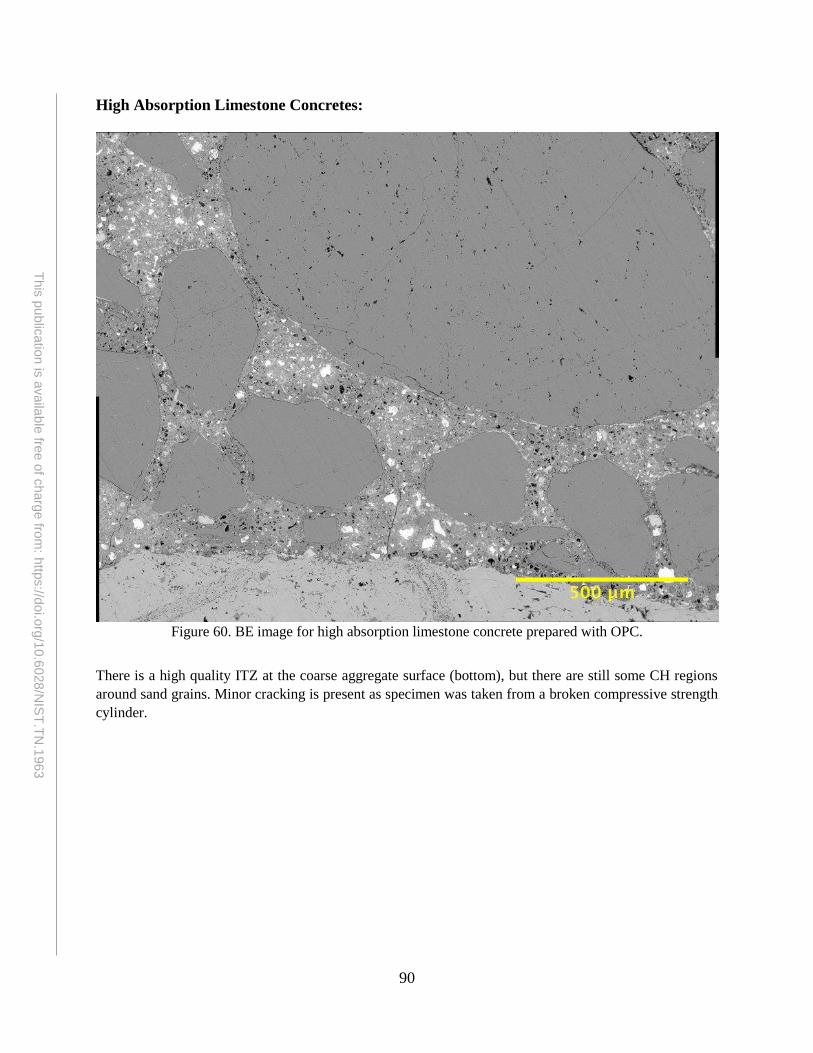
90
This
pu
blic
atio
n is
availa
ble
free o
f charg
e fro
m: h
ttps://d
oi.o
rg/1
0.6
028
/NIS
T.T
N.1
963
High Absorption Limestone Concretes:
Figure 60. BE image for high absorption limestone concrete prepared with OPC.
There is a high quality ITZ at the coarse aggregate surface (bottom), but there are still some CH regions
around sand grains. Minor cracking is present as specimen was taken from a broken compressive strength
cylinder.

91
This
pu
blic
atio
n is
availa
ble
free o
f charg
e fro
m: h
ttps://d
oi.o
rg/1
0.6
028
/NIS
T.T
N.1
963
Figure 61. Ca-Si-Al RGB pseudo-color image for OPC high absorption limestone concrete.
There is a dense, high quality ITZ region at the coarse aggregate surface (bottom in scarlet red). Calcite
(calcium carbonate) aggregate is easily identified by its bright red color, with very small quartz inclusions.
Sand particles are shown in green.
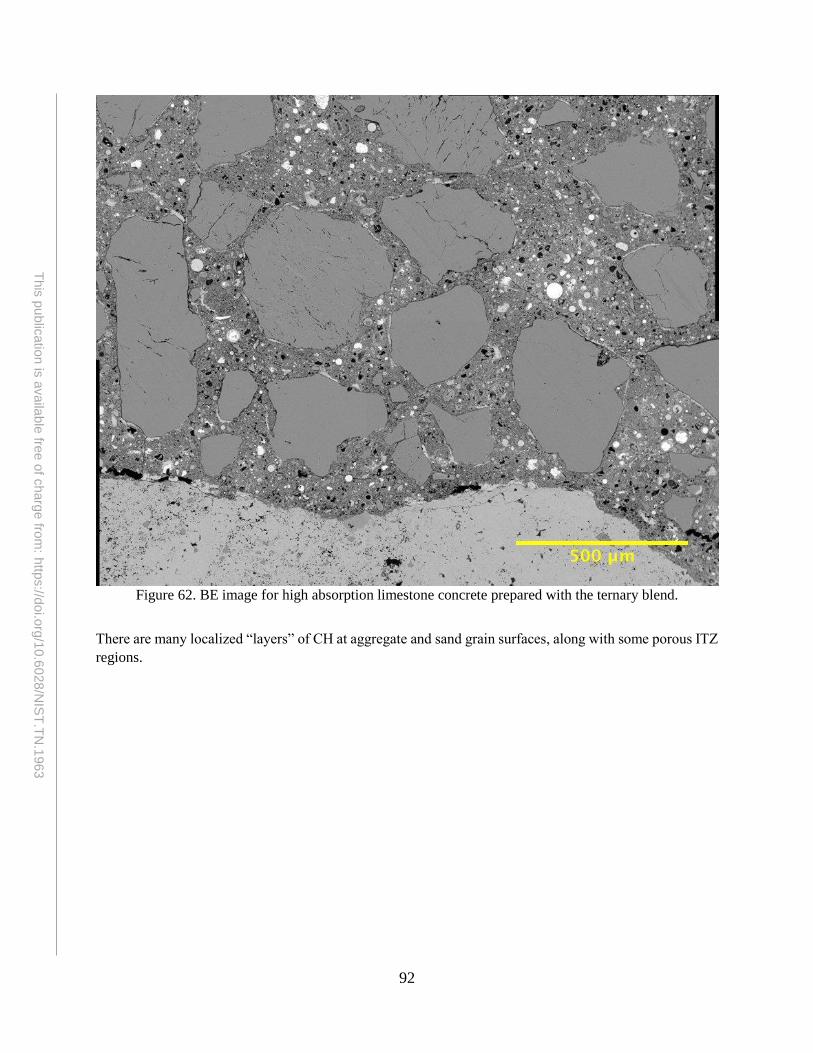
92
This
pu
blic
atio
n is
availa
ble
free o
f charg
e fro
m: h
ttps://d
oi.o
rg/1
0.6
028
/NIS
T.T
N.1
963
Figure 62. BE image for high absorption limestone concrete prepared with the ternary blend.
There are many localized “layers” of CH at aggregate and sand grain surfaces, along with some porous ITZ
regions.
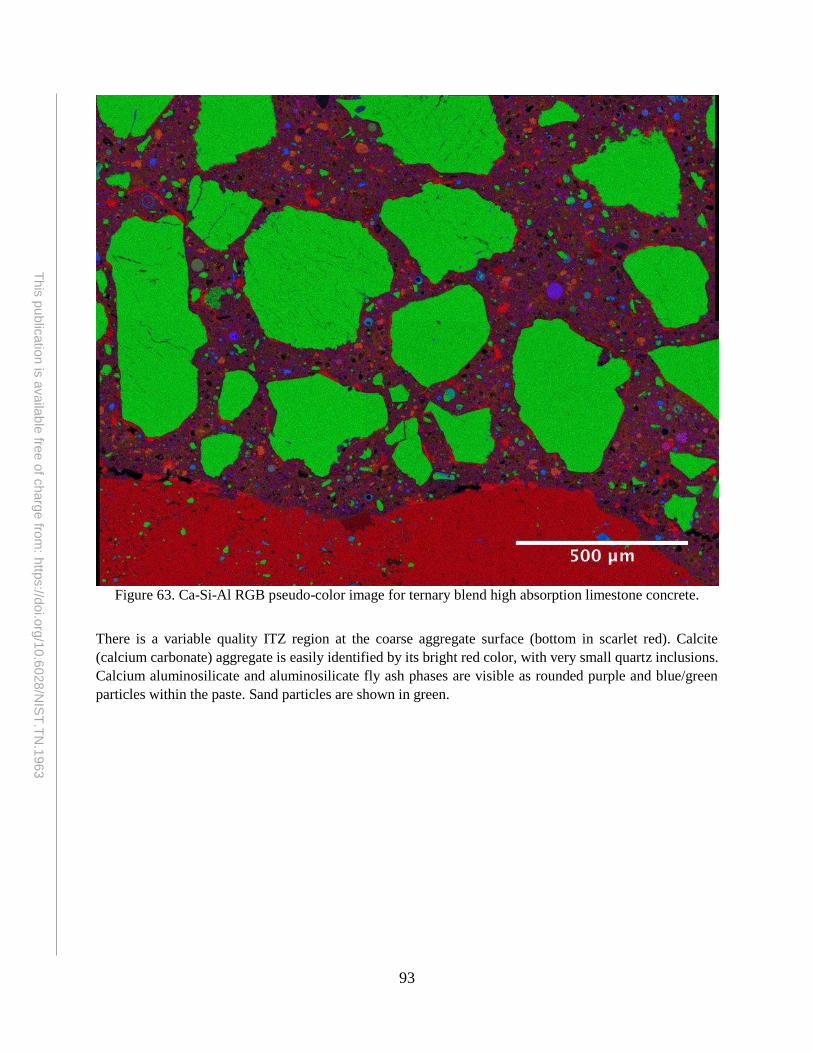
93
This
pu
blic
atio
n is
availa
ble
free o
f charg
e fro
m: h
ttps://d
oi.o
rg/1
0.6
028
/NIS
T.T
N.1
963
Figure 63. Ca-Si-Al RGB pseudo-color image for ternary blend high absorption limestone concrete.
There is a variable quality ITZ region at the coarse aggregate surface (bottom in scarlet red). Calcite
(calcium carbonate) aggregate is easily identified by its bright red color, with very small quartz inclusions.
Calcium aluminosilicate and aluminosilicate fly ash phases are visible as rounded purple and blue/green
particles within the paste. Sand particles are shown in green.

94
This
pu
blic
atio
n is
availa
ble
free o
f charg
e fro
m: h
ttps://d
oi.o
rg/1
0.6
028
/NIS
T.T
N.1
963
APPENDIX D. X-RAY DIFFRACTION SCANS OF SELECTED AGGREGATES
Gravel:
Essentially 100% quartz
FHWA 14147, Siliceous, micronized
00-046-1045 (*) - Quartz, syn - SiO2 - Y: 174.53 % - d x by: 1. - WL: 1.5406 - Hexagonal - a 4.91344 - b 4.91344 - c 5.40524 - alpha 90.000 - beta 90.000 - gamma 120.000 - Primitive - P3221 (154) - 3 - 113.010 - I/Ic
Operations: Y Scale Mul 0.583 | Import
FHWA 14147, Siliceous, micronized - File: FHWA_14147.raw - Type: 2Th/Th locked - Start: 3.000 ° - End: 75.017 ° - Step: 0.016 ° - Step time: 97.5 s - Temp.: 25 °C (Room) - Time Started: 34 s - 2-Theta: 3.000 ° - Th
Lin
(C
ou
nts
)
0
1000
2000
3000
4000
5000
6000
7000
8000
9000
10000
11000
12000
13000
14000
15000
16000
17000
18000
19000
20000
21000
22000
23000
24000
25000
26000
27000
28000
29000
30000
31000
32000
33000
34000
35000
36000
37000
38000
39000
40000
2-Theta - Scale
3 10 20 30 40 50 60 70

95
This
pu
blic
atio
n is
availa
ble
free o
f charg
e fro
m: h
ttps://d
oi.o
rg/1
0.6
028
/NIS
T.T
N.1
963
Dolomitic Limestone:
Primarily dolomite with minor quartz inclusions
15006, Purdue Limestone, micronized
00-005-0490 (D) - Quartz, low - alpha-SiO2 - Y: 13.89 % - d x by: 1. - WL: 1.5406 - Hexagonal - a 4.91300 - b 4.91300 - c 5.40500 - alpha 90.000 - beta 90.000 - gamma 120.000 - Primitive - P3121 (152) - 3 - 112.985
00-036-0426 (*) - Dolomite - CaMg(CO3)2 - Y: 93.29 % - d x by: 1. - WL: 1.5406 - Rhombo.H.axes - a 4.80920 - b 4.80920 - c 16.02000 - alpha 90.000 - beta 90.000 - gamma 120.000 - Primitive - R-3 (148) - 3 - 320.8
Operations: Displacement 0.102 | Displacement 0.125 | Import
15006, Purdue Limestone, micronized - File: FHWA_15006.raw - Type: 2Th/Th locked - Start: 2.946 ° - End: 74.974 ° - Step: 0.016 ° - Step time: 97.5 s - Temp.: 25 °C (Room) - Time Started: 25 s - 2-Theta: 2.946 ° -
Lin
(C
ou
nts
)
0
1000
2000
3000
4000
5000
6000
7000
8000
9000
10000
11000
12000
13000
14000
15000
16000
17000
18000
19000
20000
21000
22000
23000
24000
25000
26000
27000
28000
29000
30000
31000
32000
33000
2-Theta - Scale
3 10 20 30 40 50 60 70

96
This
pu
blic
atio
n is
availa
ble
free o
f charg
e fro
m: h
ttps://d
oi.o
rg/1
0.6
028
/NIS
T.T
N.1
963
Meta-Basalt:
Anorthite (plagioclase feldspar) with chlorite and amphibole
FHWA 14297, Noname, micronized
00-012-0301 (D) - Anorthite, ordered - CaAl2Si2O8 - Y: 133.97 % - d x by: 1. - WL: 1.5406 - Triclinic - a 8.18400 - b 12.86500 - c 14.15000 - alpha 92.280 - beta 115.900 - gamma 91.620 - Primitive - P-1 (2) - 8 - 1337
01-073-1135 (C) - Amphibole - Al3.2Ca3.4Fe4.0K.6Mg6.0Na1.0Si12.8O44 (OH)4 - Y: 140.90 % - d x by: 1. - WL: 1.5406 - Monoclinic - a 9.89000 - b 18.03000 - c 5.31000 - alpha 90.000 - beta 105.200 - gamma 90.00
01-071-0821 (C) - Chlorite - Al4.5(Al.8Si3.2)O10(OH)8 - Y: 64.51 % - d x by: 1. - WL: 1.5406 - Monoclinic - a 5.17400 - b 8.95600 - c 14.26000 - alpha 90.000 - beta 97.833 - gamma 90.000 - Base-centered - C2 (5) -
Operations: X Offset 0.013 | X Offset -0.026 | Import
FHWA 14297, Noname, micronized - File: FHWA_14297.raw - Type: 2Th/Th locked - Start: 3.000 ° - End: 75.017 ° - Step: 0.016 ° - Step time: 97.5 s - Temp.: 25 °C (Room) - Time Started: 26 s - 2-Theta: 3.000 ° - Th
Lin
(C
ou
nts
)
0
1000
2000
3000
4000
5000
6000
7000
8000
9000
2-Theta - Scale
4 10 20 30 40 50 60 70

97
This
pu
blic
atio
n is
availa
ble
free o
f charg
e fro
m: h
ttps://d
oi.o
rg/1
0.6
028
/NIS
T.T
N.1
963
High Absorption Limestone:
Primarily calcite with minor quartz inclusions
14319, High Absorption Limestone, micronized
00-005-0490 (D) - Quartz, low - alpha-SiO2 - Y: 15.50 % - d x by: 1. - WL: 1.5406 - Hexagonal - a 4.91300 - b 4.91300 - c 5.40500 - alpha 90.000 - beta 90.000 - gamma 120.000 - Primitive - P3121 (152) - 3 - 112.985
00-047-1743 (C) - Calcite - CaCO3 - Y: 34.62 % - d x by: 1. - WL: 1.5406 - Rhombo.H.axes - a 4.98960 - b 4.98960 - c 17.06100 - alpha 90.000 - beta 90.000 - gamma 120.000 - Primitive - R-3c (167) - 6 - 367.847 - F
Operations: Displacement 0.146 | Import
14319, High Absorption Limestone, micronized - File: FHWA_14319.raw - Type: 2Th/Th locked - Start: 2.923 ° - End: 74.956 ° - Step: 0.016 ° - Step time: 97.5 s - Temp.: 25 °C (Room) - Time Started: 26 s - 2-Theta: 2
Lin
(C
ou
nts
)
0
10000
20000
30000
40000
2-Theta - Scale
3 10 20 30 40 50 60 70