influence of additives on phase stabilization of scandia ... · eliana navarro dos santos muccillo...
TRANSCRIPT

ISSN 1517-7076 artigo e11822, 2017
Corresponding Author : Eliana Navarro dos Santos Muccillo Received on: 13/07/2016 Accepted on: 07/03/2017
10.1590/S1517-707620170002.0154
Influence of additives on phase stabilization of scandia-doped zirconia
Eliana Navarro dos Santos Muccillo 1, Robson Lopes Grosso
1
Shirley Leite dos Reis 1, Reginaldo Muccillo
1
1 Energy and Nuclear Research Institute - IPEN – PO Box 11049 – 05422-970, S. Paulo, SP
e-mail: [email protected]; [email protected]; [email protected]; [email protected]
ABSTRACT
The effects of small additions of tin, zinc, calcium and boron oxides on phase composition and electrical
conductivity of zirconia-10 mol% scandia were investigated. Compounds containing 1 mol% zinc, tin and
calcium oxides and 1, 3 and 5 wt.% boron oxide were prepared by solid state reaction and characterized by
X-ray diffraction, density measurements, scanning electron microscopy and impedance spectroscopy. Full
stabilization of the cubic structure at room temperature was obtained with additions of 1 mol% calcium oxide
and 2 wt.% boron oxide. Partially stabilized compounds exhibit herringbone structure, characteristic of the β-
rhombohedric phase. Specimens with calcium as additive show total conductivity of 23.8 mS.cm-1
at 750ºC
with activation energy of 1.13 eV. Liquid phase sintering by boron oxide addition is effective to enhance the
densification of the solid electrolyte.
Keywords: scandia-doped zirconia, phase stabilizer, sintering aid, ionic conductivity.
1. INTRODUCTION
The combination of high ionic conductivity, wide electrolytic domain and low electronic conductivity turns
the scandia stabilized zirconia, ScSZ, solid electrolyte a promising candidate for replacing yttria stabilized
zirconia for application in solid oxide fuel cells operating at intermediate temperatures, typically 800ºC [1-3].
The higher ionic conductivity of ScSZ is found for scandia contents of 8-10 mol% [3]. Nevertheless, the
phase diagram of this solid electrolyte reveals a thermal degradation of the cubic phase for scandia contents
up to 9-10 mol% giving rise to the tetragonal polymorph. Moreover, for higher scandium contents, the cubic
to -rhombohedric phase transition readily occurs. Both, tetragonal and rhombohedric phases exhibit lower
ionic conductivity than that of the high symmetry cubic structure [2,3].
Then, up to date, one of the main goals has been to stabilize the cubic phase at room temperature.
One approach to accomplish that is by the introduction of a second additive. In this context, continuing ef-
forts have been made to find a suitable additive allowing for phase stabilization without excessive deteriora-
tion of the ionic conductivity. The additives investigated include those oxides with relatively high solubility
such as rare earths [4-8] and other oxides [9-12].
So far, the higher ionic conductivity, amounting ~ 18 mS.cm-1
at 600ºC, was found for the system zir-
conia-10 mol% scandia-1 mol% ceria [10]. However, it was found that the cubic phase transforms on the
surface of the solid electrolyte to monoclinic via tetragonal phase during operation at 900ºC of a tubular-type
SOFC [13]. Conductivity degradation of this electrolyte was also observed at 600ºC during long-term opera-
tion in humidified mixture of H2/N2 and humidified H2 [14].
In this work, small amounts of tin, zinc and calcium oxides as phase stabilizer, and boron oxide as sin-
tering aid were added to zirconia-10 mol% scandia and their effects on structure, microstructure and ionic
conductivity were investigated.
2. MATERIALS AND METHODS
2.1 Materials preparation
MUCCILLO, E.N.S.; GROSSO, R.L.; REIS, S.L.; MUCCILLO, R. revista Matéria, v. 22, n. 2, 2017.
Zirconia-10 mol% scandia, ScSZ (Daiichi Kigenso Kagaku Kogyo, Japan), SnO (Alfa Aesar,
99.9%), CaCO3 (Vetec, 99%), zinc stearate (Zn(C18H35O2)2) and boron oxide (B2O3, Alfa Aesar 99.9%) were
the starting materials. The investigated composition was ZrO2-10 mol% Sc2O3-1 mol% A (A=Zn, Sn, Ca)
and 1, 3 and 5 wt.% B2O3.
The starting materials were weighted in the stoichiometric proportion and mixed together in alcoholic
medium followed by drying at 40ºC for 1 h. Cylindrical specimens were prepared by uniaxial (50 MPa)
followed by isostatic (100 MPa) pressing. The sintering of the green compacts was carried out at 1500ºC for
5 h in a resistive furnace (Lindberg BlueM, 51524) with heating and cooling rates of 5 and 30 ºC.min-1
, re-
spectively. Specimens containing calcium and zinc were first heated up to 800ºC for 1 h for precursor de-
composition. Specimens with boron oxide addition were sintered at 1500oC for 4 h. Sintered specimens are
named 10Sc1ASZ standing for zirconia-10 mol% scandia-x mol% additive. The experimental procedure for
boron oxide was similar to that of other additives. In this case the prepared compositions were zirconia-10
mol% scandia-y wt.% B2O3 with y=1, 2, 3 and 5.
2.2 Characterization methods
The apparent density of sintered specimens was determined by measuring sample dimensions and mass and
compared to the theoretical value calculated from the lattice parameters of the several compositions. Phase
characterization was performed by room temperature X-ray diffraction, XRD (Bruker-AXS, D8 Advance) in
the 20-80º 2 range with Ni filtered Cu Kα radiation (=1.5405 Å). Indexing of diffraction profiles was per-
formed by comparison of XRD patterns with those of JCPDF 89-5483 and 511604 files for cubic and rhom-
bohedric phases, respectively. The microstructure of sintered specimens was observed by field emission
scanning electron microscopy, FEG-SEM (FEI, Inspect F50) on polished and thermally etched surfaces. The
ionic conductivity was measured by two-probe electrochemical impedance spectroscopy (HP4192A), with
100 mV of applied signal in the 13 MHz-5 Hz frequency range. Silver and platinum were used as electrode
materials for electrical measurements in the low (< 600ºC) and high ( 600ºC) temperature ranges, respec-
tively. Special software was used for data collecting and analysis [15].
3. RESULTS AND DISCUSSION
3.1 Zirconia-10 mol% scandia-1 mol% SnO2, ZnO and CaO
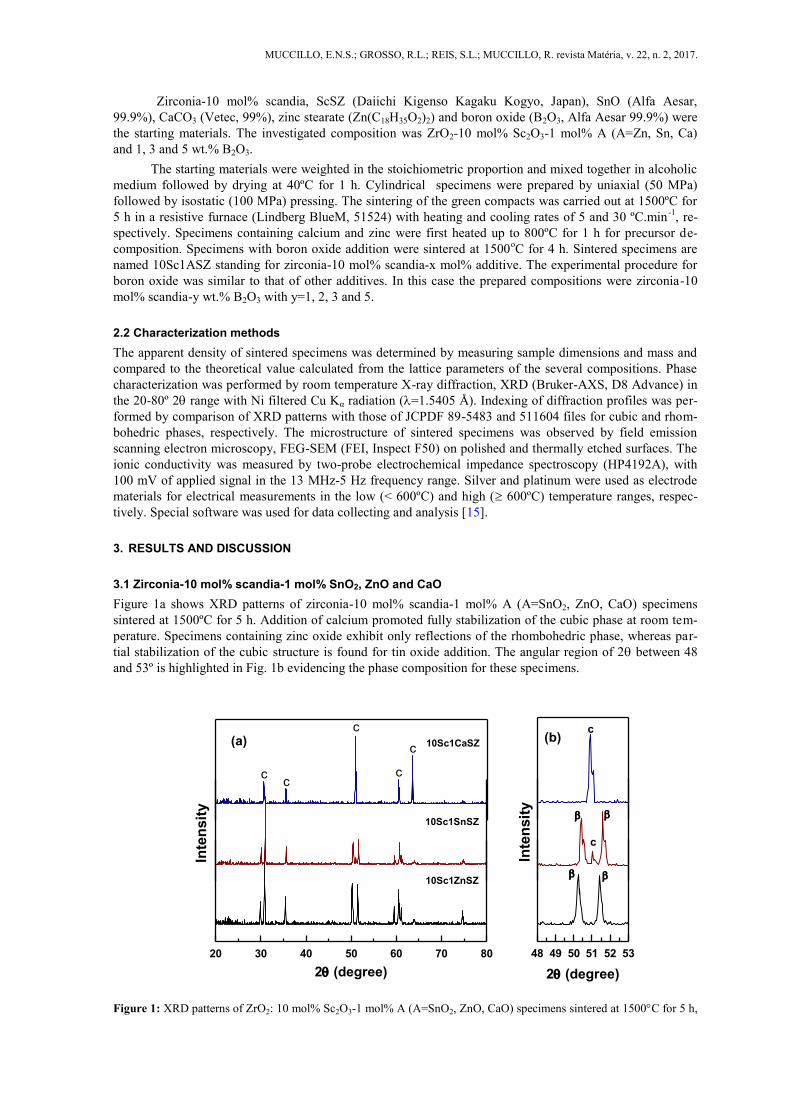
Figure 1a shows XRD patterns of zirconia-10 mol% scandia-1 mol% A (A=SnO2, ZnO, CaO) specimens
sintered at 1500ºC for 5 h. Addition of calcium promoted fully stabilization of the cubic phase at room tem-
perature. Specimens containing zinc oxide exhibit only reflections of the rhombohedric phase, whereas par-
tial stabilization of the cubic structure is found for tin oxide addition. The angular region of 2 between 48
and 53º is highlighted in Fig. 1b evidencing the phase composition for these specimens.
20 30 40 50 60 70 80
10Sc1CaSZ
10Sc1SnSZ
10Sc1ZnSZ
2 (degree)
Inte
nsit
y
(a)c
cc
c
c
48 49 50 51 52 53
2 (degree)
c
Inte
nsit
y
(b)c
Figure 1: XRD patterns of ZrO2: 10 mol% Sc2O3-1 mol% A (A=SnO2, ZnO, CaO) specimens sintered at 1500C for 5 h,

MUCCILLO, E.N.S.; GROSSO, R.L.; REIS, S.L.; MUCCILLO, R. revista Matéria, v. 22, n. 2, 2017.
in the (a) 20-80 and (b) 48-53 2 ranges; c and β stand for the cubic and rhombohedric phases, respectively.
Table 1 lists values of relative density (in %) and phase composition (c=cubic, =rhombohedric) of
sintered specimens. It is remarkable the effect of the additive on microstructure. Zinc oxide does not promote
phase stabilization and decreases the sintered density. Addition of calcium oxide is effective for the cubic
phase stabilization at room temperature. Tin oxide promotes partial stabilization of the cubic phase with good
densification.
Table 1: Values of relative density and phase composition (c=cubic, =rhombohedric) of 10Sc1ASZ (A=Sn, Zn, Ca)
sintered specimens.
SPECIMEN RELATIVE DENSITY
(%)
PHASE COMPOSITION MEAN GRAIN SIZE
(µm)
10Sc1SnSZ 97 + c 10.0
10Sc1ZnSZ 89 11.4
10Sc1CaSZ 97 C 12.5
Figure 2 shows FEG-SEM micrographs of sintered specimens of 10Sc1ASZ (A=Sn, Zn and Ca). The
microstructure of sintered specimens consists of micrometer sized grains (Table 1). The herringbone struc-
ture, characteristic of the cubic-to-rhombohedric phase transition, is seem in the micrographs of specimens
containing zinc and tin oxides, Figures 2a and 2b, respectively.
Figure 2: FEG-SEM micrographs of 10Sc1ASZ. A: (a) Zn, (b) Sn, and (c) Ca.
These results indicate that calcium is a suitable phase stabilizer for zirconia-scandia electrolyte. Then,
we investigated the electrical conductivity of this ternary system by impedance spectroscopy measurements.
Figure 3 shows typical impedance diagram for 10Sc1CaSZ collected at 400ºC, consisting of bulk (high fre-
quency) and grain boundary (intermediate frequency) components of the electrolyte resistivity. In this figure,
(a) (b)
(c)

MUCCILLO, E.N.S.; GROSSO, R.L.; REIS, S.L.; MUCCILLO, R. revista Matéria, v. 22, n. 2, 2017.
the original data was normalized for specimen dimensions. Then, the diameter of the high frequencies semi-
circle stands for the electric resistivity of the bulk (or grains), and that at intermediate frequencies the inter-
grain resistivity.
Figure 3: Impedance spectroscopy diagram of 10 Sc1CaSZ at 400ºC.
The Arrhenius plot of the total ionic conductivity of 10Sc1CaSZ is shown in Figure 4. In the low tem-
perature range, the total conductivity is higher than that of zirconia-10 mol% scandia, whereas the opposite
trend is verified in the high temperature range. For example, at 600ºC, amounts 3.8 (10Sc1CaSZ) and 0.51
(ScSZ) mS.cm-1
, and at 750ºC, is equal to 23.8 (10Sc1CaSZ) and 37.9 (ScSZ) mS.cm-1
.
Figure 4: Arrhenius plots of total ionic conductivity of 10Sc1CaSZ.
In the whole temperature range of measurements, a single activation energy value for conduction was
determined for 10Sc1CaSZ, 1.13 eV.
3.1 Zirconia-10 mol% scandia-1-5 wt.% B2O3
Figure 5 shows XRD patterns of zirconia-10 mol% scandia-1 to 5 wt.% B2O3 specimens sintered at 1500ºC
for 4 h. Addition of 2 wt.% boron oxide promoted fully stabilization of the cubic phase at room temperature.
0 100 200 300 4000
100
200
7
6 54
3
2
400°C-Z
'' (k
Oh
m)
Z' (kOhm)
1000/T (K-1
)
0.9 1.0 1.1 1.2 1.3 1.4
Lo
g
T (
T:
S c
m-1
K)
-1.0
-0.5
0.0
0.5
1.0
1.5
2.0

MUCCILLO, E.N.S.; GROSSO, R.L.; REIS, S.L.; MUCCILLO, R. revista Matéria, v. 22, n. 2, 2017.
10 20 30 40 50 60 70 80
5%
3%
2%
Inte
nsit
y
2(degree)
1%
Figure 5: XRD patterns of ZrO2: 10 mol% Sc2O3-1 to 5 wt.% B2O3 specimens sintered at 1500C for 4 h; β stands for the
rhombohedric phase.
Figure 6 shows FEG-SEM micrographs of sintered specimens of 10ScSZ sintered with addition of 1,
2, 3 and 5 wt.% B2O3. The microstructure of sintered specimens consists of micrometer sized grains. Boron
oxide promoted densification via liquid phase sintering and porosity due to the capillary evolution of liquid
boron oxide towards the pellet surface.
Figure 6: FEG-SEM micrographs of 10ScSZ + y wt.% B2O3, y = 1 (a), 2 (b), 3 (c) e 5 (d), sintered at 1500ºC/4 h.
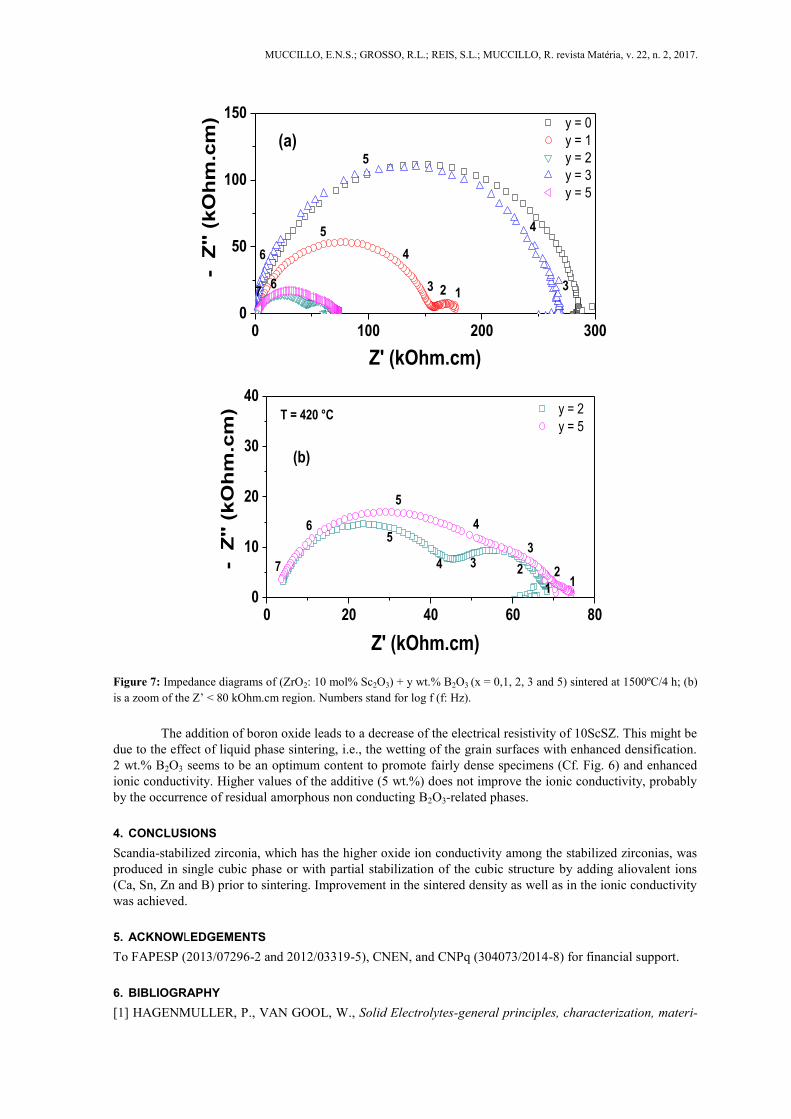
Figure 7 shows impedance diagrams of specimens containing boron oxide measured at 420ºC consist-
ing of bulk and grain boundary components of the electrolyte resistivity.
MUCCILLO, E.N.S.; GROSSO, R.L.; REIS, S.L.; MUCCILLO, R. revista Matéria, v. 22, n. 2, 2017.
0 100 200 3000
50
100
150
123
4
5
6 3
5
4
7
y = 0
y = 1
y = 2
y = 3
y = 5-
Z'' (
kO
hm
.cm
)
Z' (kOhm.cm)
6
(a)
0 20 40 60 800
10
20
30
40
1
234
5
12
3
4
5
6
y = 2
y = 5
- Z
'' (
kO
hm
.cm
)
Z' (kOhm.cm)
T = 420 °C
7
(b)
Figure 7: Impedance diagrams of (ZrO2: 10 mol% Sc2O3) + y wt.% B2O3 (x = 0,1, 2, 3 and 5) sintered at 1500ºC/4 h; (b)
is a zoom of the Z’ < 80 kOhm.cm region. Numbers stand for log f (f: Hz).
The addition of boron oxide leads to a decrease of the electrical resistivity of 10ScSZ. This might be
due to the effect of liquid phase sintering, i.e., the wetting of the grain surfaces with enhanced densification.
2 wt.% B2O3 seems to be an optimum content to promote fairly dense specimens (Cf. Fig. 6) and enhanced
ionic conductivity. Higher values of the additive (5 wt.%) does not improve the ionic conductivity, probably
by the occurrence of residual amorphous non conducting B2O3-related phases.
4. CONCLUSIONS
Scandia-stabilized zirconia, which has the higher oxide ion conductivity among the stabilized zirconias, was
produced in single cubic phase or with partial stabilization of the cubic structure by adding aliovalent ions
(Ca, Sn, Zn and B) prior to sintering. Improvement in the sintered density as well as in the ionic conductivity
was achieved.
5. ACKNOWLEDGEMENTS
To FAPESP (2013/07296-2 and 2012/03319-5), CNEN, and CNPq (304073/2014-8) for financial support.
6. BIBLIOGRAPHY
[1] HAGENMULLER, P., VAN GOOL, W., Solid Electrolytes-general principles, characterization, materi-

MUCCILLO, E.N.S.; GROSSO, R.L.; REIS, S.L.; MUCCILLO, R. revista Matéria, v. 22, n. 2, 2017.
als, applications, New York, Academic Press, 1978.
[2] SUBBARAO, E. C., Solid Electrolytes and their applications, New York, Plenum, 1980.
[3] BADWAL, S. P. S., CHIACHI, F. T., MILOSEVIC, D., “Scandia-zirconia electrolytes for intermediate
temperature solid oxide fuel cell operation”, Solid State Ionics, v. 136-137, PP. 91-99, 2000.
[4] YAMAMOTO, O., ARATI, Y., TAKEDA, Y., et al., “Electrical conductivity of stabilized zirconia with
ytterbia and scandia”, Solid State Ionics, v. 79, pp. 137-142, 1995.
[5] POLITOVA, T., I., IRVINE, J. T. D., “Investigation of scandia-yttria-zirconia system as an electrolyte
material for intermediate temperature fuel cells-influence of yttria content in the (Y2O3)x((Sc2O3)(11-
x)(ZrO2)8.9”, Solid State Ionics, v., 168, pp. 153-165, 2004.
[6] LEE, D.S., KIM, W. S., CHOI, S. H., et al., “Characterization of ZrO2 co-doped with Sc2O3 and CeO2
electrolyte for the application of intermediate temperature SOFCs”, Solid State Ionics, v. 176, pp. 33-39,
2005.
[7] ABBAS, H. A., ARGIRUSIS, C., KILO, M., et al., “Preparation and conductivity of ternary scandia-
stabilised zirconia”, Solid State Ionics, v. 184, pp. 6-9, 2011.
[8] GROSSO, R. L., MATOS, J. R., MUCCILLO, E. N. S., “Thermal and spectroscopic characterization of
nanostructured zirconia-scandia-dysprosia”, J. Therm. Anal. Calorim., v. 117, pp. 567-572, 2014.
[9] VARANASI, C., JUNEJA, C., CHEN, C., et al., “Electrical conductivity enhancement in heterogeneously
doped scandia-stabilised zirconia”, J. Power Sources, v. 147, pp.128-135, 2005.
[10] OMAR, S., NAJIB, W. B., CHEN., et al., “Electrical conductivity of 10 mol% Sc2O3-1 mol% M2O3-
ZrO2 ceramics”, J. Am. Ceram. Soc., v. 95, pp. 1965-1972, 2012.
[11] GROSSO, R. L., MUCCILLO, R., MUCCILLO, E. N. S., “Stabilization of the cubic phase in zirconia-
scandia by niobium oxide addition”, Mater. Lett., v. 134, pp. 27-29, 2014.
[12] STANDAR, O. C., SORREL, C. C., “Densification of zirconia - conventional methods”, Key Eng. Ma-
ter., v. 153-154, pp. 251-300, 1998.
[13] SHIMAZU, M., ISOBE, T., ANDO, S., et al., “Stability of Sc2O3 and CeO2 co-doped ZrO2 electrolyte
during operation of solid oxide fuel cells”, Solid State Ionics, v. 182, pp. 120-126, 2011.
[14] OMAR, S., BELDA, A., ESCARDINO, A., et al., “Ionic conductivity ageing investigation of
1Ce10ScSZ in different partial pressures of oxygen”, Solid State Ionics, v. 184, pp. 2-5, 2011.
[15] KLEITZ, M., KENNEDY, J. H., “Resolution of multi-components components impedance diagram”, In:
Vashishta, P., Mundy, J. N., Shenoy, G. K. (eds), Fast Ion Transport in Solids, Electrodes and Electrolytes,
p.185-188, North-Holland, Amsterdam, 1979.