inflation report - central reserve bank of peru peru in terms of competitiveness indices ......
TRANSCRIPT

....... �
Central Reserve Bank of Peru
..................................................................................................................................................................................................................................................
CENTRAL RESERVE BANK OF PERU
INFLATION
REPORT:
September 2007
Recent trends and macroeconomic forecasts

Inflation Report. September 2007
..................................................................................................................................................................................................................................................
� .......
INFLATION REPORT:
Recent trends andmacroeconomic forecasts
September 2007
Central Reserve Bank of Peru441-445 Antonio Miro Quesada. Lima 1Telephone: 613-2000 - Fax: 311-1400
Mail: [email protected]
....... �
Central Reserve Bank of Peru
..................................................................................................................................................................................................................................................
This Inflation Report was drawn up using data on gross domestic product, trade balance and operations of the non-financial public sector up to July 2007, data on monetary accounts up to August 2007, and data on inflation and exchange up to September 2007.
Content
Page
FoRewoRd .............................................................................................. 5
SummARy ................................................................................................. 7
I. monetary policy .................................................................................. ��
II. International environment ................................................................... 17
III. Inflation ............................................................................................... �6
IV. economic activity ............................................................................... 4�
V. Balance of payments .......................................................................... 54
VI. Public finance ..................................................................................... 66
VII. Financial markets ............................................................................... 74
VIII. Balance of risks .................................................................................. 87
BoxeS
l Recent developments in the international financial markets .............. �4
l Supply shocks and inflation targets .................................................... 37
l Price increases in food products and inflationary pressures .............. �8
l Recent growth of consumption in the private sector .......................... 5�
l electricity supply in 2008-2009 .......................................................... 5�
l outlook on the balance of payments .................................................. 6�
l macroeconomic risks and fiscal policy: 2007-2009 ............................ 71
l Sources of changes in the public debt ............................................... 73
l Peru in terms of competitiveness indices ........................................... 84
l exchange rate coverage: dollar forwards ........................................... 86

Inflation Report. September 2007
..................................................................................................................................................................................................................................................
4 .......

....... 5
Central Reserve Bank of Peru
..................................................................................................................................................................................................................................................
Foreword
l According to the Peruvian Constitution, the Central Reserve Bank of Peru (BCRP) is a public autonomous entity whose role is to preserve monetary stability. By doing so, the Central Bank contributes to establish the necessary stable macroeconomic conditions required for the economic development of the country.
l In order to consolidate this goal, since 2002 the Bank has
implemented its monetary policy based on an inflation targeting scheme. As of this year, the inflation target has been reduced from 2.5 to 2.0 percent, plus or minus one percentage point (between 1.0 percent and 3.0 percent). The reduction of the Central Bank’s inflation target contributes to anchor inflation expectations at the level of inflation in developed countries and also expresses the BCRP’s commitment with monetary stability, regardless of temporary shifts caused by factors beyond the control of monetary policy.
l Until 2005, compliance with the inflation target was measured through the annual change observed in the Consumer Price Index for Metropolitan Lima by December. Since January 2006, this is measured in a more continuous manner, that is, last twelve-month inflation is measured every month and not only in December each year. In the event of any deviation of inflation from the target, the Central Bank implements the necessary measures to return inflation to the target considering the lags with which monetary policy operates.
l At the beginning of each month, and according to the schedule announced in January, the Board of the BCRP approves a reference rate for the interbank lending market. This interest rate affects the entire array of domestic economic variables and inflation through several channels in different timeframes and, therefore, this rate has to be determined on the basis of forecast studies and macroeconomic simulations.

Inflation Report. September 2007
..................................................................................................................................................................................................................................................
6 .......
l The economic studies based on which monetary policy decisions are made are disseminated to generate the public’s understanding of the consistency of the decisions adopted, and to ensure that economic agents’ expectations take these forecasts and simulations into account. With this aim, the Central Bank publishes its Inflation Report every four months. The previous Inflation Report was released on June 8 this year and the next Inflation Report will be published on February 8, 2008.
l This Inflation Report analyzes the evolution of the main economic developments so far this year. The forecast scenario included herein is consistent with monetary policy lags during the 2007-2009 macroeconomic forecast horizon.

....... 7
Central Reserve Bank of Peru
..................................................................................................................................................................................................................................................
Summary
i. Inflation has been above the rate forecast in our previous Inflation Report of May -last twelve-month inflation increased from 0.9 percent in May to 2.8 percent in September- due to the higher magnitude and longer duration of the period of rises seen in the international prices of fuel and inputs used for the production of food products, such as wheat, maize and soy bean. Last twelve-month imported inflation rose from 0.6 percent in May to 6.1 percent in September. These rises should not have a permanent impact on inflation as long as they do not affect the expectations of economic agents or extend to other prices in the economy. In this sense, the BCRP communiqués on the Monetary Program have emphasized that the Central Bank will continue to oversee the evolution of prices, distinguishing the factors that have a temporary impact from those with permanent effects.
ii. The Board of the Central Bank decided to raise the monetary policy reference rate for the interbank market by 25 basis points each time in both July and September, as a result of which this rate has increased from 4.5 percent in May to 5.0 percent today. This gradual withdrawal of monetary stimulus is a preventive measure that considers monetary policy lags and is aimed at preventing the high growth of domestic demand from generating inflationary pressures and at maintaining inflation expectations anchored. In October the Board of Directors of the BCRP approved to maintain the monetary policy reference rate at 5.0 percent.
iii. In this period, core inflation -trend indicator of price evolution- increased from 1.5 percent in May to 2.1 percent in September, close to the target, after having posted rates ranging between 1.3 and 1.5 percent since mid-2006. This acceleration is explained by the higher prices of imported inputs. The information gathered through the surveys carried out with firms shows that a larger percentage of these companies are facing cost pressures that are associated with input prices and that most firms have transferred these higher
Inflation Report. September 2007
..................................................................................................................................................................................................................................................
8 .......
costs to prices. This evolution takes place in a context of high growth of domestic demand (10.9 percent between January and July 2007), offset by the higher productive capacity resulting both from increased investment and productivity, as well as from the strengthening of the Nuevo Sol and from inflation expectations that are anchored to the BCRP’s inflation target.
iv. According to the central scenario used for the forecasts presented herein, inflation in the next months should be close to the upper band of the target range (3.0 percent) due to the shocks that are currently being experienced, converging thereafter to the 2.0 percent target by the second half of 2008. Our macroeconomic forecasts have been revised considering the latest developments observed in the global economy, as well as the recent evolution of the main domestic macroeconomic indicators.
v. Domestic demand continues to show significant increases, growing at a faster pace than the output. Particularly, private consumption and private investment have maintained a high pace of growth, reflecting the optimism of consumers and business in a context of high growth of national disposable income, high prices for our main export commodities, and the low cost of credit. This dynamic performance of domestic demand has been coupled by increased imports, particularly imports of capital goods, which grew 45 percent between January and July 2007. Considering this evolution, our forecast on GDP growth has been revised from 7.2 to 7.6 percent for 2007.
However, a less favorable international environment in 2008 is expected to influence a lower growth of the disposable income, thus moderating the drive of demand towards still higher but more sustainable rates in the long-term.
vi. New developments have been seen in the international scenario in recent months. First, uncertainty regarding the quality of the subprime mortgage portfolio has affected the liquidity of the financial assets supported by this type of assets, spreading this effect onto the investors and financial entities holding them. In order to prevent this liquidity problem from extending into a situation of credit constraint (or credit crunch), the central banks of developed countries have been injecting liquidity into their markets. Second -and partly associated with the latter-, growth forecasts in the United States have been revised downwards. These two elements explain the Federal Reserve’s decision to reduce its rediscount rate by 50 basis points both in August and September, as well as its decision to reduce its reference interest rate by 50 basis points in September. These decisions have been made although fears

....... 9
Central Reserve Bank of Peru
..................................................................................................................................................................................................................................................
of an increase of inflation in the US economy have not totally subsided.
Despite these recent developments, the forecast on global growth remains at the same level as that of our Inflation Report of May, mainly due to the fact that China continues to show a robust growth. The latter has also led us to revise the forecast on the growth of terms of trade in 2007 from an increase of 1.9 percent in our Inflation Report of May to an increase of 3.0 percent in this Report. The forecast scenario for 2008 and 2009 considers similar levels as the ones foreseen in our May Report, which already anticipated a slow down of global growth. Due to uncertainty about the evolution of these events in international financial markets, the forecasts on global growth are biased downwards in the base scenario.
vii. The current account of the balance of payments is expected to show a surplus of 1.3 percent of GDP in 2007, as indicated in our Inflation Report of May. With a less favorable international context due to the reversal of the trend observed in terms of trade, the current account should show a slight and sustainable deficit of 0.4 and 0.9 percent of GDP in 2008 and 2009 respectively.
viii. The conduct of the fiscal stance continued to reflect the good performance of tax revenues. This was associated with the prices of exports and the dynamism of economic activity, as well as with a lower pace of public spending. Thus, the fiscal surplus of the Non-Financial Public Sector (NFPS) in the July 2006 - June 2007 period was 3.1 percent of GDP (2.1 percent in 2006).
Because of this result and considering that the Free Trade Agreement with the United States should come into force between 2008 and 2009, the forecast on the fiscal surplus for 2007 has been revised from 1.2 to 2.0 percent of GDP, while this surplus is estimated to reach 1.0 and 0.3 percent in 2008 and 2009 respectively. These forecasts consider that the real growth of the public sector’s non-financial expenditure will be higher than the expansion of economic activity in the next two years.
ix. The evolution of nominal exchange rate continued to reflect the favorable performance of external accounts, the ongoing process of financial dedollarization in the country, and the weakness of the US dollar in international markets. The Central Bank continued to intervene in the exchange market with the purpose of offsetting volatility in this market, of accumulating international reserves and of compensating the sales of foreign currency to the public treasury. The weakening of the dollar -a phenomenon observed in all markets- continued after the
Inflation Report. September 2007
..................................................................................................................................................................................................................................................
10 .......
Federal Reserve (FED) decided to lower its interest rate by 50 basis points.
x. The main risks that could lead inflation forecasts away from the central scenario include the following:
l Increased prices of imported food products: The central scenario considers that the supply/demand imbalances of food commodities will decline along the forecast horizon. However, there is a risk that high prices might persist for a longer period of time or increase even further, should supply conditions deteriorate or should the demand for biofuels increase even more. This would cause the domestic prices of food products to increase.
In such a case, the BCRP would maintain its monetary policy stance as long as inflation expectations remain anchored to the inflation target.
l Higher international prices of petroleum: The central forecast considers a partial reversal of the recent rises seen in the international prices of fuel. A scenario with higher upward volatility in the oil market would increase the price of fuel above the levels considered in the forecast scenario.
In the event of such a supply shock, the BCRP would only react if prices increased in a generalized and sustained manner, and if inflation expectations should shift towards levels that are not consistent with the inflation target.
l Increased external financial volatility: The international environment remains favorable in the forecast horizon, with a gradual upward reversal in terms of trade, a transitory slowdown in the US economy, and with other countries, particularly Asia, growing at high rates. A situation of recession in the United States involving a severe correction in the prices of export commodities could imply, depending on the movement of external capitals in emerging economies, a depreciation of the Nuevo Sol and a downward impulse in the dynamism of our economy thereafter.
l Greater expansion of demand: A higher growth of domestic demand would translate into an impulse on the components of inflation that are most sensitive to demand fluctuations. In this case, the Central Bank would raise the reference rate to keep inflation under control.
l Constraints in the supply of electricity: This report considers the risk of experiencing constraints in the supply

.......��
Central Reserve Bank of Peru
..................................................................................................................................................................................................................................................
of electric energy by the end of the forecast horizon. This would have an adverse impact on the rates and costs of firms.
Should this occur, the BCRP would maintain its monetary policy stance as long as inflation expectations continue to be in line with the inflation target.
l Higher pressures for the appreciation of the Nuevo Sol: In a scenario of increased appreciation of the Nuevo Sol which would pressure inflation downward below the inflation target, the Bank would maintain the current reference rate for a longer period of time or would reduce it.
Weighing the various risks both upwards and downwards against the baseline scenario shows an upward balance in the case of the inflation forecast.

Inflation Report. September 2007
..................................................................................................................................................................................................................................................
�� .......
.......��
Central Reserve Bank of Peru
..................................................................................................................................................................................................................................................
Jan.02 Jan.03 Jan.04 Jan.05 Jan.06 Jan.07 Sep.07
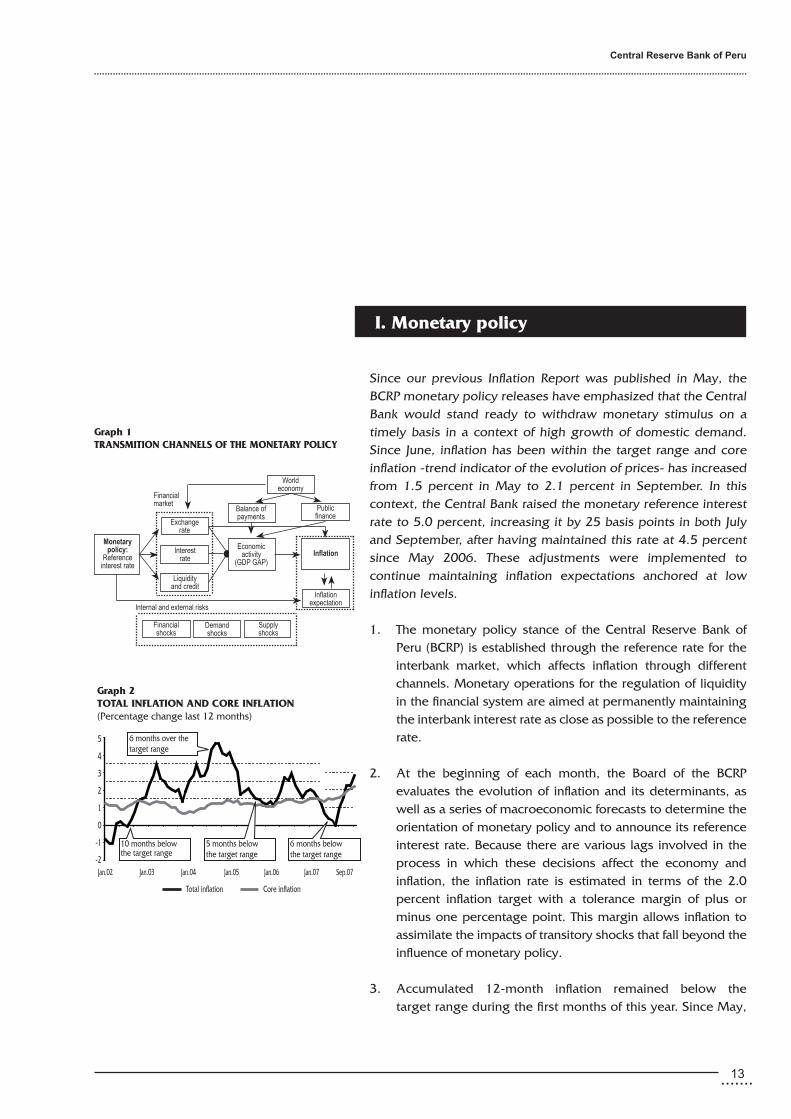
Graph 2 TOTAL INFLATION AND CORE INFLATION(Percentage change last 12 months)
5
4
3
2
1
0
-1
-2
6 months over thetarget range
Total inflation Core inflation
10 months belowthe target range
5 months belowthe target range
6 months belowthe target range
Graph 1 TRANSMITION CHANNELS OF THE MONETARY POLICY
I. Monetary policy
Since our previous Inflation Report was published in May, the BCRP monetary policy releases have emphasized that the Central Bank would stand ready to withdraw monetary stimulus on a timely basis in a context of high growth of domestic demand. Since June, inflation has been within the target range and core inflation -trend indicator of the evolution of prices- has increased from 1.5 percent in May to 2.1 percent in September. In this context, the Central Bank raised the monetary reference interest rate to 5.0 percent, increasing it by 25 basis points in both July and September, after having maintained this rate at 4.5 percent since May 2006. These adjustments were implemented to continue maintaining inflation expectations anchored at low inflation levels.
1. The monetary policy stance of the Central Reserve Bank of Peru (BCRP) is established through the reference rate for the interbank market, which affects inflation through different channels. Monetary operations for the regulation of liquidity in the financial system are aimed at permanently maintaining the interbank interest rate as close as possible to the reference rate.
2. At the beginning of each month, the Board of the BCRP evaluates the evolution of inflation and its determinants, as well as a series of macroeconomic forecasts to determine the orientation of monetary policy and to announce its reference interest rate. Because there are various lags involved in the process in which these decisions affect the economy and inflation, the inflation rate is estimated in terms of the 2.0 percent inflation target with a tolerance margin of plus or minus one percentage point. This margin allows inflation to assimilate the impacts of transitory shocks that fall beyond the influence of monetary policy.
3. Accumulated 12-month inflation remained below the target range during the first months of this year. Since May,
Financial market
Monetarypolicy:
Referenceinterest rate
exchangerate
Interestrate
Liquidityand credit
Supplyshocks
demandshocks
Financialshocks
economicactivity
(GdP GAP)Inflation
Publicfinance
worldeconomy
Balance ofpayments
Inflationexpectation
Internal and external risks

Inflation Report. September 2007
..................................................................................................................................................................................................................................................
�4 .......
Sep.03 Jan.04 May.04 Sep.04 Jan.05 May.05 Sep.05 Jan.06 May.06 Se.06 Jan.07 May.07 Sep.07
Graph 4 CENTRAL BANK INTERBANK INTEREST RATE1/
(In percentage)
5
4
3
2
1
0
Nominal Real ex ante
1/ The expected inflation to the end of the year is constructed with the information of the Consensus Forecast survey.
5
4
3
2
1
0
Sep.03 Jan.04 May.04 Sep.04 Jan.05 May.05 Sep.05 Jan.06 May.06 Sep.06 Jan.07 May.07 Sep.07
Graph 3 CENTRAL BANK REFERENCE INTEREST RATE(In percentage)
6
5
4
3
2
1
0
Period of increase of the core inflation
Pressures for lower inflation
Preventive withdrawof monetary stimulus
inflation started to converge towards the 2.0 percent target, mainly influenced by rises in the prices of food products and petroleum. On the other hand, core inflation -which excludes the most volatile components of the consumer basket- began to show an upward trend since mid-2006 and increased from an annual rate of 1.5 percent in May to 2.1 percent in September, after having remained at rates ranging between 1.3 and 1.5 percent over the last twelve months.
4. In the communiqués on the Monetary Programs for the months of April and May, the Board of Directors of the BCRP expressed concerns about the possible inflationary impact of a growth of domestic demand in a 12-18 month horizon and pointed out that monetary stimulus would be withdrawn on a timely basis if this trend continued. In June the Board expressed that the evolution of the balance between the high dynamism of domestic demand and productivity improvements was being closely followed in order to take action should this be required.
5. In the third quarter of 2007, the Board decided to raise the reference interest rate on two occasions, increasing it in July and September by 25 points each time to its current level of 5.0 percent. This gradual withdrawal of monetary stimulus is a preventive step adopted to maintain inflation expectations anchored, considering monetary policy lags in a context characterized by a robust growth of domestic demand (domestic demand increased 10.9 percent between January and July 2007).
6. Moreover, the price rises of fuel and some food products,
such as chicken, had an impact on inflation in the last months. As in previous episodes (like those that occurred in the first months of 2004 and 2006), these rises should have a transitory effect on the average growth of prices. Inflation is a monetary phenomenon defined as the process of price increases in the goods and services acquired by consumers. Therefore, monetary policy focuses on permanent and generalized price increases arising when the growth of spending is higher than the growth of the supply of goods and services.
7. The public’s expectations of inflation are still around the Central Bank’s inflation target, although the inflation expectations of financial entities for 2008 have increased from 2.0 to 2.2 percent between May and September, according to the results of the surveys carried out over the past few months. On the other hand, economic analysts and non-financial firms expect a rate of inflation of 2.0 percent.

.......�5
Central Reserve Bank of Peru
..................................................................................................................................................................................................................................................
COMMUNIQUES ON THE MONETARY PROGRAM: 2007
January: The Board of the BCRP approved to maintain the reference interest for the interbank market at 4.5 percent, considering that no inflationary pressures are expected in the short term and that the factors that have driven the inflation rate below the target range are transitory. These factors include the lower prices of fuels, of public utililities and of some food products which are expected to have a one-time impact on the inflation rate.
February: The Board of the BCRP approved to maintain the reference interest for the interbank market at 4.5 percent, considering that no inflationary pressures are expected in the short term and that the factors that have driven the inflation rate below the target range are transitory. These factors include the lower prices of fuels, of public utililities and of some food products.
March: The Board of the BCRP approved to maintain the reference interest for the interbank market at 4.5 percent, considering that no inflationary pressures are expected in the short term and that the factors that have driven the inflation rate below the target range are transitory. These factors include the lower prices of public utililities and of some food products.
April : The Board of the BCRP approved to maintain the reference interest for the interbank market at 4.5 percent. However, the Board expressed concerns about the possible inflationary impact that a growth of domestic demand exceeding the rates forecast by the Bank might have in a 12-18 month horizon. Therefore, should this trend persist, the Board would be inclined to withdraw monetary stimulus when deemed appropriate and on a timely basis.
May: The Board of the BCRP approved to maintain the interbank reference rate at 4.5 percent, but expressed concerns about a possible inflationary impact in a 12-18 month horizon due to a very high increase of domestic demand. Therefore, should inflationary pressures be observed, the Board will be inclined to withdraw monetary stimulus.
June: The Board of the BCRP decided to maintain the interbank reference rate at 4.5 percent, as inflation is in the lower band of the inflation target (between 1 and 3 percent) and core inflation remains stable at 1.5 percent. This evolution reflects a balance between a strong dynamism of domestic demand and improved productivity in the economy. The Board follows closely the evolution of these variables and their impact on inflation in a 12-18 month horizon in order to make any preventive adjustment in the monetary policy stance should this be required.
Inflation Report. September 2007
..................................................................................................................................................................................................................................................
�6 .......
July: The Board of the BCRP approved to raise the interbank reference rate from 4.50 to 4.75 percent. This preventive measure was adopted considering the lags with which monetary policy operates and in order to continue maintaining expectations anchored at low inflation levels, given the robust growth observed in terms of domestic demand. The Board will continue to oversee the evolution of inflation and its determinants, differentiating the factors that have temporary impacts from those with permanent effects. Moreover, given current macroeconomic data, the Board considers that this adjustment in the reference interest rate does not imply the beginning of a sequence of interest rate rises. August: The Board of the BCRP approved to maintain the interbank reference rate at 4.75 percent, but expressed concerns that the rises in the international prices of fuel and in some inputs used in the production of food products might reflect in inflationary expectations. These rises have a transitory impact on inflation. The Board will continue to oversee the evolution of inflation and its determinants, differentiating the factors that have temporary impacts from those with permanent effects.
Therefore, should expectations about inflation increase or should domestic demand increase to a level exceeding the gains resulting from productivity, the BCRP will implement additional preventive adjustments in the reference interest rate.
September: The Board of the BCRP approved to raise the monetary reference rate from 4.75 to 5.0 percent. This preventive measure is taken considering the lags with which monetary policy operates in order to continue maintaining expectations anchored at low inflation levels, in view of the robust growth shown by domestic demand in a context marked by an increase in the price of imported inputs. The Board will continue to oversee the evolution of inflation and its determinants, differentiating the factors that have temporary impacts from those with permanent effects.

.......17
Central Reserve Bank of Peru
..................................................................................................................................................................................................................................................
II. International environment
As considered in our May Report, the economy of the United States has been showing a moderate slow down. However, this evolution has been offset by the growth of China, Japan, Germany and some economies in the Latin American region -which have grown at a faster pace than previously expected. In most of these cases, this higher growth has been coupled by inflationary pressures, which were emphasized by the evolution of the international prices of food products and petroleum.
Additionally, a period of high volatility -associated with the deterioration of the US subprime mortgage segment- was seen in international financial markets since July. Particularly, credit conditions in the money market of developed economies deteriorated substantially, generating an atypical situation of illiquidity. In this context, most of the central banks in these economies have been increasing liquidity injection operations in order to prevent a contraction of credit. Moreover, in its meeting of September 18, the FED cut its monetary interest rate by 50 basis points. To date, this decision has significantly contributed to reduce volatility in the markets.
This recent evolution accentuated expectations of a slow down in the US economy, beyond the estimates made at the beginning of the year. However, due to the expansion of other economies (particularly of emerging economies), the outlook for 2008 and 2009 is still favorable, although slightly lower in terms of growth rates. Nevertheless, because of uncertainty regarding the future situation of international financial markets, forecasts on the growth of the global economy are biased downwards.
Growth, inflation and interest rates
8. Forecasts on growth in 2007 have been in line with our estimates. The lower growth of the United States, associated with the slow down seen in the real estate market, has been
Inflation Report. September 2007
..................................................................................................................................................................................................................................................
�8 .......
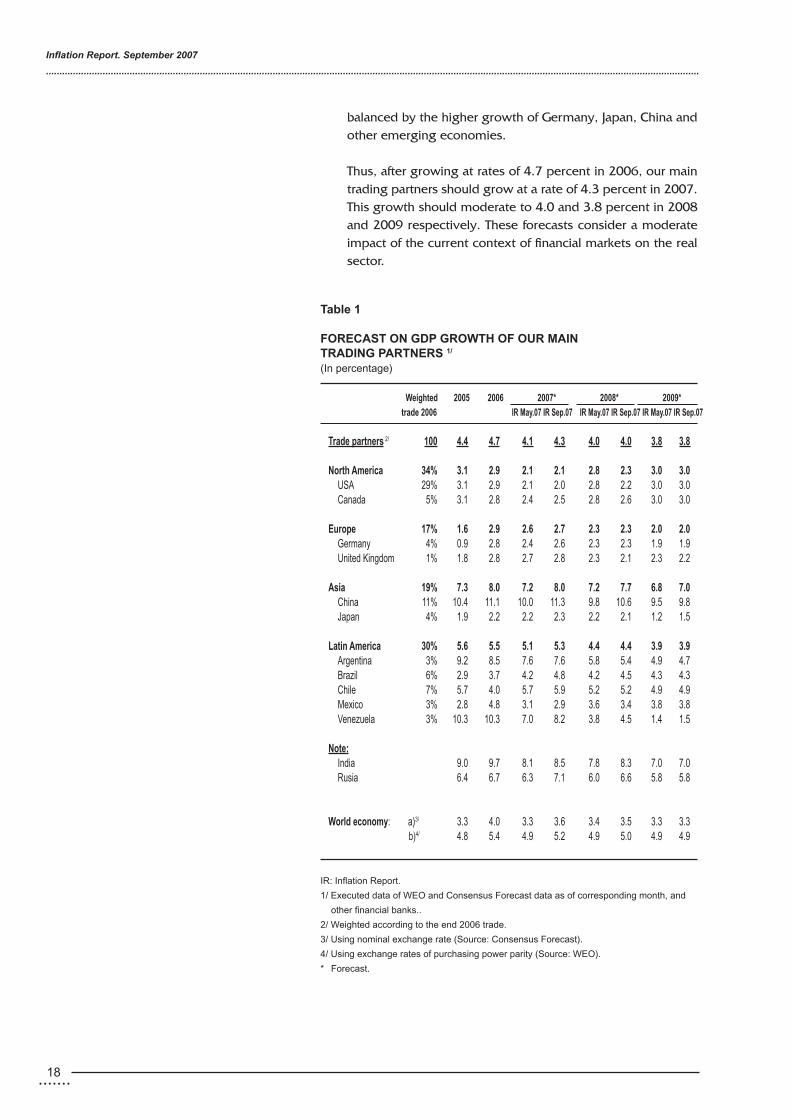
balanced by the higher growth of Germany, Japan, China and other emerging economies.
Thus, after growing at rates of 4.7 percent in 2006, our main trading partners should grow at a rate of 4.3 percent in 2007. This growth should moderate to 4.0 and 3.8 percent in 2008 and 2009 respectively. These forecasts consider a moderate impact of the current context of financial markets on the real sector.
table 1
FoReCASt on GDP GRoWtH oF oUR MAIntRADInG PARtneRS 1/ (In percentage)
Weighted 2005 2006 2007* 2008* 2009*
trade 2006 IR May.07 IR Sep.07 IR May.07 IR Sep.07 IR May.07 IR Sep.07
trade partners�/ 100 4.4 4.7 4.1 4.3 4.0 4.0 3.8 3.8 north America 34% 3.1 2.9 2.1 2.1 2.8 2.3 3.0 3.0 uSA 29% 3.1 2.9 2.1 2.0 2.8 2.2 3.0 3.0 Canada 5% 3.1 2.8 2.4 2.5 2.8 2.6 3.0 3.0 europe 17% 1.6 2.9 2.6 2.7 2.3 2.3 2.0 2.0 Germany 4% 0.9 2.8 2.4 2.6 2.3 2.3 1.9 1.9 united Kingdom 1% 1.8 2.8 2.7 2.8 2.3 2.1 2.3 2.2 Asia 19% 7.3 8.0 7.2 8.0 7.2 7.7 6.8 7.0 China 11% 10.4 11.1 10.0 11.3 9.8 10.6 9.5 9.8 Japan 4% 1.9 2.2 2.2 2.3 2.2 2.1 1.2 1.5 Latin America 30% 5.6 5.5 5.1 5.3 4.4 4.4 3.9 3.9 Argentina 3% 9.2 8.5 7.6 7.6 5.8 5.4 4.9 4.7 Brazil 6% 2.9 3.7 4.2 4.8 4.2 4.5 4.3 4.3 Chile 7% 5.7 4.0 5.7 5.9 5.2 5.2 4.9 4.9 mexico 3% 2.8 4.8 3.1 2.9 3.6 3.4 3.8 3.8 Venezuela 3% 10.3 10.3 7.0 8.2 3.8 4.5 1.4 1.5 note:
India 9.0 9.7 8.1 8.5 7.8 8.3 7.0 7.0 Rusia 6.4 6.7 6.3 7.1 6.0 6.6 5.8 5.8
World economy: a)�/ 3.3 4.0 3.3 3.6 3.4 3.5 3.3 3.3 b)4/ 4.8 5.4 4.9 5.2 4.9 5.0 4.9 4.9
IR: Inflation Report.
1/ executed data of weo and Consensus Forecast data as of corresponding month, and
other financial banks..
2/ weighted according to the end 2006 trade.
3/ using nominal exchange rate (Source: Consensus Forecast).
4/ using exchange rates of purchasing power parity (Source: weo).
* Forecast.
.......19
Central Reserve Bank of Peru
..................................................................................................................................................................................................................................................
Jan.00 Jan.01 Jan.02 Jan.03 Jan.04 Jan.05 Jan.06 Jan.07 Sep.07
Graph 6 USA: TREASURY YIELDS(In percentage)
7
6
5
4
3
2
1
2 years 10 years
7
6
5
4
3
2
1
Jan.00 Jan.01 Jan.02 Jan.03 Jan.04 Jan.05 Jan.06 Jan.07 Aug.07
Graph 5 USA: CORE INFLATION(Percentage change last 12 months)
3.0
2.0
1.0
Core PCE Core CPI
Source: Bureau of Labor Statistics and Bureau of Economic Analysis.
3,0
2.0
1.0
2.1
1.8
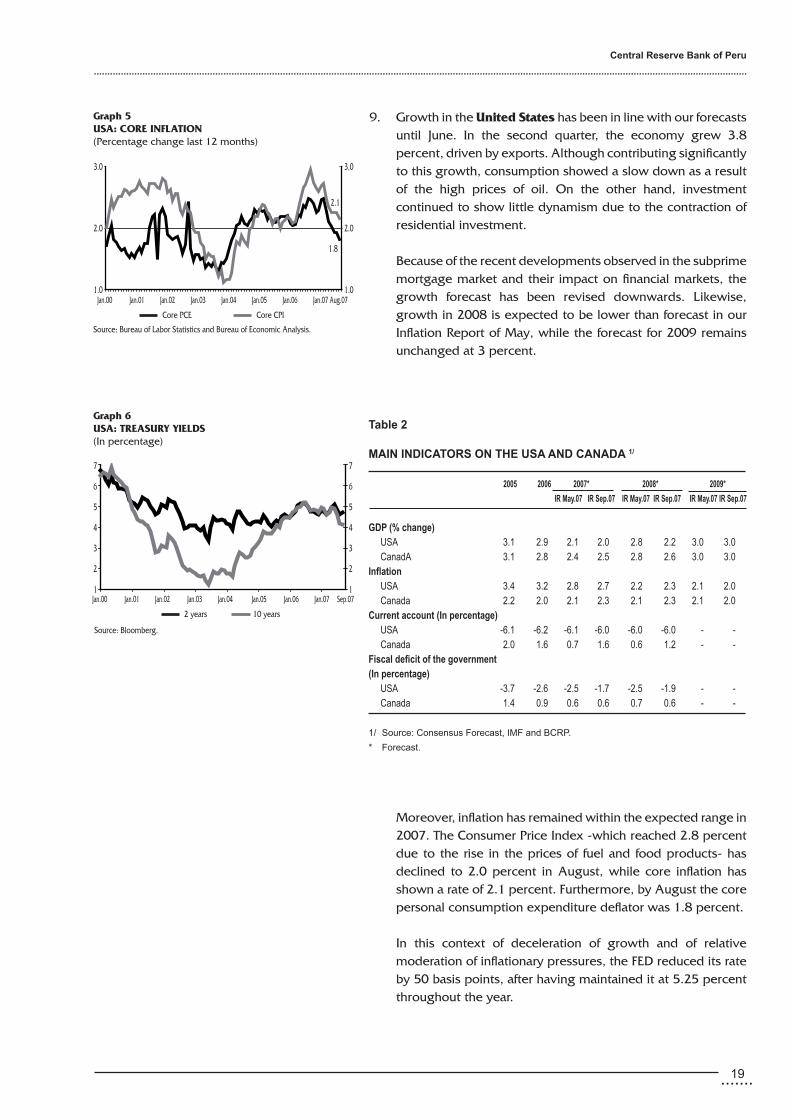
9. Growth in the United States has been in line with our forecasts until June. In the second quarter, the economy grew 3.8 percent, driven by exports. Although contributing significantly to this growth, consumption showed a slow down as a result of the high prices of oil. On the other hand, investment continued to show little dynamism due to the contraction of residential investment.
Because of the recent developments observed in the subprime mortgage market and their impact on financial markets, the growth forecast has been revised downwards. Likewise, growth in 2008 is expected to be lower than forecast in our Inflation Report of May, while the forecast for 2009 remains unchanged at 3 percent.
Moreover, inflation has remained within the expected range in 2007. The Consumer Price Index -which reached 2.8 percent due to the rise in the prices of fuel and food products- has declined to 2.0 percent in August, while core inflation has shown a rate of 2.1 percent. Furthermore, by August the core personal consumption expenditure deflator was 1.8 percent.
In this context of deceleration of growth and of relative moderation of inflationary pressures, the FED reduced its rate by 50 basis points, after having maintained it at 5.25 percent throughout the year.
table 2
MAIn InDICAtoRS on tHe USA AnD CAnADA 1/
2005 2006 2007* 2008* 2009*
IR May.07 IR Sep.07 IR May.07 IR Sep.07 IR May.07 IR Sep.07
GDP (% change) uSA 3.1 2.9 2.1 2.0 2.8 2.2 3.0 3.0 CanadA 3.1 2.8 2.4 2.5 2.8 2.6 3.0 3.0Inflation uSA 3.4 3.2 2.8 2.7 2.2 2.3 2.1 2.0 Canada 2.2 2.0 2.1 2.3 2.1 2.3 2.1 2.0Current account (In percentage) uSA -6.1 -6.2 -6.1 -6.0 -6.0 -6.0 - - Canada 2.0 1.6 0.7 1.6 0.6 1.2 - -Fiscal deficit of the government (In percentage) uSA -3.7 -2.6 -2.5 -1.7 -2.5 -1.9 - - Canada 1.4 0.9 0.6 0.6 0.7 0.6 - -
1/ Source: Consensus Forecast, ImF and BCRP.
* Forecast.
Source: Bloomberg.

Inflation Report. September 2007
..................................................................................................................................................................................................................................................
20 .......
Jan.00 Jan.01 Jan.02 Jan.03 Jan.04 Jan.05 Jan.06 Jan.07 Aug.07
Graph 7 EUROZONE: INFLATION(Percentage change last 12 months)
3.5
3.0
2.5
2.0
1.5
1.0
0.5
CPI Core Source: Eurostat.
3.5
3.0
2.5
2.0
1.5
1.0
0.5
On the other hand, long-term rates have been declining in 2007. The recent turbulence seen in international markets has accentuated this trend as investors have sought less risky assets (flight to quality). The yield on the 2-year bond reached 3.85 on September 10 and the yield on the 10-year bond reached 4.32 percent, levels unseen since September 2005. Then, after the FED reduced its rates, a correction was observed in these rates -which showed levels of 3.99 percent and 4.59 percent respectively at the end of September- as a result of lower risk aversion and of lower expectations of the impact that the crisis of the real estate sector would have on economic growth.
10. Europe has been growing at a faster pace than initially forecast. In the Eurozone, Germany has seen an important growth in investment and exports, partially offset by a slow down in consumption (affected by an increase of value-added tax early this year). Outside the Eurozone, the 3 percent growth -driven by private consumption- seen in the United Kingdom in the second quarter was noteworthy.
This economic growth was coupled by some inflationary pressures, explained in part by the increase in the value-added tax and in the price of petroleum. So far this year, the European Central Bank (ECB) has raised its interest rate on two occasions (in March and in June, increasing this rate by a total of 50 basis points to 4.75 percent), in a context of economic recovery and increased core inflation. The recent developments observed in the financial markets and the FED’s reduction of its interest rates reduce the probability of future increases. Growth in the next years should be slightly lower than in 2007.
table 3
MAIn InDICAtoRS on eURoPe 1/
2005 2006 2007* 2008* 2009*
IR May.07 IR Sep.07 IR May.07 IR Sep.07 IR May.07 IR Sep.07
GDP (% change) Germany 0.9 2.8 2.4 2.6 2.3 2.3 1.9 1.9 Spain 3.5 3.9 3.6 3.8 3.0 2.9 2.5 2.5united Kingdom 1.8 2.8 2.7 2.8 2.3 2.1 2.3 2.2 Inflación Germany 2.0 1.7 1.6 1.9 1.6 1.6 1.6 1.6 Spain 3.4 3.5 2.6 2.6 2.7 2.7 2.7 2.7united Kingdom 2.1 2.3 1.9 2.4 1.9 2.0 1.9 2.0
1/ Source: Consensus Forecast and BCRP.
*Forecast.
.......��
Central Reserve Bank of Peru
..................................................................................................................................................................................................................................................
Jan.00 Jan.01 Jan.02 Jan.03 Jan.04 Jan.05 Jan.06 Jan.07 Aug.07
Graph 8 CHINA: ECONOMIC ACTIVITY(% Change - 3 month moving average)50454035302520151050
Industrial production Urban investment
Source: National Bureau of Statistics.
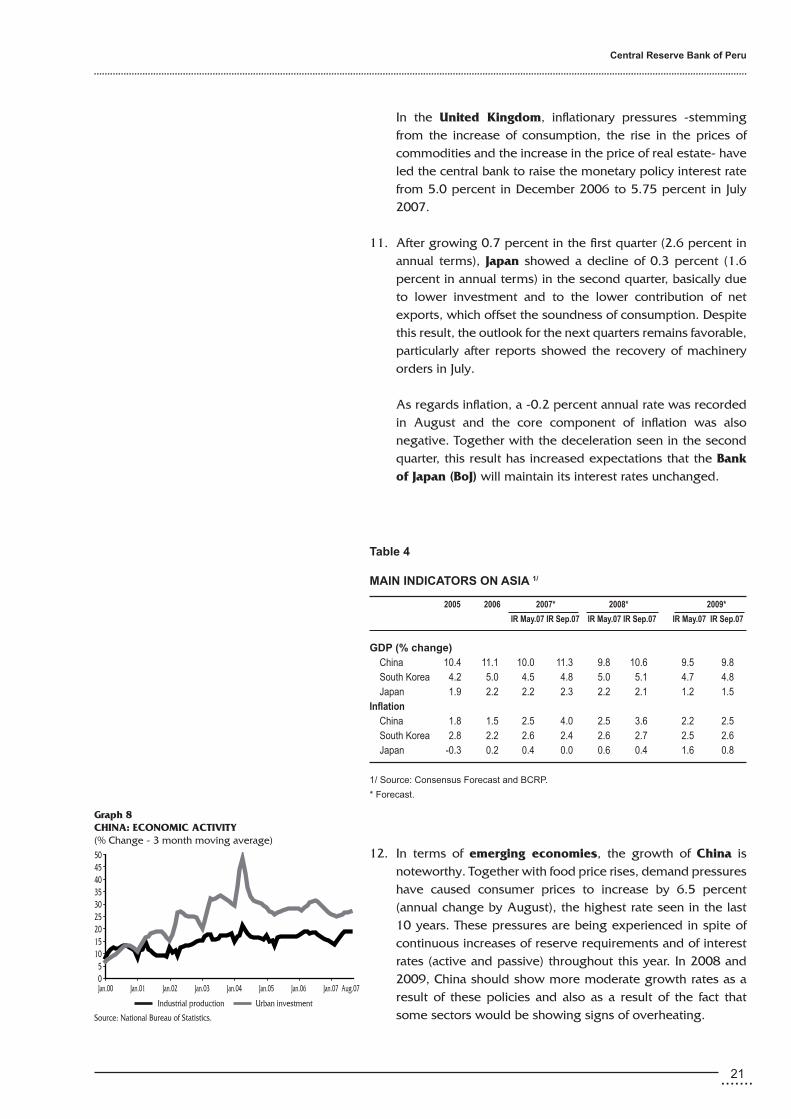
In the United Kingdom, inflationary pressures -stemming from the increase of consumption, the rise in the prices of commodities and the increase in the price of real estate- have led the central bank to raise the monetary policy interest rate from 5.0 percent in December 2006 to 5.75 percent in July 2007.
11. After growing 0.7 percent in the first quarter (2.6 percent in annual terms), Japan showed a decline of 0.3 percent (1.6 percent in annual terms) in the second quarter, basically due to lower investment and to the lower contribution of net exports, which offset the soundness of consumption. Despite this result, the outlook for the next quarters remains favorable, particularly after reports showed the recovery of machinery orders in July.
As regards inflation, a -0.2 percent annual rate was recorded in August and the core component of inflation was also negative. Together with the deceleration seen in the second quarter, this result has increased expectations that the Bank of Japan (BoJ) will maintain its interest rates unchanged.
12. In terms of emerging economies, the growth of China is noteworthy. Together with food price rises, demand pressures have caused consumer prices to increase by 6.5 percent (annual change by August), the highest rate seen in the last 10 years. These pressures are being experienced in spite of continuous increases of reserve requirements and of interest rates (active and passive) throughout this year. In 2008 and 2009, China should show more moderate growth rates as a result of these policies and also as a result of the fact that some sectors would be showing signs of overheating.
table 4
MAIn InDICAtoRS on ASIA 1/
2005 2006 2007* 2008* 2009*
IR May.07 IR Sep.07 IR May.07 IR Sep.07 IR May.07 IR Sep.07
GDP (% change) China 10.4 11.1 10.0 11.3 9.8 10.6 9.5 9.8 South Korea 4.2 5.0 4.5 4.8 5.0 5.1 4.7 4.8 Japan 1.9 2.2 2.2 2.3 2.2 2.1 1.2 1.5Inflation China 1.8 1.5 2.5 4.0 2.5 3.6 2.2 2.5 South Korea 2.8 2.2 2.6 2.4 2.6 2.7 2.5 2.6 Japan -0.3 0.2 0.4 0.0 0.6 0.4 1.6 0.8
1/ Source: Consensus Forecast and BCRP.
* Forecast.

Inflation Report. September 2007
..................................................................................................................................................................................................................................................
�� .......
13. Growth in Latin America has remained robust, although a moderate slowdown is expected in the next two years. In some economies, growth continued to be driven mainly by domestic demand which, together with increased inflationary pressures, associated with some commodities (particularly petroleum and food products), has generated a rise in interest rates.
Evolution of the dollar in international markets
14. The dollar continued to depreciate in international markets, particularly against the euro, the pound and the Canadian dollar. This evolution is explained in part by the differentiated conduct of monetary policy interest rates. While the ECB raised its rate during this year, the FED reduced its rate in September after maintaining it unchanged since June 2006, as a result of which the differential between these rates dropped by 100 basis points (to 75 basis points). A similar trend was seen in the United Kingdom, where the monetary policy rate of the Bank of England rose to a higher level than the FED’ rate.
Moreover, expectations that the FED will reduce its interest rates even further have implied additional pressures on the dollar. After the FED cut its interest rate on September 18, the dollar showed its lowest level (1.43 dollars per euro) on September 28.
table 5
MAIn InDICAtoRS on LAtIn AMeRICA 1/
2005 2006 2007* 2008* 2009*
IR May.07 IR Sep.07 IR May.07 IR Sep.07 IR May.07 IR Sep.07
GDP (Var. %) Argentina 9.2 8.5 7.6 7.6 4.7 5.4 4.9 4.7 Brazil 2.9 3.7 4.2 4.8 3.6 4.5 4.3 4.3 Chile 5.7 4.0 5.2 5.9 5.0 5.2 4.9 4.9 Colombia 4.7 6.8 5.6 6.4 4.2 5.3 4.6 4.6 mexico 2.8 4.8 3.3 2.9 3.7 3.4 3.8 3.8
Inflation Argentina 12.3 9.8 10.2 8.6 10.2 10.9 10.2 9.7 Brazil 5.7 3.1 4.1 4.0 4.0 4.1 3.9 3.9 Chile 3.7 2.6 2.9 5.8 2.9 3.2 2.9 2.9 Colombia 4.9 4.5 3.9 5.1 4.1 4.4 3.8 3.6 mexico 3.3 4.1 3.5 3.7 3.6 3.5 3.5 3.5
1/ Source: Consensus Forecast.
* Forecast.
Jan.03 Aug.03 Mar.04 Oct.04 May.05 Dec.05 Jul.06 Feb.07 Sep.07
Graph 9 US DOLLAR AGAINST EURO AND YEN
140
135
130
125
120
115
110
105
100
Yen/US$ US$/Euro Source: Bloomberg.
1.5
1.4
1.3
1.2
1.1
1.0
0.9
0.8
Yen/US$ US$/Euro

.......��
Central Reserve Bank of Peru
..................................................................................................................................................................................................................................................
-15.2 -14.4 -14.4 -10.7 -9.9 -6.6 -5.9 -5.5 -4.9 -4.8 -3.9 -3.9 -3.6 -3.4 -2.1 -1.4 0.8 3.5
The yen also weakened until June, due to the permanence of speculative operations (carry trade) as a result of its lower interest rate. In the context of the financial turbulence seen over the past months -and the subsequent increase of risk aversion-, these operations have reversed, as a result of which the yen has strengthened.
The yuan continued to appreciate, although in a context of a high current account surplus and of accumulation of international reserves. Other emerging currencies -particularly the Colombian peso and the Brazilian real- appreciated strongly until June. This trend was temporarily reversed between July and mid-September (period of financial turbulence).
15. In 2007, the weakening of the dollar was expressed in a global trend of appreciation of domestic currencies. However, not all countries were affected to the same extent: the currencies of Turkey, Canada and Brazil were the most affected ones, with an accumulated appreciation of nearly 14 percent.
The debt of emerging economies
16. After reaching minimum levels (between end May and the first two weeks of June), the spreads of emerging economies reversed their downward evolution, affected by the increased turbulence seen in international markets betrween July and mid-September. However, after the FED cut its rates on September 18, this upward trend started to reverse. Moreover, this increase was limited and differentiated compared to the adjustments observed in other assets with similar risks (fixed-income and variable-income assets in developed economies). So far this year, the EMBI+ spread has increased by 32 basis points and the EMBI+Peru has increased by 19 basis points.
table 6 eMeRGInG BonD MARKet SPReADS InDeX (eMBI+)*
2002 2003 2004 2005 2006 2007 Chg. in bps
Jun.07 Aug.07 Sep.07 2007Sep-2006
emerging economies 765 418 356 245 169 175 223 201 32 Latin America 1,007 5�� 420 �8� �86 197 �46 ��� �6 Brazil 1,446 463 382 311 192 160 195 173 -19 Colombia 645 431 332 238 161 119 197 166 5 mexico 331 199 166 126 98 95 110 112 14 Argentina 6,391 5,632 4,703 504 216 325 450 398 182 Peru �/ 610 312 220 206 118 117 166 137 19
* end-of-period data. 1/ Since September 29, 2006 JP morgan included the 2025 and 2033 global bonds in the
calculation, increasing the result in aproximatly 40 bps.Source: Reuters.
Jan.03 Jul.03 Jan.04 Jul.04 Jan.05 Jul.05 Jan.06 Jul.06 Jan.07 Jul.07
Graph 11EXCHANGE RATE VARIATION(Jan.-Oct. 4, 2007)
TurkeyBrazil
CanadaIndia
ColombiaEurozoneFED Index
PeruChileIsrael
United KingdomChina
SwitzerlandMalaysia
JapanKorea
MexicoArgentina
(+) Dolar appreciation
(-) Dolar depreciation
-20% -15% -10% -5% 0.0% 5.0%
Graph 10 US DOLLAR AGAINST CURRENCY BASKET OFUS MAIN COMMERCIAL PARTNERS*(Jan. 1997=100)
130
125
120
115
110
105
100
* Index of nominal exchange rate against main commercial partnersThe falling trend means dollar depreciation.Source: Federal Reserve Board.
Index130
125
120
115
110
105
100

Inflation Report. September 2007
..................................................................................................................................................................................................................................................
�4 .......
BoX 1
ReCent DeVeLoPMentS In InteRnAtIonAL FInAnCIAL MARKetS
Financial markets have recently experienced an important turbulence due to the crisis of the mortgage market in the united States, particularly the subprime segment, which includes the mortgage loans granted to people with low credit profiles. These loans generally involve a small down payment and variable rates (between 200 and 300 basis points higher than the rates for the prime segment).
The subprime segment represents nearly 15 percent of the total value of mortgage loans, although in recent years it has shown greater dynamism (in 2006, this segment accounted for nearly 20 percent of total loans). The balance of subprime loans by 2006 was estimated at approximately uS$ 1.2 trillion (a sum equivalent to 10 percent of the united States’ GdP). Around 78 percent of these loans had been granted at a variable rate.
with the rise observed in interest rates since 2004 and the deceleration observed in the prices of real estate, non-performing loans in this segment increased from 10 percent in the last months to nearly 15 percent today.
This evolution has affected a series of firms operating in the real estate market and has reduced the value of the securities that backed this type of mortgages (i.e. Collateral debt obligations or Cdos). mortgage Backed-Securities in the subprime segment amounted to uS$ 665 billion in 2006, which represents nearly a third of securitized mortgages.
News about the losses generated in financial institutions highly exposed to the market was more common since the second half of July. In August, some banks in the leading economies of the world reduced their propensity for interbank lending operations, as a result of which overnight interest rates increased significantly.
In this context, central banks in the main developed economies have been injecting additional liquidity in order to reduce the pressures on interest rates. The Fed lowered its discount rate (for loans to banks) by 50 basis points and then reduced its policy interest rate from 5.25 percent to 4.75 percent (and reducing the discount rate by 50 basis points).
This situation affects the prospects of global economy in several ways. First of all, it implies a loss of wealth that, so far, has only affected investors, banks and funds. If these losses extend to other sectors and if investors and consumers’ confidence deteriorates, the impact on economic activity will be greater, particularly in the united States.
Furthermore, these developments imply that investors’ aversion to risk will increase since, in these conditions, investors demand safer assets (such as the uS Treasury Bonds, for example). during this period, the spreads of bonds in emerging economies have increased, stock markets have dropped, and currencies have depreciated, particularly in the case of the currencies that have been subject to carry trade operations.
ReCent DeVeLoPMent In tHe FInAnCIAL MARKetS:tRAnSMItIon CHAnneL
Increasednon-performing
loans
Losses onfinancial
institutions
Riskaversion
Creditrestrictions
Increase liquidityby central banks tomaintain referenceinterest rates
demand fortreasury bills
Increment onemerging bonds
spreads
depreciationpreassures
decrease in stocks

.......�5
Central Reserve Bank of Peru
..................................................................................................................................................................................................................................................
It should be pointed out that Peru, like other emerging economies, currently stands on sounder grounds to face international scenarios as the one seen over the past few months. Factors such as international liquidity, a better fiscal stance, and lower requirements of external indebtedness contribute to reduce the impact of a reversal of capital flows and of investors’ lower interest in investing in assets in emerging economies.
MAIn FInAnCIAL ASSetS (enD oF PeRIoD)
Dec.06 Jun.07 Aug.07 Sep.07 Percentage change % (1) (2) (3) (4) (2)/(1) (3)/(2) (4)/(3) (4)/(1)
Currencies (UM per US$)
euro (dollar per euro) 1.320 1.354 1.363 1.427 2.6 0.7 4.7 8.1 yen 119.01 123.14 115.76 114.79 3.5 -6.0 -0.8 -3.5 Brasilean Real 2.135 1.928 1.968 1.832 -9.7 2.1 -6.9 -14.2 Colombian Peso 2,237 1,974 2,162 2,022 -11.8 9.5 -6.5 -9.6
Stocks (Index) dow Jones 12,463 13,409 13,358 13,896 7.6 -0.4 4.0 11.5
Bond yields and spreads Basis points change Bonds (AAA qualification) 5.51 5.79 5.76 5.76 28 -3 0 25uS treasuries (10 years) 4.60 5.03 4.53 4.59 43 -50 6 -1Spread emBI+ (in bps) 169 175 223 201 6 48 -22 32Spread Junk bonds 315 307 464 407 -8 156 -57 92
Source: Bloomberg.

Inflation Report. September 2007
..................................................................................................................................................................................................................................................
�6 .......
Graph 12INFLATION(Percentage change)
12
10
8
6
4
2
0
-2 1995 1996 1997 1998 1999 2000 2001 2002 2003 2004 2005 2006 2007/1
1/ January-September 2007.
Average: 2.3%Inflation targeting
framework
III. Inflation
The rate of inflation accumulated over the last 12 months showed a downward trend between January and April, and an upward trend between May and September. Inflation increased from 0.9 percent in May to 2.8 percent in September, due to the impact of the higher cost of imported raw materials (wheat and petroleum), of climatic anomalies (lower temperatures than normal), and of increased domestic demand. Accumulated last twelve-month imported inflation rose from 0.6 percent in May to 6.1 percent in September.
Inflation should show rates slightly above the upper band of the target range (3.0 percent) in the next months due to the increased imported inflation observed recently, converging thereafter to 2 percent by end 2008.
Evolution of inflation
17. Last 12-month inflation has been within the target range since June, after showing rates below this range during the first five months of the year. Between May and July, inflation posted monthly rates of nearly 0.5 percent, due to the higher prices of food products and fuel. The monthly rate of inflation in September was 0.6 percent, also due to the higher prices of food products. Like in previous episodes, these price rises resulting from supply-related factors have a transitory impact on inflation (see Box 3). Since the Inflation Targeting scheme was first implemented, average inflation has been 2.3 percent, with an average core inflation rate of 1.3 percent.
By September, the rates of total inflation and core inflation accumulated over the last 12 months were 2.8 and 2.1 percent respectively.
18. Between January and September 2007, accumulated inflation was 3.0 percent, higher than in the same period in 2006 (1.4 percent). This was mainly due to the higher variation of the
Graph 13WEIGHTED CONTRIBUTION TO INFLATION(Percentage points)
4.0
3.5
3.0
2.5
2.0
1.5
1.0
0.5
0.0
-0.5
-1.0 2002 2003 2004 2005 2006 Jan.-sep.07
Fuel
Bread
Chicken
Fuel
Tickets
Potatoes
Fuel
Bread
Rice
Potatoes ChickenGas
Keroseneand gasoline
Papaya
Onion
Bread
OnionElectricity
Bread
ChickenSchool inscription
Eatingout
Fuel
3.48
3.02
1.14
1.49
2.48
1.52
Inflation
.......27
Central Reserve Bank of Peru
..................................................................................................................................................................................................................................................
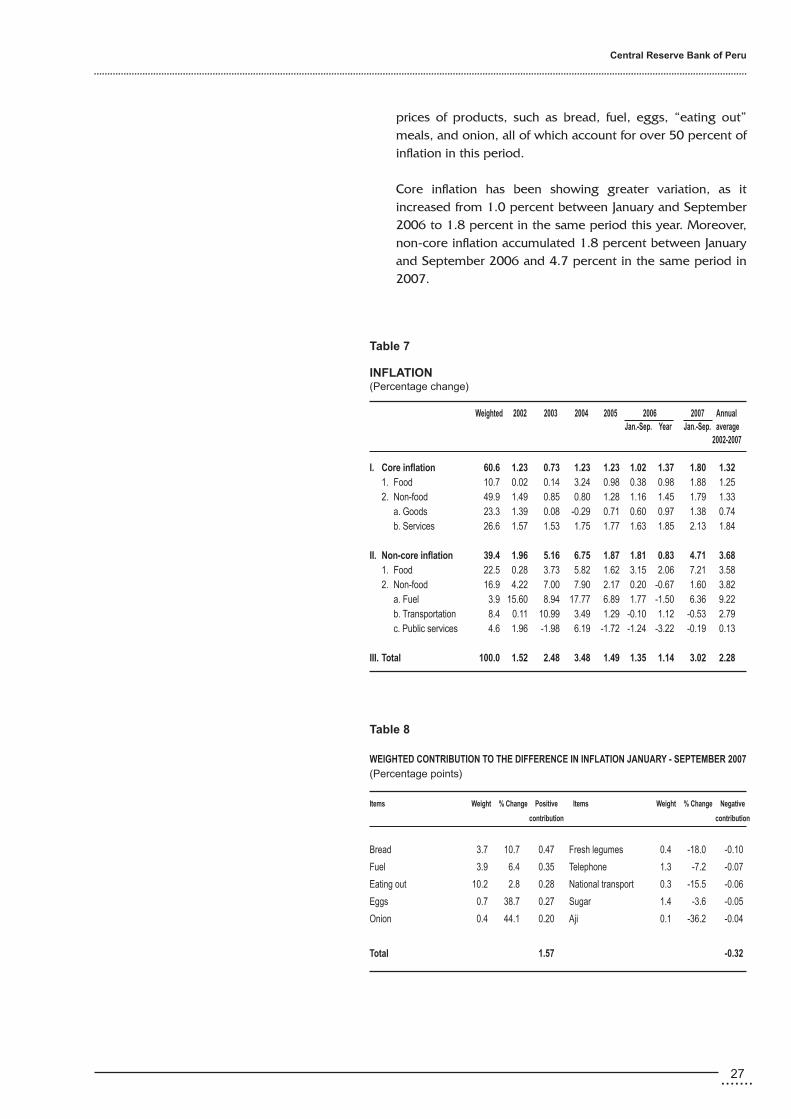
prices of products, such as bread, fuel, eggs, “eating out” meals, and onion, all of which account for over 50 percent of inflation in this period.
Core inflation has been showing greater variation, as it increased from 1.0 percent between January and September 2006 to 1.8 percent in the same period this year. Moreover, non-core inflation accumulated 1.8 percent between January and September 2006 and 4.7 percent in the same period in 2007.
table 7
InFLAtIon (Percentage change)
Weighted 2002 2003 2004 2005 2006 2007 Annual Jan.-Sep. Year Jan.-Sep. average
2002-2007 I. Core inflation 60.6 1.23 0.73 1.23 1.23 1.02 1.37 1.80 1.32 1. Food 10.7 0.02 0.14 3.24 0.98 0.38 0.98 1.88 1.25 2. Non-food 49.9 1.49 0.85 0.80 1.28 1.16 1.45 1.79 1.33 a. Goods 23.3 1.39 0.08 -0.29 0.71 0.60 0.97 1.38 0.74 b. Services 26.6 1.57 1.53 1.75 1.77 1.63 1.85 2.13 1.84 II. Non-core inflation 39.4 1.96 5.16 6.75 1.87 1.81 0.83 4.71 3.68 1. Food 22.5 0.28 3.73 5.82 1.62 3.15 2.06 7.21 3.58 2. Non-food 16.9 4.22 7.00 7.90 2.17 0.20 -0.67 1.60 3.82 a. Fuel 3.9 15.60 8.94 17.77 6.89 1.77 -1.50 6.36 9.22 b. Transportation 8.4 0.11 10.99 3.49 1.29 -0.10 1.12 -0.53 2.79 c. Public services 4.6 1.96 -1.98 6.19 -1.72 -1.24 -3.22 -0.19 0.13
III. total 100.0 1.52 2.48 3.48 1.49 1.35 1.14 3.02 2.28
table 8
WeIGHteD ContRIBUtIon to tHe DIFFeRenCe In InFLAtIon JAnUARY - SePteMBeR 2007(Percentage points)
Items Weight % Change Positive Items Weight % Change negative
contribution contribution
Bread 3.7 10.7 0.47 Fresh legumes 0.4 -18.0 -0.10
Fuel 3.9 6.4 0.35 Telephone 1.3 -7.2 -0.07
eating out 10.2 2.8 0.28 National transport 0.3 -15.5 -0.06
eggs 0.7 38.7 0.27 Sugar 1.4 -3.6 -0.05
onion 0.4 44.1 0.20 Aji 0.1 -36.2 -0.04
total 1.57 -0.32
Inflation Report. September 2007
..................................................................................................................................................................................................................................................
�8 .......
Jan.02 Jan.03 Jan.04 Jan.05 Jan.06 Jan.07 Sep.07
Graph 15 INFLATION AND CORE INFLATION(Percentage change last 12 months)
5
4
3
2
1
0
-1
-2
Inflation Core inflation
Graph 16INFLATION AND NON-CORE INFLATION(Percentage change last 12 months)
10
8
6
4
2
0
-2
-4
-6Jan.02 Jan.03 Jan.04 Jan.05 Jan.06 Jan.07 Sep.07
Inflation Non-core inflation
Jan.02 Jan.03 Jan.04 Jan.05 Jan.06 Jan.07 Sep.07
Graph 14 INFLATION, DOMESTIC COMPONENT AND IMPORTED COMPONENT(Percentage change last 12 months)
13
8
3
-2
-7
Imported CPS Domestic CPI CPI
Petroleumshock
Petroleum and
food shock
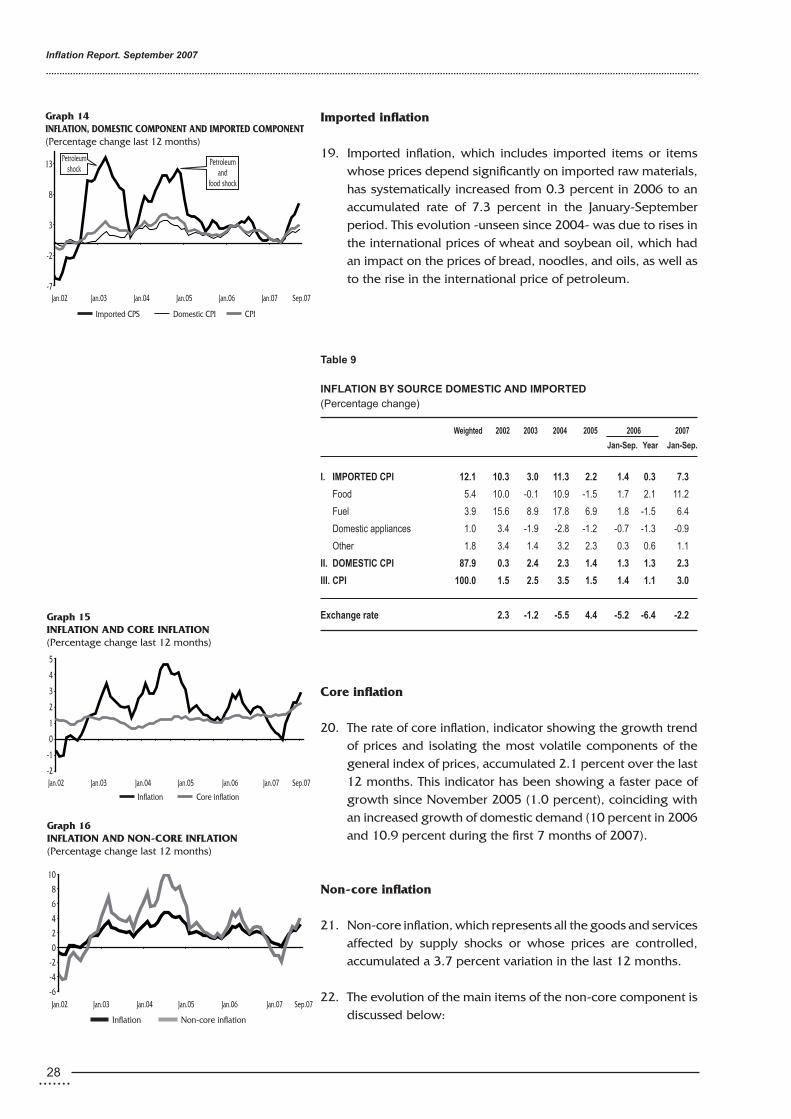
Imported inflation
19. Imported inflation, which includes imported items or items whose prices depend significantly on imported raw materials, has systematically increased from 0.3 percent in 2006 to an accumulated rate of 7.3 percent in the January-September period. This evolution -unseen since 2004- was due to rises in the international prices of wheat and soybean oil, which had an impact on the prices of bread, noodles, and oils, as well as to the rise in the international price of petroleum.
Core inflation
20. The rate of core inflation, indicator showing the growth trend of prices and isolating the most volatile components of the general index of prices, accumulated 2.1 percent over the last 12 months. This indicator has been showing a faster pace of growth since November 2005 (1.0 percent), coinciding with an increased growth of domestic demand (10 percent in 2006 and 10.9 percent during the first 7 months of 2007).
Non-core inflation
21. Non-core inflation, which represents all the goods and services affected by supply shocks or whose prices are controlled, accumulated a 3.7 percent variation in the last 12 months.
22. The evolution of the main items of the non-core component is discussed below:
table 9
InFLAtIon BY SoURCe DoMeStIC AnD IMPoRteD(Percentage change)
Weighted 2002 2003 2004 2005 2006 2007
Jan-Sep. Year Jan-Sep.
I. IMPoRteD CPI 12.1 10.3 3.0 11.3 2.2 1.4 0.3 7.3
Food 5.4 10.0 -0.1 10.9 -1.5 1.7 2.1 11.2
Fuel 3.9 15.6 8.9 17.8 6.9 1.8 -1.5 6.4
domestic appliances 1.0 3.4 -1.9 -2.8 -1.2 -0.7 -1.3 -0.9
other 1.8 3.4 1.4 3.2 2.3 0.3 0.6 1.1
II. DoMeStIC CPI 87.9 0.3 2.4 2.3 1.4 1.3 1.3 2.3
III. CPI 100.0 1.5 2.5 3.5 1.5 1.4 1.1 3.0
exchange rate 2.3 -1.2 -5.5 4.4 -5.2 -6.4 -2.2

.......29
Central Reserve Bank of Peru
..................................................................................................................................................................................................................................................
Graph 17PRICE OF BREAD AND WHEAT(December 2001=100)
Graph 18WHEAT CUOTATION(US$ per MT)
Graph 19PRICE OF EGGS(Nuevos soles per kg.)
4.34.13.93.73.53.33.12.92.7
Jan.02 Jan.03 Jan.04 Jan.05 Jan.06 Jan.07 Sep.07
Oct.06S/. 2.8 per Kg.
Sep.07S/. 4.1 per Kg.Jul.05
S/. 4.3 per Kg.
350
310
270
230
190
150
110Dec.03 Dec.04 Dec.05 Dec.06 Dec.07 Dec.08 Dec.09
Source: Bloomberg and BCRP.
IR Sep.07
Forecast
IR May.07
IR: Inflation Report.
255
235
215
195
175
155
135
115
95
Jan.02 Jan.03 Jan.04 Jan.05 Jan.06 Jan.07 Sep.07
Bread Wheat cuotation (in Nuevos Soles) Wheat flour
l Bread: The price of bread increased by 10.7 percent in the January-September period, affected by the rise in the price of wheat flour (the wholesale price of this product increased 14 percent). This rise was associated with the increase seen in the international price of wheat, particularly in the months of May and September.
Compared to December 2006, the internacional price of wheat has increased 66 percent, from US$ 180 to
US$ 298 per ton in September. This strong increase is mainly explained by the low levels of inventories, which show levels that have not been seen for the past 30 years.
According to estimates of the US Department of Agriculture, global production in the 2007-2008 crop year would increase compared to that of 2006-2007, but would still be lower than production in the 2005-2006 crop year. The persistance of unfavorable weather conditions in wheat-producing areas in Europe, Australia and Argentina, and the reduction of sown areas in Canada would imply production levels that are 17 million tons lower than the production levels achieved in the 2005-2006 period. A gradual correction of wheat prices is expected during 2008.
l Eggs: The price of eggs accumulated a rise of 39 percent in the first nine months of the year, due to a lower placement of laying hens (-8 percent relative to supply between January and August last year), which accounted for 0.23 percentage points of inflation during this period. In 2006, the price of eggs fell 10.7 percent.
l Onion: The price of this product increased 44 percent. The price rises observed between April and June were due to both seasonal factors and to a reduction of sown areas in
table 10
WoRLD WHeAt SUPPLY AnD DeMAnD BALAnCe(millions of mT) term 2004/05 term 2005/06 term 2006/07 term 2007/08
1. Initial inventories 133 151 149 125
2. world production 629 623 593 606
3. world consumption 610 624 617 619
4. Final inventories (1+2-3) 151 149 125 112
Source: uS department of Agriculture (September Report).
Inflation Report. September 2007
..................................................................................................................................................................................................................................................
30 .......
Arequipa -Lima’s main supplier of onions (cultivated areas reduced by 20 percent compared to the previous crop year).
l Fresh legumes: The prices of these products fell 18 percent, due to a drop in the price of green peas (-27 percent), which is the main component of this item. Compared with the same period last year, Lima’s supply of fresh legumes grew by approximately 12 percent between January and August due to an increased supply from Junin.
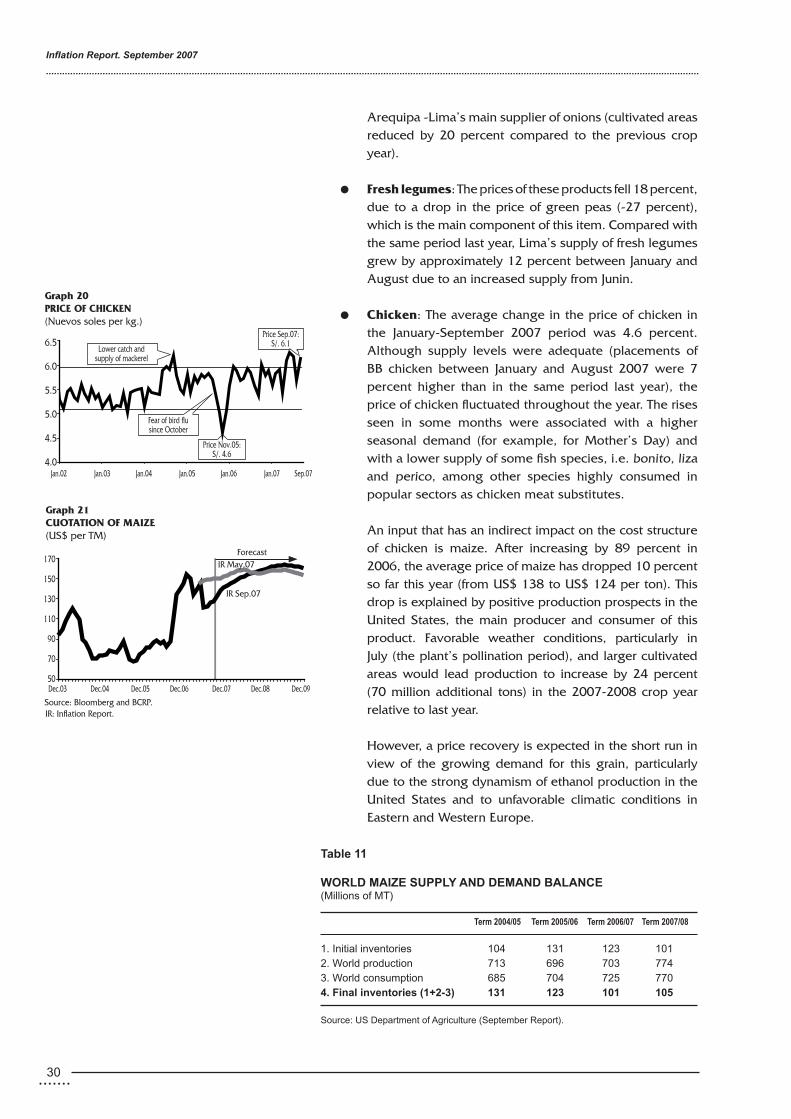
l Chicken: The average change in the price of chicken in the January-September 2007 period was 4.6 percent. Although supply levels were adequate (placements of BB chicken between January and August 2007 were 7 percent higher than in the same period last year), the price of chicken fluctuated throughout the year. The rises seen in some months were associated with a higher seasonal demand (for example, for Mother’s Day) and with a lower supply of some fish species, i.e. bonito, liza and perico, among other species highly consumed in popular sectors as chicken meat substitutes.
An input that has an indirect impact on the cost structure of chicken is maize. After increasing by 89 percent in 2006, the average price of maize has dropped 10 percent so far this year (from US$ 138 to US$ 124 per ton). This drop is explained by positive production prospects in the United States, the main producer and consumer of this product. Favorable weather conditions, particularly in July (the plant’s pollination period), and larger cultivated areas would lead production to increase by 24 percent (70 million additional tons) in the 2007-2008 crop year relative to last year.
However, a price recovery is expected in the short run in view of the growing demand for this grain, particularly due to the strong dynamism of ethanol production in the United States and to unfavorable climatic conditions in Eastern and Western Europe.
table 11
WoRLD MAIZe SUPPLY AnD DeMAnD BALAnCe(millions of mT) term 2004/05 term 2005/06 term 2006/07 term 2007/08 1. Initial inventories 104 131 123 1012. world production 713 696 703 7743. world consumption 685 704 725 7704. Final inventories (1+2-3) 131 123 101 105
Source: uS department of Agriculture (September Report).
Graph 21CUOTATION OF MAIZE(US$ per TM)
170
150
130
110
90
70
50Dec.03 Dec.04 Dec.05 Dec.06 Dec.07 Dec.08 Dec.09
Source: Bloomberg and BCRP.
IR May.07Forecast
IR Sep.07
IR: Inflation Report.
Graph 20PRICE OF CHICKEN(Nuevos soles per kg.)
6.5
6.0
5.5
5.0
4.5
4.0Jan.02 Jan.03 Jan.04 Jan.05 Jan.06 Jan.07 Sep.07
Price Nov.05:S/. 4.6
Lower catch andsupply of mackerel
Fear of bird flusince October
Price Sep.07:S/. 6.1

.......��
Central Reserve Bank of Peru
..................................................................................................................................................................................................................................................
l Fuels: The domestic price of fuels increased by 6.4 percent on average between January and September 2007. The price of West Texas Intermediate (WTI) oil rose 29 percent in the international market in this period (26 percent in Nuevos Soles), increasing from US$ 62 per barrel in December 2006 to US$ 80 per barrel in September 2007.
This upward trend seen in the price of oil for four
consecutive years, the price of crude has consecutively posted historical highs (US$ 83.4 per barrel on September 21), is explained by constraints in the global supply of crude in a context of growing demand. These constraints are associated with the insufficient increase of the OPEC’s production quotas, which were lower than expected (the 500 thousand barrel-increase approved by the OPEC is insufficient to cover the growing demand of the northern hemisphere in the winter season). In addition to these structural factors, other factors contributing to this outcome include adverse climatic factors in the area of the Gulf of Mexico and uncertainty stemming from geopolitical factors in the Middle East.
The price of petroleum should decrease slightly in the rest of 2007, given that the spot prices are higher than the forward prices.
In this context, the average price of petroleum is forecast at US$ 69 per barrel in 2007, higher than the US$ 63 per barrel forecast in our previous Inflation Report. The forecasts for 2008 and 2009 were also revised upwards, given higher expectations that the market of crude will continue to be tight.
table 12
FUeL PRICeS (monthly percentage change)
2002 2003 2004 2005 2006 2007
Jan.-Sep. Year Jan.-Sep.
Fuels 15.6 8.9 17.8 6.9 1.8 -1.5 6.4Gasoline 15.7 9.7 17.7 9.2 1.0 -6.2 11.0Gas 11.3 4.2 15.3 -10.9 0.3 0.3 1.3Kerosene 20.4 13.0 20.3 21.0 3.6 2.2 5.3 Cuotation of petroleum wTI end of period (per barrel) uS dollars 29.4 32.1 43.3 59.4 63.8 61.9 79.9Nuevos Soles 103.5 111.3 142.0 203.3 207.2 198.6 250.6
Source: INeI and Bloomberg.
Graph 22CUOTATION OF WTI OIL AND FUEL PRICES(Dec. 2001 = 100)
345
295
245
195
145
95Jan.02 Jan.03 Jan.04 Jan.05 Jan.06 Jan.07 Sep.07
WTI Fuels
175165155145135125115105
95
WTI Fuels
Graph 23US INVENTORIES AND PRICE OF PETROLEUM
Dec.03 Dec.04 Dec.05 Dec.06 Dec.07 Dec.08 Dec.09
Graph 24 PETROLEUM PRICE
80
70
60
50
40
30
20
IR May.07
IR Sep.07
US$/barrel
IR: Inflation Report.
Forecast
400375350325300275250225200
May.02 Feb.03 Nov.03 Aug.04 May.05 Feb.06 Nov.06 Aug.07
Source: Bloomberg and US Department of Energy.
80
70
60
50
40
30
20
Millions of barrels US$/barrel
Inventories
Price

Inflation Report. September 2007
..................................................................................................................................................................................................................................................
�� .......
The impact of the rise in the international prices of crude and derivatives has been offset by the Fuel Price Stabilization Fund, which was extended until December 31, 2007. Likewise, in 2007, the Contingency Fund was increased by S/. 320 million (S/. 70 million in May,
S/. 100 million in July and S/. 150 million in August 2007). A balance of S/. 122 million should be available by early October.
l Public utility rates: The increase in the rates of electric energy (1.1 percent) and the reduction of telephone rates (-7.2 percent) between January and September 2007 are worth mentioning. Electric energy rates dropped 2.8 percent between April and May due to the annual update of band rates, which considered new electricity generation projects. These rates increased by 2.3 percent between June and July, due to the approval of the rural electrification act that considers a contribution equivalent to 2/1000 of 1 tax unit (UIT) for residential users. Moreover, this rate was increased by 1.6 percent in August due to the quarterly adjustment that considers the higher prices of fuel.
The drop in telephone rates reflects mainly the reduction in the basic monthly rent of the classic residential telephone line and a series of rate plans resulting from negotiations between the State and Telefonica.
Expectations
23. The forecast considers inflation expectations as these influence price formation in the economy. The results of the Survey on Macroeconomic Expectations show that expectations regarding inflation in 2007 range between 1.9 and 2.7 percent.
table 13
PUBLIC SeRVICeS tARIFFS (monthly percentage change)
2002 2003 2004 2005 2006 2007
Jan.-Sep. Year Jan.-Sep.
Public services 2.0 -2.0 6.2 -1.7 -1.2 -3.2 -0.2
electricity 7.9 4.6 12.0 -2.5 -4.7 -7.3 1.1
Telephones -8.3 0.3 -2.0 -7.0 -3.5 -6.2 -7.2
water 2.3 0.9 3.0 5.2 8.5 8.5 3.2
Source: INeI.

.......��
Central Reserve Bank of Peru
..................................................................................................................................................................................................................................................
According to the results of this survey, inflation expectations for 2008 are revised upwards, except in the case of economic analysts. Moreover, only the group of financial entities has revised inflation expectations for 2009 (2.0 percent), compared to the inflation expectations the group had in May (Inflation Report of May).
24. According to the results of this survey -carried out in August 2007-, 38 percent of the surveyed firms expressed that the prices of the inputs they used had increased, while 5 percent reported that they had declined. These results differ from those obtained in the survey conducted in November1/ 2006, when 33 percent of the surveyed firms reported rises in the price of the inputs they use.
The firms that experienced price increases used a series of mechanisms to deal with this situation, including the following: reducing profit margins; increasing productivity; reducing other costs; or seeking other options, such as replacing the raw materials by other inputs, replacing suppliers, eliminating the discounts and promotions they provided to clients producing end goods; or negotiating payment facilities or the extension of payment deadlines with their suppliers of raw materials.
table 15
ReSULtS on tHe BUSIneSSeS WItH An InCReASe oF tHe PRICe oF InPUtS All sectors Manufacture number of % number of % businesses businesses
Businesses with an increase 147 100 93 100of the price of inputs - Reduced margins 63 43 34 37 - Increase on the price of final products or services 46 31 34 37 - Increase in productivity 31 21 22 24 - Cost reduction 4 3 2 2 - other factors 3 2 1 1 Source: Survey of macroeconomic expectations BCRP, August 2007.
table 14
SURVeY on tHe PRICe oF InPUtS
All sectors Manufacture number of % number of %
businesses businessestotal 385 100 183 100 with an increase on the price of inputs 147 38 93 51 without a change on the price of inputs 220 57 81 44 with a decrease on the price of inputs 18 5 9 5 Source: Survey of macroeconomic expectations BCRP, August 2007.
Analysts Financial system Non-financial businesses institutions
Analysts Financial system Non-financial businesses institutions
Graph 27INFLATION RATE EXPECTATIONS 2009(In percentage)
2.0 2.01.6
2.52.5
2.0
May 2007 September 2007
Graph 26INFLATION RATE EXPECTATIONS 2008(In percentage)
2.0 2.0
1.6
2.22.02.0
May 2007 September 2007
Analysts Financial system Non-financial businesses institutions
Graph 25INFLATION RATE EXPECTATIONS 2007(In percentage)
1.8 1.9
1.5
2.7
1.9
2.5
May 2007 September 2007
1/ The results of this survey were included in our Inflation Report of January 2007.
Inflation Report. September 2007
..................................................................................................................................................................................................................................................
�4 .......
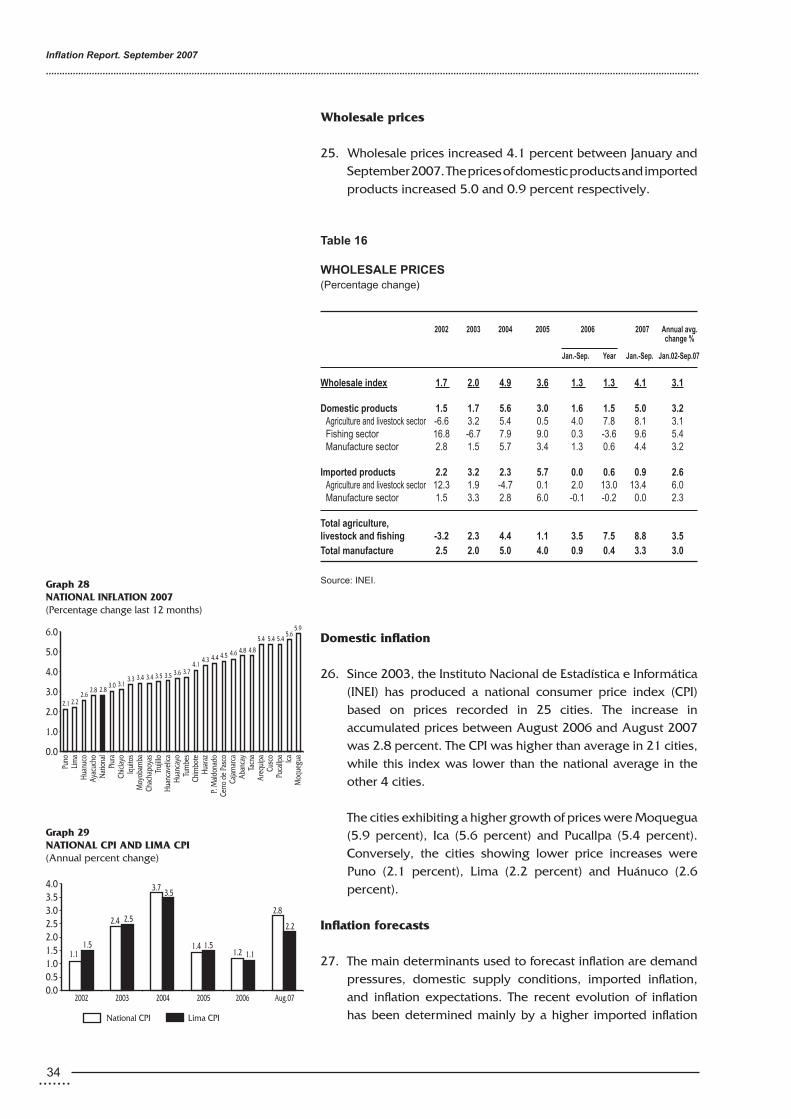
Wholesale prices
25. Wholesale prices increased 4.1 percent between January and September 2007. The prices of domestic products and imported products increased 5.0 and 0.9 percent respectively.
Domestic inflation
26. Since 2003, the Instituto Nacional de Estadística e Informática (INEI) has produced a national consumer price index (CPI) based on prices recorded in 25 cities. The increase in accumulated prices between August 2006 and August 2007 was 2.8 percent. The CPI was higher than average in 21 cities, while this index was lower than the national average in the other 4 cities.
The cities exhibiting a higher growth of prices were Moquegua (5.9 percent), Ica (5.6 percent) and Pucallpa (5.4 percent). Conversely, the cities showing lower price increases were Puno (2.1 percent), Lima (2.2 percent) and Huánuco (2.6 percent).
Inflation forecasts
27. The main determinants used to forecast inflation are demand pressures, domestic supply conditions, imported inflation, and inflation expectations. The recent evolution of inflation has been determined mainly by a higher imported inflation
table 16
WHoLeSALe PRICeS (Percentage change)
2002 2003 2004 2005 2006 2007 Annual avg.
change %
Jan.-Sep. Year Jan.-Sep. Jan.02-Sep.07
Wholesale index 1.7 2.0 4.9 3.6 1.3 1.3 4.1 3.1
Domestic products 1.5 1.7 5.6 3.0 1.6 1.5 5.0 3.2 Agriculture and livestock sector -6.6 3.2 5.4 0.5 4.0 7.8 8.1 3.1 Fishing sector 16.8 -6.7 7.9 9.0 0.3 -3.6 9.6 5.4 manufacture sector 2.8 1.5 5.7 3.4 1.3 0.6 4.4 3.2
Imported products 2.2 3.2 2.3 5.7 0.0 0.6 0.9 2.6 Agriculture and livestock sector 12.3 1.9 -4.7 0.1 2.0 13.0 13.4 6.0 manufacture sector 1.5 3.3 2.8 6.0 -0.1 -0.2 0.0 2.3
total agriculture, livestock and fishing -3.2 2.3 4.4 1.1 3.5 7.5 8.8 3.5 total manufacture 2.5 2.0 5.0 4.0 0.9 0.4 3.3 3.0
Source: INeI. Graph 28NATIONAL INFLATION 2007(Percentage change last 12 months)
6.0
5.0
4.0
3.0
2.0
1.0
0.0
Puno
Lim
aHu
anuc
oAy
acuc
hoNa
tiona
lPi
ura
Chicl
ayo
Iqui
tos
Moy
obam
baCh
acha
poya
s Tru
jillo
Huan
cave
lica
Huan
cayo
Tum
bes
Chim
bote
Huar
azP.
Mald
onad
oCe
rro d
e Pa
sco
Cajam
arca
Aban
cay
Tacn
aAr
equi
paCu
sco
Puca
llpa Ica
Moq
uegu
a
2.1
5.4 5.4 5.45.6
5.9
4.84.64.54.44.34.1
3.73.63.53.53.43.43.33.13.0
2.82.82.6
2.2
4.8
Graph 29NATIONAL CPI AND LIMA CPI(Annual percent change)
4.03.53.02.52.01.51.00.50.0
2002 2003 2004 2005 2006 Aug.07
National CPI Lima CPI
1.11.5
1.2 1.1
2.8
2.2
3.53.7
2.52.4
1.5 1.4
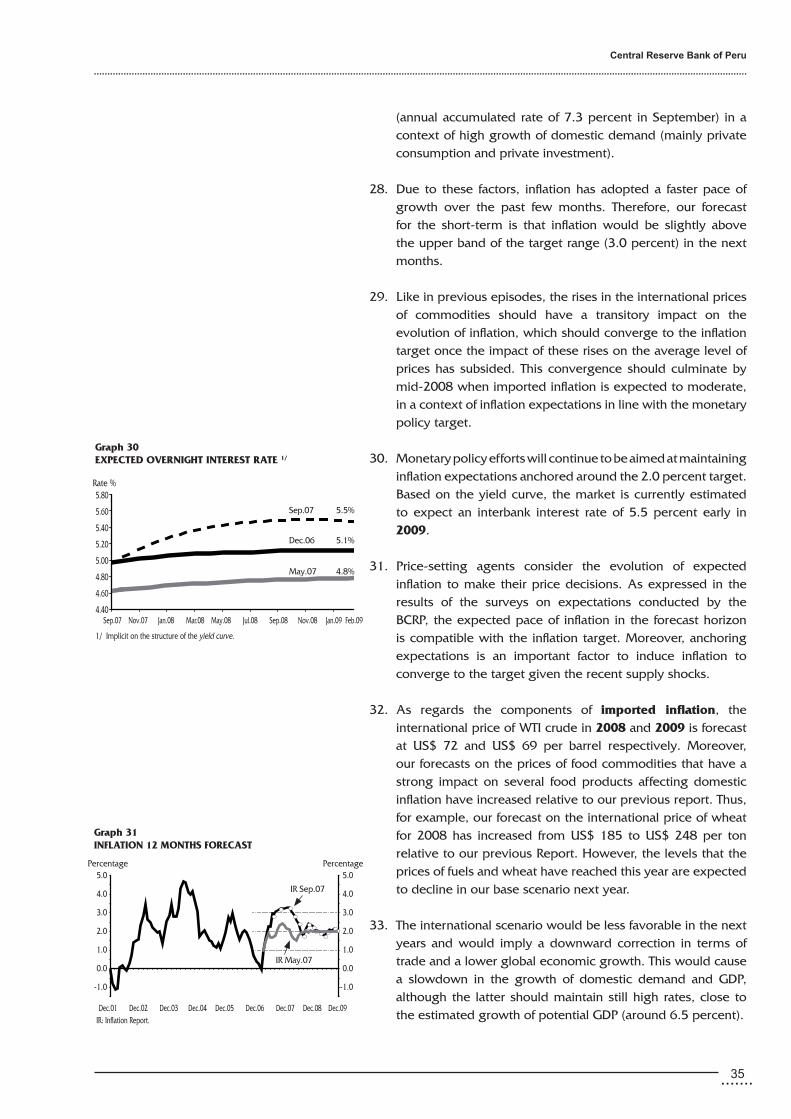
.......�5
Central Reserve Bank of Peru
..................................................................................................................................................................................................................................................
(annual accumulated rate of 7.3 percent in September) in a context of high growth of domestic demand (mainly private consumption and private investment).
28. Due to these factors, inflation has adopted a faster pace of growth over the past few months. Therefore, our forecast for the short-term is that inflation would be slightly above the upper band of the target range (3.0 percent) in the next months.
29. Like in previous episodes, the rises in the international prices of commodities should have a transitory impact on the evolution of inflation, which should converge to the inflation target once the impact of these rises on the average level of prices has subsided. This convergence should culminate by mid-2008 when imported inflation is expected to moderate, in a context of inflation expectations in line with the monetary policy target.
30. Monetary policy efforts will continue to be aimed at maintaining inflation expectations anchored around the 2.0 percent target. Based on the yield curve, the market is currently estimated to expect an interbank interest rate of 5.5 percent early in 2009.
31. Price-setting agents consider the evolution of expected inflation to make their price decisions. As expressed in the results of the surveys on expectations conducted by the BCRP, the expected pace of inflation in the forecast horizon is compatible with the inflation target. Moreover, anchoring expectations is an important factor to induce inflation to converge to the target given the recent supply shocks.
32. As regards the components of imported inflation, the international price of WTI crude in 2008 and 2009 is forecast at US$ 72 and US$ 69 per barrel respectively. Moreover, our forecasts on the prices of food commodities that have a strong impact on several food products affecting domestic inflation have increased relative to our previous report. Thus, for example, our forecast on the international price of wheat for 2008 has increased from US$ 185 to US$ 248 per ton relative to our previous Report. However, the levels that the prices of fuels and wheat have reached this year are expected to decline in our base scenario next year.
33. The international scenario would be less favorable in the next years and would imply a downward correction in terms of trade and a lower global economic growth. This would cause a slowdown in the growth of domestic demand and GDP, although the latter should maintain still high rates, close to the estimated growth of potential GDP (around 6.5 percent).
Graph 30 EXPECTED OVERNIGHT INTEREST RATE 1/
5.80
5.60
5.40
5.20
5.00
4.80
4.60
4.40
Sep.07
Rate %
Dec.06
May.07
5.5%
5.1%
4.8%
Sep.07 Nov.07 Jan.08 Mar.08 May.08 Jul.08 Sep.08 Nov.08 Jan.09 Feb.09
1/ Implicit on the structure of the yield curve.
Graph 31INFLATION 12 MONTHS FORECAST
5.0
4.0
3.0
2.0
1.0
0.0
-1.0
Dec.01 Dec.02 Dec.03 Dec.04 Dec.05 Dec.06 Dec.07 Dec.08 Dec.09
Percentage Percentage5.0
4.0
3.0
2.0
1.0
0.0
-1.0
IR May.07
IR Sep.07
IR: Inflation Report.
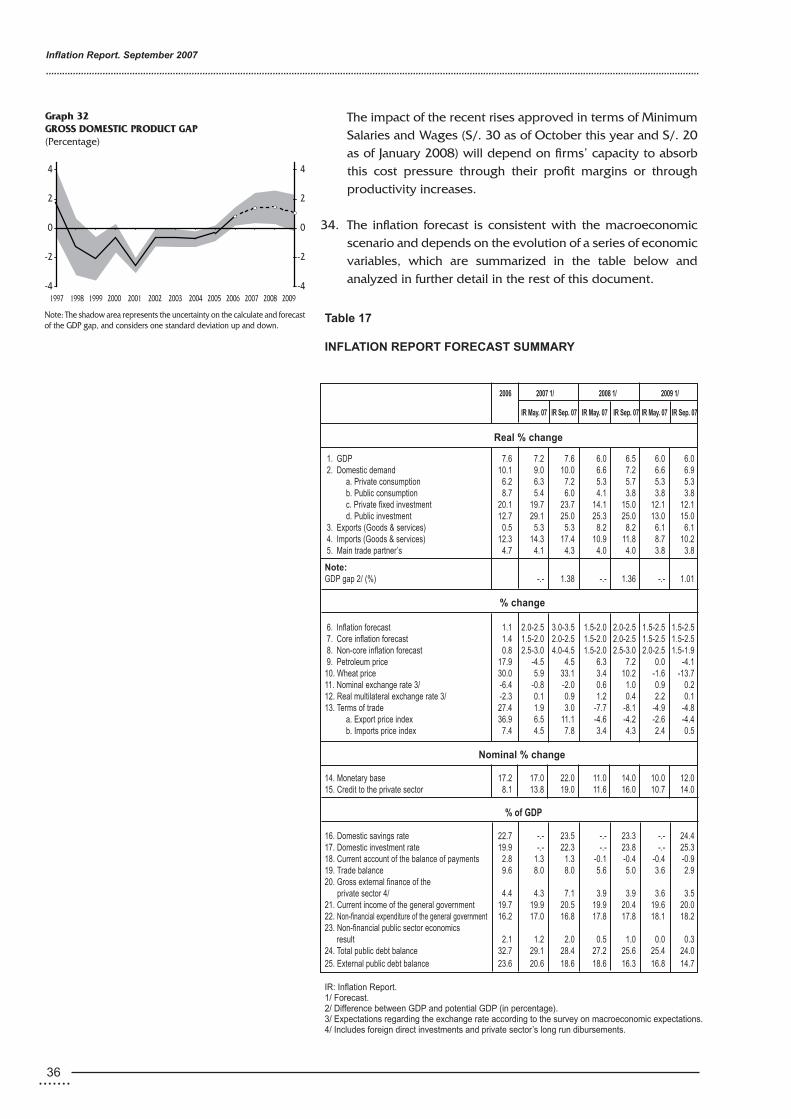
Inflation Report. September 2007
..................................................................................................................................................................................................................................................
�6 .......
The impact of the recent rises approved in terms of Minimum Salaries and Wages (S/. 30 as of October this year and S/. 20 as of January 2008) will depend on firms’ capacity to absorb this cost pressure through their profit margins or through productivity increases.
34. The inflation forecast is consistent with the macroeconomic scenario and depends on the evolution of a series of economic variables, which are summarized in the table below and analyzed in further detail in the rest of this document.
table 17
InFLAtIon RePoRt FoReCASt SUMMARY
2006 2007 1/ 2008 1/ 2009 1/
IR May. 07 IR Sep. 07 IR May. 07 IR Sep. 07 IR May. 07 IR Sep. 07
Real % change 1. GdP 7.6 7.2 7.6 6.0 6.5 6.0 6.0 2. domestic demand 10.1 9.0 10.0 6.6 7.2 6.6 6.9 a. Private consumption 6.2 6.3 7.2 5.3 5.7 5.3 5.3 b. Public consumption 8.7 5.4 6.0 4.1 3.8 3.8 3.8 c. Private fixed investment 20.1 19.7 23.7 14.1 15.0 12.1 12.1 d. Public investment 12.7 29.1 25.0 25.3 25.0 13.0 15.0 3. exports (Goods & services) 0.5 5.3 5.3 8.2 8.2 6.1 6.1 4. Imports (Goods & services) 12.3 14.3 17.4 10.9 11.8 8.7 10.2 5. main trade partner’s 4.7 4.1 4.3 4.0 4.0 3.8 3.8
note: GdP gap 2/ (%) -.- 1.38 -.- 1.36 -.- 1.01 % change 6. Inflation forecast 1.1 2.0-2.5 3.0-3.5 1.5-2.0 2.0-2.5 1.5-2.5 1.5-2.5 7. Core inflation forecast 1.4 1.5-2.0 2.0-2.5 1.5-2.0 2.0-2.5 1.5-2.5 1.5-2.5 8. Non-core inflation forecast 0.8 2.5-3.0 4.0-4.5 1.5-2.0 2.5-3.0 2.0-2.5 1.5-1.9 9. Petroleum price 17.9 -4.5 4.5 6.3 7.2 0.0 -4.110. wheat price 30.0 5.9 33.1 3.4 10.2 -1.6 -13.711. Nominal exchange rate 3/ -6.4 -0.8 -2.0 0.6 1.0 0.9 0.212. Real multilateral exchange rate 3/ -2.3 0.1 0.9 1.2 0.4 2.2 0.113. Terms of trade 27.4 1.9 3.0 -7.7 -8.1 -4.9 -4.8 a. export price index 36.9 6.5 11.1 -4.6 -4.2 -2.6 -4.4 b. Imports price index 7.4 4.5 7.8 3.4 4.3 2.4 0.5
nominal % change 14. monetary base 17.2 17.0 22.0 11.0 14.0 10.0 12.015. Credit to the private sector 8.1 13.8 19.0 11.6 16.0 10.7 14.0 % of GDP 16. domestic savings rate 22.7 -.- 23.5 -.- 23.3 -.- 24.417. domestic investment rate 19.9 -.- 22.3 -.- 23.8 -.- 25.318. Current account of the balance of payments 2.8 1.3 1.3 -0.1 -0.4 -0.4 -0.919. Trade balance 9.6 8.0 8.0 5.6 5.0 3.6 2.920. Gross external finance of the private sector 4/ 4.4 4.3 7.1 3.9 3.9 3.6 3.521. Current income of the general government 19.7 19.9 20.5 19.9 20.4 19.6 20.022. Non-financial expenditure of the general government 16.2 17.0 16.8 17.8 17.8 18.1 18.223. Non-financial public sector economics result 2.1 1.2 2.0 0.5 1.0 0.0 0.324. Total public debt balance 32.7 29.1 28.4 27.2 25.6 25.4 24.025. external public debt balance 23.6 20.6 18.6 18.6 16.3 16.8 14.7 IR: Inflation Report. 1/ Forecast. 2/ difference between GdP and potential GdP (in percentage). 3/ expectations regarding the exchange rate according to the survey on macroeconomic expectations.4/ Includes foreign direct investments and private sector’s long run dibursements.
Graph 32GROSS DOMESTIC PRODUCT GAP(Percentage)
4
2
0
-2
-41997 1998 1999 2000 2001 2002 2003 2004 2005 2006 2007 2008 2009
Note: The shadow area represents the uncertainty on the calculate and forecast of the GDP gap, and considers one standard deviation up and down.
4
2
0
-2
-4

.......37
Central Reserve Bank of Peru
..................................................................................................................................................................................................................................................
BoX 2
SUPPLY SHoCKS AnD InFLAtIon tARGetS
The aim of the BCRP is that 12-month inflation shows a rate of 2 percent, plus or minus one percentage point, during most of the time. Inflation may eventually fall out of this range, for example, due to a supply shock. If this shock is likely to entail a permanent impact on prices, the Central Bank will try to induce inflation back to the target range, taking into account monetary policy lags.
when the inflation targeting scheme was first adopted in January 2002, the target that was then announced was that inflation should reach an accumulated rate of 2.5 percent, plus or minus one percentage point, by december. This target was maintained since then and until 2005. In said context, compliance with the inflation target was evaluated at the end of each calendar year between 2002 and 2005.
However, since 2006, the BCRP has emphasized a continuous follow-up of the target and compliance with this target is evaluated every month and not only in december. due to monetary policy lags, the highest impact of monetary instruments is only seen in a 12-24 month-horizon and not at the end of the calendar year. Therefore, the goal of the BCRP’ monetary policy is that inflation remains within the target range (2 percent, plus or minus percentage points) for the most time in this period.
The BCRP’s monetary policy decisions are based on an important amount of data used to forecast inflation. These decisions affect inflation and contribute to maintain it within the target range. However, due to unpredictable factors -such as the price of petroleum o some food products-, inflation may temporarily fall out of the acceptable range. These factors stem mainly from supply shocks involving a high volatility.
As illustrated in the figure below, the episodes of abrupt changes in monthly inflation are transitory and only last a few months. moreover, abrupt price changes (upwards and downwards) are mainly associated with volatility in food products and beverages, which account for 47.5 percent of the CPI basket. The figure shows the monthly inflation rate observed in the CPI and the mean of said inflation rates, plus/minus one standard deviation of the monthly inflation rate, in the december 2002 - August 2007 period. The table also shows four periods of extreme and consecutive increases in inflation. These periods with high inflation shocks had a short duration (between 2 and 4 months).
If inflation deviates upwards or downwards from the target -regardless of the month when these deviations occur-, the BCRP first evaluates the duration that these shocks are estimated to have. Generally, inflation shocks on food products are temporary and therefore require no immediate reaction from the Central Bank to neutralize them. on some occasions, monetary policy measures may be adopted if inflation expectations in the medium-term should start to rise, thereby extending the impact of these shocks to other prices in the economy. The BCRP always tries to induce inflation back to the target in an orderly manner, considering the lags with which monetary policy affects inflation.
InFLAtIon(Percentage change last 12 months)
5
4
�
�
�
0
-1
-2
6 months over thetarget range
10 months belowthe target range
5 months belowthe target range
6 months belowthe target range
Jan.02 Jan.03 Jan.04 Jan.05 Jan.06 Jan.07 Sep.07

Inflation Report. September 2007
..................................................................................................................................................................................................................................................
�8 .......
The inflation target was adopted in January 2002, in a context when 12-month inflation posted -1 percent. In december 2007, inflation reached 1.5 percent, a level within the inflation range. Since then and until September 2007, inflation has been within the target range in 66 percent of this time, and 12-month inflation has shown an average rate of 2.0 percent.
BoX 3
PRICe InCReASeS In FooD PRoDUCtS AnD InFLAtIonARY PReSSUReS
The high prices of oil over the past few years and increased concerns about environmental issues have generated a greater interest in the industry of biofuels. As a result of this, the prices of the raw materials used to elaborate biofuels -particularly maize, soy bean, and sugar- have increased significantly.
moreover, this has also indirectly affected the price of other food products, whose production has declined due to crop substitution -as in the case of wheat in the united States-, as well as the price of other products associated to the productive chain of biofuels.
Furthermore, the global demand for food products has also increased, particularly in the case of China, whose per capita consumption grew from 2,050 kilocalories three decades ago to 3,000 kilocalories today. Thus, China has become the world’s first importer of soy bean.
Together with adverse climatic conditions which affected production in the main producing areas -droughts in the uS mid-west, in western europe and in Australia, and excessive rainfall in western europe-, these structural factors have led prices to reach record levels (i.e. wheat rose to a monthly average of uS$ 298 per ton, increasing by 81 percent in the last 12 months) or to increase significantly this year (i.e. the prices of maize and soy bean rose by 70 percent and 44 percent respectively) in a context of low global inventories.
This external supply shock, characterized by a significant increase in the prices of the main basic food products, has generated pressures on inflation in many countries. In Peru, a higher price has been observed in the case of bread and chiken meat, which use wheat and maize as inputs respectively. Likewise, the average price of soy bean derivatives, such as oil, has increased above the average. Thus, in August the prices of food products and beverages included in the CPI basket showed a 12-month variation that was 1 percentage point higher than the variation observed in the total CPI (3.3 versus 2.2 percent).
MontHLY InFLAtIon
1.1
0.9
0.7
0.5
0.3
0.1
-0.1
-0.3
-0.5
Feb.03 - mar.032,7%
dec.02 dec.03 dec.04 dec.05 dec.06 Sep.07
1.1
0.9
0.7
0.5
0.3
0.1
-0.1
-0.3
-0.5
Perc
enta
ge
Percentage
dec.03 - mar.042.7%
Jan. - Apr. 062.0%
may. - Jul. 071.4%
Average + 1 s.d.
Average
Average - 1 s.d.
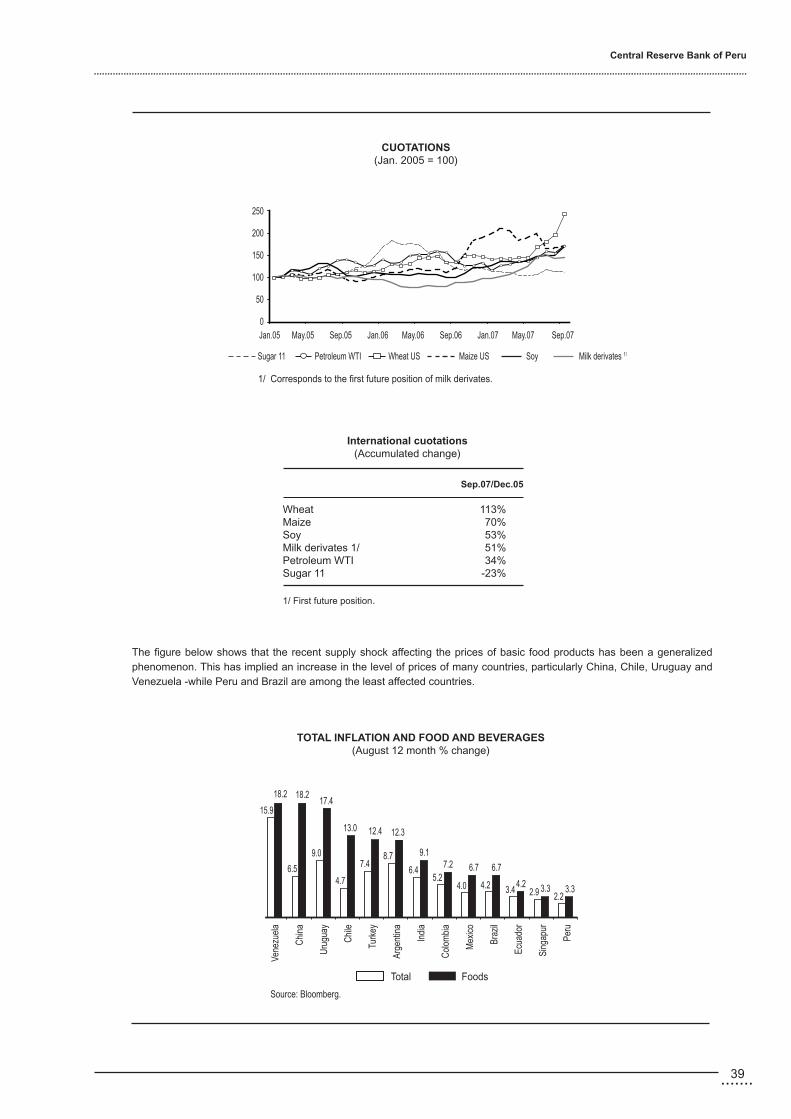
.......39
Central Reserve Bank of Peru
..................................................................................................................................................................................................................................................
The figure below shows that the recent supply shock affecting the prices of basic food products has been a generalized phenomenon. This has implied an increase in the level of prices of many countries, particularly China, Chile, uruguay and Venezuela -while Peru and Brazil are among the least affected countries.
International cuotations(Accumulated change)
Sep.07/Dec.05
wheat 113%maize 70%Soy 53%milk derivates 1/ 51%Petroleum wTI 34%Sugar 11 -23%
1/ First future position.
CUotAtIonS(Jan. 2005 = 100)
250
200
150
100
50
0Jan.05 may.05 Sep.05 Jan.06 may.06 Sep.06 Jan.07 may.07 Sep.07
Sugar 11 Petroleum wTI wheat uS maize uS Soy milk derivates �/
1/ Corresponds to the first future position of milk derivates.
totAL InFLAtIon AnD FooD AnD BeVeRAGeS(August 12 month % change)
Vene
zuel
a
Chi
na
uru
guay
Chi
le
Turk
ey
Arge
ntin
a
Indi
a
Col
ombi
a
mex
ico
Braz
il
ecua
dor
Sing
apur
Peru
15.9
6.5
12.312.413.0
17.418.218.2
2.22.93.44.24.05.2
3.33.34.2
6.76.77.29.1
6.4
8.77.4
4.7
9.0
Source: Bloomberg.
Total Foods

Inflation Report. September 2007
..................................................................................................................................................................................................................................................
40 .......
when we compare Peru with the rest of countries included in this sample, we can see that the sample’s median indicates that the impact of price rises in food products�/ in the last 12 months -until August- was 9.1 percentage points (compared with the 4.9 percent of the median of total CPI), higher than in the Peruvian case (3.3 percent in the case of CPI for food products and beverages versus 2.2 percent in the case of total CPI).However, it should be pointed out that it is possible that the structural factors underlying these price increases could prolong these supply shocks and generate changes in relative prices. The impact on inflation in each country will depend on the percentage of food products in terms of the consumer basket. In developed countries, such as the united States, food products account for around 10 percent of the basket, while in emerging countries they represent approximately 30 percent (China) and over 60 percent in many African countries. In Peru, food products and beverages represent 48 percent of the basket.
To offset the impact of these international price rises, in July the government reduced the tariff on wheat (17 percent) and on wheat flour (25 percent) to 0 percent. moreover, the 5 percent additional tariff was eliminated for 301 items. Today, only 65 item lines are subject to this 5 percent additional tariff: alcoholic beverages (a 12 percent tariff) and meat (a 20 percent tariff).
This tariff reduction has increased the effective rate of protection of some manufactured products. For example, according to preliminary estimates, the effective rate of protection of some wheat-derived products would have increased from 27 percent to 45 percent. At present, the tariff on bread, noodles, pasta and biscuits is 20 percent, while the tariff on wheat and wheat flour is 0 percent.
on the other hand, the tariff reduction implemented in december 2006 increased the effective rate of protection of vegetable oil from 27 to 40 percent. The tariff on this product is 12 percent, while the tariff applied on unprocessed soybean oil was reduced to 0 percent. A high percentage of oil imports from Bolivia are tax-relieved, although they cover a minimum percentage of the demand for oil.
Permanent and transitory shocks on the level of prices
Inflation is an economic phenomenom characterized by a continuous and generalized increase in the prices that consumers pay for goods and services. Therefore, permanent one-time (non-recurrent) price upward or downward changes, or changes that revert afterwards given their temporary nature do not have a permanent impact on inflation. If a one-time permanent increase is observed in one or in several products, the consumer price index would show a higher rate only in that period, after which inflation should return to its previous rate. If the phenomenon is transitory and the upward or downward change in prices reverts, the following period will show opposite sign variations. Hence, no permanent effect is seen in inflation.
2/ In the case of Latin America we obtain information on food and beverage.
eFFeCtS oF A SHoCK In tHe PRICe LeVeLS
Increase on the Price variation price levels rate
1st. term 2nd. term 1st. term 2nd. term Cases
Permanent increase or Increase on the price of bread afterreduction on the price an increase on the wheat cuotationlevels (July 2007)
Temporary increase or
reduction on the price Increase on the price of the chicken
levels meat (may 2007)
= + 0
+ -
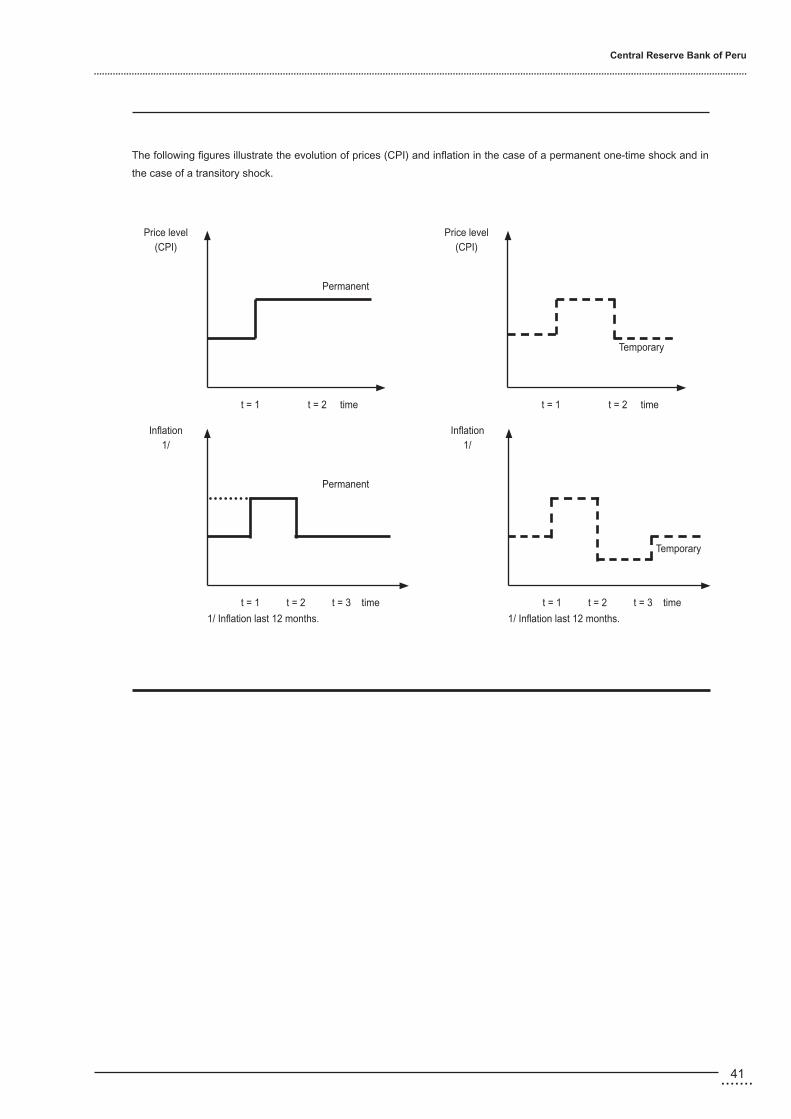
.......4�
Central Reserve Bank of Peru
..................................................................................................................................................................................................................................................
The following figures illustrate the evolution of prices (CPI) and inflation in the case of a permanent one-time shock and in
the case of a transitory shock.
Price level (CPI)
t = 1 t = 2 time
Permanent
Price level (CPI)
t = 1 t = 2 time
Temporary
Inflation�/
t = 1 t = 2 t = 3 time
Permanent
Inflation�/
t = 1 t = 2 t = 3 time
Temporary
1/ Inflation last 12 months.1/ Inflation last 12 months.

Inflation Report. September 2007
..................................................................................................................................................................................................................................................
4� .......
IV. Economic activity
In the current stage of expansion of the Peruvian economy, domestic demand continues to show important increases, above the growth of the output. Particularly, private consumption and private investment have shown a faster pace of growth, reflecting consumer and business’ optimism in a context of increased disposable income due to higher terms of trade and the growth of employment. Considering these aspects, our forecast on the growth of GDP in 2007 has been increased from 7.2 to 7.6 percent. However, a less favorable international environment in 2008 would imply a lower growth of disposable income, thus moderating the drive of demand. Real exports should recover in 2008 and 2009, with annual rates of over 6 percent.
35. During the first half of 2007 GDP continued to grow at higher levels than the potential output. This was associated with a generalized expansion of expenditure components, a situation observed since early 2006. With the current level of growth of credit and monetary aggregates, the pace of growth of private expenditure -main component of demand, both consumption and fixed investment- has increased from 8.8 percent in 2006 to 10.3 percent in the first six months of 2007. This dynamism has been higher than the one forecast in our Inflation Report of May, which has led us to revise the forecasts on the growth of consumption and investment in 2007, given that the indicators of these variables continue to show high levels of increase.
The output gap -defined as surplus production in terms of the potential output- has been positive since 2006 and has shown a continuous pace of expansion throughout 2007 due to the high growth of demand. Furthermore, some of the investments being made by the private sector are still not reflected in the potential output -especially in the case of

.......4�
Central Reserve Bank of Peru
..................................................................................................................................................................................................................................................
Graph 34 GDP GROWTH RATE(Real percentage change)
Graph 36CONTRIBUTIONS TO THE GDP GROWTH(Percentage points)
1998 1999 2000 2001 2002 2003 2004 2005 2006 2007* 2008* 2009*
12
10
8
6
4
2
0
-2
-4
-6
Gross private fixed investment Net external demand
Public consumption and investment Change in inventories
Private consumption GDP growth rate
* Forecast.
investments associated with mining and construction-, which could eventually cause a transitory reduction of the unused productive capacity.
36. The forecast considers that the output gap would start to decline as of 2008, given the international scenario considered in this Report. The expected evolution of terms of trade and, therefore, of disposable income in the next years would induce a slow down in private spending. Therefore, a lower drive of demand is forecast for 2008 and 2009. This would cause the growth of the output to converge to a level closer to the potential output, as a result of which inflation would be around the 2.0 percent target by the second half of 2008.
GDP should grow 6.5 percent in 2008, in line with the international scenario considered, coupled by a 7.2 percent in domestic demand. In 2009, both the output and demand would moderate their growth, with rates of 6.0 and 6.9 percent respectively.
37. This forecast scenario considers that investment would grow up to levels of 25.3 percent of GDP (compared to the current levels of around 20 percent of GDP), a level of investment unseen in the economy since the early 80s. This higher growth of the economy would also contribute to increase domestic saving, which would then become the main factor used to finance investment. In turn, not only would this reduce requirements of external financing, but also contribute to the sustainability of the balance of payments.
table 18
GLoBAL DeMAnD AnD SUPPLY (Real percentage change)
2006 2007* 2008* 2009*
I Sem. Year I Sem. IR May.07 IR Sep.07 IR May.07 IR Sep.07 IR May.07 IR Sep.07
1. Domestic demand 9.0 10.1 10.4 9.0 10.0 6.6 7.2 6.6 6.9 a. Private consumption 5.8 6.2 7.6 6.3 7.2 5.3 5.7 5.3 5.3 b. Public consumption 8.9 8.7 3.5 5.4 6.0 4.1 3.8 3.8 3.8 c. Private investment 20.8 20.1 21.9 19.7 23.7 14.1 15.0 12.1 12.1 d. Public investment 11.1 12.7 6.3 29.1 25.0 25.3 25.0 13.0 15.02. exports 0.6 0.5 3.3 5.3 5.3 8.2 8.2 6.1 6.13. Imports 11.7 12.3 17.1 14.3 17.4 10.9 11.8 8.7 10.24. GDP 6.7 7.6 7.8 7.2 7.6 6.0 6.5 6.0 6.0IR: Inflation Report.
* Forecast.
6.06.5
7.6
Graph 35DOMESTIC DEMAND GROWTH RATE(Real percentage change)
1998 1999 2000 2001 2002 2003 2004 2005 2006 2007* 2008* 2009* * Forecast.
-0.9
2.3
-3.1
6.97.2
10.010.1
5.7
4.03.74.1
-0.4
1998 1999 2000 2001 2002 2003 2004 2005 2006 2007* 2008* 2009** Forecast.
-0.7
0.9
3.0
7.6
6.7
5.1
4.0
5.0
0.2
1998 1999 2000 2001 2002 2003 2004 2005 2006 2007* 2008* 2009*
Graph 33INVESTMENT-SAVING GAP(Percentage of GDP)
30
25
20
15
10
5
6
3
0
-3
-6
-9
Saving, investment External GAP
Total investment Domestic saving External GAP*** Forecast.** Difference between investment and domestic saving.

Inflation Report. September 2007
..................................................................................................................................................................................................................................................
44 .......
Domestic saving should grow from 22.7 of GDP in 2006 to 24.4 percent of GDP in 2009, the third highest rate of saving observed since the 70s. This rate was higher only in 1979 and 1980 due to the rise of the prices of minerals. However, in contrast with those years, the growth currently foreseen in domestic saving would take place in a context of strong dynamism of GDP and of a deterioration of terms of trade.
38. Demand has been importantly driven by the faster pace of growth of private consumption during the first half of 2007. After increasing by 6.7 percent in the second half of 2006, private consumption grew 7.6 percent in the first half of 2007 -a higher rate than the one forecast in our previous Inflation Report (6.9 percent). This rate grew at a faster pace after household consumption showed an increase of 8.8 percent since the second half of 1995.
This dynamics was associated with the evolution of national disposable income, with higher levels of employment and with the expansion of consumer loans. The national disposable income followed a positive trend in the first half of this year and increased by 11.2 percent -a similar rate to the average rate shown in the previous year, and higher than the growth rate of GDP- mainly due to the fact that purchasing power has considerably increased as a result of the positive performance of terms of trade.
Moreover, employment also continued growing at important levels. Urban employment in firms with 10 and more workers increased by 8.4 percent in the first half of the year -a rate slightly higher than the 8.2 percent posted in the previous 6
table 19
nAtIonAL DISPoSABLe InCoMe (Real percentage change)
2005 2006 2007
I Sem. Year I Sem.
Gross domestic product 6.7 6.7 7.6 7.8
Gross national product 5.4 3.1 4.9 9.1
Gross national income 6.6 7.9 11.1 11.2
National disposable income �/ 6.8 8.1 11.3 11.2
Absorption�/ 5.8 10.5 14.1 13.9 1/ Includes investment income, gains and losses due to change in terms of trade and net
transfers from non-residents.2/ measure the purchasing power of peruvian residents. It is obtained by adding discounted
exports and imports to national income disposable.
Graph 39PRIVATE CONSUMPTION GROWTH RATE(Real percentage change)
1998 1999 2000 2001 2002 2003 2004 2005 2006 2007* 2008* 2009** Forecast.
-0.9
3.7
-0.4
5.35.7
7.26.5
4.4
3.53.1
4.6
1.5
Graph 38GOODS AND SERVICES IMPORTS GROWTH RATE(Real percentage change)
1998 1999 2000 2001 2002 2003 2004 2005 2006 2007* 2008* 2009** Forecast.
2.3
10.211.8
17.4
12.310.610.6
3.62.82.73.8
-15.2
Graph 37GOODS AND SERVICES EXPORTS GROWTH RATE(Real percentage change)
1998 1999 2000 2001 2002 2003 2004 2005 2006 2007* 2008* 2009* * Forecast.
5.6
15.2
6.1
8.2
5.3
0.5
6.27.56.8
8.07.6
15.2

.......45
Central Reserve Bank of Peru
..................................................................................................................................................................................................................................................
388
months, and over two percentage points higher than the one recorded in the first half of 2006. The decentralized growth of employment should be highlighted, particularly in activities such as commerce, transport and services -the main activities demanding labor outside the capital city-, with a positive impact on household spending in cities other than Lima.
These increased incomes are coupled by high levels of consumer confidence as reflected in Apoyo’s Confidence Index (INDICCA), which has been exhibiting levels of optimism since February.
39. In a context of favorable credit conditions in a financial system interested in promoting bankarization by incorporating new clients to the system, households are more willing to purchase durable goods, such as electric appliances and vehicles (sales of cars increased twofold in the first half of the year relative to the same period in 2005).
40. These indicators have shown a high pace of growth throughout the year and the trend is expected to continue. Considering that the dynamism of consumption observed during the first half of the year was higher than expected -as well as the recovery of consumer confidence seen in August-, the growth of private consumption in 2007 has been revised upwards from 6.3 percent to 7.2 percent. This forecast considers a lower pace of growth in the second half of the year than in the first half of 2007, in part due to a statistical effect given the high level of expansion observed by the end of 2006.
41. Furthermore, business opportunities associated with consumers’ growing demand and the reduction of firms’ unused productive capacity has led entrepreneurs to continue expanding the size of their firms. Therefore, private investment has been the most dynamic component of demand since the current stage of expansion started. Since 2006, private invesment has grown at rates of around 20 percent, posting a rate of 21.9 percent in the first half of this year. It is worth highlighting that private investment increased 24.3 percent in the third quarter alone.
This important dynamism, unheard of since 1995, is contributing to expand the economy’s productive capacity not only by means of the increase seen in terms of capital assets, but also by means of the more modern technologies incorporated to the productive process. Reflecting this evolution, it is worth pointing out some indicators of capital formation, such as the fact that imports of capital goods have been growing at rates of over 40 percent, coupled by the favorable performance shown by the construction industry.
Graph 43DURABLE CONSUMER GOODS IMPORTSIN THE FIRST SEMESTER(Millions of US$)
IS.02 IS.03 IS.04 IS.05 IS.06 IS.07
331
439
514
635
381
Graph 41URBAN EMPLOYMENT IN COMPANIES WITH 10 OR MORE WORKERS(Jan. 2004 = 100)
Peru urban Metropolitan Lima Other urban areas
135
130
125
120
115
110
105
100
95
90 Oct.97 Dec.98 Feb.00 Apr.01 Jun.02 Aug.03 Oct.04 Dec.05 Feb.07
Source: MTC.
Graph 40CONSUMER CONFIDENCE INDEX: INDICCA
IQ.03 3Q.03 IQ.04 3Q.04 IQ.05 3Q.05 IQ.06 3Q.06 IQ.07 3Q.07Source: Apoyo.
40
5756575352
434341403837
3433
383938
5349
35
31
Graph 42CONSUMPTION CREDITS FROM FINANCIAL BUSINESSES AND BANKS(Real percentage change)
IQ.05 2Q.05 3Q.05 4Q.05 IQ.06 2Q.06 3Q.06 4Q.06 IQ.07 2Q.07Source: SBS.
15
2829293029
26
17

Inflation Report. September 2007
..................................................................................................................................................................................................................................................
46 .......
6,090
As a result of the growth of private investment at rates three times higher than the growth of GDP, its contribution to the expansion of GDP has also increased. This growth of capital formation has been coupled by similar increases in private saving, particularly since last year, thus facilitating investment’s financing. Additionally, firms’ profits continued to show a growing trend. The profits of the firms listed in the stock exchange alone grew by S/. 698 million Nuevos Soles (19.3 percent) between the second quarter of 2006 and 2007, which represents another option for financing future investments.
42. The forecast on the growth of private investment in 2007 has been revised upwards from 19.7 percent to 23.7 percent, considering the above-mentioned factors and considering that the business climate would continue to be favorable. This is supported by the fact that 42 percent of the entrepreneurs heading non-financial entities consider that the economy will improve in the following 3 months, according to the BCRP’s Monthly Survey on Macroeconomic Expectations. Moreover, according to the survey carried out in July, entrepreneurs are more willing to invest (and plan to increase investment by 24 percent in 2007).
table 20
PRIVAte InVeStMent SURVeY (millions of uS$) 2006 2007 *
Survey Dec.06 Survey Jul.07
Agriculture and livestock 36 120 108
Fishing 151 242 384
mining and fuel �/ 1,685 1,310 1,383
manufacturing 530 934 944
electricity, water and gas 184 406 350
Construction 29 49 139
Commerce 180 279 234
Transport and telecomunications 486 566 522
Services 44 51 73
total 3,325 3,956 4,136
% Chg. 19 24 1/ The reduction is explained by the investment of $ 479 million Cerro Verde in 2006.(*) macroeconomic expectation Survey from BCRP.
Graph 45CAPITAL GOODS IMPORTS IN THE FIRST SEMESTER1/
(Annual percentage change)
1S.02 1S.03 1S.04 1S.05 1S.06 1S.07 1/ Non includes construction materials.
-20.0
14.7
41.2
34.8
20.122.9
1998 1999 2000 2001 2002 2003 2004 2005 2006 2007* 2008* 2009*
* Forecast.Private saving Private investment
Graph 46SAVING AND INVESTMENT OF PRIVATE SECTOR(Percentage of GDP)25
20
15
10
5
0
Graph 44FAMILY VEHICLES SALES IN THE FIRST SEMESTER(Units)
1S.02 1S.03 1S.04 1S.05 1S.06 1S.07 Source: Araper.
3,967
12,676
8,655
4,4184,296
Graph 47ECONOMIC SITUATION IN THE NEXT 3 MONTHS(In percentage - Quarter average)
Mejor Peor
26
13 13
4545
39
26
18
2933
29
28
29
24
1819
24
21
25
3737
27
5 021
610
6223237
9
554
7
II III IV I II III IV I II III IV I II III IV I II III IV I II Jul.-Ago.2002 2003 2004 2005 2006 2007
46
1
42
3
Source: BCRP survey on macroeconomic expectations.

.......47
Central Reserve Bank of Peru
..................................................................................................................................................................................................................................................
Investment should grow by rates of two digits in the next years, thus reaching levels of growth in GDP terms that have not been seen in the past 25 years. These forecasts include the implementation of important projects announced in various sectors, as well as the favorable outlook of economic agents regarding the expansion of the economy.
43. According to the Central Bank’s Survey on Macroeconomic
Expectations, economic agents have revised upwards their expectations on the growth of GDP. A rate of 7.5 percent is expected in 2007 -higher than the 7.0-7.3 percent range. Economic analysts and financial institutions have increased their forecasts for 2008 to 6.7 and 6.5 percent respectively, while non-financial firms maintain their growth expectations at 7.0 percent. Furthermore, rates ranging between 6.0 and 7.0 percent are expected for 2009.
44. The growth of investment in the 2007 - 2010 period would be generalized and more evident due to the magnitude of the projects implemented mainly in the sectors of mining, energy and hydrocarbons, telecommunications, and services. Most of the investments in large projects would be made in the mining sector and would include road construction projects, hydraulic works, mining pipelines, ports, etc., in addition to investment in mines. Among the most important projects to be implemented in the 2007 - 2010 period, the following should be pointed out: the Toromocho project (Junin) will be implemented by the Peru Copper Corporation and will involve an investment of around US$ 1,500 million; Rio Blanco (Piura) will be implemented by Zijing Mining Group and will involve an investment of approximately US$ 1,400 million; and the Minas Conga project (Cajamarca) of Minera Yanacocha will involve an investment of US$ 935 million.
Likewise, in a context of high prices of hydrocarbons, important projects in gas and petroleum production and commercialization will be carried out with private investment. For example, Perú LNG is planning to invest US$ 2,200 million in Camisea II to transport liquefied natural gas in the 2007 - 2010 period; Barrett Resources Perú LLC is planning to invest US$ 1,600 million to develop projects for the extraction of heavy petroleum in the Peruvian Amazon region; Petrobras would start an investment program for a total of US$ 800 million to implement a petrochemichal plant in the south of the country and to carry out petroleum exploration activities in the northen Amazon areas.
In the telecommunication sector, it is worth mentioning the projects to be implemented by Telefónica del Perú (for a total of US$ 1 billion) to expand the mobile and wide-band grids, as well as those to be developed by América Móvil (Claro)
Graph 48 GDP GROWTH(Average variation rate last 4 quarters)
7.5
5.5
3.5
1.5
Observed
2002 2003 2004 2005 2006 2007 2008 2009
7.5
5.5
3.5
1.5
IR May.07
IR Sep.07
Forecast
7.6
6.56.0
IR: Inflation Report.
GDP GROWTH EXPECTATIONS 2009
Analysts Financial system Non-financial businesses
5.9
7.07.0
6.06.06.1
May 2007 September 2007
GDP GROWTH EXPECTATIONS 2008
Analysts Financial system Non-financial businesses
6.0
7.06.56.3
6.16.1
January 2007 May 2007 September 2007
6.7 6.57.0
Graph 49GDP GROWTH EXPECTATIONS 2007
Analysts Financial system Non-financial businesses
6.87.3
7.07.06.5
7.2
January 2007 May 2007 September 2007
7.5 7.5 7.5

Inflation Report. September 2007
..................................................................................................................................................................................................................................................
48 .......
in mobile telephony between 2007 and 2008, which would amount to US$ 560 million. Investments in the industry sector would include US$ 500 million for the expansion of the refining plant of Cajamarquilla by Votorantim Metais; US$ 450 million for the exploitation of Bayovar’s phosphate deposits by the Brazilian company Vale do Rio Doce; and the construction of a cement plant by Camargo-Correa, among other investments.
Moreover, investments would also be made to develop other projects, such as the construction of malls and commercial shops in the provinces of Trujillo, Chiclayo, Arequipa, Huancayo; the hidro-energy project the Platanal (Cañete), which would imply an investment of US$ 180 million; and the construction of a port in Ancon by the Grupo Romero, which would involve an investment of US$ 200 million.
table 21
InVeStMent PRoYeCtS: 2007-2010(millions of uS$) Sector / Business Project Amount MInInG 9,697From which: Peru Copper S.A. Toromocho 1,500 Zijin mining Group Rio Blanco 1,400 minera yanacocha minas Conga 935 xstrata Las Bambas 930 FUeL 5,051From which: Peru LNG Camisea II 2,200 Barret Resources Lote 67 1,600 Petrobras - PetroPeru Planta Petroquimica 800 teLeCoMUnICAtIonS 1,993From which: Telefonica del Peru mobile network expansion and broadband 1,000 America movil (Claro) works in moile telephony 560 InDUStRIAL 2,129From which: Votorantim metais expansion of Refinería Cajamarquilla 500 Vale do Rio doce Fosfatos de Bayóvar 450 Camargo-Correa Construction cement plant 200 Backus Plant expansions 250 InFRAeStRUCtURe 1,051From which: dubai Ports world Callao muelle Sur - Callao 617 Grupo Romero Ancon Harbor 200 eLeCtRICItY 245From which: Cementos Lima el Platanal 180 otHeR SeCtoRS 794From which: Tottus 24 stores in Lima, Trujillo y Chiclayo 100
Casagrande destilery and development fields 66 Sodimac - Grupo Falabella Several stores 60 Parque Arauco Complejo Comercial San Isidro 54 Corporación Pesquera Inca embarcaciones y planta 50 Parque Arauco, Gloria, wiese mega Plaza Arequipa 40 Grupo wong Shopping Center Lima Plaza Norte 35 Graña y montero Concessionn Vial Costa-Sierra I Program (Piura) �� energo Projexp Niscogradnjo Carretera Callacuyan-Huamachuco 24 Agroindustrial Laredo Sugar proyect Arena dulce 20
totAL 20,960
Source: Investment announcements.

.......49
Central Reserve Bank of Peru
..................................................................................................................................................................................................................................................
45. On the other hand, given the levels of public investment observed in the first half of the year, public investment shows an important dynamism, and, therefore, the forecast is that is should represent 4.4 percent of GDP in 2009.
Sector production
46. Productive activity in 2007 was clearly led by non-primary sectors, particularly by those associated with domestic demand. The most dynamic sectors were construction, which posted rates of nearly 15 percent, and non-primary manufacturing, which grew by nearly 12 percent. Growth in the former resulted mainly from increased home-self construction projects given the higher levels of employment and income of people; from increased investment to expand the capacity of industrial plants; and from the construction of new commercial facilities. In the case of the latter, growth was mainly driven by the manufacturing of products oriented to consumption and by the production of construction materials.
In contrast, production in primary sectors grew only slightly, since the moderate increases seen in the sectors of agriculture and fisheries in a context of variable climatic conditions were offset by lower mining activity, influenced by Yanacocha’s lower production of gold, given that this company is now exploiting areas with a lower content of mineral.
table 22
GRoSS DoMeStIC PRoDUCt (Percentage change)
2006 2007* 2008* 2009*
I Sem. Año I Sem. IR May.07 IR Sep.07 IR May.07 IR Sep.07 IR May.07 IR Sep.07
Agriculture and livestock 5.3 7.4 3.1 4.0 2.9 3.9 3.9 3.8 3.8 Agriculture 4.2 8.3 3.0 3.7 2.6 4.0 4.0 4.0 4.0 Livestock 8.6 7.6 3.2 4.4 3.5 3.9 3.9 3.6 3.6 Fishing 2.7 2.4 5.5 3.5 2.6 3.5 3.5 4.0 4.0
Mining and fuel 7.0 1.4 -1.8 2.9 1.8 5.2 5.2 4.2 4.2 metallic mining 7.5 1.1 -2.7 2.6 1.3 5.1 5.1 4.0 4.0 Natural gas and oil 1.6 5.7 8.1 6.5 7.1 6.3 6.3 5.5 5.5 Manufacturing 5.8 7.4 9.8 7.8 9.4 6.5 7.3 6.5 6.5 Based on raw materials 4.2 4.1 -0.5 2.2 0.8 4.4 4.4 4.4 4.4 Non-primary industries 6.2 8.3 12.1 9.1 11.4 7.0 8.0 7.0 7.0 electricity and water 6.0 6.9 9.2 8.8 8.8 6.0 6.5 5.5 5.5 Construction 14.6 14.8 14.4 11.5 16.0 11.0 12.0 11.0 11.0 Commerce 9.6 11.1 8.6 8.1 8.2 6.2 6.6 6.4 6.4 other services 5.9 7.0 8.7 7.7 7.8 5.8 6.1 6.0 6.0
GLoBAL GDP 6.7 7.6 7.8 7.2 7.6 6.0 6.5 6.0 6.0 Primary 5.6 4.5 1.0 3.3 2.1 4.4 4.4 4.1 4.0 non-primary 7.3 8.5 9.7 8.4 9.2 6.5 7.0 6.6 6.6
IR: Inflation Report. * Forecast.
Graph 50PUBLIC INVESTMENT(Real percentage variations)
1998 1999 2000 2001 2002 2003 2004 2005 2006* 2007* 2008* 2009*
2.9 4.0
12.712.2
5.7
25.0 25.0
6.3
-15.8
-22.5
-4.0
* Forecast.
15.0

Inflation Report. September 2007
..................................................................................................................................................................................................................................................
50 .......
The GDP should grow 7.6 percent in 2007, reducing its pace of growth to 6.5 percent in 2008 and to 6.0 percent in 2009, as a result of a moderation of growth in the sectors associated with domestic demand.
47. Non-primary sectors should continue to show an important dynamism in the rest of 2007, athough lower than the one observed during the first half of the year, considering a lower growth of demand. In the case of non-primary manufacturing, the aspects considered include the forecast evolution of private consumption and the approval of the Peru-US Free Trade Agreement by the US Congress. However, construction should show a faster pace of growth given the data for July -which point to a growth of 25 percent- and the expectations of constructors, 64 percent of which expect this activity to increase in the following 3 months according to the BCRP’s Survey.
As regards primary sectors, the forecast on the evolution of the agriculture sector has been revised downwards due to the negative impact that freezing temperatures in the highlands had on agricultural production. In the fishing sector, no growth is expected in the catch of anchovy given the policy of ban periods for this species. Therefore, the moderate growth expected in this sector would be associated with the catch of species for human consumption. On the other hand, mining should show greater dynamism in the second half of the year -as forecast in our Inflation Report of May- with the onset of operations at Milpo’s zinc mine of Cerro Lindo, as well as at the copper mine of Cerro Verde, which would start operations once the test period is over.
48. In 2008 production in the primary sectors should increase by 4.4 percent, considering normal climatic conditions for both agriculture and fisheries. On the other hand, mining should show a higher growth due to the onset of operations at Cerro Corona (gold and copper), at Gold Fields - la Cima, and at Yanacocha’s sulfide treatment plant, as well as full capacity production at Cerro Verde and Cerro Lindo.
In line with the foreseen evolution of disposable income and demand, non-primary sectors should moderate their growth in 2008 and 2009, maintaining rates between 6 and 7 percent. Construction would continue to be the most dynamic sector, given the investment projects in mining, energy and infrastructure expected to be implemented in the next years, as well as the reconstruction works in the south of country after the earthquake that devastated this area in August 2007. Moreover, non-primary manufacturing should grow by 8.0 percent, considering that the Peru-US Free Trade Agreement should come into force in this period

.......5�
Central Reserve Bank of Peru
..................................................................................................................................................................................................................................................
BoX 4
ReCent GRoWtH oF ConSUMPtIon In tHe PRIVAte SeCtoR
After increasing by 6.2 percent in 2006, private consumption in Peru grew by 7.5 percent during the second quarter of 2007. Not only did household expenditure in consumption show a continuous growth for 31 consecutive quarters -with an annual average rate of 5.6 percent-, but also exhibited a remarkable faster pace of growth.
The growth of consumption in recent years has not been limited to the Peruvian economy. The expansion of the global economy and the increase observed in the terms of trade was reflected in the growth of other countries in the region, with consumption reflecting in all cases the higher disposable income of the countries favored by these evolutions. However, the growth of consumption in Peru has been longer and more sustained, thus showing greater stability.
Given the strong drive of consumption, it is worth analyzing the factors that have contributed to determine this growth of consumption, as it accounted for 73 percent of the increase seen in domestic demand in the first half of 2007.
Among the determinants of consumption that showed a higher growth in the period of analysis, the evolution of employment and of national disposable income should be highlighted. urban employment in firms with 10 or more workers has been growing at rates of over 8 percent so far this year, reflecting a higher pace of growth compared to 2006 (when employment increased by 7.2 percent). on the other hand, the national disposable income grew 11.2 percent in the first half of 2007 -a similar rate to the one seen in 2006 and higher than GdP’s growth rate, due to better terms of trade. moreover, the evolution of consumption has also been reflecting greater facilities in terms of access to credit, as well as consumers’ optimism about their economic situation.
and that access to other international markets should grow or consolidate.
49. In 2009 non-primary sectors should grow at a rate of 6.6 percent, with non-primary manufacturing and construction growing at rates of 7.0 percent and 11.0 percent respectively, considering the growth forecast in terms of domestic demand. Normal climatic conditions and the onset of operations of Candente Resources’ mine of Cañariaco (copper and gold) by the end of the year would determine a 4.0 percent growth in primary sectors.
PRIVAte ConSUMPtIon GRoWtH
����10
987654��
IQ.04 IIIQ.04 IQ.05 IIIQ.05 IQ.06 IIIQ.06 IQ.07 IIQ.07
(%)
Argentina Chile Peru Colombia
����10
987654��

Inflation Report. September 2007
..................................................................................................................................................................................................................................................
5� .......
In view of this, the evolution of consumption should be closely followed in order that its dynamism does not imply an excessive growth of this economic variable. montiel (2000) points out that a prolongued expansion of consumption could affect the current account balance and reduce the available resources for investment in the event that the growth of consumption should be abruptly reverted to maintain the economy’s equilibrium, both external and domestic. Hence, this phenomenon could threaten the goal of a stable inflation through upward pressures on the prices of domestic goods, if demand exceeds the productive capacity of the economy.
using empirical information on 91 countries for the 1960-1994 period, montiel (2000) warns us with his results about the fact that periods with increased terms of trade are coupled by stages of a high growth of consumption. A less evident aspect is the relation between periods with growth of consumption and the expansion of the financial sector, although the causality direction is not clear. The findings of a study carried out by the International monetary Fund (2004) -which analized 28 emerging economies in the 1970-2002 period- show that episodes of credit expansion coincided with periods of high growth of consumption and investment in 70 percent of the countries studied.
Furthermore, data on the recent evolution of the Peruvian economy show that the current drive of household consumption is consistent with the trend conduct of employment, the national disposable income and credit. In other words, that no significant or systematic greater distance is seen between the growth observed and the trend growth, which would suggest that the current period of expansion of private spending in consumption has an important permanent component.
Additionally, the share of private consumption in the output shows a clear downward trend, given that other components of GdP -such as private investment- show a much higher growth. In this sense, more moderate forecasts on the growth of private consumption -although consumption continues to maintain high historical levels- are consistent with a deceleration of national disposable income. A strict monitoring of consumption loans reduces the probability of an abrupt slowdown of consumption in the event of any adverse shock in the economy.
References:International Monetary Fund (2004). “Are credit booms in emerging markets a concern?” world economic outlook (April) pp. 147-166. washington, dC: ImF.
Montiel, Peter (2000). “what drives Consumption Booms?” world Bank economic Review (September).
BoX 5
eLeCtRICItY SUPPLY In 2008 - 2009
In line with the greater dynamism of economic activity, the demand for electric energy has grown by 10.5 percent between January and August 2007 relative to last year. The supply of electric energy is currently adequate at the national level, although a continuous growth of demand could generate risks of higher rates or of energy rationing in the next two years. Should this occur, there are thermoelectric generation projects that could meet this demand. However, there are also infrastructure constraints that could threaten their adequate implementation, such as the capacity of the pipeline used to transport Camisea’s natural gas to Lima and the capacity of electric transmission systems in Chilca to supply Lima with energy.
In this sense, the currently existing transmission facilities would only allow the implementation of an additional thermoelectric generator in Chilca. As regards Camisea’s gas pipeline, its current transport capacity is 314 million cubic feet per day (mmcfd), while the demand is approximately 180 mmcfd (of which only a third is backed by already signed contracts. Given that the demand of each thermic plant is 170 mw (40 mmcfd) and given the growth of demand in the rest of users, it is estimated that -in the current conditions- the gas pipeline could only meet the demand of two additional thermic plants.
The following graph illustrates that the necessary reserve margin required for the system to operate in a reliable way would decline from 34 percent at end 2006 to 15 percent at end 2009, unless these two constraints are solved. In this scenario, the marginal costs of electricity generation would rise due to the use of less efficient power plants, which would probably impact on electricity rates.
Furthermore, the Centro-Norte and Centro-Sur electricity transmission lines are currently affected by congestion problems. The problems of the former are being solved through the construction of a second transmission line (Zapallal-Paramonga-Chimbote), which would start operating in march 2008. In the latter case, the installation of a compensator equipment is required to increase the effective capacity of the current mantaro-Socabaya line and, in addition to this, a tendering process

.......5�
Central Reserve Bank of Peru
..................................................................................................................................................................................................................................................
should be carried out to implement a second parallel line. Because the implementation of these projects would take no less than two years, the marginal costs in the southern areas of the countries are expected to rise. Therefore, accelerating the projects that will increase the supply of electric power is essential in order to prevent potential bottle-necks that may constrain economic growth.
MIDDLe SCenARIo: PoWeR DeMAnD AnD SUPPLYFoR eFFeCtIVe SoURCe oF eneRGY
6,000
5,000
4,000
3,000
2,000
1,000
0
2001 20022003 20042005 20062007 20082009
mw
Hydraulic Gas diesel + Residual Coal maximum demand
Forecast
15%
5,439 mw

Inflation Report. September 2007
..................................................................................................................................................................................................................................................
54 .......
V. Balance of payments
The current account of the balance of payments is expected to show a surplus of 1.3 percent of GDP in 2007, as indicated in our Inflation Report of May. With a less favorable international context due to the reversal of the trend observed in terms of trade, the current account should show a slight, yet sustainable deficit of 0.4 and 0.9 percent of GDP in 2008 and 2009 respectively.
Terms of trade should increase by 3.0 percent in 2007, due to a more favorable evolution of the prices of metals than the one expected in May, showing a correction in 2008 and 2009 due to the lower prices of minerals as a result of lower global growth and the high prices of petroleum.
50. The current account result would continue to be at sustainable levels during the next years, even if the prices of minerals and fuels dropped to the levels they recorded in 20033/, the year before the boom of these products took place. In order to measure the effect that a reversal of these prices could have, the values of the trade balance and of the balance of current account have been estimated at 2003 prices. Results indicate that the trade balance would be lower by around US$ 7 billion on average between 2007 and 2009, while the current account would show negative results in the same years (1.4 percent in 2007 and 2.0 percent in 2008 and 2009 -moderate and sustainable levels in the long-term-, which shows that part of the improvement seen in external current accounts is associated with the growth of the volume exported).
Current account
51. In the first half of 2007 the current account recorded a surplus of 0.9 percent of GDP -higher than the one posted in the same period last year (0.5 percent)- mainly due to the evolution of the trade balance and to increased remittances
2006 2007 2008 2009
Graph 51TRADE BALANCE(Millions of US$)
8,934
-188
8,461
5,973
1,221
-1,863
3,802
-1,467
At prices 2003 Forecast IR Sep.07
2006 2007 2008 2009
Graph 52CURRENT ACCOUNT(Percentage of GDP)
2.8
-1.4
1.3
-0.4-0.5
-2.0
-0.9
-2.0
At prices 2003 Forecast IR Sep.073/ These calculations refer only to the price effect and do not consider
additional changes in volumes due to variations in relative prices.

.......55
Central Reserve Bank of Peru
..................................................................................................................................................................................................................................................
from abroad. Exports of goods grew 18 percent, due to a 17 percent increase in prices and a 1 percent increase in volume, while imports of goods grew 24 percent.
52. A surplus of 1.3 percent of GDP is expected in 2007 in the current account of the balance of payments -a similar rate than the one forecast in our May Inflation Report-, while a surplus of US$ 8.5 billion is expected in the trade balance. Slight and sustainable deficits of current account, equivalent to 0.4 and 0.9 percent of GDP, are expected in 2008 and 2009 respectively due to the lower terms of trade forecast.
Terms of trade
The forecast on terms of trade has been revised upwards considering the evolution shown so far this year. An improvement of terms of trade was seen mainly between January and May, when the prices of exports grew 18 percent on average. However, since June terms of trade have been showing a decline due to the rise in the price of imports (food products and petroleum) and to the decrease seen in the prices of some export products.
table 23
BALAnCe oF PAYMentS (millions of uS$) 2006 2007* 2008* 2009*
I Sem. year I Sem. IR may.07 IR Sep.07 IR may.07 IR Sep.07 IR may.07 IR Sep.07
I. CURRent ACCoUnt
BALAnCe 206 2,589 466 1,352 1,329 -86 -528 -490 -1,240
As percentage of GDP 0.5 2.8 0.9 1.3 1.3 -0.1 -0.4 -0.4 -0.9
1. Trade balance 3,446 8,934 3,622 8,411 8,461 6,285 5,973 4,422 3,802
a. exports 10,464 23,800 12,334 26,435 27,399 27,231 28,424 27,994 28,987
b. Imports -7,018 -14,866 -8,712 -18,024 -18,938 -20,946 -22,451 -23,572 -25,184
2. Services -450 -949 -539 -1,220 -1,253 -1,419 -1,415 -1,462 -1,483
3. Investment income -3,796 -7,581 -3,765 -8,441 -8,405 -7,863 -7,945 -6,656 -6,760
4. Current transfers 1,006 2,185 1,148 2,602 2,526 2,911 2,859 3,205 3,201
Remittances 834 1,837 978 2,234 2,153 2,515 2,468 2,799 2,800
II. FInAnCIAL ACCoUnt 112 589 3,787 3,648 5,171 1,086 1,528 1,490 2,240
III. nIRs FLoWS 318 3,178 4,253 5,000 6,500 1,000 1,000 1,000 1,000
Memo:
International reserves balance
(millions of uS$) 14,415 17,275 21,528 22,275 23,775 23,275 24,775 24,275 25,775
NIR/Total liquidity (%) 72% 72% 74% 78% 78% 73% 73% 69% 69%
NIR/GdP (%) 18% 19% 19% 21% 22% 21% 21% 20% 19%
IR: Inflation Report.
* Forecast.
Graph 53CURRENT ACCOUNT(Percentage of GDP)
2.8
1.4
-0.4
-5.9
-0.9
1998 1999 2000 2001 2002 2003 2004 2005 2006 2007* 2008* 2009** Forecast.
-2.7
-1.5-1.9-2.2
-2.9
0.0
1.3

Inflation Report. September 2007
..................................................................................................................................................................................................................................................
56 .......
53. Between January and September terms of trade increased 7.1 percent on average compared to the same period last year, as a result of which the forecast for 2007 is slightly revised upwards (3.0 percent versus 1.9 percent in our Report of May). The forecasts on terms of trade for 2008 and 2009 have been revised downwards, in a context of a moderate slow down of global growth with still high prices of oil and food products. However, this decline could be offset by good prospects for the price of gold.
Trade balance
54. Revising terms of trade upwards would determine that the trade balance result in 2007 be higher than the one forecast in our May Report (US$ 8.4 billion). Thus, the price effect would be more than compensating the slow down in the pace of growth of the volume of traditional exports, mainly mining and fishing exports, and the increase of imports associated with the higher growth of the economy.
table 24
teRMS oF tRADe (Annual percentage change)
2004 2005 2006 2007 2008* 2009*
IR May.07 IR Sep.07 IR May.07 IR Sep.07 IR May.07 IR Sep.07
terms of trade (% Chg.) 9.5 5.6 27.4 1.9 3.0 -7.7 -8.1 -4.9 -4.8
1. export price index 22.7 16.8 36.9 6.5 11.1 -4.6 -4.2 -2.6 -4.4 Annual average price
- Gold (uS$ per ounce) 410 445 605 666 670 680 700 697 720 - Copper (uS$ per pound) 1.30 1.67 3.05 2.98 3.20 2.65 2.90 2.48 2.65 - Zinc (uS$ per pound) 0.48 0.63 1.49 1.61 1.49 1.32 1.24 1.10 1.10 - Fishmeal (uS$ per mT) 625 686 1,080 1,157 1,064 1,052 907 1,036 824 2. Import price index 12.1 10.6 7.4 4.5 7.8 3.4 4.3 2.4 0.5
Annual average price
- Petroleum (uS$ per barrel) 41 56 66 63 69 67 74 67 71 - wheat (uS$ per mT) 134 130 169 179 225 185 248 182 214 - maize (uS$ per mT) 94 74 94 146 135 155 149 156 161 - Soybean (uS$ per mT) 280 224 214 273 295 294 343 301 333 IR: Inflation Report.
* Forecast.
Jan.97 Jan.98 Jan.99 Jan.00 Jan.01 Jan.02 Jan.03 Jan.04 Jan.05 Jan.06 Jan.07
Graph 54EXPORT AND IMPORT PRICE INDEX, AND TERMS OF TRADE (1994=100)
300
250
200
150
100
50
Terms of trade Export price index Import price index
Graph 55TRADE BALANCE(Millions of US$)
8,934
5,2865,973
-2,462
3,802
1998 1999 2000 2001 2002 2003 2004 2005 2006 2007* 2008* 2009** Forecast.
-623
886321
-179-403
3,004
8,461

.......57
Central Reserve Bank of Peru
..................................................................................................................................................................................................................................................
The trade balance is expected to show a surplus of US$ 6.0 and US$ 3.8 billion in 2008 and 2009 respectively, although this surplus would be lower than forecast in our previous Report of May (US$ 6.3 and US$ 4.4 billion respectively) due to a less favorable international context, given the decline of terms of trade relative to our previous forecast, and due to an increase in projected imports, in line with our estimations on the evolution of economic activity.
Exports
55. Exports of goods have been growing at an annual average rate of 28 percent over the past 5 years, increasing from
US$ 7 billion in 2001 to US$ 23.8 billion in 2006. This result is associated with better prices for our raw materials, particularly since 2004; with a greater diversification of products; and with access to new markets which has boosted the growth of non-traditional products.
table 25
tRADe BALAnCe (millions of uS$)
2006 2007* 2008* 2009*
I Sem. Year I Sem. IR May.07 IR Sep.07 IR May.07 IR Sep.07 IR May.07 IR Sep.07
eXPoRtS 10,464 23,800 12,334 26,435 27,399 27,231 28,424 27,994 28,987
of which: Traditional products 8,028 18,374 9,450 20,121 20,996 19,949 21,056 19,782 20,662 Non-traditional products 2,356 5,271 2,811 6,153 6,245 7,100 7,202 8,016 8,156
IMPoRtS 7,018 14,866 8,712 18,024 18,938 20,946 22,451 23,572 25,184
of which: Consumption goods 1,181 2,611 1,421 3,009 3,161 3,448 3,712 3,811 4,153 Raw materials 3,855 7,987 4,574 9,291 9,876 10,526 11,334 11,617 12,399 Capital goods 1,908 4,145 2,675 5,631 5,814 6,875 7,315 8,044 8,539
tRADe BALAnCe 3,446 8,934 3,622 8,411 8,461 6,285 5,973 4,422 3,802
Note: Var % exports 34.4 37.0 17.9 11.1 15.1 3.0 3.7 2.8 2.0 Imports 23.9 23.0 24.1 21.2 27.4 16.2 18.6 12.5 12.2
export volume index 0.3 -0.1 1.0 4.4 3.5 8.5 9.2 5.6 6.1 Import volume index 14.0 14.5 18.0 15.6 19.0 13.0 13.4 9.8 11.5
IR: Inflation Report.
* Forecast.

Inflation Report. September 2007
..................................................................................................................................................................................................................................................
58 .......
56. In 2001-2007, the number of firms exporting non-traditional products increased by 53 percent, while the number of firms that exported products worth over US$ 5 million increased from 90 in 2001 to 208 in 2007.
57. As regards to the diversification of exports, a total of 2,218 categories of goods were exported during last year. An average of 111 categories of products per country were exported and each category was sold to 8.7 countries on average. Hence, the number of categories of products exported has increased 12 percent since 2001, while the number of categories per country and the number of countries to which each category is sold have increased by over 30 percent since 2001.
table 26
non-tRADItIonAL eXPoRtS:nUMBeR oF BUSIneSSeS BY eXPoRt VALUe
Annual
export value: 2001 2002 2003 2004 2005 2006 As of Jul.07 1/
Higher than 50 millions of uS$ 0 0 2 5 8 14 16Between 40 and 50 millions of uS$ 2 1 3 7 9 7 8Between 30 and 40 millions of uS$ 5 5 5 6 6 10 11Between 20 and 30 millions of uS$ 14 12 13 16 18 17 17Between 10 and 20 millions of uS$ 32 31 34 34 46 56 51Between 5 and 10 millions of uS$ 37 47 50 66 73 84 105Between 1 and 5 millions of uS$ 258 277 301 387 443 467 504Between 500 thousand and 1 millón of uS$ 198 210 236 252 292 326 330Lower than 500 thousand uS$ 3,577 3,898 4,225 4,488 4,939 5,281 5,286 Non-traditional exportsFoB (millions of uS$) 2,183 2,256 2,620 3,479 4,277 5,271 5,817Number of businesses 4,123 4,481 4,869 5,261 5,834 6,262 6,328
1/ Last 12 months (August 2006 - July 2007).
table 27
DIVeRSIFICAtIon oF non-tRADItIonAL eXPoRtS 1/
Year Category by Category by Country by products country category
2001 1,984 84.4 6.62002 2,053 93.3 6.62003 2,097 92.1 7.22004 2,129 96.5 7.82005 2,209 108.2 8.42006 2,227 107.0 8.6As of July.07* 2,218 111.3 8.7 % Chg. Jul.07 annual/ 2001 11.8 31.9 31.7
1/ Categories of groups are given by Standard International Trade Classification (CuCI).The level of disaggregation used (5 digits) gathers goods in 3,121 categories. * Accumulated 12 months.

.......59
Central Reserve Bank of Peru
..................................................................................................................................................................................................................................................
58. During the first half of the year, non-traditional exports increased by nearly 19 percent, particularly in the case of agricultural, chemical, steel&metal and jewelry products, which accounted for over 50 percent of this growth. The volume of exports of this group of products grew 9 percent, while prices increased 10 percent.
59. In the same period traditional exports continued to reflect the positive impact of the higher prices of commodities in the international market. During this period, prices increased by 20 percent on average, boosted by the higher prices of raw materials, which counterbalanced the decline of the volumes exported -export volumes dropped 2 percent mainly due to the lower shipments of gold and fish meal. Thus, traditional exports grew 18 percent, and the value of exports in this period amounted to US$ 9,450 million.
Copper
60. The price of copper showed an upward trend in the first months of 2007, accumulating an increase of 14.6 percent. This trend was interrupted by fears of a slow down of global demand, as a result of the problems seen in the subprime market in the United States.
The increase in the price of copper was associated with the production deficit observed in the first months of the year, in a context of strong demand and low levels of global inventories4/. On the demand side, it is worth highlighting that China’s imports of refined copper in the first seven months of 2007 increased almost twofold compared to the same period in 2006. On the supply side, constraints were still observed due to strikes in the mines of the main copper producing countries, such as Mexico, Peru and Chile.
The price of copper in the rest of the year would be influenced by expectations of a slow down in the United States, in connection with the evolution of the real estate market and its impact on investment and consumption. However, potential production cuts (resulting from strikes or other factors, such as supply) could generate an upward trend due to the low levels of existing inventories.
Considering the data available to date, the forecast on the average price of copper for 2007 has been adjusted to US$ 3.20 per pound. In 2008 and 2009 the price should be
Graph 56 COPPER PRICE AND INVENTORIES
1,200
1,000
800
600
400
200
0
Price
Thousand of MT US$/pound4.00
3.50
3.00
2.50
2.00
1.50
1.00
0.50
Source: Bloomberg, London Metal Exchange, COMEX and Shangai Metal Exchange.
Inventories
May.03 Sep.03 Jan.04 May.04 Sep.04 Jan.05 May.05 Sep.05 Jan.06 May.06 Sep.06 Jan.07 May.07 Sep.07
Dec.03 Jun.04 Dec.04 Jun.05 Dec.05 Jun.06 Dec.06 Jun.07 Dec.07 Jun.08 Dec.08 Jun.09 Dec.09
Graph 57 COPPER PRICE: FORECAST
4.00
3.50
3.00
2.50
2.00
1.50
1.00
0.50
IR May.07
IR Sep.07
US$/poundForecast
IR: Inflation Report.
4/ The specialized international agency world Bureau of metal Statistics reported that global consumption of copper had exceeded production by 328 thousand tons in the first seven months of this year (in contrast with the 182 thousand ton-surplus recorded in the same period last year). Furthermore, the International Copper Study Group reported that the global demand for refined copper had been nearly 340 thousand tons higher than production in the first half of the year.

Inflation Report. September 2007
..................................................................................................................................................................................................................................................
60 .......
US$ 2.90 and US$ 2.65 respectively. This downward trend is explained by the implementation of new products in the main producing countries, such as Chile, Peru and Brazil, among other countries, as well as by a moderate deceleration of global growth.
Gold
61. The price of gold has shown an upward trend due to the supply deficit observed in the first half of the year. According to the World Gold Council5/, global demand increased 10.8 percent in this period (due to increased demand for jewelry), while global supply contracted 4.0 percent (due to the higher sales of gold scrap). Given the nature of gold as a financial asset, the price of gold was affected upwards due to increased inflationary expectations given the consecutive historical peaks recorded in the price of oil and the depreciation of the dollar against the euro to historical minimum levels.
The price of gold is expected to remain at high levels in the rest of 2007, due to India’s increased seasonal demand -India is the world’s largest consumer of gold- and to expectations of inflation given the high prices of oil. In this context, the average price of gold would reach US$ 670 per ounce troy in 2007, a level higher than the one forecast in our previous Inflation Report.
The price of gold should increase in 2008 and 2009, due to a higher demand resulting from (i) hedging given increased uncertainty on the evolution of the dollar; (ii) a portfolio diversification, given the lower value of the real price of gold vis-à-vis other commodities and other assets not involving risks; and (iii) risks of a higher inflation in the United States, given the high prices of commodities, especially petroleum and food products, all of which would lead the price of gold to increase up to US$ 720 per ounce troy in 2009.
Zinc
62. The price of zinc continued to decline in the last months, accumulating a 34.6 percent drop by September (the price of zinc fell from US$ 2.0 per pound in December 2006 to US$ 1.31 per pound in September 2007). This evolution was affected by expectations of a lower global demand given concerns of an economic slow down in the United States as a result of the crisis of the subprime mortgage segment in that country. Moreover, China continued to be a net exporter of this metal although it was expected that it would become a net importer of zinc6/.
Dec.03 Jun.04 Dec.04 Jun.05 Dec.05 Jun.06 Dec.06 Jun.07 Dec.07 Jun.08 Dec.08 Jun.09 Dec.09
Graph 58GOLD PRICE: FORECAST
750
700
650
600
550
500
450
400
350
300
IR Sep.07
IR May.07
US$ per troy oz.Forecast
IR: Inflation Report.
Graph 59 ZINC PRICE AND INVENTORIES
740
640
540
440
340
240
140
40
Price
Thousand of MT US$/pound2.50
2.00
1.50
1.00
0.50
0.00
Source: Bloomberg and London Metal Exchange.
Inventories
May.03 Sep.03 Jan.04 May.04 Sep.04 Jan.05 May.05 Sep.05 Jan.06 May.06 Sep.06 Jan.07 May.07 Sep.07
5/ Report by the world Gold Council, August 2007.6/ Between January and July 2007, China exported a net total of 128 thousand
tons of zinc, although it imported a net total of 73 thousand tons in the same period last year.

.......6�
Central Reserve Bank of Peru
..................................................................................................................................................................................................................................................
These factors contribute to explain the unexpected supply surplus seen during the first seven months of 2007.
The average price of zinc in 2007 is forecast at US$ 1.49 per pound, lower than the price forecast in our previous Inflation Report. An additional reduction in this price is expected for 2008 and 2009 due to the implementation of new investment projects, both in the short- and medium-term. However, inventories remain at low levels and, therefore, the price of this metal could be affected by unforeseen production cuts (due to strikes or other factors).
Fishmeal
63. After increasing until April, the price of fishmeal decreased in a sustained manner, accumulating a 15 percent drop so far this year (the price of fishmeal fell from US$ 1,100 per MT in December 2006 to US$ 930 per MT in September 2007).
This fall is explained by China’s lower demand (China being the main consumer) and by the high levels of inventories. However, a partial recovery of the price of this product is expected, given the high prices of the main substitutes of fishmeal (such as soybean flour).
As a result of this, the average price of fishmeal in 2007 should be US$ 1,064 per ton, which implies a 1.5 percent reduction compared to the price of this product in 2006. The average prices of fishmeal would continue to show a correction in the next years, dropping by an annual 15 and 9 percent in 2008 and 2009 respectively due to the recovery of production in Chile and in Scandinavian countries.
table 28
BALAnCe oF WoRLD’S SUPPLY AnD DeMAnD oF MAIn CoMMoDItIeS(Thousand of mT)
2005 2006 2007* 2008* Copper - Supply 16,657 17,529 18,123 19,172 - demand 16,750 17,418 18,187 19,102 Gap (Supply - demand) -93 ��� -64 70 Inventories 425 536 472 542 Consumption weeks 1.3 1.6 1.3 1.5Zinc - Supply 7,015 7,151 7,523 7,973 - demand 7,316 7,466 7,653 7,915 Gap (Supply - demand) -301 -315 -130 58 Inventories 828 548 418 476 Consumption weeks 6.1 3.9 2.9 3.2Gold - Supply 4,025 3,541 1,664 n.d. - demand 3,727 3,374 1,780 n.d. Gap (Supply - demand) 297 167 -116 n.d. * Forecast in the case of gold, the information corresponds to January.march 2007.Source: world Gold Council, metal Bulletin Reserch (Base metals monthly, Aug. 2007).
Dec.03 Jun.04 Dec.04 Jun.05 Dec.05 Jun.06 Dec.06 Jun.07 Dec.07 Jun.08 Dec.08 Jun.09 Dec.09
Graph 60 ZINC PRICE: FORECAST
2.20
2.00
1.80
1.60
1.40
1.20
1.00
0.80
0.60
0.40
0.20
IR Sep.07
IR May.07
US$/pound
Forecast
IR: Inflation Report.

Inflation Report. September 2007
..................................................................................................................................................................................................................................................
6� .......
28.4
64. Considering the results of the first half of the year and the expected evolution of prices in the rest of 2007, the forecast on total exports for this year has been revised upwards to US$ 27.4 billion (compared to the US$ 26.4 billion forecast in our May Report). The forecast considers an 11 percent increase in the export prices and a recovery of the volume of exports, which would grow by 4 percent, essentially due to the evolution of traditional exports. As stated in our Inflation Report of May, the latter would reflect the higher volumes of exports resulting from the onset of operations of mining projects, including Cerro Verde’s sulfide treatment plant in the case of copper and the Cerro Lindo mine in the case of zinc.
Exports of goods should grow by 3.7 percent in 2008 and by 2.0 percent in 2009, mainly due to the higher sales of non-traditional products (which would grow 15 and 13 percent in 2008 and 2009 respectively), particularly agricultural and fishing products. On the other hand, the exports of traditional products would show no significant variation in 2008 and would decline by 2 percent in 2009, due to the lower prices of exported metals.
Imports
65. An indicator of the dynamism of economic activity, characteristic of an expansion stage in the economic cycle, is the faster pace of growth of the demand for imports. Between 2003 and 2006, imports of goods grew at an average annual rate of 22 percent. In the first half of this year, this growth increased to 24 percent and should increase to 27 percent by the end of this year.
The expansion of imports is associated mainly with the evolution of private investment, which would grow this year by around 24 percent. As a result of this, purchases of capital goods have increased 40 percent during the first half of 2007, and should grow at a similar rate in the year. The noteworthy increase observed in imports of machinery and equipment would allow firms not only to increase their capital assets, but also to implement productivity improvements, which have a positive impact on the growth of potential GDP in the economy.
By economic sectors, it is worth highlighting the imports of capital goods for manufacturing (49 percent), the imports of machinery for the construction sector (63 percent), and the imports for the transport sector (40 percent).
Forecasts for the next years maintain high rates of growth of imports, ranging between 18 percent in 2008 and 13 percent in 2009. The level of imports during this period would reflect
1998 1999 2000 2001 2002 2003 2004 2005 2006 2007* 2008* 2009*
Graph 61GOOD EXPORTS(Billions of US$)
5.3
2.0 1.9 2.0 2.2 2.3 2.6
3.5
7.26.2
4.3
23.8
5.8 6.1 7.0 7.0 7.79.1
12.8
27.4
17.4
3.7 4.1 4.8 4.7 5.4 6.49.2
12.9
21.121.018.4
Traditional Non traditional
Note: Total exports include other exports.* Forecast.
8.2
29.0
20.7
1998 1999 2000 2001 2002 2003 2004 2005 2006 2007* 2008* 2009*
Graph 62GOOD IMPORTS(Billions of US$)
3.71.51.9 1.5 1.6 1.8 1.8 2.0 2.3 2.6 3.2
11.3
3.03.4 3.6 3.6 3.7 4.3 5.4 6.68.0
9.8
7.3
2.12.6 2.1 1.9 1.8 2.0
2.43.1
4.1
5.8
22.4
6.78.2 7.4 7.2 7.4 8.2
9.812.1
14.9
18.9
Capital goods Raw materials Consumption goods
Note: Total imports include other imports.* Forecast.
4.2
12.3
8.5
25.1

.......6�
Central Reserve Bank of Peru
..................................................................................................................................................................................................................................................
the contribution involved by trade agreements that will be in force and the implementation of several projects in various sectors. Particularly, this forecast considers the beginning of the implementation of several important projects, including Camisea II (in the south of the country), Toromocho (Junin), Río Blanco (Piura), Minas Conga (Cajamarca), Lot 67 (Amazonas), the Phosphate Plant at Bayovar (Piura), etc.
Financial account
66. During the first half of 2007, the financial account of the balance of payments was characterized by a strong increase in the flow of external resources as a result of direct investment and long-term disbursements from the private sector, in line with the dynamic performance of economic activity. This increased flow of capitals was offset since the second quarter of this year, when institutional investors started showing a higher preference for maintaining a larger share of their portfolio in financial assets abroad in order to diversify the risks of their portfolios.
This determined a positive flow of US$ 3.8 billion in the financial account in the first half of the year, which is expected to reach US$ 4.7 billion by end 2007. In a context of greater volatility in the domestic exchange market, this considers that institutional investors will diversify their portfolios through investments abroad and also that a lower pace of long-term private disbursements will be seen.
Investments of over US$ 3.5 billion are estimated for 2008 and 2009, based on the favorable expectations regarding the evolution of economic activity. The highest flow of investments should be oriented not only to the mining and hydrocarbon sectors, but also to other sectors, such as telecommunications, electricity, road infrastructure, agroindustry, and the petro-chemical sector.
BoX 6
oUtLooK on tHe BALAnCe oF PAYMentS
The intertemporal approach is being used in the recent literature on the determinants and the vulnerability of the current account of the balance of payments. The intertemporal analysis focuses on the role of expectations on the future evolution of variables, such as economic activity and interest rates, in private decisions regarding saving and investment. Thus, this approach offers a complete view of the determinants of the current account in order to evaluate the capacity that an economy has to face imbalances in external accounts.
the intertemporal decision
The current account being defined as the accumulation of a country’s net external assets, an intertemporal analysis shapes saving-investment decisions on the basis of the gaps that exist between macroeconomic variables: output, real interest rate, government expenditure, and investment in terms of the levels they should show in the long-term.

Inflation Report. September 2007
..................................................................................................................................................................................................................................................
64 .......
Current account imbalances occur when its determinants are not in line with their long-term levels. For instance, if a country is a net lender of funds and the international interest rate is above its long-term level, the current account will show a surplus. According to the intertemporal approach, in general, the current account may show a deficit and this will not imply permanent imbalances, given that forward looking considerations are incorporated in economic agents’ expectations on the evolution of the economy. The convergence of macroeconomic variables to their long-term levels and the starting point of gaps allows analyzing whether the imbalances are temporary or permanent.
The intertemporal analysis also allows incorporating several theoretical elements to analyze the current account, such as, for example, GdP fluctuations and the stock of capital, the role of non-tradable goods, durable goods, the demographic structure, the fiscal policy and the indebtedness policy, etc.
the role of terms of trade
If the capital market is not too developed or if exports are not diversified, it is important to analyze the terms of trade to determine the vulnerability of the current account. The figure below shows the correlation between the balance in current account and the level of terms of trade in the Peruvian case. This correlation has been increasing, but the current account will be less vulnerable to negative shocks in terms of trade as long as exports continue to diversify.
Gap analysis (public and private saving):
The analysis of gaps is associated with fiscal imbalances and with increases in private sector investment. This analysis is important since it allows us to determine the origin of external imbalances on the basis of public and private saving. The graph below shows that the improvement seen in the current account was associated with the recovery of public and private saving since 2000.
moreover, this shows that economic agents’ reaction to the increases of terms of trade over the past few years was to save part of the higher incomes, both in the public and the private sectors.
CURRent ACCoUnt AnD SAVInG(Percentage of GdP)
30�520�510
50
-5-10-15
1970 1975 1980 1985 1990 1995 2000 2006
Public saving Private saving Current account
CURRent ACCoUnt AnD teRMS oF tRADe
30�520�510
50
-5-10-15-20
1951 1960 1970 1980 1990 2000 2005
Terms of trade (% Chg.) Current account (% GdP)
Correlationcoefficient
1950 - 2006: 0.401960 - 2006: 0.401970 - 2006: 0.421980 - 2006: 0.481990 - 2006: 0.612000 - 2006: 0.86

.......65
Central Reserve Bank of Peru
..................................................................................................................................................................................................................................................
Analysis of the external debt and external liabilites
Complementing the intertemporal analysis, the analysis of the role of terms of trade, and the analysis of gaps, the conduct of a country’s external liabilities may also be studied since they reflect the developments that take place on the real sector of the economy. The current account is the net flow of all the transactions carried out between residents and non-residents (including goods, services, and the payment of interests on external liabilities) and, therefore, will reflect any change in the stock of external liabilities that is used to finance said transactions. Since these liabilities have to be honored over time, resources must be generated to sustain their repayment.
other indicators of external vulnerability:
A series of indicators of external vulnerability may be used to evaluate if an economy has the capacity to face external shocks or changes in the terms of financing:
1. Short-term debt-to-total external debt ratio: This ratio reflects the debt’s composition degree of risk involved due to the maturity and deadlines of debt papers.
2. external debt-to-exports ratio: a country with a high ratio is more likely to have problems to repay its debt when facing shocks.
3. external debt-to-Net International Reserves (NIRs): this ratio suggest a maximum size for a country’s external debt.
4. debt service (interests + principal)/Current account revenues ratio: this measures the cost, the maturity structure and the balance of the debt in terms of current revenues.
5. external vulnerability: (short-tem external debt + long-term external debt + non-residents deposits with 1 year maturities) / NIRs: This ratio measures a country’s immediate availability of resources for the total repayment of the debt.
The previous analysis shows that Peru’s external vulnerability is not very high, especially when the diversification of exports, the debt management, and the high levels of international reserves observed in recent years are considered. This is corroborated by moody’s indicators, according to which Peru ranks among the least vulnerable economies in the developing world.
References:- Banco Central de Reserva del Perú. Series
estadísticas.- moody´s Statistical Handbook: Country Credit, may
2007.- obstfeld, m. & Kenneth Rogoff (1997) “The intertemporal
approach to the Current Account”. NBeR wP 4893.
InDICAtoRS oF eXteRnAL VULneRABILItY(In percentage) eD-st/eD eD/CA eD/nIR Debt external
service vulnerability South America Argentina 22.9 184.8 359.4 41.1 145.1Bolivia 9.0 106.9 222.6 11.2 33.6Brazil 9.0 114.7 224.4 35.2 69.2Chile 19.7 66.6 245.5 12.2 85.9Colombia 13.7 114.0 272.9 30.0 90.2ecuador 12.8 100.7 1 183.8 51.3 663.8Paraguay 13.1 54.6 187.2 5.8 37.7Peru 10.8 96.4 163.8 11.4 27.7uruguay 8.0 161.1 342.3 45.7 183.7Venezuela 24.9 57.8 152.7 12.6 51.2 other countries China 63.1 29.0 30.6 4.2 21.4Korea 45.3 67.1 110.9 7.3 56.5Costa Rica 34.9 55.6 217.5 13.2 102.9el Salvador 12.4 120.3 517.7 14.8 105.5India 9.1 64.9 80.0 8.5 33.3malaysia 23.0 26.6 62.2 4.1 21.1mexico 8.7 53.8 211.4 12.7 50.2Panama 5.9 72.5 705.9 27.4 265.8Republic Czech 30.6 52.2 187.7 6.0 65.5Republic dominican 15.3 60.0 380.2 9.9 104.2Rusia 12.3 86.4 107.5 2.9 15.4South Africa 17.0 69.5 251.1 6.8 61.8Thailand 30.6 37.4 91.8 8.6 44.6Turkey 21.2 173.2 348.3 32.4 149.4Vietnam 12.6 43.3 169.6 3.8 30.4 Source: moody’s Statistical Handbook: Country Credit, may 2007. d: Total debt ed: Total external debt from public and private. ed-st: external debt short term. ed-lt: external debt long term of short maturity. CA: Current account revenues. NIR: International Reserves. debt service: (Interests + principal)/Current account revenues. external vulnerability: (ed-st+ed-lt+dep. non residents to 1 year)/NIR.
eXteRnAL DeBt(Percentage of GdP)
1996 1997 1998 1999 2000 2001 2002 2003 2004 2005 2006 2007* 2008* 2009** Forecast.
60.5
21.523.726.830.3
36.1
44.848.148.950.452.5
55.553.048.8

Inflation Report. September 2007
..................................................................................................................................................................................................................................................
66 .......
VI. Public finance
In a context marked by a strong growth of private consumption and private investment, the improvement observed in the fiscal stance contributes to offset potential demand pressures on inflation.
The conduct of the fiscal stance continued to reflect the good performance of tax revenues. This was associated with the prices of exports and the dynamism of economic activity, as well as with a lower pace of public spending. Thus, the fiscal surplus of the Non-Financial Public Sector (NFPS) in the July 2006 - June 2007 period (that is, in the last four quarters) was 3.1 percent of GDP. Because of this result and considering that the Free Trade Agreement with the United States should come into force between 2008 and 2009, the forecast on the fiscal surplus for 2007 has been revised from 1.2 to 2.0 percent of GDP, while this surplus is estimated to reach 1.0 and 0.3 percent in 2008 and 2009 respectively. These forecasts consider that the real growth of the public sector’s non-financial expenditure will be higher than the expansion of economic activity in the next two years.
Economic result
67. In the July 2006-June 2007 period, the economic surplus of the Non-Financial Public Sector (NFPS) was 3.1 percent of GDP -higher than the level recorded in the previous 12 months (1.1 percent). In terms of their contribution to this surplus, the operations of the central government accounted for 1.2 percentage points of this outcome, while the rest of the entities comprised in the general government -which include local governments- accounted for 1.7 percentage points of this surplus. Moreover, state enterprises showed a surplus of 0.2 percent of GDP in the same period.

.......67
Central Reserve Bank of Peru
..................................................................................................................................................................................................................................................
68. Considering the information available to date, the forecast on the expected surplus in 2007 has been revised upwards from 1.2 to 2.0 percent of GDP. This revision is based on the current favorable international prices of our raw materials, which show higher levels than previously forecast in our May Report; on the greater dynamism shown by economic activity; and on the deferral of the Trade Agreement with the United States. Thus, this forecast scenario considers that the current revenues of the general government would increase from 19.9 percent to 20.5 percent relative to our previous report. Economic surpluses of 1.0 percent and 0.3 percent of GDP are also estimated for 2008 and 2009 -these levels are higher by 0.5 percent and 0.3 percent respectively, compared to the ones considered in our Report of May.
table 29
non-FInAnCIAL PUBLIC SeCtoR (Percentage of GdP)
2006 2007 * 2008 * 2009 * I Sem. Year I Sem. IR May. 07 IR Sep. 07 IR May. 07 IR Sep. 07 IR May. 07 IR Sep.07
1. General government
current revenue 20.6 19.7 21.7 19.9 20.5 19.9 20.4 19.6 20.0
Real percentage change 23.9 23.1 15.7 8.5 12.6 4.6 2.7 2.8 1.8
2. General government
non-financial expenditure 14.1 16.2 13.5 17.0 16.8 17.8 17.8 18.1 18.2
Real percentage change 8.2 8.7 5.3 12.4 12.3 8.8 9.4 6.0 6.5
of which:
a. Current 12.2 13.4 11.7 13.7 13.7 13.8 14.1 13.8 14.1
Real percentage change 7.3 7.3 5.5 9.5 10.2 4.8 6.6 4.0 4.3
b. Capital 1.8 2.6 1.7 3.1 3.0 3.8 3.6 4.2 4.0
Real percentage change 16.2 14.2 3.5 29.7 25.4 27.0 25.1 13.6 15.1
3. others 0.3 0.4 0.3 0.1 0.2 0.1 0.1 0.1 0.1
4. Primary balance (1-2+3) 6.8 3.9 8.4 3.1 3.9 2.2 2.7 1.6 1.8
5. Interests 1.9 1.9 1.8 1.9 1.9 1.7 1.7 1.6 1.5
6. overall balance 4.9 2.1 6.7 1.2 2.0 0.5 1.0 0.0 0.3
Central government
current revenues 18.1 17.3 19.0 17.4 18.0 17.3 17.9 16.9 17.4
Central government
non-financial expenditure 12.3 14.2 14.1 15.3 15.2 15.6 15.5 15.6 15.6
* Forecast.
1998 1999 2000 2001 2002 2003 2004 2005 2006 2007* 2008* 2009*
Graph 63OVERALL BALANCE OF THE NON FINANCIAL PUBLIC SECTOR(Percentage of GDP)
2.02.1
1.0
-3.2
-1.0
-1.7-2.3-2.5
-3.3
* Forecast.
0.3
-1.0
-0.3

Inflation Report. September 2007
..................................................................................................................................................................................................................................................
68 .......
Structural economic outcome
69. The structural economic outcome -indicator isolating the impact of the revenues of the general government on the economic cycle, as well as the impact of higher prices of mining and hydrocarbon exports on fiscal accounts- shows that the economic result becomes deficitary during the following three years if these factors are isolated.
Furthermore, the fiscal impulse -defined as the change in the primary structural deficit (the difference between the structural deficit and expenditure resulting from interests)- shows that the fiscal policy would be a source for the impulse of domestic demand in the 2007 - 2009 period.
Evolution of fiscal revenues
70. The growth of revenues during the first half of 2007 (16 percent in real terms) is explained mostly by the greater dynamism of economic activity and by the higher profits of firms, particularly in the mining sector. Thus, while revenues associated with the income tax (including the regularization of said tax) grew 23 percent in real terms, the corresponding revenues in the case of the value-added tax (VAT) increased by 14 percent, due also in part to the higher volume of imports seen in this period. Another factor contributing to the growth of revenues was the increase observed in the trasfers to regional governments (around S/. 700 million) on account of remainders of profits generated mainly by mining companies.
Given that the current forecast scenario considers that the dynamism of economic activity would continue during the rest of 2007 and that the Free Trade Agreement between Peru and the United States (FTA) would come into force between 2008 and 2009, a 13 percent increase in real terms is forecast in the current revenues of the general government, as a result of which said revenues would amount to an equivalent of 20.5 percent of GDP, a level 0.6 percentage points higher than forecast in our May Report.
A lower growth of revenues is forecast for 2008 and 2009 due to the reduction of tariffs and to the implementation of the FTA, both of which would imply a lower annual tax collection (approximately US$ 200 million between tariffs and external VAT). Furthermore, a reduction of rates in terms of the tax on financial transactions -ITF- (from 0.07 percent to 0.06 percent) and in terms of the temporary tax on net assets -ITAN- (from 0.5 percent to 0.4 percent) is also considered.
1998 1999 2000 2001 2002 2003 2004 2005 2006 2007* 2008* 2009*
Graph 64CONVENTIONAL AND STRUCTURAL DEFICIT OF THE NFPS(Percentage of GDP)
* Forecast.
-1.0-0.7
-3.2-2.9
-3.3 -3.2
-2.5
-1.8-2.3
-1.7 -1.7-1.4
-1.0 -0.9-0.3
-0.9
-0.1
2.1 2.0
-1.9-1.7
-1.1
0.3
1.0
Conventional deficit Structural deficit
Graph 65FISCAL IMPULSE(Percentage of GDP)
* Forecast.1998 1999 2000 2001 2002 2003 2004 2005 2006 2007* 2008* 2009*
0.4
-1.2
-0.4 -0.3
-0.8
0.7
0.10.10.20.0
2.0
1.1
Graph 66GENERAL GOVERNMENT CURRENT REVENUE(Percentage of GDP)
1998 1999 2000 2001 2002 2003 2004 2005 2006 2007* 2008* 2009** Forecast.
18.917.7 17.8 17.1 17.1 17.5 17.5
18.319.7
20.5 20.4 20.0
Graph 68INCOME TAX(Percentage of GDP)
1998 1999 2000 2001 2002 2003 2004 2005 2006 2007* 2008* 2009** Forecast.
3.5 3.8
6.0
4.3
6.7 6.6 6.4
3.7
3.03.02.82.9
Graph 67CENTRAL GOVERNMENT CURRENT REVENUE(Percentage of GDP)
1998 1999 2000 2001 2002 2003 2004 2005 2006 2007* 2008* 2009** Forecast.
15.814.6 14.9 14.3 14.3 14.8 14.9
15.717.3
18.0 17.9 17.4

.......69
Central Reserve Bank of Peru
..................................................................................................................................................................................................................................................
Evolution of fiscal expenditure
71. The evolution of the general government’s non-financial spending continued to show a lower level than forecast due mainly to management-related problems in the entities in charge of executing expenditure according to their approved budgets. The general government’s non-financial expenditure decreased by 0.6 points of GDP (from 14.1 percent to 13.5 percent) compared to the first half of 2006, as a result of both a lower consumption expenditure by the central government (which decreased from 6.6 to 6.1 percent of GDP) and a lower investment expenditure, basically by local governments (which decreased from 0.8 to 0.7 percent of GDP).
72. The forecast considers a partial recovery of public spending in the second half of the year, especially in public investment, given that more resources will be allocated to the reconstruction of the areas affected by an earthquake in August. Public investment, which includes investments by state enterprises, should increase by 25 percent in real terms in 2007, a rate lower than the one forecast in our May Report.
73. The forecasts on expenditure in the 2007-2009 period consider the limits set forth in the Fiscal Accountability and Transparency Act and any amendments thereto, which establish that the basis on which the annual increase of spending (3 percent in real terms) is evaluated is the central government’s consumption (total spending in salaries, goods, and services), in contrast with the former act that also included expenditure for transfers from the central government.
In 2008 and 2009, the real growth of the general government’s non-financial expenditure would be 9 and 7 percent respectively, and would be mainly oriented to gross capital formation (25 and 15 percent respectively).
Financing requirements
74. The financial requirement, which measures the resources needed by the public sector to cover its economic result and to serve the amortization of the debt, both domestic and external, was negative in the first half of 2007 (US$ 2,648 million). This is explained by the surplus obtained in the NFPS in this period, which allowed to increase significantly the deposits of the Public Treasury which, in turn, is reflected in the increase observed in domestic financing sources
(US$ 3,245 million).
Graph 69VALUE ADDED TAX(Percentage of GDP)
1998 1999 2000 2001 2002 2003 2004 2005 2006 2007* 2008* 2009** Forecast.
6.6 6.8 7.17.07.6 7.9 8.0
6.66.36.26.56.3
Graph 70IMPORT TAX REVENUE(Percentage of GDP)
1998 1999 2000 2001 2002 2003 2004 2005 2006 2007* 2008* 2009** Forecast.
1.71.6 1.6
1.21.21.21.2
1.5
0.9
0.60.60.7
Graph 71GENERAL GOVERNMENT NON-FINANCIAL EXPENDITURE(Percentage of GDP)
1998 1999 2000 2001 2002 2003 2004 2005 2006 2007* 2008* 2009** Forecast.
17.9
16.717.0
16.2
16.8
17.818.2
17.217.317.7
18.518.9
Graph 72GENERAL GOVERNMENT NON-FINANCIAL EXPENDITURE(Real percentage change)
1998 1999 2000 2001 2002 2003 2004 2005 2006 2007* 2008* 2009** Forecast.
-0.3
-4.2
6.8
0.5
2.9 3.54.7
10.28.7
12.3
9.4
6.5

Inflation Report. September 2007
..................................................................................................................................................................................................................................................
70 .......
75. In order to improve the debt profile and reduce financing requirements for the following years, the prepayment of the total debt with the Club of Paris for the October 2007 - 2015 period was negotiated in May 2007. This request was approved in July 2007 and the prepayment, amounting approximately to US$ 1794 million, was made effective early in October. This operation was mainly financed through the issue of 30-year sovereign bonds for a total of S/. 4,750 million (approximately US$ 1,504 million) and a coupon of 6.9 percent. This debt-operation allowed to change the structure of our liabilities, replacing 5.3 percent of our external debt by internal debt denominated in Nuevos Soles, which should contribute to reduce exchange risks.
table 30
FInAnCIAL ReQUIReMentS oF tHe non-FInAnCIAL PUBLIC SeCtoR 1/
(millions of uS$)
2006 2007 * 2008 * 2009 *
Year I Sem. IR May.07 IR Sep.07 IR May.07 IR Sep.07 IR May.07 IR Sep.07
I. Uses -247 -2 648 258 -642 1 525 769 1 358 917 1. Amortization 1,636 772 1,511 1,459 2,082 2,007 1,363 1,311 a. external 1,107 621 1,179 1,115 1,594 1,489 1,110 1,001 b. Internal 530 151 332 344 488 518 252 310 of which: Pension Bonds 145 75 155 149 170 163 183 183 2. overall Balance -1,883 -3,420 -1,253 -2,101 -557 -1,238 -5 -394 (negative sign indicates surplus)
II. Sources -247 -2,648 258 -642 1,525 769 1,358 917 1. external 535 104 974 928 1,042 1,160 611 1,089 2. Internal �/ -1,602 -3,245 -1,525 -2,295 -623 -1,363 -177 -1,160 3. Bonds �/ 820 493 809 725 1,106 972 923 987
memo: Gross debt balance In millions of uS$ 30,484 29,778 30,484 30,078 30,716 30,541 30,995 31,768 In percentage of GdP 32.7 29.8 29.1 28.4 27.2 25.6 25.4 24.0
Net debt balance 4/ In millions of uS$ 22,419 18,753 20,553 19,444 20,064 18,486 20,109 18,445 In percentage of GdP 24.1 18.8 19.6 18.3 17.7 15.5 16.5 13.9 IR: Inflation Report. * Forecast. 1/ In amortization, as well as disbursements, has isolated the effect of exchange Treasure Bonds for
longer maturities. 2/ Positive sign indicates overdraft and negative sign indicates greater deposits. 3/ Includes domestic and external bonds. 4/ defined as the difference between public debt and NFPS deposits. Source: BCRP and meF.
Graph 73PUBLIC DEBT(Percentage of GDP)
1999 2000 2001 2002 2003 2004 2005 2006 2007* 2008* 2009*
47.1
37.2
24.0
13.9
25.6
15.5
32.7
24.1
37.7
30.0
44.3
35.9
47.1
38.7
46.7
38.0
45.9
37.5
45.5
36.9
28.4
18.3
* Forecast.Gross debt Net debt
.......71
Central Reserve Bank of Peru
..................................................................................................................................................................................................................................................
It should be pointed out that this is the second transaction of such a magnitude carried out during this year. The first transaction took place in February and involved the exchange and/or total or partial repurchase of Global Bond 2012 and of Brady Bonds by bonds maturing in 2016, 2033 and 2037. Both operations have contributed to smoothen the profile of amortizations in the following years, as evidenced in the extension of the average maturity of the public debt by 3.5 years.
76. The net debt -an internationally used indicator of the position of net liabilities and of the solvency of the public sector- decreased from 24.1 percent in December 2006 to 18.8 percent in June 2007. This reduction is mainly explained by the increase of assets resulting from the economic surplus achieved in the first half of this year. The liquid assets of the public sector are expected to continue growing at a faster pace than the debt, which should be possible due to the dynamism shown in the forecasts on economic activity and its impacts on fiscal accounts. This would allow to reduce the total public debt from 32.7 of GDP in 2006 to 24.0 percent of GDP by 2009 and to reduce the net public debt from 24.1 percent of GDP in 2006 to 13.9 percent of GDP in 2009.
BoX 7
MACRoeConoMIC RISKS AnD FISCAL PoLICY: 2007-2009
The central macroeconomic scenario used in this Inflation Report for the 2007-2009 period considers an average growth rate of 6.7 percent, still high levels of prices for our main export minerals, and a fluent access to capital markets. In addition to this favorable macroeconomic environment, the forecast also considers a prudent fiscal policy that is expressed in fiscal surpluses that allow a sustained reduction in the public debt-to-GdP ratio: from 32.7 percent of GdP in 2006 to 24.0 percent of GdP in 2009.
In this context, it is worth analyzing the robustness of fiscal results in terms of adverse macroeconomic scenarios. The uncertainty underlying the variables that affect the dynamics of the public debt (such as GdP growth, terms of trade, interest rates, etc.) must also be taken into account in this risk assessment. Thus, unexpected events that might increase the service or the balance of the debt are risk scenarios that would imply making adjustments in the fiscal revenues or in fiscal spending. In other words, a debt structure that is very sensitive to market risks could potentially compromise the sustainability of the fiscal policy. Therefore, if the treasury’s liability position is risky (for example, because it is very vulnerable to interest rate or exchange variations, or because a high component of the debt is concentrated in a very short period), both the probability of having higher fiscal deficits than the ones projected by the fiscal authority and the probability that the public treasury will have difficulties to cover its financial requirements increase.
A series of measures have been adopted over the past 15 years to reduce the rate of growth of the public debt and of its exposure to market risks, including the following:
* Control of fiscal deficit. * debt-exchange operations in the frame of the Brady Plan and the issue of Global Bonds at fixed rates in the international
markets of debt.* The establishment of a domestic debt market, which has allowed to issue debt in Nuevos Soles, thus reducing exposure
to exchange risks. * operations to extend the debt’s average maturity term, thus reducing refinancing risks through debt-exchange and debt-
repurchase operations -of Brady Bonds and with the Paris Club- that contribute to stabilize the government’s payment profile.
* Swaps of currencies and rates for future debt maturities.

Inflation Report. September 2007
..................................................................................................................................................................................................................................................
72 .......
Although the impact of these debt-management operations has been favorable in terms of reducing exposure to financial risks, it should be pointed out that these operations depend importantly on the macroeconomic environment (particularly on economic growth and on the fiscal policy stance). Thus, between 2001 and 2006 the balance of the debt in GdP terms decreased by 13.2 percentage points, which is basically explained by a higher economic growth and by a higher primary surplus.
Given uncertainty about the future evolution of the macroeconomic environment, the potential impact of different scenarios on the forecast evolution of the public debt must be evaluated. To do so, a probability distribution is constructed for each period of the forecast horizon. The main results obtained through this simulation are that the average of these distributions follow a downward trend and that, by 2009, 90 percent of the of the distribution deviation is considered in the simulation would show public debt-to-GdP ratios ranging between 17 and 32 percent.
moreover, the simulation also allows to evaluate how the probability that the public debt ratio will be higher than in 2006 (32.7 percent) changes with the fiscal policy position. In this simulation, we may see that this probability increases when the primary surplus decreases. For example, if the average primary surplus is set at 2.8 percent of GdP (a rate similar to the one considered in the central scenario of this Report), the probability ranges between 3 and 5 percent and reaches its lowest level in 2009. on the other hand, if a lower primary surplus is set -for example, 1.6 percent of GdP-, this probability increases to between 14 and 20 percent. Given the volatility of the macroeconomic environment in which the public treasury operates, this implies that low levels of primary surplus configurate very risky scenarios to guarantee the sustainability of fiscal policy. Therefore, in order to minimize the risk of increases in the debt-to-GdP ratio, the fiscal policy must generate fiscal surpluses and take advantage of favorable contexts to substantially reduce the public debt and/or strengthen the Fiscal Stabilización Fund (FSF).
It is worth remembering that simulated distributions of the debt-to-GdP ratio reflect the volatility seen in the economy over the past 10 years, and that no episodes of an abrupt deterioration of the financial variables determinating the dynamics of the public debt have been seen in this period. Therefore, it would also be prudential to take advantage of the favorable international financial context to continue developing the debt-management operations that reduce the treasury’s exposure to exchange risks (i.e. converting foreign currency-denominated debt into domestic currency-denominated debt), to interest rate-related risks (replacing variable-rate debt by fixed-rate debt), and to refinancing risks (extending the period of average maturities to smoothen the profile of amortization payments, and restructuring the public debt so that the payment profile is more stable).
PUBLIC DeBt BALAnCe FoReCASt(Percentage of GdP)
dec.99 dec.00 dec.01 dec.02 dec.03 dec.04 dec.05 dec.06 dec.07 dec.08 dec.09
45
40
�5
30
�5
20
�5
%
45
40
�5
30
�5
20
�5
%
33%
24%26%
28%

.......73
Central Reserve Bank of Peru
..................................................................................................................................................................................................................................................
PUBLIC DeBt BALAnCe (Percentage of GdP)
2006 2007 Accumulated
2000-2007
I. Public debt 32.7 28.4 - external 23.6 28.6 - Internal 9.1 9.7 II. Change in the public debt (1+2+3) -5.0 -4.4 -17.1 1. Primary balance �/ -3.9 -3.8 -10.5 2. Automatic debt dinamycs -3.3 -1.9 -10.4 - by real interest rate 1.1 1.3 8.7 - by terms of trade �/ -2.1 0.0 -4.0 - by real growth -2.5 -2.3 -13.6 - by exchange rate variation S/. x uS$ -0.2 -0.9 -3.0 - by exchange rate variation S/. x other 0.3 0.0 1.4 3. deposits, privatization and others 2.3 1.4 3.8
1/ Negative sign indicates surplus.
2/ It refers to the effect of the terms of trade in the GdP deflator.
BoX 8
SoURCeS oF CHAnGe In tHe PUBLIC DeBt
The public debt should decrease from 45.5 percent of GdP to 28.4 percent of GdP between 2000 and 2007. Furthermore, an additional reduction should be seen in the next years, as a result of which this indicator would reach 24.0 percent of GdP in 2009.
The following table shows a break down of the elements that may be attributed to the conduct of the public treasury (such as the primary result and the change in government’s deposits) and to changes associated with the macroeconomic environment (such as GdP growth, interest rates, and the evolution of exchange) to explain the variations observed in the 2000-2007 debt.
The table shows that the accumulated reduction in the public debt-to-GdP ratio (17.1 percentage points) observed between 2000 and 2007 may be explained by the accumulated impact of the primary surplus generated by the public sector (10.5 percentage points), as well as by the combination of high growth and the appreciaton of the Nuevo Sol seen in this period. Both factors would account for a reduction of 16.6 percentage points of GdP in the balance of the debt. on the other hand, the interest rate increased the debt by 8.7 percentage points. Additionally, by increasing the GdP deflator, our higher terms of trade reduced the debt ratio by 4.0 percentage points, while the changes seen in the value of the dollar against other currencies -particularly those currencies in which our external debt is denominated- increased the debt balance by nearly 1.4 percentage points.

Inflation Report. September 2007
..................................................................................................................................................................................................................................................
74 .......
VII. Financial markets
Long-term interest rates in the capital markets increased during July and August 2007, affected by the higher risk aversion of institutional investors which decreased their demand for debt papers. This situation was then partially reverted in September. On the other hand, short-term interest rates in Nuevos Soles have been increasing since July 2007, particularly in the case of rates with lower risks and maturities, in view that the reference interest rate was raised from 4.5 to 4.75 in July and to 5 percent in September.
77. The monetary operations made by the BCRP are aimed at regulating liquidity in the money market in order to induce the interbank rate to converge towards the monetary policy reference rate. The interbank interest rate serves as a guide to set the other rates in Nuevos Soles (for active and passive operations) affecting especially operations with lower risks and with shorter maturities, given that these type of operations depend less on other factors, such as credit risks.
78. The corporate prime rate increased from 5.2 to 5.5 percent between May and September 2007. This evolution is mainly explained by the fact that the reference interest rate was raised to 5.0 percent by increasing it by 25 basis points in both July and September.
As a result, the differential between the interbank rate and the corporate prime rate in Nuevos Soles was approximately 49 basis points, a lower level than the one recorded in May 2007 (69 basis points).
79. Moreover, the interest rates on banks’ active operations were reduced compared to May. This reduction was associated with the decrease of the rates in Nuevos Soles for loans to microenterprises (from 37.2 to 36.2 percent), for consumer loans (from 33.5 to 33.0 percent), and for mortgage loans (from 10.1 to 9.9 percent). Furthermore, this reduction
Graph 74INTERBANK AND CORPORATE INTEREST RATEIN DOMESTIC CURRENCY(In percentage)
9
8
7
6
5
4
3
2
1
0Jan.02 Sep.02 May.03 Jan.04 Sep.04 May.05 Jan.06 Sep.06 May.07 Sep.07
Interbank Corporate
General elections: April
5.2
6.8
5.2
Regional turbulence
5.55.3
4.54.5
5.0
4.74.4
September: increase inthe reference interest rate from 4.75 a 5.00
July: increase in thereference interest ratefrom 4.50 a 4.75
Graph 75RATIO NON-PERFORMING LOANS / DIRECT CREDITS OF LOANS AUTHORIZED BY BANKS AND MICROBUSINESSES
7
6
5
4
3
2
1
0 Dec.05 Feb.06 Apr.06 Jun.06 Aug.06 Oct.06 Dec.06 Feb.07 Apr.07 Jun.07 Aug.07
5.6
4.14.14.14.34.34.34.44.54.9
5.3
5.95.96.26.46.26.26.1
5.86.1
5.8

.......75
Central Reserve Bank of Peru
..................................................................................................................................................................................................................................................
Graph 77SECONDARY MARKET FOR PUBLIC TREASURYSOVEREIGN BONDS 1/
0 2 4 6 8 10 12 14 16 18 20 22 24 26 28 30
Yields (%)
5.57
6.586.38
6.296.146.04
6.64
6.446.30
5.88 6.01
5.725.515.41
Dic.06
Set.07
May.07
Residual terms (years)
5.60
4.85
7.507.257.006.756.506.256.005.755.505.255.004.75
5.395.07
5.77
1/ Sovereign bond yields traded closer at the end of periods.
was favored by a better financial situation of borrowers in a scenario marked by competition for these segments among financial entities.
Banks’ average active rate on the credit operations (FTAMN7/) carried out in this period -including operations with different levels of risk- increased from 21.9 percent in May 2007 to 23.7 percent in September 2007.
80. As regards passive rates in Nuevos Soles, these increased relative to the levels recorded in May, particularly in the case of the rates with shorter maturities. Thus, the rate on 30-day deposits increased from 4.5 in May to 4.9 percent in September, while the rate on deposits up to 180 days rose from 4.8 to 5.0 percent in the same period.
Passive rates in dollars also showed some increase during September, as a result of which the spread between these rates and rates in Nuevos Soles increased only slightly for some maturities.
Bond market
81. The yield on long-term domestic bonds has increased for all the bonds with different maturities since our previous Inflation Report was published in May. Compared to December 2006, the rates on shorter-term bonds have increased more, while the rates on bonds with longer maturities remain at similar levels. However, the rates on bonds in September were lower than the ones seen in August this year, as they were affected by volatility in international markets.
table 31
InteReSt RAte In DoMeStIC AnD FoReIGn CURRenCIeS(In percentage)
(A) nuevos Soles (B) Dollars Differential (A) - (B)
Dec. Dec. May. Sep. Dec. Dec. May. Sep. Dec. Dec. May. Sep.
2005 2006 2007 2007 2005 2006 2007 2007 2005 2006 2007 2007
1. Reference rate and Fed funds rate 3.3 4.5 4.5 5.0 4.3 5.3 5.3 4.8 -1.0 -0.8 -0.8 0.32. deposits up to 30 days 3.6 4.6 4.5 4.8 3.6 4.3 4.6 4.6 -0.1 0.3 -0.1 0.33. Term deposits between 31 to 180 days 3.6 4.8 4.8 5.0 2.9 3.4 3.6 3.8 0.7 1.3 1.1 1.14. Term deposits between 181 to 360 days 4.6 5.7 5.5 5.5 2.9 3.6 3.7 3.8 1.7 2.1 1.8 1.75. Active Prime Rate 4.4 5.2 5.2 5.4 5.5 6.1 6.1 6.2 -1.1 -0.9 -0.9 -0.86. Average lending constant structure 17.0 17.1 16.5 16.1 10.3 10.6 10.5 10.3 6.8 6.5 6.1 5.8
7/ weighed average active rate on operations in domestic currency carried out over the past 30 days.
Graph 76INTEREST RATE ON COMMERCIAL MICROBUSINESS AND CONSUMER LOANS IN DOMESTIC CURRENCY(In percentage)
70
60
50
40
30
20
10
0Jan.02 Sep.02 May.03 Jan.04 Sep.04 May.05 Jan.06 Sep.06 May.07 Sep.07
Microbusinesses Consumption Commercial
47.944.0
38.6 37.2
33.5
9.29.3
34.7
8.5
36.9
9.7
37.5
36.2
33.0
8.9

Inflation Report. September 2007
..................................................................................................................................................................................................................................................
76 .......
82. The increase of the yield on domestic bonds in August was influenced by the crisis of international liquidity, associated with the problems of the real estate sector in the United States that started in mid-July. Due to this crisis, the demand for higher risk bonds declined, affecting also the bonds of emerging countries. Thus, after reaching a minimum historical record of 95 basis points on June 12, the country risk indicator started showing an upward trend and posted 192 points on August 16 (its maximum level in the year). Then, the country risk indicator resumed a downward trend, favorably influenced thereafter by the FED’s decision to reduce its reference rate by 50 basis points on September 18. The country risk closed at 137 basis points on September 28.
83. In July 2007, the Peruvian government issued for the first time a 30-year bond at a fixed rate, with a yield of 6.90 percent. In the Latin American region, only Mexico had a similar 30-year bond (which was placed in October 2006 at a fixed rate of 8.08 percent and denominated in pesos). The issue of a 30-year bond in the domestic market will contribute to extend maturities for credit in Nuevos Soles, basically for mortgage loans.
Short-term interest rates have increased since July 2007, in line with the preventive adjustments made by the Central Bank in its reference rate in both July and September (the BCRP raised this rate by 25 basis points each time). The yield curve slope has also increased slightly in the between the shorter maturities, which would be explained by the system’s higher requirements of liquidity and by increased uncertainty about future short-term rates in a context of high volatility in international markets.
table 32
YIeLDS oF tHe PUBLIC tReASURY BonD BY CURRenCIeS (monthly average data in percentage)
nominal bonds BtP in Global bonds in dollars Yields
May 2015 February 2015 differential
(a) (b) (a) - (b)
dec.05 7.9 6.7 1.2may.06 7.5 7.0 0.6dec.06 6.1 5.6 0.5Apr.07 5.6 5.5 0.1may.07 5.5 5.5 0.0Jun.07 5.7 5.8 -0.1Jul.07 6.0 5.9 0.1Aug.07 6.2 6.1 0.2Sep.07 6.2 5.8 0.4 Source: dATATeC - Bloomberg.
Graph 78 SOVEREIGN BONDS AND COUNTRY RISK
7,2
7,0
6,8
6,6
6,4
6,2
6,0
5,8
5,6
% 200
180
160
140
120
100
Sovereign in Nuevos Soles 2026 Country Risk
2 5 10 13 18 23 26 31 3 8 16 21 24 29 4 7 12 17 20 25 28 July August September
Graph 79SECONDARY MARKET FOR CDBCRP 1/
0 6 12 18 24 30 36
Yields (%)
4.75
6.25
5.815.64
5.535.32
5.22
5.70
5.455.21
5.154.96
4.814.714.60
4.50
Sep.07
Jul.07
May.07
Residual terms (months)
5.055.12
6.36.15.95.75.55.35.14.94.74.54.3
5.97 6.00
5.49
5.415.385.28
5.155.05
4.89
1/ Average yield traded during the period.
Basis points

.......77
Central Reserve Bank of Peru
..................................................................................................................................................................................................................................................
The differential between the rates of sovereign bonds in Nuevos Soles and sovereign bonds in dollars can be calculated using information on the yield on said instruments with maturities in 2015. This spread is currently 0.4 percent -a similar level to that of December 2006-, which reflects both the country’s sound position in terms of international liquidity and inflation rates similar to those of developed countries.
Monetary operations
84. Monetary operations are carried out to lead the interbank interest rate towards the level of the monetary policy interest rate. Therefore, excess liquidity (resulting mainly from exchange operations) is sterilized through the placement of Certificates of Deposit (CDBCRP), while liquidity requirements are covered through the temporary purchase of CDBCRPs or Public Treasury bonds, an operation called REPO. The Central Bank intervenes in the exchange market in order to preventively accumulate international reserves and to deal with situations of excessive volatility in the evolution of exchange. International reserves allow offsetting the impact of possible adverse macroeconomic shocks and provide monetary policy with a better stance to face liquidity-related risks in a dollarized economy.
85. Between June and mid-July, sterilization operations were carried out in order to maintain the interbank interest rate at the level of the reference rate, in a context of appreciation of the Nuevo Sol and of intervention in the foreign exchange market with the purpose of preventively accumulating international reserves and reducing excessive volatility in exchange. This sterilization process was progressively carried out through the placement of CDBCRPs whose maturities ranged between one day and three years, contributing thereby to the formation of a short-term yield curve.
However, since liquidity requirements in domestic currency increased since end-July and mid-September, it was necessary to temporarily inject liquidity into the system (repo operations). Factors explaining this situation included the liquidity requirements derived from the placement of Public Treasury bonds in the domestic market (S/. 2,860 million, where the US$ 1,504 million auctioned on July 19 for the prepayment of the external debt with the Paris Club are included), and the complementary effect of the increased demand for current account liquidity during the first days of each month, which is associated with the new period of reserve requirements.
86. Depreciatory pressures, associated with volatility in external markets, were observed in the second half of August, thus
Graph 80NET BALANCE OF FORWARD PURCHASES BY BANKSAND EXCHANGE RATE
1,500
1,000
500
0
-500
-1,000
-1,500
-2,000 Jan.06 Mar.06 May.06 Jul.06 Sep.06 Nov.06 Jan.07 Mar.07 May.07 Jul.07 Sep.07
S/. per US$Millions of US$3.450
3.400
3.350
3.300
3.250
3.200
3.150
3.100
3.050
3.000
Net balance of forward purchasesExchange rate

Inflation Report. September 2007
..................................................................................................................................................................................................................................................
78 .......
increasing forward operations as a hedge against depreciation risks and banks’ purchases of dollars. In response, the Central Bank placed CDRBCRPs for S/. 500 million on August 16. Later on, the maturities of CDBCRPs contributed to reduce the amount of repo operations.
In September, after the sensation of risk in emerging markets subsided, the BCRP resumed the permanent injection of liquidity in Nuevos Soles through purchases of dollars. The residual term to the average maturity of CDBCRPs decreased from 352 days in May to 309 days in September.
Monetary base
87. The issue of banknotes and coins increased 26.1 percent between September 2006 and September 2007, showing a faster pace of growth compared to the same period last year (13.9 percent), in a context of the greater dynamism exhibited by economic activity and considering the existing lag until the rise of the reference rate is reflected in the public’s demand for currency.
table 33
MonetARY BASe (millions of Nuevos Soles)
2002 2003 2004 2005 2006 IQ 2007 IIQ 2007 IIIQ 2007 2007*
1. Flow of the monetary base 672 682 1,886 2,397 2,140 -571 722 598 750 (Annual percentage change) 11.0 10.1 25.3 25.7 18.3 20.7 26.2 26.1 26.1 2. Foreign exchange operations 436 3,465 6,239 2,360 9,140 3,548 8,621 756 12,925 (In millions of uS$) 128 998 1,854 767 2,861 1,112 2,719 248 4,079 a. over the counter -32 1,050 2,340 2,699 3,944 1,530 3,372 1,835 6,736 b. Public sector purchases 157 -51 -487 -1,935 -1,084 -418 -669 -1,588 -2,675 c. other operations (net) 3 -1 2 3 1 0 17 1 18 3. Monetary operations 236 -2,783 -4,353 37 -7,000 -4,119 -7,899 -158 -12,175 a. deposits of the Public Sector -81 -921 -721 -2,821 -5,434 -987 -4,707 -823 -6,516 b. Net placements CdBCRP 205 -2,462 -4,158 578 -389 -3,950 -3,837 1,049 -6,738 c. Net placements CdRBCRP -319 319 0 -1,202 1,202 0 0 -500 -500 d. Inyection operations (repos) 170 -170 0 2,850 -2,850 0 0 0 0 e. others 261 451 526 631 471 818 645 116 1,579 Note: Balance at the end of period
monetary base 6,759 7,441 9,327 11,724 13,864 13,293 14,015 14,613 14,613 total balance sterilized 2,342 5,355 10,321 13,788 18,598 23,404 31,983 32,334 32,334(In % monetary base) 34.6 72.0 110.7 117.6 134.2 176.1 228.2 221.3 221.3 (a) BCRP Certificates of deposits (CdBCRP) 1,635 4,097 8,255 7,676 8,066 12,016 15,852 14,803 14,803(b)deposits of Public Sector 275 1,196 1,918 4,738 10,172 11,159 15,866 16,688 16,688(c) BCRP Indexed Certificates of deposits 319 0 0 1,202 0 0 0 500 500(d) Rest 112 62 149 172 360 229 265 342 342 * January-September.
Graph 81AVERAGE RESIDUAL TERM OF CDBCRP
410
370
330
290
250
210
170 Dec.05 Mar.06 Jun.06 Sep.06 Dec.06 Mar.07 Jun.07 Sep.07
224
Graph 82MONETARY BASE(Percentage change last 12 months)
Jan.02 Sep.02 May.03 Jan.04 Sep.04 May.05 Jan.06 Sep.06 May.07 Sep.07
31.835
30
25
20
15
10
5
0
Days
309
357366
357352
329
273288
220
182
205
174
203
179183183185194
205207214
29.526.2
23.018.3
27.7
26.1
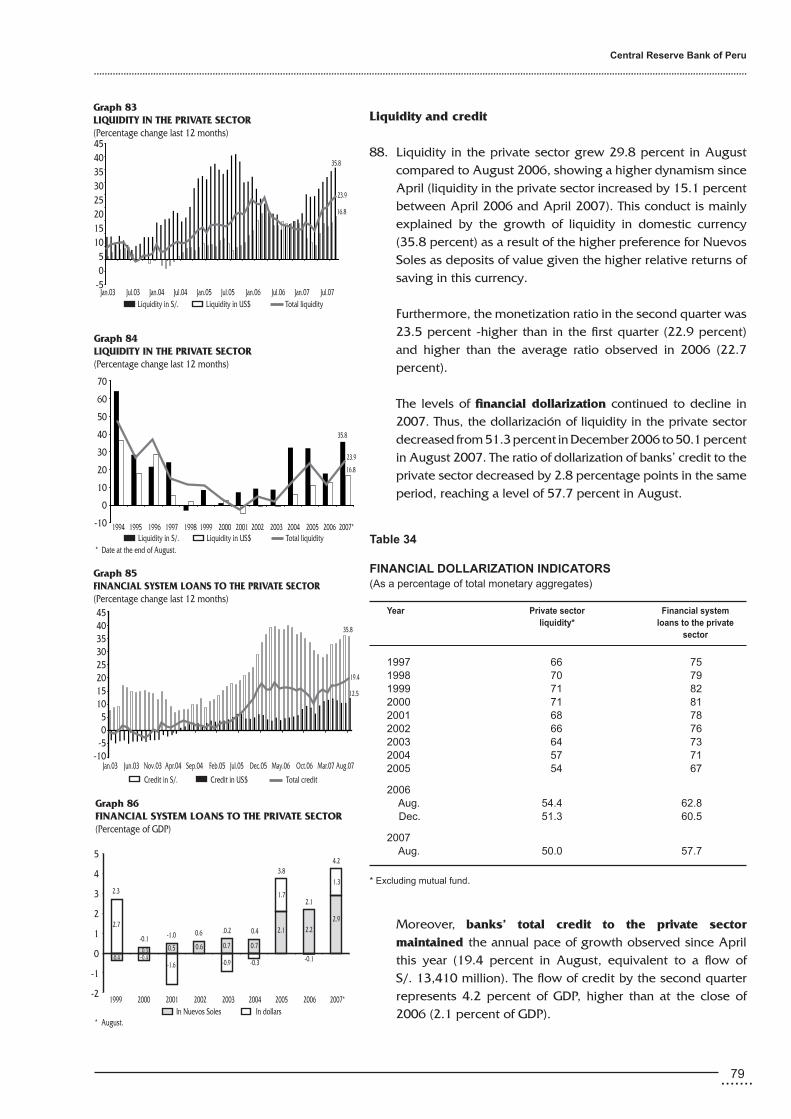
.......79
Central Reserve Bank of Peru
..................................................................................................................................................................................................................................................
Liquidity and credit
88. Liquidity in the private sector grew 29.8 percent in August compared to August 2006, showing a higher dynamism since April (liquidity in the private sector increased by 15.1 percent between April 2006 and April 2007). This conduct is mainly explained by the growth of liquidity in domestic currency (35.8 percent) as a result of the higher preference for Nuevos Soles as deposits of value given the higher relative returns of saving in this currency.
Furthermore, the monetization ratio in the second quarter was 23.5 percent -higher than in the first quarter (22.9 percent) and higher than the average ratio observed in 2006 (22.7 percent).
The levels of financial dollarization continued to decline in 2007. Thus, the dollarización of liquidity in the private sector decreased from 51.3 percent in December 2006 to 50.1 percent in August 2007. The ratio of dollarization of banks’ credit to the private sector decreased by 2.8 percentage points in the same period, reaching a level of 57.7 percent in August.
Moreover, banks’ total credit to the private sector maintained the annual pace of growth observed since April this year (19.4 percent in August, equivalent to a flow of
S/. 13,410 million). The flow of credit by the second quarter represents 4.2 percent of GDP, higher than at the close of 2006 (2.1 percent of GDP).
table 34
FInAnCIAL DoLLARIZAtIon InDICAtoRS (As a percentage of total monetary aggregates)
Year Private sector Financial system liquidity* loans to the private sector
1997 66 75 1998 70 79 1999 71 82 2000 71 81 2001 68 78 2002 66 76 2003 64 73 2004 57 71 2005 54 67
2006 Aug. 54.4 62.8 dec. 51.3 60.5
2007 Aug. 50.0 57.7
* excluding mutual fund.
In Nuevos Soles In dollars
Graph 86FINANCIAL SYSTEM LOANS TO THE PRIVATE SECTOR(Percentage of GDP)
5
4
3
2
1
0
-1
-2 1999 2000 2001 2002 2003 2004 2005 2006 2007*
* August.
2.3
2.7
-0.4 -0.4 -0.1-0.3-0.9-1.6
2.1
4.23.8
0.4.0.20.6-1.0-0.10.3 0.5 0.6 0.7 0.7
2.1 2.22.9
1.3
1.7
Liquidity in S/. Liquidity in US$ Total liquidity
Graph 83LIQUIDITY IN THE PRIVATE SECTOR(Percentage change last 12 months)454035302520151050
-5Jan.03 Jul.03 Jan.04 Jul.04 Jan.05 Jul.05 Jan.06 Jul.06 Jan.07 Jul.07
16.8
23.9
35.8
Liquidity in S/. Liquidity in US$ Total liquidity
Graph 84LIQUIDITY IN THE PRIVATE SECTOR(Percentage change last 12 months)
70
60
50
40
30
20
10
0
-10 1994 1995 1996 1997 1998 1999 2000 2001 2002 2003 2004 2005 2006 2007*
23.9
16.8
35.8
* Date at the end of August.
Credit in S/. Credit in US$ Total credit
35.8
454035302520151050
-5-10
Jan.03 Jun.03 Nov.03 Apr.04 Sep.04 Feb.05 Jul.05 Dec.05 May.06 Oct.06 Mar.07 Aug.07
12.5
19.4
Graph 85FINANCIAL SYSTEM LOANS TO THE PRIVATE SECTOR(Percentage change last 12 months)

Inflation Report. September 2007
..................................................................................................................................................................................................................................................
80 .......
All the components of credit grew during 2007, particularly consumer loans which increased by 38.6 percent between August 2006 and August 2007. The growth of consumption credit was coupled by an increase in the average level of indebtedness per individual and by the incorporation of new economic agents to this market. The most dynamic component of credit is still the credit card system.
On the other hand, mortgage loans increased by 18.4 percent in the same period, led by the recovery of mortgage credits in Nuevos Soles granted by banks (134.5 percent) and financial entities. In May 2006, financial entities participated for the first time in the segment of mortgage loans in domestic currency. The current flow of mortgage loans is mainly covered with banks’ own resources (95.6 percent of total mortage loans in domestic currency).
Although a slight tendency to de-dollarization has been seen in recent months, mortgage loans granted by the financial system exhibit a high degree of dollarization (84 percent of placements by end-August 2007). This entails important risks that should be taken into account, such as the “balance-sheet effect” (exchange - credit risk), which is generated by the currency mismatch in the borrower’s balance. In other words, although the borrower receives incomes in Nuevos Soles, his main monthly payments for his financial obligations are denominated in dollars.
Therefore, it is necessary to establish appropriate incentives
that enable economic agents to internalize the effects of dollarization in order that they choose to request credit in domestic currency. A key element to initiate a de-dollarization process in the Peruvian case was the issue of the 20-year and 30-year Public Treasury bonds in nominal Nuevos Soles, as these bonds have favored the appearance of home loans in Nuevos Soles with the same maturities as those denominated in dollars.
In August, credit in domestic currency maintained a relative higher dynamism -showing a last 12-month pace of growth of 35.5 percent (S/. 9,104 million)- compared to the increase observed in credit in dollars (12.5 percent, equivalent to a flow of US$ 1,666 million). According to data up to August, the most dynamic components of credit in domestic currency included the placements of banks (45.3 percent), Banco de la Nación (52.7 percent), Edpymes (60.5 percent) and mutual funds (62.5 percent).
Graph 87CONSUMPTION LOANS BY BORROWER IN THE OVERALL FINANCIAL SYSTEM 1/
(Nuevos Soles)
3,400
3,200
3,000
2,800
2,600
2,400
2,200
2,000 Jan.05 May.05 Sep.05 Jan.06 May.06 Sep.06 Jan.07 May.07 Aug.07
2,191
3,098
2,564
2,435
2,266
2,6322,731
2,899
3,229
Graph 88GROWTH OF CREDIT IN FINANCIAL SYSTEM(Percentage change last 12 months)
50
40
30
20
10
0
-10
-20
Consumption Mortgage Commercial and Microbusinesses
2002 2003 2004 2005 2006 May.07 Aug.07
20.6
14.4
0.9
Source: SBS.1/ It corresponds to the sum of each debtor company for the industry benchmark. Therefore, if a
debtor has an obligation to more than one company, it is seen as many times as the number of companies with which it has debt.
18.714.4
-9.5
24.1
12.6
-2.0
28.926.2
19.3
26.4
10.314.3
35.3
14.821.8
38.6
18.430.6

.......8�
Central Reserve Bank of Peru
..................................................................................................................................................................................................................................................
Exchange rate
89. Between December 2006 and September 2007, the Nuevo Sol appreciated by 2.2 percent, continuing with the trend observed in recent years, which reflects better domestic macroeconomic fundamentals, the positive evolution of external accounts, and portfolio movements to the domestic currency, in a context of weakness of the dollar in the international financial market.
table 35
FInAnCIAL SYSteM LoAnS to tHe PRIVAte SeCtoRIn DoMeStIC CURRenCY
Balance in millions of nuevos Soles % Variation
31Aug.06 31Dec.06 31Aug.07 Aug.07/ Aug.07/
Aug.06 Dec.06
Banks 14,376 17,669 22,343 45.3 26.4 Banco de la Nacion 1,361 1,330 2,078 52.7 56.2 Microfinance institutions 4,983 4,638 4,552 11.4 -1.4 municipal saving banks 2,136 2,400 2,679 25.4 11.6 Rural saving banks 414 462 544 31.4 17.9 Cooperatives 682 758 817 19.8 7.8 edpymes 450 580 723 60.4 24.4 Financial companies 1,301 1,437 789 -39.3 -45.1 Institutional investors 1/ 3,528 3,649 4,476 26.8 22.6Private pension funds (AFPs) 2,477 2,568 3,141 26.8 22.3 Insurance companies 687 637 742 8.1 16.4 mutual funds 364 444 592 62.4 33.4 Leasing companies and others 432 334 334 -22.4 -0.1
total Financial System 24,680 28,621 34,783 35.8 21.5
1/ mainly securities issued by the private sector.
table 36
FInAnCIAL SYSteM LoAnS to tHe PRIVAte SeCtoRIn FoReIGn CURRenCY
Balance in millions of dollars % Variation
31Aug.06 31Dec.06 31Aug.07 Aug.07/ Aug.07/
Aug.06 Dec.06
Banks 10,392 10,370 11,755 13.1 13.4 Banco de la Nacion 22 14 12 -46.4 -15.0 Microfinance institutions 654 741 775 18.5 4.5 municipal savings banks 318 349 378 18.9 8.4 Rural saving banks 54 55 55 1.9 0.1 Cooperatives 181 224 237 31.0 6.1 edpymes 57 68 80 38.5 16.6 Financial companies 43 46 25 -42.4 -45.4 Institutional investors 1/ 1,693 1,919 1,783 5.4 -7.1 Private pension funds (AFPs) 853 1,025 908 6.4 -11.4 Insurance companies 169 182 152 -10.2 -16.6 mutual funds 670 712 723 7.9 1.6 Leasing companies and others 597 653 698 17.0 7.0
total Financial System 13,357 13,697 15,023 12.5 9.7
�/mainly securities issued by the private sector.

Inflation Report. September 2007
..................................................................................................................................................................................................................................................
8� .......
The nominal exchange rate of the Nuevo Sol against the currency basket of our main trading partners increased from S/. 0.570 in December 2006 to S/. 0.573 in September 2007. This result is associated with a faster devaluation of the dollar against the currencies of our other trading partners, such as the Brazilian real (9.8 percent), the Colombian peso (9.3 percent), the euro (5.7 percent), and the Canadian dollar (5.0 percent).
90. In real terms, so far this year the multilateral exchange index has depreciated by 0.86 percent, due to the combined effect of the nominal depreciation of the Nuevo Sol basket (0.54 percent) and external inflation (3.35 percent). This effect has been partially offset by domestic inflation (3.02 percent).
table 37
BReAKDoWn BY CoMPonentS oF tHe MULtILAteRAL eXCHAnGe RAte(Percentage variation)
Real multilateral nominal exchange rate trading partners Domestic exchange rate with currency basket inflation inflation1996 1.6 6.7 7.2 11.8 1997 -4.1 -3.0 5.2 6.5 1998 14.1 15.4 4.9 6.01999 6.4 4.9 5.3 3.7 2000 -2.3 -4.8 6.4 3.7 2001 -2.6 -5.7 3.1 -0.1 2002 -0.8 -3.9 4.8 1.5 2003 5.9 4.9 3.4 2.5 2004 -2.4 -2.4 3.5 3.5 2005 6.1 4.0 3.5 1.5 2006 -2.3 -4.0 3.0 1.120071/ 0.9 0.5 3.3 3.0
1/ Variation accumulated to September.
table 38
BILAteRAL eXCHAnGe RAte (S/. per monetary unit): SePteMBeR(Percent variation) nominal relative to: Real relative to:
Weight * Dec. 06 Sep.06 Dec.06 Sep.06 uSA 29.2% -2.2% -3.4% -2.0% -3.6%eurozone 12.3% 3.2% 5.7% 1.8% 4.8%Japan 4.0% 0.2% -1.2% -2.9% -4.7%Brazil 5.5% 10.3% 9.8% 10.6% 11.6%united Kingdom 1.3% 1.1% 3.9% -1.3% 2.6%Chile 6.7% 0.5% 1.2% 2.7% 3.4%China 11.4% 2.3% 2.4% 3.1% 4.1%Colombia 4.2% 4.5% 9.3% 6.8% 12.3%mexico 2.9% -3.3% -3.6% -4.6% -3.2%Argentina 2.6% -6.6% -6.6% -4.6% -1.9%Korea 2.2% -2.3% -0.7% -2.8% -1.6%Taiwan 1.9% -3.2% -3.4% -4.3% -4.1%Venezuela 3.1% -1.6% -2.9% 5.7% 8.7%Canada 4.8% 9.8% 5.0% 9.6% 5.1%ecuador 4.6% -2.2% -3.4% -2.7% -3.3%Switzerland 3.4% 0.1% 1.7% -2.6% -0.5%
Basket 100.0% 0.5% 0.4% 0.9% 1.2%
* weight relative to the commercial year 2006.
Graph 89NOMINAL EXCHANGE RATE(S/. per monetary unit)
3.80
3.60
3.40
3.20
3.00
2.80
2.60
2.40
2.20
2.00Jan.97 Jan.98 Jan.99 Jan.00 Jan.01 Jan.02 Jan.03 Jan.04 Jan.05 Jan.06 Jan.07 Set.07
0.66
0.64
0.62
0.60
0.58
0.56
0.54
0.52
0.50
S/. per US$
S/. per basket
Graph 90MULTILATERAL AND BILATERAL REAL EXCHANGE RATE(Dec. 2001 = 100)
115
110
105
100
95
90
85
80
115
110
105
100
95
90
85
80
Multilateral Real Exchange rate index Bilateral Real Exchange rate index
Jan.97 Jan.98 Jan.99 Jan.00 Jan.01 Jan.02 Jan.03 Jan.04 Jan.05 Jan.06 Jan.07 Set.07
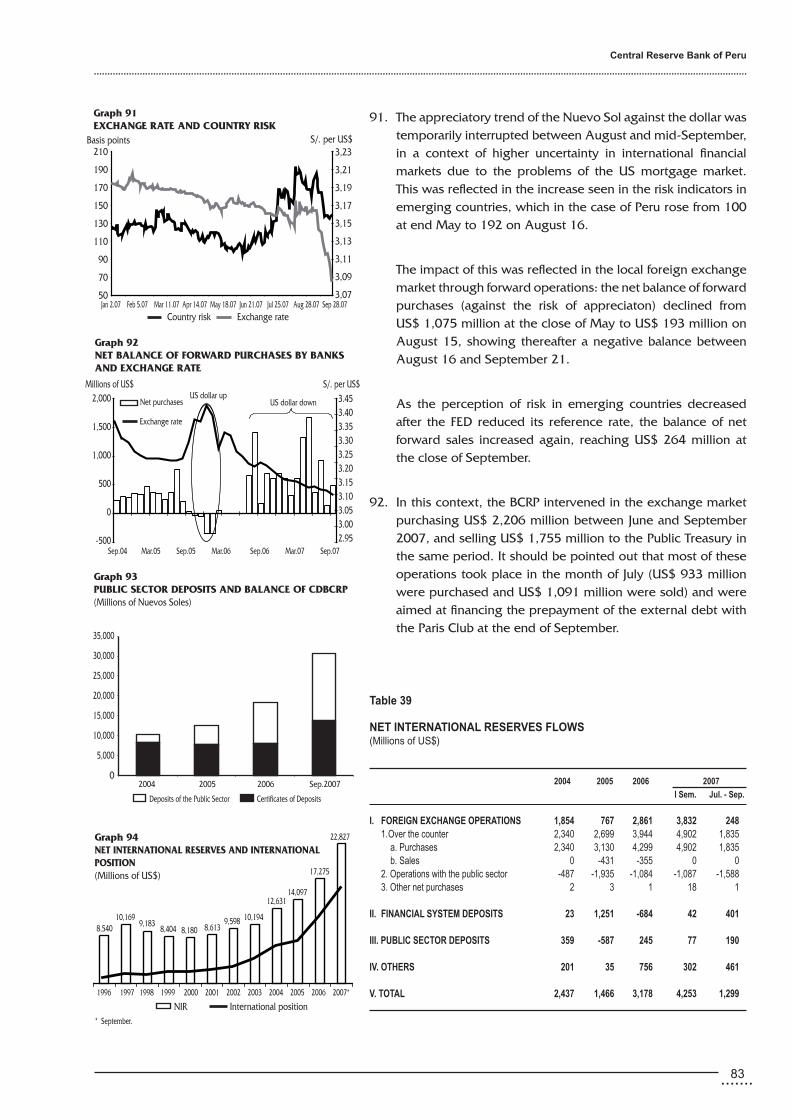
.......8�
Central Reserve Bank of Peru
..................................................................................................................................................................................................................................................
91. The appreciatory trend of the Nuevo Sol against the dollar was temporarily interrupted between August and mid-September, in a context of higher uncertainty in international financial markets due to the problems of the US mortgage market. This was reflected in the increase seen in the risk indicators in emerging countries, which in the case of Peru rose from 100 at end May to 192 on August 16.
The impact of this was reflected in the local foreign exchange market through forward operations: the net balance of forward purchases (against the risk of appreciaton) declined from US$ 1,075 million at the close of May to US$ 193 million on August 15, showing thereafter a negative balance between August 16 and September 21.
As the perception of risk in emerging countries decreased after the FED reduced its reference rate, the balance of net forward sales increased again, reaching US$ 264 million at the close of September.
92. In this context, the BCRP intervened in the exchange market purchasing US$ 2,206 million between June and September 2007, and selling US$ 1,755 million to the Public Treasury in the same period. It should be pointed out that most of these operations took place in the month of July (US$ 933 million were purchased and US$ 1,091 million were sold) and were aimed at financing the prepayment of the external debt with the Paris Club at the end of September.
table 39
net InteRnAtIonAL ReSeRVeS FLoWS(millions of uS$)
2004 2005 2006 2007
I Sem. Jul. - Sep.
I. FoReIGn eXCHAnGe oPeRAtIonS 1,854 767 2,861 3,832 248 1. over the counter 2,340 2,699 3,944 4,902 1,835 a. Purchases 2,340 3,130 4,299 4,902 1,835 b. Sales 0 -431 -355 0 0 2. operations with the public sector -487 -1,935 -1,084 -1,087 -1,588 3. other net purchases 2 3 1 18 1 II. FInAnCIAL SYSteM DePoSItS 23 1,251 -684 42 401 III. PUBLIC SeCtoR DePoSItS 359 -587 245 77 190 IV. otHeRS 201 35 756 302 461 V. totAL 2,437 1,466 3,178 4,253 1,299
Graph 92NET BALANCE OF FORWARD PURCHASES BY BANKSAND EXCHANGE RATE
2,000
1,500
1,000
500
0
-500 Sep.04 Mar.05 Sep.05 Mar.06 Sep.06 Mar.07 Sep.07
Millions of US$ S/. per US$3.453.403.353.303.253.203.153.103.053.002.95
Net purchases
Exchange rate
US dollar upUS dollar down
Deposits of the Public Sector Certificates of Deposits
Graph 93PUBLIC SECTOR DEPOSITS AND BALANCE OF CDBCRP(Millions of Nuevos Soles)
35,000
30,000
25,000
20,000
15,000
10,000
5,000
02004 2005 2006 Sep.2007
Graph 94NET INTERNATIONAL RESERVES AND INTERNATIONALPOSITION(Millions of US$)
1996 1997 1998 1999 2000 2001 2002 2003 2004 2005 2006 2007*
NIR International position
10,1699,183
10,1949,5988,6138,1808,404
22,827
17,275
14,09712,631
* September.
8,540
Graph 91EXCHANGE RATE AND COUNTRY RISK
210
190
170
150
130
110
90
70
50 Jan 2.07 Feb 5.07 Mar 11.07 Apr 14.07 May 18.07 Jun 21.07 Jul 25.07 Aug 28.07 Sep 28.07
3,23
3,21
3,19
3,17
3,15
3,13
3,11
3,09
3,07
Country risk Exchange rate
Basis points S/. per US$

Inflation Report. September 2007
..................................................................................................................................................................................................................................................
84 .......
On August 16, the BCRP placed a total of S/. 500 million in Certificates of Deposit Adjustable to the exchange rate (CDRBCRP), in a context of high uncertainty in international financial markets. Thus, a reversal was seen in the balance of forward operations (from US$ -193 million to US$ 196 million).
93. The BCRP net international reserves have increased by US$ 5,552 million so far this year, reaching a balance of US$ 22,827 million at the close of September 2007. This
result is mainly explained by the increase seen in the BCRP’s exchange position (US$ 4,938 million), by the higher public sector deposits (US$ 267 million), and by the higher deposits of the financial system (US$ 443 million).
With this evolution, the percentage of liquidity in the private sector that is covered by international reserves continued to increase (from 72 percent in 2006 to 87 percent in August 2007).
Expectations in terms of exchange
94. Economic agents’ expectations regarding the level of the exchange rate by end 2007 have been corrected downwards: the exchange rate is expected to decrease from between
S/. 3.20 and S/. 3.23 per dollar in January of this year to a range of between S/. 3.11 and S/. 3.16 per dollar in September 2007. Economic agents have also corrected their expectations for 2008 downwards from a range of S/. 3.25 - S/. 3.29 per dollar to a range of S/. 3.15 - S/. 3.19 per dollar. Moreover, in 2009 the exchange rate should range between S/. 3.15 and S/. 3.22 per dollar.
Competitiveness indices Global Doing economic competitiveness indices Business Freedom index
Institution world economic Forum world Bank Heritage Foundation year 2006 / 2007 2008 2007 Global position Peru 74 of 125 countries 58 of 178 countries 63 of 161 countries Regional position * 12 of 20 countries 7 of 31 countries 15 of 29 countries
* Latinamerican and Caribbean.
BoX 9
PeRU In teRMS oF CoMPetItIVeneSS InDICeS
The latest reports on competitiveness indices published recently show that important efforts are still required to attract higher private investment, to increase employment, and to improve productivity.
Analysts Financial system Non-financial businesses institutions
Graph 95EXPECTATIONS REGARDING THE EXCHANGE (Nuevos soles per dollar)
RATE 2007
January 2007 September 2007
3.23
3.13
3.16
3.223.20
3.11
Analysts Financial system Non-financial businesses institutions
RATE 2008
January 2007 September 2007
3.29
3.15
3.19
3.253.25
3.15
Analysts Financial system Non-financial businesses institutions
RATE 2009
September 2007
3.16
3.20
3.15

.......85
Central Reserve Bank of Peru
..................................................................................................................................................................................................................................................
The Global Competitiveness Index, elaborated by the world economic Forum, is based on the evaluation of countries in terms of nine pillars of competitiveness: institutions, infrastructure, macroeconomy, health and primary education, higher education and training, market efficiency, technological readiness, business sophistication, and innovation. According to this index, the relative competitiveness of the Peruvian economy is based mainly on the country’s macroeconomic stability, which is reflected in high growth levels, low inflation levels, positive macroeconomic balances and the reduction of the public debt.
However, substantial improvements are required in aspects such as institutional quality and stability, public infrastructure, secondary education, and work training.
moreover, according to the classification of the world Bank used in the doing Business 2008 report, our economy stands out in terms of protection of investments, of the facilities provided to register property deeds and to obtain credit. Peru ranks seventh in the region, after Puerto Rico (28 in the general ranking), Chile (33), Santa Lucía (34), Antigua & Barbuda (41), mexico (44) and San Vicente and Los Granadinos (54).
However, Peru obtains a low score in the aspects associated with contracts of workers, with the time required to obtain licenses, and with the facilities to start and close businesses. As regards workers’ contracts, the costs of firing a worker are slightly lower than average costs in the region (52 weeks of paid salary versus an average of 56 weeks in the región), but over twice as much as in the oeCd. moreover, there is also a higher rigidity involved in all the aspects associated with hiring and firing a worker (employment’s rigidity index in Peru is 55, while this index shows an average of 32 in the region). on the other hand, 21 procedures and 210 days are required in Peru to get the license to build a warehouse, while 17 procedures and 239 days are required for this in the region, and 14 procedures and 153 days are required on average in oeCd countries. Furthermore, in Peru it takes 72 days to open a business and 3.1 years to close it -both periods are similar in the region. Finally, as regards performance of contracts, the cost of enforcing this is two-times higher than in oeCd countries and 16 percent higher than in other countries of the region.
Finally, the Heritage Foundation’s Index of economic Freedom is based on the evaluation of ten indicators8/. According to this index, the Peruvian economy shows a 62.1 percent of freedom, which is around the average in the region. Peru stands out for its moderate tax rates, for a relatively low government expenditure, and for low inflation levels. These results coincide with those of the world Bank’s index, according to which our main disadvantage compared to other economies is that the labor market “operates under restrictive employment regulations that hinder employment and productivity growth”9/. other negative aspects that should be pointed out are the slowness and low predictability of judiciary processes and decisions, as well as the perception of high levels of corruption.
Doing Business 2008
Capability of ... Global position Regional position*
Doing business 58 7Starting a business 102 18obtain licenses 109 23employing workers 159 26Registering property 35 3Get credit 36 5To protect investors 15 2Paying taxes 77 11Trading internationally 71 10enforcing contracts 119 22Close a business 94 15
* Latinamerican and Caribean.
8/ The economic variables evaluated include the following: freedom in commerce and international trade; fiscal burden of government; freedom in monetary, investment, financial and property-related aspects; corruption and black-market activity, etc.
9/ Quote taken from the report on the Index of economic Freedom 2007.

Inflation Report. September 2007
..................................................................................................................................................................................................................................................
86 .......
BoX 10
eXCHAnGe RAte CoVeRAGe: DoLLAR FoRWARDS
A foreign currency forward contract is an agreement between two parties that obligates the economic agents involved to exchange given quantities of currencies at a prespecified exchange rate on a certain future date. This operation does not involve any disbursement until the maturity of the contract.
The purpose of foreign currency forwards is to manage the risks associated with the possible effects of exchange rate fluctuations. The purchase of foreign currency (dollars) in a forward contract provides the seller with a hedge against a reduction of exchange (an appreciation of the Nuevo Sol) and the buyer with a hedge against an increase of exchange (a depreciation of the Nuevo Sol).
Given that currencies are assets, their value can increase or decrease, thus exposing agents who hold foreign currency positions to exchange risks. Therefore, an exporter may reduce the exchange risk of this future incomes in foreign currency through a forward contract. Likewise, an investor holding foreign currency-denominated assets/liabilities may ensure the value of his portfolio -and therefore, the value of its profitability- through a forward sale.
Determination of the exchange rate
The spot exchange rate (for example, number of Nuevos Soles per dollar), the spread in interest rates (for example, the differential between interest rates in Nuevos Soles and interest rates in dollars), and the contract’s maturity term are considered to determine the exchange rate of forward contracts:
Fp = Sp x [ (1 + R S/.
) / (1 + R $ )] n/360
where: Fp = Forward exchange rate Sp = Spot exchange rate R
S/.= Interest rate in Nuevos Soles (effective annual rate)
R$ = Interest rate in dollars (effective annual rate)
n = maturity term
types of forwards
According to the modality used for the settlement of the operation, there are two types of forwards:
- Delivery forward: at the maturity of the contract, the buyer and the seller exchange currencies according to the exchange rate agreed upon (forward exchange rate).
- non delivery forward: at the maturity of the contract, the spot or market exchange rate is compared with the forwards
exchange rate, and the differential between these rates is paid by the corresponding party.
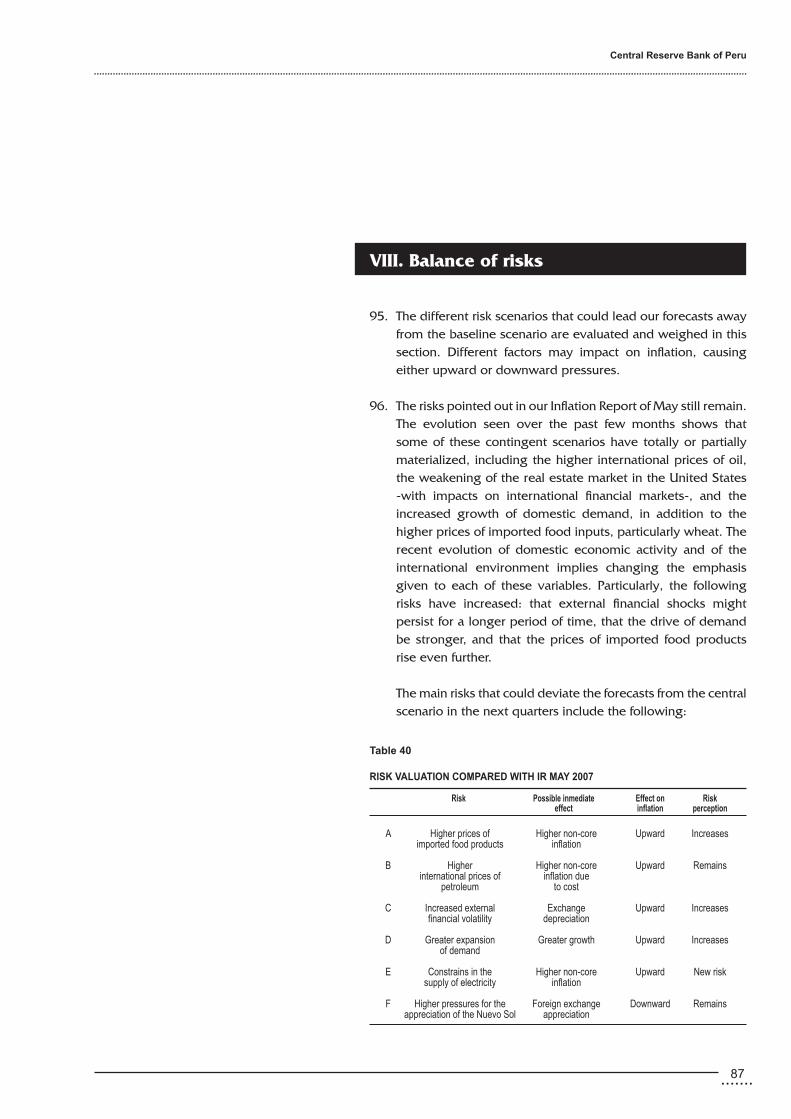
.......87
Central Reserve Bank of Peru
..................................................................................................................................................................................................................................................
VIII. Balance of risks
95. The different risk scenarios that could lead our forecasts away from the baseline scenario are evaluated and weighed in this section. Different factors may impact on inflation, causing either upward or downward pressures.
96. The risks pointed out in our Inflation Report of May still remain. The evolution seen over the past few months shows that some of these contingent scenarios have totally or partially materialized, including the higher international prices of oil, the weakening of the real estate market in the United States -with impacts on international financial markets-, and the increased growth of domestic demand, in addition to the higher prices of imported food inputs, particularly wheat. The recent evolution of domestic economic activity and of the international environment implies changing the emphasis given to each of these variables. Particularly, the following risks have increased: that external financial shocks might persist for a longer period of time, that the drive of demand be stronger, and that the prices of imported food products rise even further.
The main risks that could deviate the forecasts from the central scenario in the next quarters include the following:
table 40
RISK VALUAtIon CoMPAReD WItH IR MAY 2007 Risk Possible inmediate effect on Risk effect inflation perception
A Higher prices of Higher non-core upward Increases imported food products inflation
B Higher Higher non-core upward Remains international prices of inflation due petroleum to cost
C Increased external exchange upward Increases financial volatility depreciation d Greater expansion Greater growth upward Increases of demand
e Constrains in the Higher non-core upward New risk supply of electricity inflation
F Higher pressures for the Foreign exchange downward Remains appreciation of the Nuevo Sol appreciation

Inflation Report. September 2007
..................................................................................................................................................................................................................................................
88 .......
A. Higher prices of imported food products: the central scenario considers that the supply/demand imbalances of food commodities will decline along the forecast horizon. However, there is a risk that high prices might persist for a longer period of time or increase even further, should supply conditions deteriorate or should the demand for biofuels increase even more. This would cause the domestic prices of food products to increase.
In such a case, the BCRP would maintain its monetary policy stance as long as inflation expectations remain anchored to the inflation target.
B. Higher international prices of petroleum: The central forecast considers a partial reversal of the recent rises seen in the international prices of fuel. A scenario with higher upward volatility in the oil market would increase the price of fuel above the levels considered in the forecast scenario.
In the event of such a supply shock, the BCRP would only react if prices increased in a generalized and sustained manner, and if inflation expectations should shift towards levels that are not consistent with the inflation target.
C. Increased external financial volatility: The international environment remains favorable in the forecast horizon, with a gradual upward reversal in terms of trade, a transitory slowdown in the US economy, and with other countries, particularly Asia, growing at high rates. A situation of recession in the United States involving a severe correction in the prices of export commodities could imply, depending on the movement of external capitals in emerging economies, a depreciation of the Nuevo Sol and a downward impulse in the dynamism of our economy thereafter.
D. Greater expansion of demand: A higher growth of domestic demand would translate into an impulse on the components of inflation that are most sensitive to demand fluctuations. In this case, the Central Bank would raise the reference rate to keep inflation under control.
E. Constraints in the supply of electricity: This report considers the risk of experiencing constraints in the supply of electric energy by the end of the forecast horizon. This would have an adverse impact on the rates and costs of firms.
Should this occur, the BCRP would maintain its monetary policy stance as long as inflation expectations continue to be in line with the inflation target.
Graph 96FACTORS THAT CAN AFFECT THE INFLATION FORECAST1/
(Percent points of deviation from inflation 2 years forward)
0.10
0.06
0.02
-0.02
-0.06
-0.10Foreign
exchangepressures
Risk respect the base scenario1/ Shows the change in the risk perception between IR May.07 and the current report. The size and position of the bars shows the asymetry produced by each risk factor to the inflation forecast. Compared with the prior report, the total added effects produce an asymetry of 0.1 percent in the inflation forecast.
-0.10
0.10
0.06
0.02
-0.02
-0.06
-0.10
0.06
0.02
Balance of risk on an increase on the forecast of inflation
Balance of risk on an decrease on the forecast of inflation
0.10
0.02 0.010.02
0.00
0.05
0.010.00
0.02
-0.10Demand
stockOil
cuotationForeignfinancial
instability
Foodimports
cuotation
Weatherconditions
Constrainstsin the supplyof electricity
IR May.07 IR Sep.07
Asimetry
Diffe
renc
e bet
ween
the m
edian
and
the m
ode

.......89
Central Reserve Bank of Peru
..................................................................................................................................................................................................................................................
F. Higher pressures for the appreciation of the Nuevo Sol: In a scenario of increased appreciation of the Nuevo Sol which would pressure inflation downward below the inflation target, the Central Bank would maintain the current reference rate for a longer period of time or would reduce it.
Weighing the various risks of upward and downward pressures on inflation against the baseline scenario shows a slightly upward balance. As illustrated below in Graph 96, factors showing an upward trend outnumber those showing a downward trend, compared to the evolution discussed in our Inflation Report of May 2007.
97. This implies a forecast density with a slight upward asymmetry in the short- and medium-terms. The risk of higher pressures on inflation than those considered in the central scenario configurates the pattern of risks discussed in this report.
98. Finally, GDP growth is forecast to remain at similar levels.
CONCLUSION
99. Twelve-month inflation should start to converge towards the 2 percent target in 2008 and stabilize thereafter near the inflation target in the rest of the forecast horizon. This context of stable prices should continue to be coupled by a sustained growth of GDP at rates close to those of potential GDP. The different risk factors point to a slightly upward risk balance in the forecast of inflation.
100. The Central Reserve Bank of Peru (BCRP) fulfills its mission of preserving monetary stability through the implementation of monetary policy, which is based on an inflation targeting scheme. As of this year, the inflation target has been reduced from 2.5 to 2.0 percent, and compliance with this target is evaluated continuously.
In the event of any deviation of inflation from the target, the necessary measures are adopted in order that inflation returns to the target, taking into account the lags with which monetary policy operates.
Graph 97INFLATION FORECAST(Annual percentage change)
5.0
4.0
3.0
2.0
1.0
0.0
-1.0Dec.02 Dec.03 Dec.04 Dec.05 Dec.06 Dec.07 Dec.08 Dec.09
Note: The graph shows the inflation prediction bands along the forecast horizon. The darkest band around the central forecast represent a 10 percent probability of ocurrence, while all the other bands represent a 90 percent probability of ocurrence.
Graph 98GDP GROWTH FORECAST(Annual percentage change)
10.09.08.07.06.05.04.03.02.01.00.0
2002 2003 2004 2005 2006 2007 2008 2009
Note: The graph shows the inflation prediction bands along the forecast horizon. The darkest band around the central forecast represent a 10 percent probability of ocurrence, while all the other bands represent a 90 percent probability of ocurrence.
10.09.08.07.06.05.04.03.02.01.00.0
Range 30 percentRange 50 percent (include range 30 percent)Range 70 percent (include range 50 and 30 percent)Range 90 percent (include range 70. 50 and 30 percent)Central forecast
5.0
4.0
3.0
2.0
1.0
0.0
-1.0