inflation management in india
TRANSCRIPT

8/6/2019 Inflation Management in India
http://slidepdf.com/reader/full/inflation-management-in-india 1/25
INFLATION
MANAGEMENT ININDIA
SUBMITTED TO:

8/6/2019 Inflation Management in India
http://slidepdf.com/reader/full/inflation-management-in-india 2/25
INDEX:
INTRODUCTION
TYPES OF INFLATION
CALCULATION
CAUSES
EFFECTS OF INFLATION
INFLATION AND INDIA (IMPACT ON
INDIA)
MEASURES TO CONTROL INFLATION

8/6/2019 Inflation Management in India
http://slidepdf.com/reader/full/inflation-management-in-india 3/25
INTRODUCTION:
INFLATION: INFLATION CAN BE DEFINED AS THE GENERAL
TENDENCY FOR PRICES TO RISE AND A
DECLINE IN THE PURCHASING POWER OF
MONEY.
INFLATION NEEDS TO BE EXAMINED IN REAL
TERMS TO UNDERSTAND ITS ACTUAL IMPACT
UPON THE ECONOMY.
EXAMPLE: IF WAGES RISE BY 5% AND
INFLATION STANDS AT 6% THEN IN REAL
TERM WAGES HAVE FALLEN BY 1%.

8/6/2019 Inflation Management in India
http://slidepdf.com/reader/full/inflation-management-in-india 4/25

8/6/2019 Inflation Management in India
http://slidepdf.com/reader/full/inflation-management-in-india 5/25
INFLATION RATE:
THE INFLATION RATE IS THE PERCENTAGE BY WHICH PRICES OF GOOD AND SERVICES RISE
BEYOND THEIR AVERAGE LEVELS.
IT IS THE RATE BY WHICH THE PURCHASINGPOWER OF THE PEOPLE IN A PARTICULAR
GEOGRAPHY HAS DECLINED IN A SPECIFIED
PERIOD.
THE RATE OF INFLATION MAY BE CALCULATED
WEEKLY, MONTHLY, OR ANNUALLY.
HOWEVER , IT IS ALWAYS EXPRESSED AS AN
ANNUALIZED FIGURE.

8/6/2019 Inflation Management in India
http://slidepdf.com/reader/full/inflation-management-in-india 6/25

8/6/2019 Inflation Management in India
http://slidepdf.com/reader/full/inflation-management-in-india 7/25
TYPES OF INFLATION:
MODERATE INFLATIONMODERATE INFLATION
RUNNING INFLATIONRUNNING INFLATION
GALLOPING INFLATIONGALLOPING INFLATION
HYPER INFLATIONHYPER INFLATION

8/6/2019 Inflation Management in India
http://slidepdf.com/reader/full/inflation-management-in-india 8/25
MODRATE INFLATION:
IT OCCURS WHEN PRICES ARE RISEING
SLOWLY & WHEN RATE OF INFLATION IS
LESS THEN 10 % ANNUALLY OR IT IS A
SINGLE DIGIT INFLATION RATE.
WHEN THE PRICE IS MODRATE & IS IN THE
RANGE UP TO 2% IT IS CALLED CREEPING
INFLATION. AND WHEN IT IS IN THE RANGE
OF 4% TO 5% IT IS CALLED WALKING
INFLATION.

8/6/2019 Inflation Management in India
http://slidepdf.com/reader/full/inflation-management-in-india 9/25
RUNNING INFLATION:
WHEN PRICES RISE BY MORE THEN 10 % A
YEAR , RUNNING INFLATION OCCURS.
BUT , WE MAY SAY THAT A DOUBLE DIGITINFLATION OF 10-20 % PER ANNUM IS A
RUNNING INFLATION.

8/6/2019 Inflation Management in India
http://slidepdf.com/reader/full/inflation-management-in-india 10/25
GALLOPING INFLATION:
ACCORDING TO SAMUELSON , WHEN PRICES
ARE RISEING AT DOUBLE OR TRIPLE DIGIT
RATES OF 20 , 100 % OR 200% A YEAR , THE
SISTUATION IS DESCRIBED AS ¶GALLOPING
INFLATION·.
GALLOPING INFLATION IS REALLY A
SERIOUS PROBLEM. IT CAUSES ECONOMIC
DISTURBANCES.

8/6/2019 Inflation Management in India
http://slidepdf.com/reader/full/inflation-management-in-india 11/25
H YPER INFLATION:
IN HYPER INFLATION PRICE RISES EVERY
MOVEMENT , AND THERE IS NO LIMIT TO THE
HEIGHT TO WHICH PRICES MIGHT RISE.
IN QUANTITATIVE TERMS , WHEN PRICES RISE
OVER 1000 PER CENT IN A YEAR, IT IS CALLED
HYPER INFLATION.

8/6/2019 Inflation Management in India
http://slidepdf.com/reader/full/inflation-management-in-india 12/25
CAUSES OF INFLATION:
DEMAND PULL INFLATION:REFERS TO THE IDEA THAT THE ECONOMY
DEMANDS MORE GOODS AND SERVICES THAN
ARE AVAILABLE, ENABLING SELLERS TO RAISE
PRICES TILL EQUILIBRIUM IS PUT IN PLACE.
COST-PUSH THEORY OR SUPPLY SHOCK
INFLATION:
SHORTAGES IN THE AVAILABLE SUPPLY OF A CERTAIN GOOD WILL CREATE A RIPPLE
EFFECT THROUGH THE ECONOMY BY RAISING
PRICES THROUGH THE SUPPLY CHAIN FROM
THE PRODUCER TO THE CONSUMER.

8/6/2019 Inflation Management in India
http://slidepdf.com/reader/full/inflation-management-in-india 13/25
CONTROL OF MONEY SUPPLY BY CENTRAL
BANKS:
IF THE CENTRAL BANKS OF COUNTRIES DONOT CONTROL THE MONEY SUPPLY
ADEQUATELY, IT MAY ACTUALLY GROW AT A
RATE FASTER THAN THAT OF THE POTENTIAL
OUTPUT IN THE ECONOMY, LEADING TO
INFLATION.
ARTIFICIAL CREATION:
CAN BE ARTIFICIALLY CREATED THROUGH A
CIRCULAR INCREASE IN WAGE EARNERS
DEMANDS AND THEN THE SUBSEQUENT
INCREASE IN PRODUCER COSTS WHICH WILL
DRIVE UP THE PRICES OF THEIR GOODS AND
SERVICES.

8/6/2019 Inflation Management in India
http://slidepdf.com/reader/full/inflation-management-in-india 14/25
EFFECTS OF INFLATION:NEGATIVE EFFECTS:
DECREASE IN THE REAL VALUE OF MONEY OVER TIME.
DAMPENED INVESTMENT AND SAVINGS DUE TO
UNCERTAINTY OVER FUTURE INFLATION.
SHORTAGE OF GOODS IF CONSUMERS BEGIN
HOARDING FEARING FUTURE INCREASE IN PRICE.
CREATION OF IMBALANCES WHEN EXTEMES
ARISE IN THE SUPPLY/DEMAND STRUCTURE.
E.g.. THE MORTGAGE CRISIS OF 2007.
POSITIVE EFFECTS:
MITIGATION OF ECONOMIC RECESSIONS, AND
DEBT RELIEF BY REDUCING THE REAL LEVEL OF
DEBT.

8/6/2019 Inflation Management in India
http://slidepdf.com/reader/full/inflation-management-in-india 15/25
MEASURES TO CONTROL INFLATION:
THE SUPPLY SIDE:
� Increased production:
Agricultural production can be increased by
modernization, providing agricultural inputs at low prices.
Industrial production can be increased by increased FDI,
fiscal concessions, etc.
� Control of illegal activities:
Hoarding, smuggling, profiteering, black marketing, etc.
cause significant inflation in a country.

8/6/2019 Inflation Management in India
http://slidepdf.com/reader/full/inflation-management-in-india 16/25
� Peace and security:
Unease and insecurity in society can affect the production
and distribution of goods and services. Peace and security
must be ensured to maintain the supply of goods.� Main energy sources:
The supply of agricultural and industrial products is highly
dependent on energy availability. If the energy source is
expensive, the cost of production of goods and services will
be expensive too. Increased production costs raise prices
and cause inflation.

8/6/2019 Inflation Management in India
http://slidepdf.com/reader/full/inflation-management-in-india 17/25
THE DEMAND SIDE:
� Control of money supply:
Money supply in an economy can be controlled by various
tools such as bank rate policy, open market operations, reserve requirements, credit rationing, etc.
� No deficit financing:
Deficit financing shows that public spending is more than
income. The purpose of deficit financing is to meet the
additional costs that the budget deficit causes. As a result,
money supply increases and causes inflation. Thus, deficit
financing should be minimized and development costs
should be met through taxes and debt .

8/6/2019 Inflation Management in India
http://slidepdf.com/reader/full/inflation-management-in-india 18/25
� Population control:
In developing countries, the rate of population increases at
a faster pace than the production of goods and services.
This causes imbalance between supply and demand of goods and services, leading to inflation. Hence, population
must be controlled.
� Fiscal policy:
Fiscal policy refers to government spending and taxes.
During inflation, the govt. tries to reduce its expenditure on
unproductive activities and increases the direct tax rate so
that the purchasing power of the population is decreased.
8/6/2019 Inflation Management in India
http://slidepdf.com/reader/full/inflation-management-in-india 19/25
� Direct Measures:
The government also uses methods
like the rationing of goods,establishment of public service shops,
the price review committees, boards of
price stabilization, etc. to control
inflation.

8/6/2019 Inflation Management in India
http://slidepdf.com/reader/full/inflation-management-in-india 20/25
CALCULATION:
WPI CPI
Measure the temporal price change
of wholesale transactions of all
commodities in the country.
Measures the average price of
consumer goods and services
purchased by households.
The weights of items have been
assigned in proportion to their
share in the total value of
transaction (output) in the economy
Weights are assigned in proportion
to their share in the consumption
expenditure of the family of
industrial workers in the selected
centers
Measures inflation at each stage of
production
Measures inflation only at final
stage of production.

8/6/2019 Inflation Management in India
http://slidepdf.com/reader/full/inflation-management-in-india 21/25
INDIA OTHER
India, is amongst few countries of
the world, which selected WPI as
its official scale to measure the
inflation in the economy.
Most of the major economies like
US, UK, Japan, France, Singapore
and even our arch rival China have
selected CPI as its official
barometer to weigh its inflation
8/6/2019 Inflation Management in India
http://slidepdf.com/reader/full/inflation-management-in-india 22/25
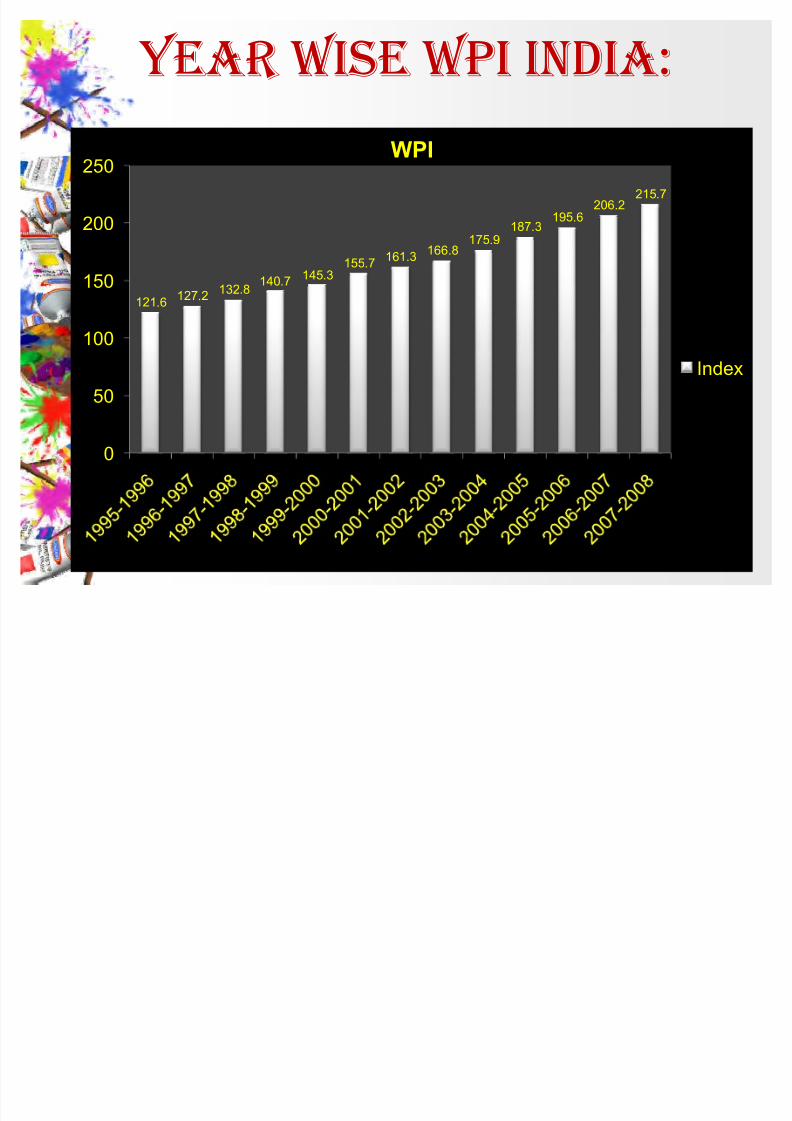
YEAR WISE WPI INDIA:
121.6127.2
132.8 140.7 145.3
155.7161.3
166.8175.9
187.3195.6
206.2215.7
0
50
100
150
200
250WPI
Index

8/6/2019 Inflation Management in India
http://slidepdf.com/reader/full/inflation-management-in-india 23/25
INFLATION 2009:
� In 2009 inflation fell below the target range due to thereversal of the supply shocks that affected the prices of
food, recording a rate of 0.25 percent in December.
� A reversal of the declining trend of inflation was observed
as from January, although inflation still remained below the
target range.
� Annualised inflation at February 2010 was 0.8 percent, a
rate explained by the higher prices of some foodstuffs and
fuels.

8/6/2019 Inflation Management in India
http://slidepdf.com/reader/full/inflation-management-in-india 24/25
INFLATION 2010: WPI IDEX INCREASED FROM 258.1 IN MAY ·10
TO 259.8 IN JUN·10. THIS IMPLIED INFLATIONFOR JUN ·10 AT 10.55% (YoY), LOWER THAN
MARKET EXPECTATIONS OF 10.8%.
FOR APRIL ·10, INFLATION WAS REVISEDUPWARDS FROM 9.59% TO 11.23%. ONCE AGAIN
INFLATION HAS BEEN REVISED UPWARDS
SIGNIFICANTLY. IN MAY-10 UPDATE, MARCH
2010 NUMBERS WERE REVISED UPWARDS FROM
9.9% TO 11.04%.

8/6/2019 Inflation Management in India
http://slidepdf.com/reader/full/inflation-management-in-india 25/25
WPI JUN -10
INFLATION
INDEX RATE OF
INFLATION
MAY-10 JUN-10 MAY-10 JUN-10
PRIMARY ARTICLES 299.9 302.1 16.61 16.28
FOOD ARTICLES 294.6 295.2 16.5 14.6
NON-FOOD ARTICLES 292.4 286.4 18.60 18.59
FUEL PRODUCTS 368.2 374.4 13.03 14.32
MANUFACTURING
PRODUCTS
219.1 219.5 6.41 6.66
WPI INFLATION 258.1 259.8 10.16 10.55
CORE INFLATION 111.3 111.8 6.58 7.29