inflation and unemployment - fraser€¦ · · 2013-10-10chapter 4 inflation and unemployment ......
TRANSCRIPT
CHAPTER 4
Inflation and Unemployment
THE HISTORY OF INFLATION during the past 10 years has beendominated by two major episodes. In each of them a series of events set
off a burst of inflation, followed by a period of economic slack during whichthe rate of price increase subsided only partially. The end result in both in-stances was a persistently higher rate of inflation. For the last 3 years, theunderlying rate of inflation has remained in the 6- to 6^-percent rangedespite very high rates of unemployment.
Since 1970 similar developments have characterized the economies ofother industrial nations. Throughout the industrial world, economic policyis now confronted with the simultaneous existence of substantial unemploy-ment and strong inflationary momentum.
It is not difficult to identify the sources of the two inflationary episodesduring the past decade, nor is it surprising that the resulting inflations wereserious, given the magnitude of the initiating forces. What does pose majorproblems for both economic theory and policy is the persistence of inflation:why it keeps its momentum long after the initial shocks have disappearedand in the face of idle plant and unemployed workers.
Over the next several years, even as recovery proceeds, some slack willremain in our economy. The central task in dealing with inflation in theperiod immediately ahead will be to find ways to reduce the persistenceof the inflation inherited from earlier years. Looking further ahead, a sec-ond major task will be to avoid a renewal of inflationary pressures or shocksas we regain a high-employment economy.
The two tasks are related. Unless we succeed in reducing the current rateof inherited inflation over the next several years—while some slack remainsin the economy—any tendency for price and wage increases to acceleratein later years will raise the inflation rate from an already high base. If thatshould occur, prospects for maintaining a stable rate of economic growthwith high employment would be endangered.
The problem of inflation amidst unemployment is dealt with here in threeparts. The first reviews the two inflationary episodes of the past 10 yearsand emphasizes the distinction between the initiation and the perpetuationof inflation. The second addresses the particular problem of the present and
138
Digitized for FRASER http://fraser.stlouisfed.org/ Federal Reserve Bank of St. Louis
the immediate future: the momentum of inflation inherited from the past.In doing so, it discusses the forces producing that momentum in the face ofeconomic slack, reviews alternative ways of reducing the inflation rate,points up the advantages and disadvantages associated with each alterna-tive, and outlines a "deceleration standard" for reducing inflation. Thethird part of the chapter looks farther ahead to the task of preventing therecurrence of renewed inflationary pressures as high employment is ap-proached, focusing on the role of structural employment policies to improvethe operation of the labor market and thus to reduce the inflationary pres-sures associated with an economy near capacity. This section also discussesthe need for rapid investment growth to avoid inflationary bottlenecks andscarcities as industrial capacity utilization increases.
A REVIEW OF THE PAST 10 YEARS
EPISODE I: EXCESS DEMAND IN THE LATE 1960s
The current inflation had its roots in the late 1960s. During this periodthe economy reached very high levels of employment and resource uti-lization. The unemployment rate was less than 4 percent in every yearfrom 1966 through 1969, when it reached 3.5 percent, the lowest ratesince the Korean war. The major factor initiating inflation was the tra-ditional one of excess demand. The economic stimulus from expenditures forthe Vietnam war was added to an economy already approaching highemployment. The rate of inflation in consumer prices rose from less than2 percent in 1965 to over 6 percent in 1969.
If the Vietnam war had been financed out of increased taxes, the eco-nomic consequences of the added war expenditures would have been lessserious. But the temporary increase in taxes in 1968 came well after strongdemand pressures had already triggered a significant acceleration in priceand wage inflation. Moreover when taxes were raised, monetary policy be-came more expansive for a brief period, offsetting some of the contractionaryimpact of the tax increase.
The 1970 Recession
The recession which began in late 1969 undid much of the reduction inunemployment that had been achieved over the prior decade, as the unem-ployment rate rose to 6 percent by the end of 1970. Yet inflation continuedat a rapid pace. The advance of consumer prices did slow, but much of thisreduction was due to the impact of declining mortgage interest rates on theconsumer price index (CPI). If mortgage interest is excluded, the consumerprice index showed little deceleration—from 5.7 percent in 1969 to slightlyover 5 percent in 1970 and the first half of 1971 (Table 19). The increase inaverage hourly earnings in the private nonfarm sector actually acceleratedduring this period.
139
Digitized for FRASER http://fraser.stlouisfed.org/ Federal Reserve Bank of St. Louis
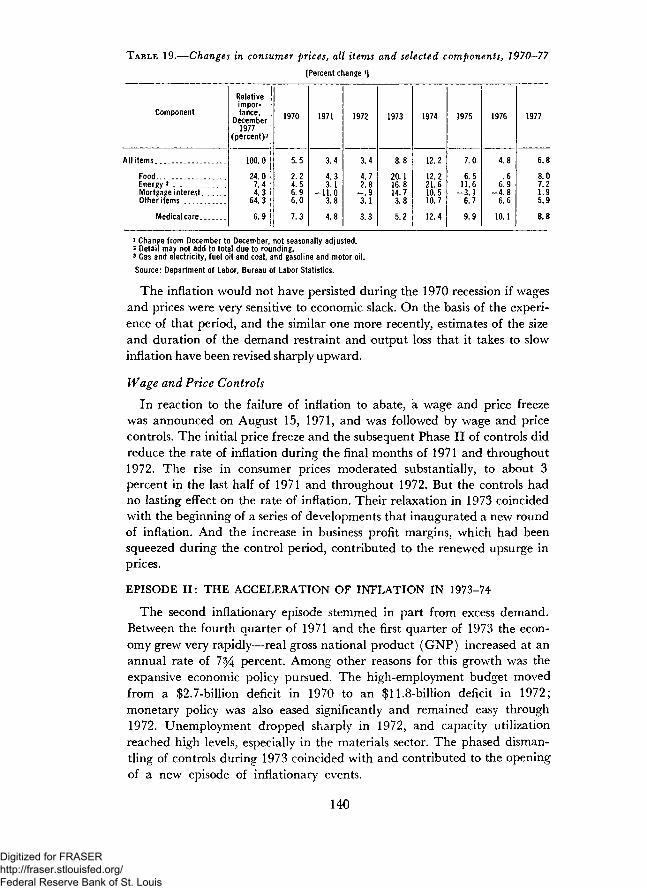
TABLE 19.—Changes in consumer prices} all items and selected components, 1970—77[Percent change 1]
Component
All items
FoodEnergy 3
Mortgage interest.Other items
Medical care
Relativeimpor-tance,
December1977
(percent)2
100 0
24 07.44.3
64.3
6.9
1970
5.5
2.24.56.96.0
7.3
1971
3 4
4 33.1
- 1 1 . 03.8
4.8
1972
3 4
4 72.8
- . 93.1
3.3
1973
8 8
20.116.814.73.8
5.2
1974
12 2
12 221.610.510.7
12.4
1975
7.0
6.511.6
- 3 . 16.7
9.9
1976
4.8
.66.9
- 4 . 86.6
10.1
1977
6.8
8.07.21.95.9
8.8
1 Change from December to December, not seasonally adjusted.2 Detail may not add to total due to rounding.3 Gas and electricity, fuel oil and coal, and gasoline and motor oil.
Source: Department of Labor, Bureau of Labor Statistics.
The inflation would not have persisted during the 1970 recession if wagesand prices were very sensitive to economic slack. On the basis of the experi-ence of that period, and the similar one more recently, estimates of the sizeand duration of the demand restraint and output loss that it takes to slowinflation have been revised sharply upward.
Wage and Price Controls
In reaction to the failure of inflation to abate, a wage and price freezewas announced on August 15, 1971, and was followed by wage and pricecontrols. The initial price freeze and the subsequent Phase II of controls didreduce the rate of inflation during the final months of 1971 and throughout1972. The rise in consumer prices moderated substantially, to about 3percent in the last half of 1971 and throughout 1972. But the controls hadno lasting effect on the rate of inflation. Their relaxation in 1973 coincidedwith the beginning of a series of developments that inaugurated a new roundof inflation. And the increase in business profit margins, which had beensqueezed during the control period, contributed to the renewed upsurge inprices.
EPISODE II: THE ACCELERATION OF INFLATION IN 1973-74
The second inflationary episode stemmed in part from excess demand.Between the fourth quarter of 1971 and the first quarter of 1973 the econ-omy grew very rapidly—real gross national product (GNP) increased at anannual rate of 7% percent. Among other reasons for this growth was theexpansive economic policy pursued. The high-employment budget movedfrom a $2.7-billion deficit in 1970 to an $11.8-billion deficit in 1972;monetary policy was also eased significantly and remained easy through1972. Unemployment dropped sharply in 1972, and capacity utilizationreached high levels, especially in the materials sector. The phased disman-tling of controls during 1973 coincided with and contributed to the openingof a new episode of inflationary events.
140
Digitized for FRASER http://fraser.stlouisfed.org/ Federal Reserve Bank of St. Louis
The major inflationary pressures in 1973 and 1974, however, were notcaused by domestic monetary and fiscal policy. The fall of over 20 percent inthe value of the U.S. dollar from mid-1971 to mid-1973 helped to cause arapid rise in exports. Demand for U.S. goods was also increased by the simul-taneous economic expansion in all industrial countries. The high operatingrates in the rest of the world accentuated the problem of tight domesticcapacity, as imports were not available to augment domestic supplies. Themost obvious result of this expansion was a rapid rise in prices of industrialcommodities. On world markets, prices of basic industrial commodities otherthan oil more than doubled between mid-1972 and mid-1974. Prices of inter-mediate products such as primary metals and chemicals also rose sharplyin response to worldwide demand.
Other special factors were also at work. Food prices surged in 1973and 1974 as a consequence of conditions that had been evolving slowly,but were brought into prominence by a series of poor world harvests begin-ning in 1972. The steep increase in oil prices put into effect by the Orga-nization of Petroleum Exporting Countries (OPEC) in late 1973 causedthe energy component of the CPI to rise by nearly 22 percent in 1974 alone;from the end of 1972 through 1975 it rose by nearly 60 percent.
Although each of these special events was sufficiently important to exert amarked impact on the overall price level, the dominant influence was therise in fuel and food prices. Its force was not limited to direct effects. Thepass-through of cost increases into other prices broadened the inflation, andthe rise in consumer prices led to efforts by wage earners to recover lost realincomes. The inflation in prices for consumer items other than food, energy,and mortgage interest accelerated from 3.1 percent in 1972 to 3.8 percent in1973 and to 10.7 percent in 1974. The rate of increase in hourly earningsremained relatively stable at around 6 to 7 percent until controls were re-moved in April 1974, but then rose sharply to .an annual rate of about 10 per-cent during the remainder of the year. While the rise played a part in spread-ing the initial shocks through the rest of the economy, it was less than theincrease in prices and represented a loss in real wages for workers.
The 1973-74 experience provided vivid evidence of the potential infla-tionary effects of factors other than aggregate demand pressures. It was, aswell, an example of the effects of the downward insensitivity of prices andwages. Price increases in one sector exerted upward pressures in others,rather than leading to a readjustment of relative prices around a stableoverall rate of inflation.
THE CURRENT SITUATIONInflation has moderated substantially from the 12-percent rate of 1974.
Improved weather and agricultural production reduced prices of agricul-tural products at the farm. Despite higher processing costs, the rise in retailfood prices during 1976 was limited to less than 1 percent. Energy prices areno longer rising at the extreme rates of earlier years. The rapid growth inprices of other materials has also moderated.
141
248-947 O - 78 - 10
Digitized for FRASER http://fraser.stlouisfed.org/ Federal Reserve Bank of St. Louis
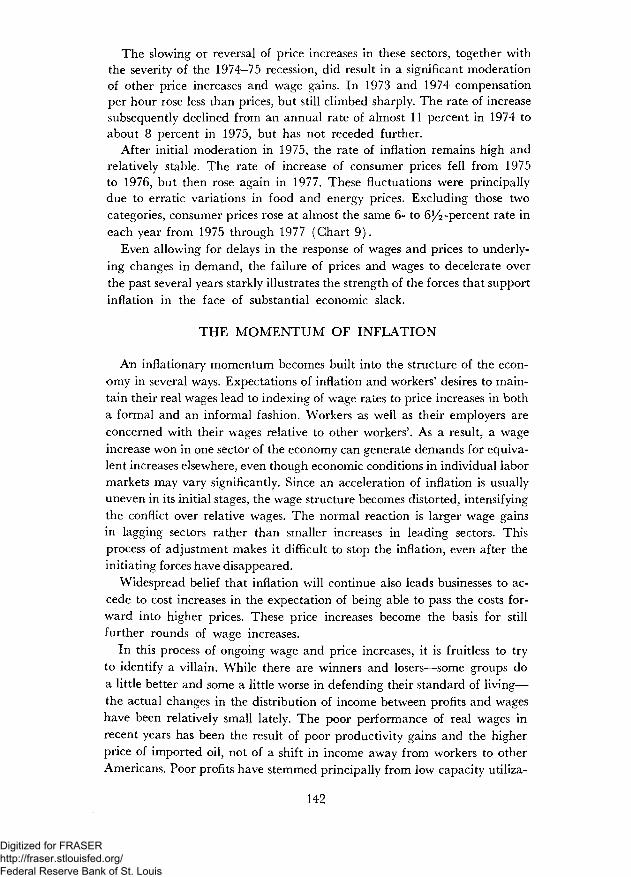
The slowing or reversal of price increases in these sectors, together withthe severity of the 1974—75 recession, did result in a significant moderationof other price increases and wage gains. In 1973 and 1974 compensationper hour rose less than prices, but still climbed sharply. The rate of increasesubsequently declined from an annual rate of almost 11 percent in 1974 toabout 8 percent in 1975, but has not receded further.
After initial moderation in 1975, the rate of inflation remains high andrelatively stable. The rate of increase of consumer prices fell from 1975to 1976, but then rose again in 1977. These fluctuations were principallydue to erratic variations in food and energy prices. Excluding those twocategories, consumer prices rose at almost the same 6- to 6 J/i-percent rate ineach year from 1975 through 1977 (Chart 9).
Even allowing for delays in the response of wages and prices to underly-ing changes in demand, the failure of prices and wages to decelerate overthe past several years starkly illustrates the strength of the forces that supportinflation in the face of substantial economic slack.
THE MOMENTUM OF INFLATION
An inflationary momentum becomes built into the structure of the econ-omy in several ways. Expectations of inflation and workers' desires to main-tain their real wages lead to indexing of wage rates to price increases in botha formal and an informal fashion. Workers as well as their employers areconcerned with their wages relative to other workers'. As a result, a wageincrease won in one sector of the economy can generate demands for equiva-lent increases elsewhere, even though economic conditions in individual labormarkets may vary significantly. Since an acceleration of inflation is usuallyuneven in its initial stages, the wage structure becomes distorted, intensifyingthe conflict over relative wages. The normal reaction is larger wage gainsin lagging sectors rather than smaller increases in leading sectors. Thisprocess of adjustment makes it difficult to stop the inflation, even after theinitiating forces have disappeared.
Widespread belief that inflation will continue also leads businesses to ac-cede to cost increases in the expectation of being able to pass the costs for-ward into higher prices. These price increases become the basis for stillfurther rounds of wage increases.
In this process of ongoing wage and price increases, it is fruitless to tryto identify a villain. While there are winners and losers—some groups doa little better and some a little worse in defending their standard of living—the actual changes in the distribution of income between profits and wageshave been relatively small lately. The poor performance of real wages inrecent years has been the result of poor productivity gains and the higherprice of imported oil, not of a shift in income away from workers to otherAmericans. Poor profits have stemmed principally from low capacity utiliza-
142
Digitized for FRASER http://fraser.stlouisfed.org/ Federal Reserve Bank of St. Louis

Chart 9
Price and Wage TrendsPERCENT CHANGE, END OF YEAR TO END OF YEAR
_ CONSUMER PRICES-ALL ITEMSJ/
1966 1968 1970 1972 1974 1976
CONSUMER PRICES-ALL ITEMS LESS FOOD AND ENERGY /
5 -
1966 1968 1970 1972 1974 1976
20 -
15 -
10 -
COMPENSATION PER HOUR^(PRIVATE NONFARM BUSINESS)
1H I
m
1966 1968 1970 1972 1974J/CHANGE FROM DECEMBER TO DECEMBER, NOT SEASONALLY ADJUSTED.
-^CHANGE FROM FOURTH QUARTER TO FOURTH QUARTER, SEASONALLY ADJUSTED.
SOURCE: DEPARTMENT OF LABOR.
1976
143
Digitized for FRASER http://fraser.stlouisfed.org/ Federal Reserve Bank of St. Louis
tion and higher energy costs rather than from the pressure of wages onprices. The principal result of the struggle to defend living standards hasbeen continued inflation.
Some of the factors that explain the inflexibility of prices and wages in theface of slack demand can be identified. Complex technology, specializa-tion, and economies of scale have limited price competition in manyindividual markets. Price reductions are not seen as a means of sustainingrevenues and profits during periods of decline in the total market, since eachfirm perceives that its competitors will match any price cuts. Competitiontends to concentrate on other strategies than pricing: quality adjustment, forexample, and the introduction of new products. The responsiveness of supplyto changing demands is also reduced by the importance of fixed costs inmany industries; decisions to expand capacity or enter into new markets mustbe based on long-term considerations rather than on more immediatechanges in market conditions. The cost of entry into many major industriesby new firms is often great enough to allow some pricing discretion by thosealready there.
The existence of formal escalator clauses tends both to increase the speedwith which an inflation spreads through the economy and to perpetuate theinflation when it becomes established. In 1970 only one-fourth of workerscovered by major collective bargaining agreements were protected bycost-of-living clauses; today 60 percent are (although virtually none of theseclauses provide an automatic full escalation of wages to prior inflation).Many employers whose unions have escalator clauses extend the same pro-tection to their nonunion employees. And employers without such escalatorsface strong pressures to grant wage rate increases that protect workersagainst inflation to maintain morale and productivity.
The structure of labor markets in modern industrial societies differssignificantly from simple models of competitive behavior. Workers do notcompete freely for all jobs. Some are denied the most attractive opportu-nities because of discrimination. Unemployment rates show a wide disper-sion among different subgroups of the population, and the search for jobs bysome workers does not fully restrain wage increases of others. Entry into themost attractive job markets is also sometimes limited by rules and practicesthat have often been successful in preventing increases in overall unemploy-ment from putting downward pressures on rates of increase of wages orprofessional fees. Many firms, because of their interest in maintaining astable, high-quality labor force, base wage policy on longer-term considera-tions. Wage rates are often determined by what is considered equitable,and prices are often set on the basis of traditional markups over cost,rather than being based on short-run demand and supply conditions inindividual labor and product markets.
These characteristics of wage and price determination have been withus for a long time. Several recent developments, however, may have made thesetting of wages and prices even less flexible. The cost of doing business has
144
Digitized for FRASER http://fraser.stlouisfed.org/ Federal Reserve Bank of St. Louis
been steadily increased, in good times and bad, by regulations designed tomeet objectives such as clean air and water and improved health and safetyof consumers and workers. Another factor may have been the substantialgrowth of the noncompetitive sector of the economy. This sector (govern-ment and nonprofit establishments) represents about 26 percent of totalemployment today as against less than 20 percent in 1960. Although employ-ment in the regulated industries whose prices are sheltered to a large degreefrom competitive forces—electric and gas utilities, communications, and mostforms of commercial transportation—has not grown as rapidly, wage andprice behavior in this sector also differs importantly from the competitivemodel. By 1977 the government, regulated, and nonprofit sectors togetheraccounted for 31 percent of total employment.
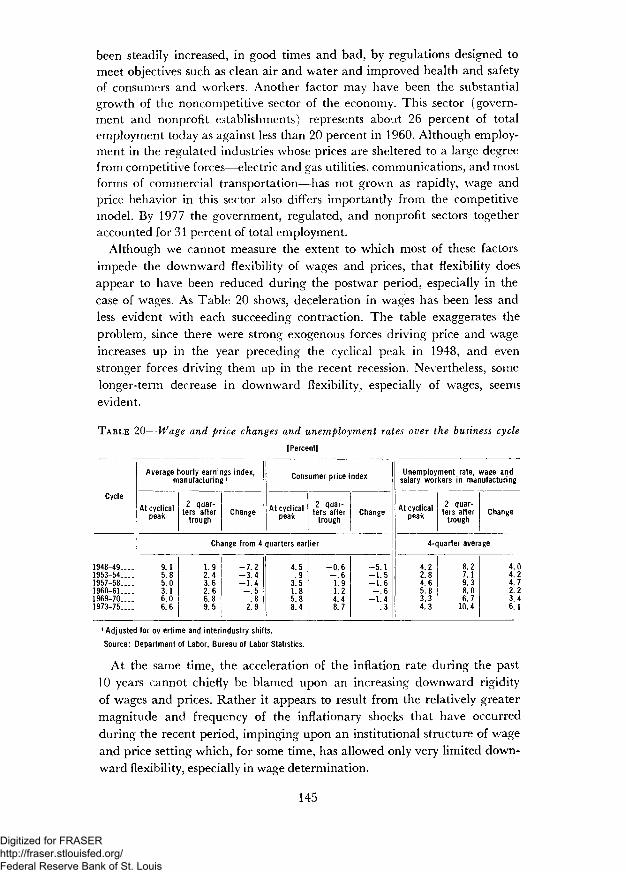
Although we cannot measure the extent to which most of these factorsimpede the downward flexibility of wages and prices, that flexibility doesappear to have been reduced during the postwar period, especially in thecase of wages. As Table 20 shows, deceleration in wages has been less andless evident with each succeeding contraction. The table exaggerates theproblem, since there were strong exogenous forces driving price and wageincreases up in the year preceding the cyclical peak in 1948, and evenstronger forces driving them up in the recent recession. Nevertheless, somelonger-term decrease in downward flexibility, especially of wages, seemsevident.
TABLE 20—Wage and price changes and unemployment rates over the business cycle
[Percent!
Cycle
1948-49....1953-54....1957-58....1960-61 — .1969-70....1973-75....
Average hourly earnings index,manufacturing1
At cyclicalpeak
2 quar-ters after
troughChange
Consumer price index
At cyclicalpeak
2 quar-ters after
troughChange
Change from 4 quarters earlier
9.15.85.03.16.06.6
I
1.92.43.62.66.89.5
-7 .2-3 .4-1 .4- . 5
.82.9
4.5.9
3.51.85.88.4
-0 .6- . 61.91.24.48.7
- 5 . 1-1 .5-1 .6- . 6
-1 .4.3
Unemployment rate, wage andsalary workers in manufacturing
At cyclicalpeak
2 quar-ters after
troughChange
4-quarter average
4.22.84.65.83.34.3
8.27.19.38.06.7
10.4
4.04.24.72.23.46.1
1 Adjusted for ov ertime and interindustry shifts.
Source: Department of Labor, Bureau of Labor Statistics.
At the same time, the acceleration of the inflation rate during the past10 years cannot chiefly be blamed upon an increasing downward rigidityof wages and prices. Rather it appears to result from the relatively greatermagnitude and frequency of the inflationary shocks that have occurredduring the recent period, impinging upon an institutional structure of wageand price setting which, for some time, has allowed only very limited down-ward flexibility, especially in wage determination.
145
Digitized for FRASER http://fraser.stlouisfed.org/ Federal Reserve Bank of St. Louis
OTHER FACTORS AFFECTING THE CURRENT INFLATION
Among the factors contributing to the high inflation rates of the last decadeare changes in the behavior of labor productivity, basic material costs, andprice-cost margins.
Productivity
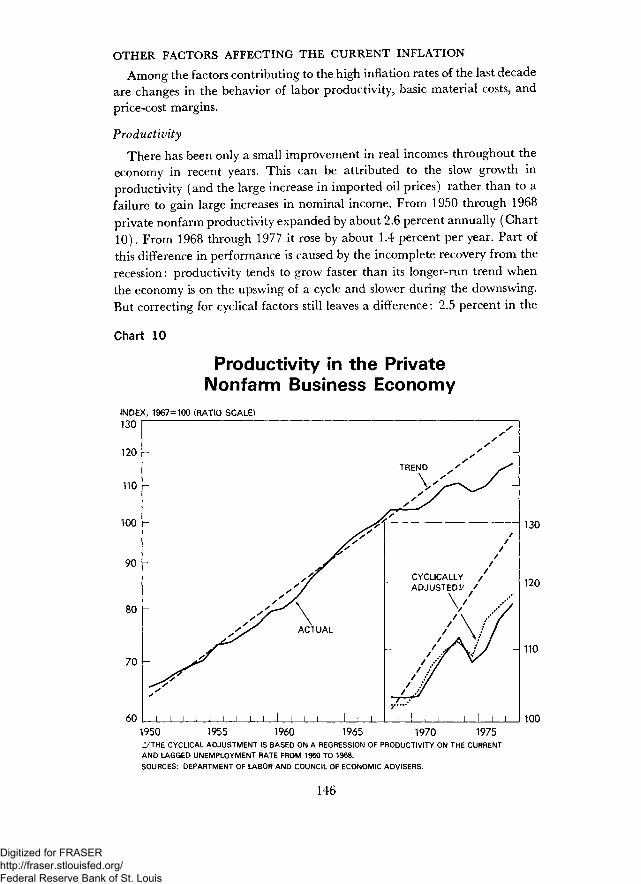
There has been only a small improvement in real incomes throughout theeconomy in recent years. This can be attributed to the slow growth inproductivity (and the large increase in imported oil prices) rather than to afailure to gain large increases in nominal income. From 1950 through 1968private nonfarm productivity expanded by about 2.6 percent annually (Chart10). From 1968 through 1977 it rose by about 1.4 percent per year. Part ofthis difference in performance is caused by the incomplete recovery from therecession: productivity tends to grow faster than its longer-run trend whenthe economy is on the upswing of a cycle and slower during the downswing.But correcting for cyclical factors still leaves a difference: 2.5 percent in the
Chart 10
Productivity in the PrivateNonfarm Business Economy
INDEX, 1967=100 (RATIO SCALE)
130
120
110
100
90
80
70
60
-
i i
- *
i i I I I !
/
<
ACTUAL
I I I I I I I
yy
y
TREND / y
/
/CYCLICALLY /ADJUSTED^ /
\ / / /
/\ff///^
I I I i I I I I I
130
- 120
- 110
1001950 1955 1960 1965 1970 19752/THE CYCLICAL ADJUSTMENT IS BASED ON A REGRESSION OF PRODUCTIVITY ON THE CURRENT
AND LAGGED UNEMPLOYMENT RATE FROM 1950 TO 1968.
SOURCES: DEPARTMENT OF LABOR AND COUNCIL OF ECONOMIC ADVISERS.
146
Digitized for FRASER http://fraser.stlouisfed.org/ Federal Reserve Bank of St. Louis

earlier period against 1.6 percent in recent years. This slowdown is one ofthe most significant economic problems of recent years. Gains in real livingstandards must come primarily from improved productivity. Without gainsin productivity, improvement in real incomes for some Americans can comeonly at the expense of others.
In the short run, rapid productivity growth also helps to contain inflation.To the extent that nominal wage gains are determined by the inertia andexpectations discussed earlier, productivity growth provides a marginbetween rising money wages and unit labor costs and thus contributes tolower inflation rates. The substantial growth in productivity was a majorfactor in the stable price environment of the 1950s and 1960s. A continuationof the slower growth in productivity that has prevailed since 1968 wouldimply a very stringent limitation on real income growth. It would alsoincrease the difficulty of achieving moderation in the inflation rate.
The causes of the apparent decline in the rate of productivity growth arevaried and their effects hard to quantify. Some of the decline may resultfrom the gradual adjustment of the economy to higher energy prices, asmore costly resources are substituted for previously cheap energy inputs.But this explanation cannot account for the slower growth before 1974.There is, of course, no reason why productivity should follow a constantupward trend. Since its growth represents the combined effects of techno-logical innovations, changes in skills and education of the work force, im-provements in organizational techniques, and a host of other factors,changing patterns should be expected.
The change in the demographic composition of the labor force has alsobeen proposed as an explanation of the slow growth of productivity in recentyears. The rise in the proportion of women and younger workers has beena factor in the rise of the unemployment rate, and it might be natural toattribute some slowing of productivity growth to the same phenomenon. Butthe facts do not support this conclusion. What is important for the growthof productivity is not the share of a particular group in employment, but thegrowth of that share. Although the percentages of younger workers and ofwomen in total employment have been growing since 1968, the percentageswere also growing before 1968. The percentage of younger workers (aged16 to 24) grew by 0.4 percent a year from 1955 to 1968, and at the samerate since 1968. The growth of the percentage of women in total employ-ment has also remained virtually unchanged, at 0.4 percent. Since theseincreases have been stable, they cannot have accounted for any significantreduction in the growth rate of productivity.
A more promising explanation may be the behavior of the capital stock.From 1947 to 1968 the capital-labor force ratio grew at .an annual rate ofabout 3 percent. Since then it appears to have grown more slowly, by about1 percent a year. If one adjusts for the proportion of capital required to meetpollution abatement and safety regulations, the capital-labor ratio would
147
Digitized for FRASER http://fraser.stlouisfed.org/ Federal Reserve Bank of St. Louis
show even less growth. This apparently explains at least some of the slowergrowth in productivity since 1968.
The accelerated introduction of governmental regulations dealing withenvironment, health, and safety may also have been responsible for some ofthe slowdown in official measures of productivity growth. To the extent thatadditional resources are devoted to specific identifiable activities required tomeet environmental, safety, and other social regulations, the effects on pro-ductivity are, at least conceptually, measurable. But much of the effect mayhave come indirectly, through increased limitations on the choice of sitesand raw materials, delays in construction, and constraints on productionprocesses. The effect of these is virtually impossible to quantify. Increasedregulation has undoubtedly had an impact, but its magnitude remains amatter of conjecture. Insofar as these programs result in improvements inpublic well-being, we may simply have taken part of our productivity gainsin forms that are not measured in GNP.
Much of the low recent growth in productivity may come from theeffect the extreme instability of the economy since 1968 has had on invest-ment. Sustained balanced growth may make a substantial contributiontoward restoring a more rapid growth of investment, and thus of produc-tivity.
Profit Margins
Firms seemed to absorb part of their cost increases during the late 1960sand the early 1970s, rather than passing them on fully to purchasers. Con-sequently profit margins declined substantially. Profit margins, adjusted forthe effects of inflation, have improved since 1974, however, and appear to beclose to their post-World War II average when allowance is made for capacityutilization. (See Chapter 1.) This situation does not characterize all indus-tries, of course, and some movements in prices relative to costs will take place.But as far as the economy as a whole is concerned, attempts to increase profitmargins by increases in prices relative to costs should not seriously affectinflation in the near future.
Costs of Materials
From the end of the Korean war until the late 1960s the prices of rawmaterials declined relative to the general price level. This was an importantfactor in moderating inflation during this period. The decline was due to avariety of factors, including a large overhang of excess processing and miningcapacity, the discovery of large low-cost oil fields abroad, expansion of capac-ity in foreign countries, major technological improvements in agriculture andmining, ,a more extensive global search for raw materials, and a major reduc-tion in overseas transport charges. For example, yields per acre of corn in theUnited States increased by 125 percent from 1950 to 1969, largely becauseof improved hybrid seeds, better fertilization and pest control, and improvedcultural practices.
148
Digitized for FRASER http://fraser.stlouisfed.org/ Federal Reserve Bank of St. Louis

This downward trend in relative prices of materials came to an abruptend in 1973. In that year alone raw materials prices rose 40 percent. Thisexplosive rise can be attributed to lagging growth of capacity during prioryears, a series of crop failures in several areas of the world, the enormousgrowth in demand created by the simultaneous economic expansion in theindustrial countries, the development of speculation and a "shortage mental-ity," and above all the actions of OPEC. This explosion appears to haveended. Although there is no reason to believe that prices of raw materialswill climb as abruptly in the near future as they did in 1972-74, neithershould one expect them to decline relative to other prices, as they did priorto 1970.
Government Policies
Government policies directly affect the price level. The most obviousexamples are increases in sales or payroll taxes, since they add to prices andcosts. A rise of 1 percentage point in the sales tax rate shows up fairly directlyin prices. Changes in payroll taxes have a similar effect by raising labor costs,which are then passed on in higher prices. The employer's share of socialinsurance contributions (including social security and unemployment insur-ance) has risen from only 2.7 percent of total employee compensation in1950 to over 6.8 percent in 1977, and to over 7 percent in 1978, when higherunemployment insurance and social security taxes take effect.
The government may also add to prices through other forms of legisla-tion or through regulation. A change in the minimum wage law is an ex-ample. Mandating an increase in the wage paid by the employer raises thecost of production and increases prices. Expenditures that are required tomeet environmental and safety regulations add to costs. The environmentalbenefits or added safety may be well worth the resources devoted to them,but the rate of inflation is affected. Government regulations may also havean unfavorable effect on prices by restricting competition. When interna-tional competition is restricted through tariffs or quotas, domestic producersare able to raise their prices. Domestic competition is also restricted byvarious regulatory agencies that set uniform rates and hamper the entryof new firms. Some of these issues are discussed further in Chapter 5.
GROWTH AND INFLATION
In the traditional view, the cure for inflation is a dose of fiscal and mone-tary restraint designed to reduce aggregate demand and thereby eliminatethe conditions generating the inflation. When inflation is being fed by excessdemand—tight labor markets and intensive use of industrial capacity—elimination of that excess is indeed a prerequisite to controlling inflation andpreventing it from accelerating further. Moreover, if the rate of increase inwages and prices responded readily to excess supply, a reduction in demandsufficient to produce a modest and short-lived amount of economic slack
149
Digitized for FRASER http://fraser.stlouisfed.org/ Federal Reserve Bank of St. Louis

would eliminate the inflation quickly. As we have seen, however, the essenceof the present inflation problem is that the rate of wage and price increasereacts very slowly to idle resources and excess supply. Given this fact, anattempt to purge inflation from the system by sharp restrictions on demandwould require a long period of very high unemployment and low utiliza-tion of capacity.
Most current estimates of the reaction of inflation to economic conditionsindicate that a continuation of the current degree of slack (an unemploy-ment rate near 6^2 percent) would reduce inflation by amounts that at theupper end of the range are no more than one-half percentage point a year. Inthe absence of future inflationary shocks (for example, a rise in worldmaterials prices), it would take at least 6 years of the current degree ofeconomic slack to cut the inflation rate from 6 to 3 percent. To achieve thesame results in less time would require even higher unemployment rates.
Not only would this policy entail a prolonged effort, it would also be ex-tremely expensive in terms of lost output. Maintaining the current level ofeconomic slack means producing approximately $100 billion a year lessthan the potential output of the economy.
To cut the current inflation rate in half, the lost output would amount toat least $600 billion (at 1977 prices). Moreover, to the extent that sucha policy kept the rate of investment low, any attempt to restore highemployment promptly, after the slack had disappeared, would probablysoon encounter inflationary shortages of plant capacity.
USING THE TAX SYSTEM TO REDUCE THE MOMENTUM OF INFLATION
Various proposals have been offered in recent years to utilize changesin taxes to influence wage and price behavior directly. One set of proposalsinvolves an attempt to break the momentum of the current inflation throughone-time reductions in sales taxes or employer payroll taxes. Since thepersistence of inflation during periods of economic slack stems partly fromthe sequence in which price increases induce wage increases that inducestill further price increases, even a one-shot slowdown in the rate of priceincrease might halt the momentum and start unwinding the spiral.
The Federal Government has no general sales tax. It does have a seriesof specific excise taxes. Eliminating those on alcohol and tobacco hardlyseems an appropriate measure to combat inflation, if only because the initialimpact would be so unevenly distributed across the population. Most of theother excise taxes are earmarked for particular purposes, such as the high-way and airport trust funds. The only sizable excise that remains, the taxon telephone service, is marked for elimination in fiscal 1979 under thePresident's proposed tax program.
State governments are the principal units that levy general sales taxes.Conceivably, the Federal Government could make grants to the Statesconditioned on their using the funds to reduce sales taxes. Serious prob-
150
Digitized for FRASER http://fraser.stlouisfed.org/ Federal Reserve Bank of St. Louis

lems of equity and administration must be solved before such an approachcould be made to work. Five States have no sales tax. The taxable basevaries widely among the States—some, for example, include food whileothers do not. Unless the grants were permanent, their cutoff could lead toa sudden return of sales tax rates to higher levels with the consequent addi-tion to inflation. And even if the grants were continued indefinitely, the Statescould hardly be asked never to raise sales taxes once they had been lowered.
Payroll taxes are levied by the Federal Government, and the receiptsflow into several trust funds to pay for various social insurance programs.That part of the taxes that is levied on employers is a direct additionto payroll costs and tends to be passed on in the form of higher prices.
Reducing employer payroll taxes would lead to a one-time reductionin costs and prices. The President has proposed, as a modest step in thisdirection, reducing the Federal portion of the unemployment insurance taxfrom 0.7 to 0.5 percent of covered payrolls. This reduction would lower taxliability by $800 million per year. But a cut large enough to produce a sig-nificant reduction in costs and prices would require a substantial change innational policy with respect to large-scale general revenue financing of thesocial insurance trust funds. While such a change in national policy mightindeed be worth considering, it cannot be made without lengthy debate andappraisal encompassing far more than its merits as an anti-inflation tool.
One-time reductions in sales or payroll taxes to combat inflation needcareful evaluation with respect not only to their administrative and relatedaspects, but also to their efficacy as anti-inflation measures. Roughly speak-ing, a $15- to $18-billion permanent reduction in sales taxes or payroll taxeswould be needed to reduce the level of costs and prices by 1 percent. Wouldsuch a one-time reduction be enough to turn the momentum of inflationdownward? That is, would the secondary effects—the effect of lower pricesin slowing wage increases that in turn lead to still smaller price increases—be sufficient to affect the rate of inflation during subsequent periods? Inpart the answer would depend on what happened to expectations aboutfuture price and wage increases. No answer can be made with confidence,however, so long as we cannot quantify the strength of the various mecha-nisms that perpetuate inflation.
Another quite different set of proposals would use taxes as an incentivefor workers and business firms to moderate wrage and price increases. Inone variant the government would levy a special tax upon wage increasesin excess of some standard, and—in some versions—upon increases in price-cost margins of business firms. In another variant, instead of levying a taxincrease, the government would offer a tax reduction to firms and groupsof workers whose wage increases were held at or below the standard.Given the recent history of inflation, the chosen standard would not beexpected to result in an immediate return to price stability, but would besufficiently far below recent increases in wages to produce a significant decel-
151
Digitized for FRASER http://fraser.stlouisfed.org/ Federal Reserve Bank of St. Louis

eration in inflation. To continue the deceleration the tax (or subsidy) couldbe repeated, at least for a few years, with a lower standard each year.
Significant administrative problems are obviously entailed in any suchproposal. How are wage rates (and fringe benefits) to be measured? Whatabout multiyear union contracts, with low increases in the first year to avoidthe tax or reap the subsidy, followed by large increases in the second year?Important economic questions also arise. Would a tax on the wage increasesthat are considered excessive simply be passed along by firms with substantialmarket power and strong unions and thus actually increase inflation? (Thetax reduction variant would not suffer from this particular problem.) Ifcarried on for a number of years, such measures could place a penalty onneeded changes in relative wages and prices and could impede therestoration of equitable wage relationships for those who had been laggingin the adjustment to inflation. If imposed for only 1 year, they might not besufficiently effective to break the momentum of inflation. And from thestandpoint of labor and management, such measures might be viewed asgiving the Internal Revenue Service some of the characteristics of a separatewage and price control agency.
It is not difficult to find administrative and equity problems and to raiseunanswered questions about all these proposals. They are relatively noveland have not been fully evaluated or widely discussed. It would be impru-dent to propose introducing any of them on a major scale before subject-ing them to a much more complete evaluation and wider discussion withrespect to their economic effectiveness, administrative feasibility, and socialequity. On the other hand, the momentum of inflation is so strong,and the consequences of either allowing it to continue or trying towring it out with excessively slow economic growth are so serious, that theyshould not be dismissed out of hand. Further economic evaluation and amuch broader public debate would be very healthy, whatever its outcome.
A DECELERATION STRATEGY
While the forces at work in the economy are not likely to produce anacceleration of inflation in the next year or two, neither are they likely tolead to a deceleration. Supplies of labor and industrial capacity will beample, but unemployment and excess capacity will be less than in the past2 years, during which the underlying inflation rate did not diminishsignificantly. Bringing inflation down gradually in the next several yearswill clearly require a special effort.
If inflation is to decelerate, reliance cannot be placed on sharply lowerprice increases in one or two markets. The acceleration of inflation has beenpervasive across all major sectors of the economy. Significant variations inrates of price increase have occurred among the various sectors—reflectingdifferences in productivity growth rates and underlying cost trends. But all
152
Digitized for FRASER http://fraser.stlouisfed.org/ Federal Reserve Bank of St. Louis

of the major components of the consumer price index have experienced alarge rise in the rate of increase since the early 1960s.
Progress in moderating overall inflation must involve deceleration ofwages and prices simultaneously. To bring this process about the Presidenthas asked business and labor to undertake voluntarily a program of priceand wage deceleration.
This new program starts from the presumption that significant decelera-tion should be achieved in each market. Individual industries are asked toaim in 1978 at smaller price and wage increases than the average for thepast 2 years. The amount of deceleration that can be achieved will varyfrom situation to situation, however, because individual industries facedifferent circumstances. The accumulated experience of the recent past—high unemployment and sharp inflation—has distorted the structure ofwages, prices, and profits compared to what they would have been in aperiod of price stability. Deceleration must be widespread, but allowancesmust be made for variations in the degree of moderation.
On the wage side, there has been a wide dispersion of wage rate increasesin recent years. In those sectors of the economy characterized by large enter-prises and union organizations, rates of increase in wages and private fringestypically have been in the range of 8 to 9 percent annually, with littlechange since 1975. On the other hand, the high level of unemployment hashad a moderating influence on wage settlements in more fragmented labormarkets composed of smaller firms, smaller unions, and unorganized labor.As a consequence, there has been a significant widening of wage rate differ-entials among groups in the labor force.
These wage differentials would under normal circumstances result inlarger wage increases in the more competitive labor markets and a gradualnarrowing of these wage differences. But such an outcome would imply ahigher overall rate of wage inflation. Thus, an equitable effort to moderatethe average rate of wage increase must be based on a greater degree of decel-eration by those who have received the largest increases in recent years.There may be very special situations in which wage gains have lagged sofar behind the rest of the economy that deceleration is not possible.
Some guidance in analyzing recent shifts in the wage structure can beobtained from an examination of historical trends in relative wages. Butvariations in the wage structure should be expected in response to evolvingmarket conditions. Such changes in the structure will be associated withskill changes, locational shifts of firms, changes in productivity trends, andother factors that affect the competitive position of a specific industry.Deceleration in the rate of price inflation will contribute to moderation of theincrease in employment costs directly through cost-of-living adjustments inwage contracts and indirectly through its effect on wrage bargains. However,more than a passive response is needed to achieve significant deceleration ofwage increases.
153
Digitized for FRASER http://fraser.stlouisfed.org/ Federal Reserve Bank of St. Louis

On the price side, there are similar reasons why a uniform degree of pricedeceleration is not feasible. Firms that previously had lowered their price-cost margins in response to slack demand must restore them to more normallevels as the economic recovery continues. But in those cases where profitshave declined primarily in response to a low level of sales and capacityutilization, improvements in profits should come from higher volume ratherthan increased prices. The degree of price deceleration that is achievable inindividual situations also will be affected by variations in raw material prices,by costs mandated by government—for example, changes in payroll taxes,minimum wages, or regulatory programs—and by the magnitude of cost in-creases incurred under labor and material contracts signed in prior years.Adherence to the goal of price deceleration can contribute to improvedproductivity by intensifying efforts to reduce costs.
If a program for deceleration of inflation is to succeed, it will requirestrong efforts and cooperation at the level of individual industries. Thus,early discussion between government and individual industry and laborgroups with respect to specific inflation problems would be an importantpart of the deceleration effort. On the price side, the staff of the Councilon Wage and Price Stability will undertake an analysis of the outlook formarket conditions and cost trends in those specific situations where difficul-ties can be anticipated in achieving the deceleration objective over thecourse of the year. Members of the Administration will participate in in-formal private discussions with firms or industry groups based upon staffreview of the price-cost outlook and major problems of the industry. Thediscussions would seek to identify problem areas in such matters as costs,capacity, productivity, regulatory measures, and government policies, andwould examine specific actions the parties could take to help in the modera-tion of price and cost increases. Implicit criteria for selecting industries forsuch study and discussions would include their broad impact on costs, theirpotential for setting wage or price patterns, and the occurrence of othermajor developments affecting prices or costs.
Similar informal discussions with union leaders should occur well beforethe beginning of bargaining. They would focus on a review of past trends inrelative wages, effects of the previous settlement, productivity, and othereconomic conditions. These discussions would provide an opportunity toemphasize the importance of deceleration and improvements in productivity,and to review potential barriers to achieving deceleration.
Developments with regard to food prices are likely to be helpfulto the deceleration process. As noted in Chapter 2, the rise of food prices islikely to be considerably smaller in 1978 than it was in 1977. Also, if presentindications of no change in world petroleum prices during 1978 are borneout, the prices paid by consumers for energy will continue to reflect a gradualadjustment of domestic prices to world levels. If a one-half percentage pointannual deceleration could be achieved in the rate of price increase for
154
Digitized for FRASER http://fraser.stlouisfed.org/ Federal Reserve Bank of St. Louis
consumer prices excluding food and fuel, then the reduction in the infla-tion rate for the consumer price index as a whole would be larger if foodand fuel prices move as expected.
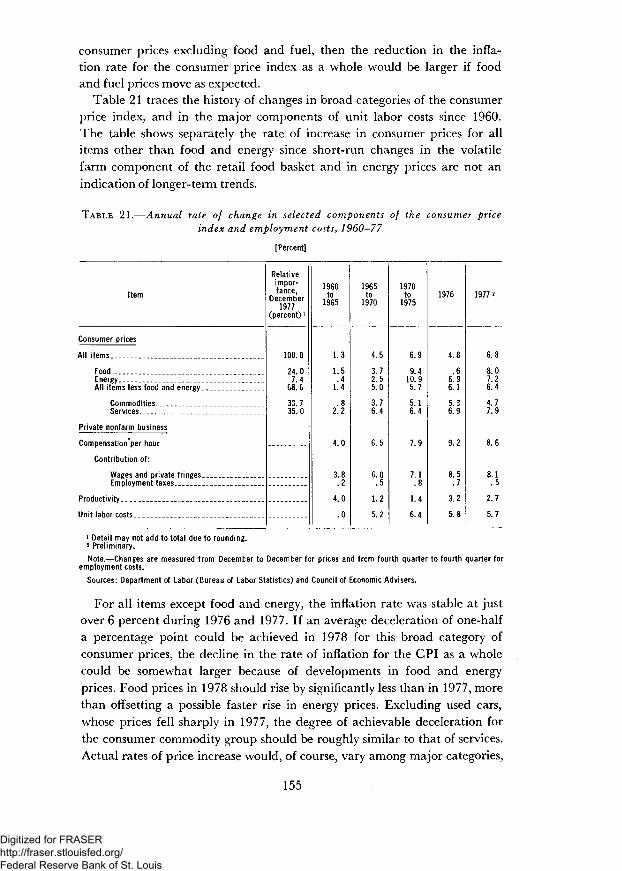
Table 21 traces the history of changes in broad categories of the consumerprice index, and in the major components of unit labor costs since 1960.The table shows separately the rate of increase in consumer prices for allitems other than food and energy since short-run changes in the volatilefarm component of the retail food basket and in energy prices are not anindication of longer-term trends.
TABLE 21.—Annual rate of change in selected components of the consumer priceindex and employment costs, 1960—77
[Percent]
Item
Consumer prices
All items
FoodEnergyAll items less food and energy _
Commodities . _ - _ __Services
Private nonfarm business
Compensationper hour
Contribution of:
Wages and private fringes . . .Employment taxes
Productivity
Unit labor costs
Relativeimpor-tance,
December1977
(percent)1
100.0
24.07.4
68.6
33.735.0
1960to
1965
1.3
1.5.4
1.4
.82.2
4.0
3.8.2
4.0
.0
1965to
1970
4.5
3.72.55.0
3.76.4
6.5
6.0.5
1.2
5.2
1970to
1975
6.9
9.410.95.7
5.16.4
7.9
7.1.8
1.4
6.4
1976
4.8
.66.96.1
5.36.9
9.2
8.5.7
3.2
5.8
1977 2
6.8
8.07.26.4
4.77.9
8.6
8.1.5
2.7
5.7
1 Detail may not add to total due to rounding.2 Preliminary.
Note.—Changes are measured from December to December for prices and frcm fourth quarter to fourth quarter foremployment costs.
Sources: Department of Labor (Bureau of Labor Statistics) and Council of Economic Advisers.
For all items except food and energy, the inflation rate was stable at justover 6 percent during 1976 and 1977. If an average deceleration of one-halfa percentage point could be achieved in 1978 for this broad category ofconsumer prices, the decline in the rate of inflation for the CPI as a wholecould be somewhat larger because of developments in food and energyprices. Food prices in 1978 should rise by significantly less than in 1977, morethan offsetting a possible faster rise in energy prices. Excluding used cars,whose prices fell sharply in 1977, the degree of achievable deceleration forthe consumer commodity group should be roughly similar to that of services.Actual rates of price increase would, of course, vary among major categories,
155
Digitized for FRASER http://fraser.stlouisfed.org/ Federal Reserve Bank of St. Louis

as they normally do. Prices of consumer commodities should rise by lessthan prices of services because of the larger productivity gains.
Since the degree of deceleration will not be the same in all cases, theachievement of one-half percentage point deceleration for the underlyingrate of inflation will require that a larger deceleration occur in most situa-tions. Unless that is done, the end result will be a deceleration substan-tially less than the one-half percentage point.
Determining the degree of deceleration in costs consistent with theassumed deceleration of prices requires consideration of what has hap-pened to profit margins. Profit margins, adjusted for capacity utilization,are close to the postwar average. Without that adjustment, profits arebelow average. Cyclical deviations in productivity from the long-run trend—which are closely related to rates of capacity utilization—are typically re-flected in variations in profits rather than in prices, actual unit labor costsrising relative to prices in recession and falling in recovery. On average,standard unit labor costs should decelerate at about the same rate as theunderlying rate of inflation, since a greater deceleration of prices than costswould reduce profit margins below long-run average levels.
Payroll taxes for social security and unemployment insurance will increasesharply in 1978 and 1979. Achieving a one-half percentage point decelerationin unit labor costs will therefore require a larger moderation of increasesin wages and private fringe benefits. At the same time, however, becauseof the larger than average deceleration in food prices, the rise in the overallconsumer price index would slow down more than the underlying rate ofinflation. As a consequence, significant gains in real wages and fringes wouldbe achieved.
A focus upon the objective of decelerating inflation at the level of indi-vidual markets has several advantages. First, it is an explicit and easily under-stood standard for individual price and w7age situations, set forth well in ad-vance of any specific decision. It recognizes that basic rates of price increasemust vary among markets because of differences in productivity growth andmaterial cost trends. Yet virtually all should be able to achieve some deceler-ation. This objective does not interfere unduly with normal market functions.Individual firms continue to be responsible for their own cost increasesrather than being subjected to some vague concept of cost pass-through.Finally, it provides a conceptual basis as a guide in identifying the specificsectors where efforts to reduce inflation should focus. For regulated indus-tries and governmental operations, it would provide a framework for eval-uating and coordinating a wide range of government policies that affectprices and costs. On the wage side, it recognizes that recent increases havevaried substantially among different groups of workers, but it seeks to mod-erate distortions in the wage structure principally by different degrees ofdeceleration rather than by a speeding up of wage increases in laggingsectors.
156
Digitized for FRASER http://fraser.stlouisfed.org/ Federal Reserve Bank of St. Louis
CAPACITY UTILIZATION
Reduction of the ongoing rate of inflation during the expected economicslack in the next few years would do much to prolong the recovery. But wemust also deal with another challenge—ensuring that we do not incur anew round of inflationary pressures as we return to high employment andcapacity utilization.
In 1973, shortages of capacity, principally in materials-producing indus-tries, contributed to the acceleration of inflation. At present, capacity rela-tive to output is ample in virtually every industry; but as unemploymentdeclines between now and 1981, output and employment will rise faster thantrend. And since 1973 the labor force has grown more rapidly than thestock of fixed business capital. Will industrial capacity be sufficient toprevent shortages from setting off a new round of inflation as the economyapproaches high employment?
The capacity shortages in 1973 developed at the end of a period in whichindustrial capacity had increased fairly rapidly. Between 1965 and 1973 thenet real stock of fixed business capital excluding pollution abatement equip-ment grew at 4.4 percent per year. During the same period, the labor force(minus employment in the government sector) grew at a 1.9-percent annualrate. Even with this difference between the growth rates of labor and capi-tal in the private sector, a number of industries experienced shortages incapacity in 1973. By contrast, in the 1973-76 period the annual growthrate of fixed capital stock, excluding that part devoted to pollution abate-ment, decreased substantially to 1.9 percent, while the private labor supplygrew at 2.3 percent annually. This comparison of growth rates of labor andcapital and the observed capacity shortages in 1973 are in themselves enoughto arouse concern about capacity constraints in 1981 or even sooner.
The capacity shortages in 1973 were made more critical, however, by twofactors that are not likely to recur in the next 4 years. First, output invirtually all industrial countries reached a peak simultaneously in 1973. Thismeant that substantial pressure was placed on world markets for manydifferent industrial products and raw materials. Shortages in the UnitedStates could not be relieved by imports at existing or only slightly increasedprices. Second, the price rise associated with the simultaneous surge in de-mand generated speculative building of inventories across a wide range ofcommodities both here and abroad. This inventory accumulation remaineda profitable activity as long as prices rose faster than the sum of storagecosts plus the nominal rate of interest. Economic growth is now below trendin all industrial countries. This slow growth and the worldwide persistenceof excess capacity in most major industries make a recurrence of worldwide
capacity problems unlikely. In steel, for example, the capacity utilizationrate in 1973 was 97 percent in the United States, 92 percent in Japan, and85 percent in Europe. Currently the average of these rates is less than 75percent, and there is little chance that levels similar to those in 1973 will be
157
248-947 O - 78 - 11Digitized for FRASER http://fraser.stlouisfed.org/ Federal Reserve Bank of St. Louis
reached by 1981, even under optimistic assumptions about the growth ofdemand in Europe and Japan. The availability of many basic commoditiesfrom foreign sources to supplement domestic output when it approachescapacity reduces the probability of price-raising shortages and speculativeinventory accumulation.
PAST TRENDS IN THE UTILIZATION OF CAPITAL
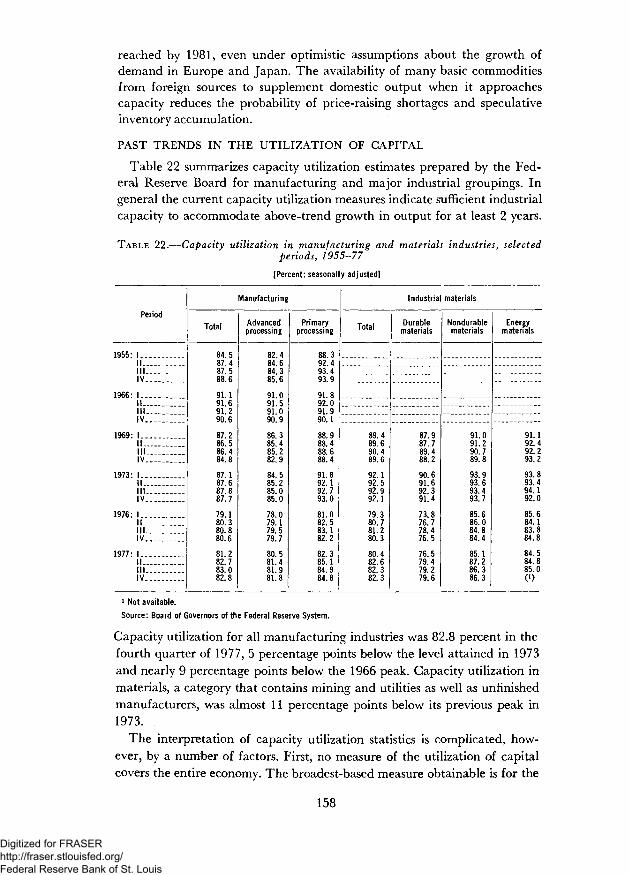
Table 22 summarizes capacity utilization estimates prepared by the Fed-eral Reserve Board for manufacturing and major industrial groupings. Ingeneral the current capacity utilization measures indicate sufficient industrialcapacity to accommodate above-trend growth in output for at least 2 years.
TABLE 22.—Capacity utilization in manufacturing and materials industries, selectedperiods, 1955-77
(Percent; seasonally adjusted]
Period
1955: 1IIIIIIV
1966: 1 . . .IIIIIIV..
1969: 1 . . .IIIIIIV
1973: 1 . .IIIILIV
1976: 1IIIII.IV
1977: 1 . . .IIIII..IV
Manufacturing
Total
84.587.487 588.6
91.191.691.290.6
87.286.586.484.8
87.187 687.887.7
79.180.380.880.6
81.282.783.082.8
Advancedprocessing
82 484.684 385 6
91 091.591 090.9
86 385.485.282.9
84.585 285.085 0
78.079.179.579.7
80.581.481.981.8
Primaryprocessing
88.392.493 493.9
91.892.091.990.1
88.988.488.688.4
91.892.192.793.0
81.082.583.182.2
82.385.184.984.8
Industrial materials
Total
89.489.690.489.6
92.192 592.992.1
79.380.781.280.3
80.482.682.382.3
Durablematerials
87.987.789.488.2
90.691 692.391.4
73.876.778.476.5
76.579.479.279.6
Nondurablematerials
91.091.290.789.8
93.993.693.493.7
85.686.084.884.4
85.187.286.386.3
Energymaterials
91.192.492.293.2
93.893.494.192.0
85.684.183.884.8
84.584.885.00)
i Not available.Source: Board of Governors of the Federal Reserve System.
Capacity utilization for all manufacturing industries was 82.8 percent in thefourth quarter of 1977, 5 percentage points below the level attained in 1973and nearly 9 percentage points below the 1966 peak. Capacity utilization inmaterials, a category that contains mining and utilities as well as unfinishedmanufacturers, was almost 11 percentage points below its previous peak in1973.
The interpretation of capacity utilization statistics is complicated, how-ever, by a number of factors. First, no measure of the utilization of capitalcovers the entire economy. The broadest-based measure obtainable is for the
158
Digitized for FRASER http://fraser.stlouisfed.org/ Federal Reserve Bank of St. Louis

manufacturing sector, which in 1977 accounted for only about 25 percent ofprivate GNP and 20 percent of the fixed private nonresidential capital stock.While it is reasonable to assume that capacity utilization outside of manufac-turing is strongly correlated with the manufacturing capacity utilization rate,substantial variation between disaggregated measures of capacity utilizationdoes exist. For example, between 1962 and 1966 capacity utilization rosemore rapidly than might have been expected because the share of manu-facturing output in the total increased. Between 1966 and 1968 the manu-facturing share fell and capacity utilization declined, even though GNPremained high relative to potential. Only tentative conclusions about theadequacy of aggregate capital formation can be reached from relativelynarrow measures of capacity utilization.
In industries except those with continuous processes (like chemicals, paper,and steel), the possibility of adding a second or third shift to increase outputwithout adding to the physical capital stock creates additional ambiguity.In many sectors of the economy, particularly ones producing finished goods,production is relatively labor-intensive; in a given plant, output can be in-creased by adding employment with very little deterioration in productivity.In these sectors, measured capacity utilization may rise very slowly in relationto output when output is high.
Advanced-processing Versus Materials-producing Industries
The data in Table 22 show a sharp difference between the advanced-processing industries and the primary-processing and materials industries.During the fourth quarter of 1977 capacity utilization rates in advanced-processing industries were only 3 percentage points below those reached in1973. But in 1973 capacity shortages were not apparent in such industries,nor did price pressures originate in those areas; indeed, utilization rateswere substantially lower, by about 6 percentage points, than they had beenin 1966. Capacity utilization in primary-processing and materials industries,however, which was quite high in 1973, was well below those levels in late1977, by about 8 points for primary-processing industries and 11 pointsfor materials. Many of these industries created additional capacity inresponse to the high utilization rates of 1973. The 4/2-point difference incapacity utilization for manufacturing as a whole between 1973 and late1977 thus understates the extent that capacity is available to accommodateabove-trend gains in output in the next several years without generatinginflationary shortages. Most advanced-processing industries should be ableto add extra shifts to expand capacity without extraordinary price increases.
Labor Utilization Versus Capital Utilization
While the growth in domestic output now in prospect for 1978 and 1979and projections of excess capacity in other industrial nations make wide-spread capacity bottlenecks unlikely in the next 2 years, a longer-run imbal-ance between capital and labor resources remains a question. The relation
159
Digitized for FRASER http://fraser.stlouisfed.org/ Federal Reserve Bank of St. Louis

of unused labor services to unused capital services is illustrated in Chart 11.The capacity gap is the difference between the Federal Reserve Boardcapacity utilization index and 87.5 percent, the level attained at timeswhen the unemployment rate was close to high employment. The em-ployment gap is the difference between the overall unemployment rate andthe high-employment benchmark. During the 1960s very large investmentexpenditures increased the capital stock substantially. As a consequence, in1967-69, when the labor market became very tight, with a negative employ-ment gap, the capacity utilization rate remained at or below 87 percent.Since then, however, the employment gap has drifted upward relative tothe capacity gap; for any given unemployment rate the observed capacityutilization rate has increased.
A related measure of this capital-labor imbalance is the high-employmentcapacity utilization rate shown in Chart 11. By estimating the average rela-tion between changes in the unemployment rate and changes in thecapacity utilization rate, one can obtain the capacity utilization that wouldbe achieved in any period if unemployment were at its high-employment
Chart 11
Relationship Between Capitaland Labor Utilization
PERCENTAGE POINTS PERCENTAGE POINTS24
UNUSED CAPITAL AND LABOR
CAPACITY GAP(Right scale)
J EMPLOYMENT GAP~~~ (Left scale)
i 1 1 1 I I I I l l I 1 i I l 1 1 I l I i l i 1 i I l I l 1 l I I I i I l I I 1 i I i I l i 1 1 i I I I i I i I i l I I i I I I I i i I I i l- 21960 62 64 66 68 70 72 74 76
PERCENT
-8
100
90
80
HIGH-EMPLOYMENT CAPACITY
\ /
Vi
I l l l l ml
^ ^ - \
I I I I I I II I I ! I I I
UTILIZATION
MATERIALS
I l l l l I I n i
^ \ v
M A N U F A C T U R I N G
I l I I I I I I l I I I I I I I ! I1960 62 64 66 68 70 72 74 76SOURCE: COUNCIL OF ECONOMIC ADVISERS.
160
Digitized for FRASER http://fraser.stlouisfed.org/ Federal Reserve Bank of St. Louis
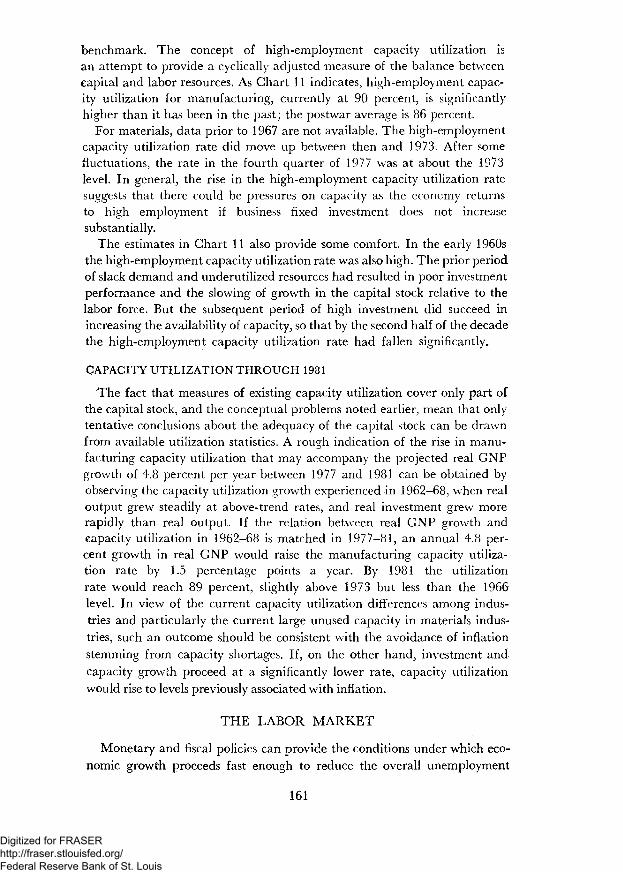
benchmark. The concept of high-employment capacity utilization isan attempt to provide a cyclically adjusted measure of the balance betweencapital and labor resources. As Chart 11 indicates, high-employment capac-ity utilization for manufacturing, currently at 90 percent, is significantlyhigher than it has been in the past; the postwar average is 86 percent.
For materials, data prior to 1967 are not available. The high-employmentcapacity utilization rate did move up between then and 1973. After somefluctuations, the rate in the fourth quarter of 1977 was at about the 1973level. In general, the rise in the high-employment capacity utilization ratesuggests that there could be pressures on capacity as the economy returnsto high employment if business fixed investment does not increasesubstantially.
The estimates in Chart 11 also provide some comfort. In the early 1960sthe high-employment capacity utilization rate was also high. The prior periodof slack demand and underutilized resources had resulted in poor investmentperformance and the slowing of growth in the capital stock relative to thelabor force. But the subsequent period of high investment did succeed inincreasing the availability of capacity, so that by the second half of the decadethe high-employment capacity utilization rate had fallen significantly.
CAPACITY UTILIZATION THROUGH 1981
The fact that measures of existing capacity utilization cover only part ofthe capital stock, and the conceptual problems noted earlier, mean that onlytentative conclusions about the adequacy of the capital stock can be drawnfrom available utilization statistics. A rough indication of the rise in manu-facturing capacity utilization that may accompany the projected real GNPgrowth of 4.8 percent per year between 1977 and 1981 can be obtained byobserving the capacity utilization growth experienced in 1962-68, when realoutput grew steadily at above-trend rates, and real investment grew morerapidly than real output. If the relation between real GNP growth andcapacity utilization in 1962-68 is matched in 1977-81, an annual 4.8 per-cent growth in real GNP would raise the manufacturing capacity utiliza-tion rate by 1.5 percentage points a year. By 1981 the utilizationrate would reach 89 percent, slightly above 1973 but less than the 1966level. In view of the current capacity utilization differences among indus-tries and particularly the current large unused capacity in materials indus-tries, such an outcome should be consistent wTith the avoidance of inflationstemming from capacity shortages. If, on the other hand, investment andcapacity growth proceed at a significantly lower rate, capacity utilizationwould rise to levels previously associated with inflation.
THE LABOR MARKET
Monetary and fiscal policies can provide the conditions under which eco-nomic growth proceeds fast enough to reduce the overall unemployment
161
Digitized for FRASER http://fraser.stlouisfed.org/ Federal Reserve Bank of St. Louis

rate. Such policies alone, however, cannot reduce unemployment to accept-able levels without a significant risk of accelerating inflation.
The incidence of unemployment differs widely throughout the popula-tion. In both good and bad times, youth, minorities, women, and those withless education face a much greater likelihood of being unemployed thanwhite male adults with good education. As a consequence, when the overallunemployment rate declines to low levels, unemployment among the morefavored groups becomes very small, labor shortages occur, and the rate ofwage and price increase accelerates. Yet less favored groups continue tosuffer high though diminished unemployment.
The uneven incidence of unemployment requires that monetary and fiscalpolicies to deal with aggregate unemployment be accompanied by structuralpolicies to deal directly with the labor market problems of groups with per-sistently high unemployment.
THE STRUCTURE OF UNEMPLOYMENT
Although unemployment rates have recovered to a great extent from the1975 recession, they have not yet reached the levels normally associated withhigh employment. As is seen in Table 23, all of the unemployment ratesby age, race, and sex were higher in 1977 than in 1956, 1965, and 1973—years of low overall unemployment in which labor markets were apparentlyclose to balance. It would thus be wrong to conclude that all of thecurrent high rate of unemployment is frictional or structural (i.e.,that the present unemployment rate could not be lowered through an in-crease in aggregate demand without increasing the rate of inflation).There are, however, a number of structural problems revealed in Table23, and it is useful to examine each of them in detail.
Unemployment differentials have been persistently observed in our econ-omy. They exist between blacks and whites, teenagers and adults, andwomen and men. Part of the explanation of such differentials has to dowith different patterns of turnover, skill level, labor market attachment,
TABLE 23.—Unemployment rates by race, sex, and age, selected periods, 1956-77
[Percent*]
Group
Total
White:Males 20 years and overFemales 20 years and over . . . - __Teenagers
Black and other: 3Males 20 years and overFemales 20 years and overTeenagers. .. .
1956 2
4.2
2.73.99.1
6.79.4
16.6
1965 2
4.6
2.64.2
12.3
5.49.0
24.6
1968
3.6
2.03.4
11.0
3.96.3
25.0
1973III
4.8
2.84.4
12.2
6.08.1
31.5
1975II
8.9
6.58.0
18.3
12.011.836.7
1977IV
6.6
4.26.0
14.1
10.111.838.3
1 Percent of civilian labor force in group specified; quarterly data seasonally adjusted.2 Data adjusted for change in definitions in 1967.s Blacks comprise about 89 percent of total black and other in the labor force.
Source: Department of Labor, Bureau of Labor Statistics.
162
Digitized for FRASER http://fraser.stlouisfed.org/ Federal Reserve Bank of St. Louis

location, and other factors that may be quantified. Differentials may alsobe due to factors, such as discrimination, that are less quantifiable butalso important in understanding the structure of unemployment.
Youth Unemployment
Teenagers comprised only 10 percent of the labor force in the fourthquarter of 1977, but they accounted for 24 percent of all unemployment.This problem is better understood by examining two separate questions:Why is teenage unemployment different from adult unemployment? Andwhy is black teenage unemployment much higher than white teenageunemployment ?
White teenagers, like other groups, still suffer from cyclical unemploy-ment, but there is less structural unemployment than would appear simplyfrom a comparison of white teenage unemployment rates with those of whiteadults. During periods of general economic prosperity much of the unem-ployment of white teenagers results from decisions to leave and reenterthe labor force. For most younger teenagers—those 16 to 17 years old—em-ployment is a secondary (or tertiary) activity, and jobs are considered only astemporary. For older teenagers there also is much turnover in the trial anderror process of finding a long-term career job. A recent study has shownthat between 1967 and 1973 the average number of teenagers who left em-ployment and withdrew from the labor force in any given month ranged fordifferent race-sex groups from 12 to 20 percent of total teenage employment.The corresponding figure for males aged 25 to 59 was 0.4 to 1.1 percent.
The higher labor force turnover rates for teenagers are shown in Table24, where unemployment rates of teenagers and adult males and femalesare classified according to the reason for unemployment. The proportion ofthe total teenage labor force that is unemployed because they lost their lastjob is not much higher than for adults, but the fraction unemployed as aresult of either leaving their last job or entering or reentering the labor forceis a great deal higher than for adults. The data in Table 24 may to someextent understate the relative importance of unemployment among adultfemales and teenagers associated with job loss. Some of those in the re-entrant category may have been discouraged workers who previously droppedout of the labor force after losing their last job.
TABLE 24.—Unemployment rates by reasons for unemployment, 1977
[Percent]
Group
TotalJob losersJob leaversNew entrants to the labor forceReentrants . . _..
Total *
7.03.2.9
1.02.0
Vlales 20 yearsand
over2
5.23.4.6.2
1.0
Females 20years and
over2
7.02.81.2.4
2.6
Teenagers 2
17.73.41.77.65.1
1 Percent of civilian labor force.2 Percent of civilian labor force in sex/age group specified.Source: Department of Labor, Bureau of Labor Statistics.
163
Digitized for FRASER http://fraser.stlouisfed.org/ Federal Reserve Bank of St. Louis
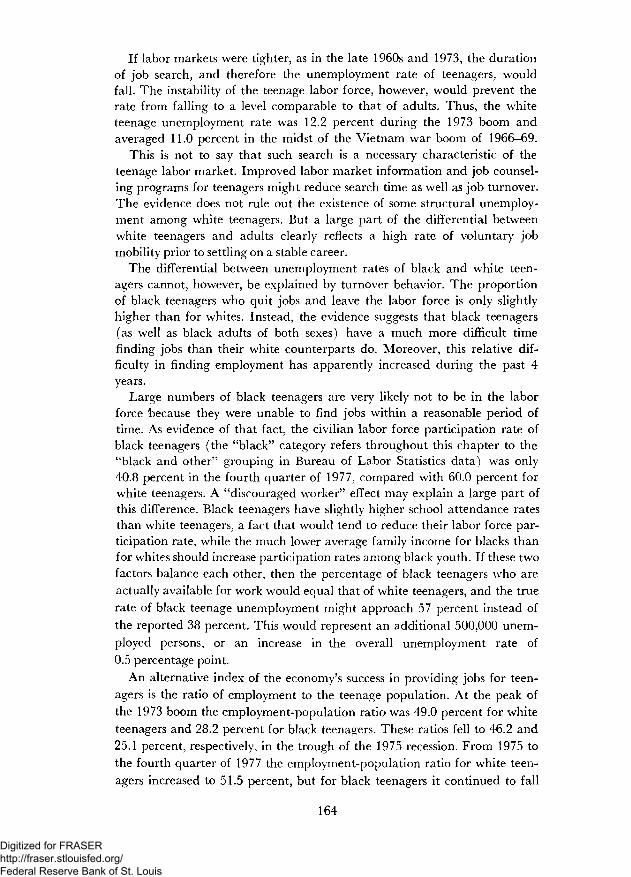
If labor markets were tighter, as in the late 1960s and 1973, the durationof job search, and therefore the unemployment rate of teenagers, wouldfall. The instability of the teenage labor force, however, would prevent therate from falling to a level comparable to that of adults. Thus, the whiteteenage unemployment rate was 12.2 percent during the 1973 boom andaveraged 11.0 percent in the midst of the Vietnam war boom of 1966-69.
This is not to say that such search is a necessary characteristic of theteenage labor market. Improved labor market information and job counsel-ing programs for teenagers might reduce search time as well as job turnover.The evidence does not rule out the existence of some structural unemploy-ment among white teenagers. But a large part of the differential betweenwhite teenagers and adults clearly reflects a high rate of voluntary jobmobility prior to settling on a stable career.
The differential between unemployment rates of black and white teen-agers cannot, however, be explained by turnover behavior. The proportionof black teenagers who quit jobs and leave the labor force is only slightlyhigher than for whites. Instead, the evidence suggests that black teenagers(as well as black adults of both sexes) have a much more difficult timefinding jobs than their white counterparts do. Moreover, this relative dif-ficulty in finding employment has apparently increased during the past 4years.
Large numbers of black teenagers are very likely not to be in the laborforce because they were unable to find jobs within a reasonable period oftime. As evidence of that fact, the civilian labor force participation rate ofblack teenagers (the "black" category refers throughout this chapter to the"black and other" grouping in Bureau of Labor Statistics data) was only40.8 percent in the fourth quarter of 1977, compared with 60.0 percent forwhite teenagers. A "discouraged wrorker" effect may explain a large part ofthis difference. Black teenagers have slightly higher school attendance ratesthan white teenagers, a fact that would tend to reduce their labor force par-ticipation rate, while the much lower average family income for blacks thanfor whites should increase participation rates among black youth. If these twofactors balance each other, then the percentage of black teenagers who areactually available for work would equal that of white teenagers, and the truerate of black teenage unemployment might approach 57 percent instead ofthe reported 38 percent. This would represent an additional 500,000 unem-ployed persons, or an increase in the overall unemployment rate of0.5 percentage point.
An alternative index of the economy's success in providing jobs for teen-agers is the ratio of employment to the teenage population. At the peak ofthe 1973 boom the employment-population ratio was 49.0 percent for whiteteenagers and 28.2 percent for black teenagers. These ratios fell to 46.2 and25.1 percent, respectively, in the trough of the 1975 recession. From 1975 tothe fourth quarter of 1977 the employment-population ratio for white teen-agers increased to 51.5 percent, but for black teenagers it continued to fall
164
Digitized for FRASER http://fraser.stlouisfed.org/ Federal Reserve Bank of St. Louis

in 1976 and did not increase until 1977, returning to 25.1 percent in thefourth quarter. Thus, by this measure white teenagers are doing better thanat the peak of the last business cycle, but black teenagers are doing no betterthan before the current upswing began.
The gaps between black and white teenage unemployment rates andemployment-population ratios have been increasing steadily for the past30 years. Even in 1968, at the height of the boom induced by the Vietnamwar, the black teenage unemployment rate was 25 percent, compared with11 percent for whites. This worsening coincides with what was until 1975 ageneral improvement in adult black unemployment rates relative to those ofwhites—especially for males—as well as a general increase in the relativeincomes and skill levels of adult blacks.
Several plausible explanations of why black youth have fared so badly inthe labor market during the current upswing have been advanced by econ-omists. A popular hypothesis is that blacks reside in central cities in pro-portionately greater numbers than whites and that central cities have notshared in the recovery. This, however, cannot explain very much of thefailure of the employment-population ratio of black teenagers to increaseduring the recovery. From 1975 to 1977 the proportion of black teenagersliving in central cities held constant at 55 percent; for whites the pro-portion fell from 23 to 22 percent. The employment-population ratio ofblack teenagers residing in central cities fell by 0.9 percentage point, but forwhite teenagers in central cities it increased by 3.0 points. Moreover, whereasthe employment-population ratio of white teenagers residing in suburbsincreased by 3.8 percentage points, the ratio for black teenagers in suburbsfell by 0.8 point. In nonmetropolitan areas the white teenage employment-population ratio rose by 3.9 percentage points while the ratio for blacksdecreased 1.5 points. Thus, the worsening situation for black teenagers doesnot appear to be urban-specific. The black unemployment problem is anurban problem, but principally because so many blacks live in cities.
Another explanation of why the black teenage labor market has beendeteriorating both relatively and absolutely is the large increase in the poten-tial labor force of black teenage labor relative to other kinds of labor.From 1964 to 1976 the black teenage population grew at an annual rate of4.3 percent compared with 2.3 percent for white teenagers and 1.7 percentfor all adults. To the extent that the wages of teenagers relative to those ofadults are fixed through institutional arrangements such as legal minimumwages, collective bargaining agreements, custom, or a tailoring of jobs to aparticular mix of worker skills and characteristics, an increase in the rela-tive supply of teenagers will lead to an increase in their relative unemploy-ment. Black teenagers would be especially affected because black adults havegenerally been attached to low-paying, low-skill occupations in which theyare more likely to compete with teenagers than is the case with white adults.This explanation also rests on the proposition that the labor markets for
165
Digitized for FRASER http://fraser.stlouisfed.org/ Federal Reserve Bank of St. Louis
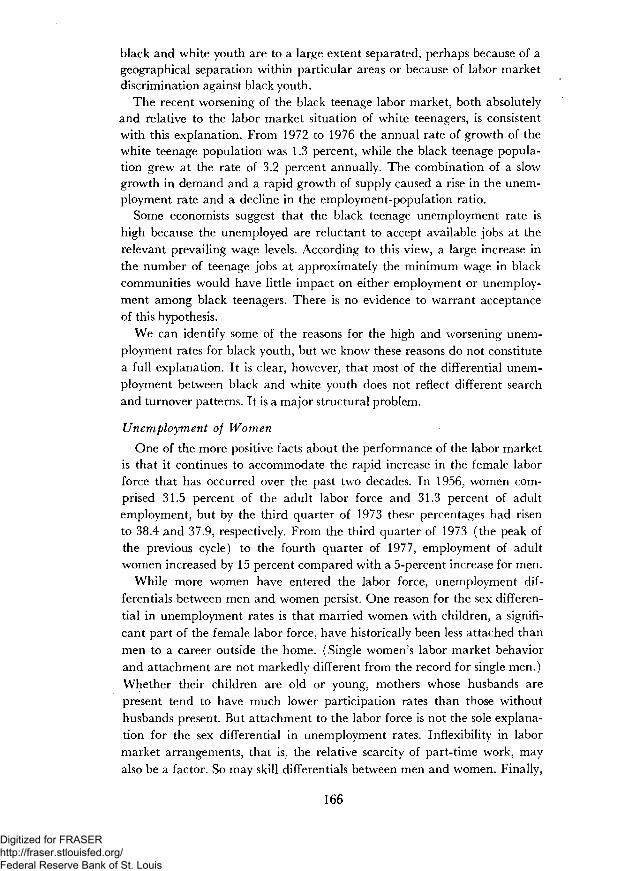
black and white youth are to a large extent separated, perhaps because of ageographical separation within particular areas or because of labor marketdiscrimination against black youth.
The recent worsening of the black teenage labor market, both absolutelyand relative to the labor market situation of white teenagers, is consistentwith this explanation. From 1972 to 1976 the annual rate of growth of thewhite teenage population was 1.3 percent, while the black teenage popula-tion grew at the rate of 3.2 percent annually. The combination of a slowgrowth in demand and a rapid growth of supply caused a rise in the unem-ployment rate and a decline in the employment-population ratio.
Some economists suggest that the black teenage unemployment rate ishigh because the unemployed are reluctant to accept available jobs at therelevant prevailing wage levels. According to this view, a large increase inthe number of teenage jobs at approximately the minimum wage in blackcommunities would have little impact on either employment or unemploy-ment among black teenagers. There is no evidence to warrant acceptanceof this hypothesis.
We can identify some of the reasons for the high and worsening unem-ployment rates for black youth, but we know these reasons do not constitutea full explanation. It is clear, however, that most of the differential unem-ployment between black and white youth does not reflect different searchand turnover patterns. It is a major structural problem.
Unemployment of Women
One of the more positive facts about the performance of the labor marketis that it continues to accommodate the rapid increase in the female laborforce that has occurred over the past two decades. In 1956, women com-prised 31.5 percent of the adult labor force and 31.3 percent of adultemployment, but by the third quarter of 1973 these percentages had risento 38.4 and 37.9, respectively. From the third quarter of 1973 (the peak ofthe previous cycle) to the fourth quarter of 1977, employment of adultwomen increased by 15 percent compared with a 5-percent increase for men.
While more women have entered the labor force, unemployment dif-ferentials between men and women persist. One reason for the sex differen-tial in unemployment rates is that married women with children, a signifi-cant part of the female labor force, have historically been less attached thanmen to a career outside the home. (Single women's labor market behaviorand attachment are not markedly different from the record for single men.)Whether their children are old or young, mothers whose husbands arepresent tend to have much lower participation rates than those withouthusbands present. But attachment to the labor force is not the sole explana-tion for the sex differential in unemployment rates. Inflexibility in labormarket arrangements, that is, the relative scarcity of part-time work, mayalso be a factor. So may skill differentials between men and women. Finally,
166
Digitized for FRASER http://fraser.stlouisfed.org/ Federal Reserve Bank of St. Louis

the "statistical discrimination" that once associated women with secondarylabor market habits, while possibly a factor, is no longer as important as itonce was.
From 1967 to 1973 the proportion of women aged 25 to 59 who left thelabor force from a job averaged between 4.3 and 4.8 percent per month.This is much less than the corresponding figures for teenagers, mentionedabove, but much higher than the labor force turnover rates for men, 0.4 to1.1 percent. In 1977, as shown in Table 24, of the 7.0 percent of adultwomen in the civilian labor force who were unemployed, three-fifths wereunemployed because they had either left their jobs or were entering the laborforce; only a third of the adult male unemployed were in the same category.Subject to the qualification made earlier about the nature of unemploymentamong reentrants, the difference in turnover appears to account for mostof the difference in total unemployment rates between the sexes.
Part of the reason why women are less attached to the labor marketthan men is that husbands commonly have been regarded as the "prin-cipal" earners in husband-wife families, and wives as the "secondary" earn-ers. In 1977, 21 percent of all unemployed persons were wives with husbandspresent, and 79 percent of these were in family units where at least one per-son was employed full time. For unemployed husbands the figure was only37 percent. The proportion of unemployed wives in families with at leastone full-time earner was 81 percent for whites, compared with 73 percent forblacks. The burden of a given level of unemployment is thus greater for blackthan for white women. The unemployment burden is also made heavier forblack females than for whites because black women have historically hadsignificantly higher labor force participation rates than white women.(The gap has been narrowed somewhat since the late 1960s with the risein white women's participation.) Despite this stronger attachment to thelabor force, black women experience unemployment rates that are overone and one-half times those of white women.
In general, a significant part of the unemployment differential betweenadult women and men is explained by high labor force turnover, as is thecase for teenagers. Institutions seem to be changing, however, in a mannerthat should reduce this differential in the future. The large increase inthe labor force participation rates of younger married women implies thatwomen will have a greater average degree of labor force attachment in thefuture, and this should lower their unemployment rate over time as theirturnover rate decreases.
Unemployment of Adult Males
The unemployment rate of adult black men has clearly not recoveredfrom the 1975 recession as much as w7ould be expected. Between 1954 and1973 their unemployment rate, when adjusted for definitional changes,averaged 7.2 percent, compared with 3.3 percent for adult white males, aratio of 2.2 to 1. After adjustment for cyclical factors (the black rate is more
167
Digitized for FRASER http://fraser.stlouisfed.org/ Federal Reserve Bank of St. Louis

cyclically sensitive than the white rate), this ratio declined steadily overtime, by approximately 0.4 percentage point from 1954 to 1973. In thefourth quarter of 1977, however, the black-white adult male unemploy-ment ratio was 2.4 instead of the 1.8 that would be predicted on the basisof trend and cycle. Had this earlier trend continued, the adult black maleunemployment rate would have been 7.6 percent in the fourth quarterof 1977 instead of its actual value of 10.1 percent. Not only did the unem-ployment rate of adult black males increase sharply over the past 4 years,but also their civilian labor force participation rate fell by 2.8 percentagepoints, compared with a drop of only 1.3 points for white males. This dropitself may have been caused by the increase in relative unemploymentrates for black males.
It is possible that part of the cause of the high unemployment ratesof adult blacks is related to the black youth unemployment problem. Thefact that black youth face such enormous difficulties in obtaining steadyemployment may establish a pattern that is difficult to break. Table 25
TABLE 25.—Unemployment rates of black and white men by age, 1977[Percent *]
Age Whitemen
18-19 years,20-21 years..
22-24 years.25-34 years.
35-44 years.45-54 years.
55-64 years65 years and over.
13.010.7
8.35.0
3.13.0
3.34.9
i Percent of civilian labor force in group specified.Source: Department of Labor, Bureau of Labor Statistics.
shows the pattern of average unemployment for black and white men byage in 1977. The extremely large differential in unemployment rates betweenblacks and whites in the 18 to 24 age range implies that whites are able tofind secure jobs much more easily than blacks. As they get older, black malesare more likely than whites to be in jobs that are subject to termination.
UNEMPLOYMENT AND INFLATIONHow well wre deal with structural aspects of unemployment has important
implications for the equity with which the benefits of prosperity are dis-tributed. In addition, it will play an important part in determining how farwe can go in reducing unemployment without risking a new episode ofinflation. Large increases in aggregate demand and production cause a risein the demand for labor. Initially the resultant job vacancies are filled fromthe ranks of the unemployed. But as unemployment falls below some pointthe number of job vacancies begins to exceed the number of qualifiedjob seekers. Firms increasingly try to meet their labor force needs by large
168
Digitized for FRASER http://fraser.stlouisfed.org/ Federal Reserve Bank of St. Louis

wage increases, a process that causes the overall rate of wage advance torise and thus leads to a rise in the rate of inflation.
The precise details of this process are not fully understood, partly becauseit does not always work the same way. For example, the responsiveness ofwages to changes in the degree of labor market tightness depends uponhow long the inflationary process has been under way, and how expectationsabout future inflation have been affected. There is considerable controversyabout how important unions are in initiating and perpetuating wage in-creases. Some evidence suggests that in the early stages of a new inflationaryprocess union wage increases lag those in the nonunion sector. Despite ourignorance about many specific parts of the process, there is no question butthat low unemployment rates imply a high degree of labor market tightnessand that this eventually results in a strong upward pressure on wages andprices.
From the point of view of dealing with the relationship between inflationand unemployment there are two major questions:
1. What is the overall rate of unemployment at which wage increasesaccelerate?
2. Is this level changing over time?These questions are difficult because there are several "submarkets" for
labor rather than a single market. Job seekers in one market are only partlycompetitive for vacancies in another. The boundaries of these individualmarkets are determined by a number of factors: geographic, demographic,occupational, and those arising from discrimination. If some groups havevery high unemployment rates but cannot be drawn upon to fill certain jobs,wage pressures and inflationary problems can begin to arise even when thereis high unemployment.
Three alternative measures of labor market tightness for selected yearsfrom 1956 to 1957 are shown in Table 26 and illustrate the major issuesassociated with these questions.
The overall rate of unemployment receives the most public attentionbecause it is often interpreted as a major index of the economy's perform-ance. The problem with its use as an index of labor market tightness is thatduring the past 20 years the composition of the labor force has shiftedtoward those demographic groups that experience the highest labor forceturnover and unemployment. For example, because of the turnover behaviordiscussed above, a 10- to 12-percent rate of unemployment among teenagersmay be roughly equivalent, in terms of labor market tightness, to a 3-percentrate for adult males. Thus, if the share of young persons in the labor forceincreased, the overall unemployment rate associated with a given degree oflabor market tightness would also increase. In fact, from 1956 to 1977, theproportion of the civilian labor force under age 25 did increase from 15 to24 percent. This implies that the overall rate of unemployment correspondingto any degree of labor market tightness is higher now than it was two decadesago.
169
Digitized for FRASER http://fraser.stlouisfed.org/ Federal Reserve Bank of St. Louis
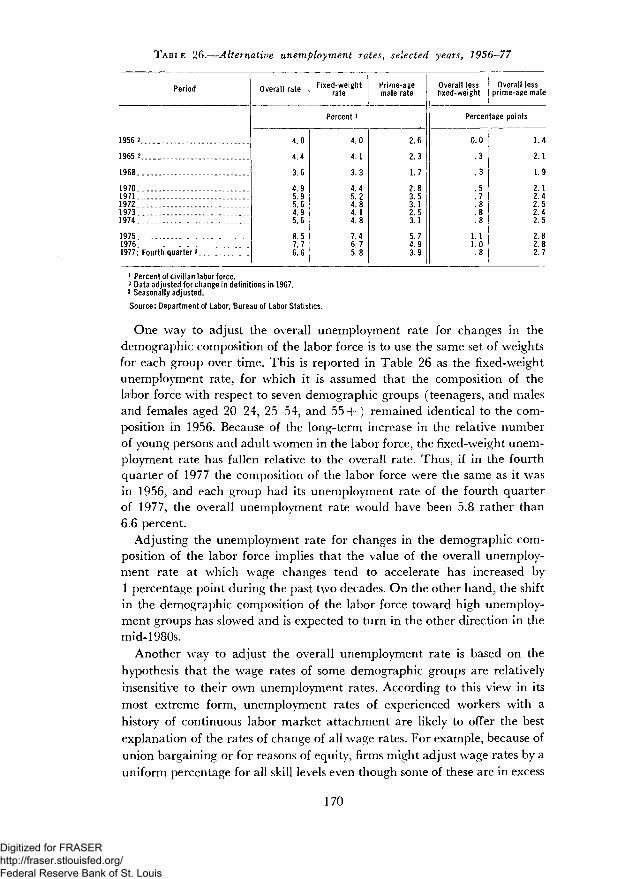
TABLE 26.—Alternative unemployment rates, selected years, 1956—77
Period
19562
1965 2..
1968
19701971197219731974
1975 . .19761977: Fourth quarters _ .
Overall rate Fixed-weightrate
Prime-agemale rate
Percent l
4.0
4.4
3 6
4.95.95.64 95.6
8.57 76.6
4.0
4.1
3 3
4.45.24.84. 14.8
7.46 75.8
2.6
2.3
1 7
2.83.53.12.53.1
5.74.93.9
Overall lessfixed-weight
Overall lessprime-age male
Percentage points
0.0
.3
.3
.5
.7
.8
.8
.8
1.11.0.8
1.4
2.1
1.9
2.12.42.52.42.5
2.82.82.7
1 Percent of civilian labor force.2 Data adjusted for change in definitions in 1967.3 Seasonally adjusted.
Source: Department of Labor, Bureau of Labor Statistics.
One way to adjust the overall unemployment rate for changes in thedemographic composition of the labor force is to use the same set of weightsfor each group over time. This is reported in Table 26 as the fixed-weightunemployment rate, for which it is assumed that the composition of thelabor force with respect to seven demographic groups (teenagers, and malesand females aged 20-24, 25-54, and 55 4-) remained identical to the com-position in 1956. Because of the long-term increase in the relative numberof young persons and adult women in the labor force, the fixed-weight unem-ployment rate has fallen relative to the overall rate. Thus, if in the fourthquarter of 1977 the composition of the labor force were the same as it wasin 1956, and each group had its unemployment rate of the fourth quarterof 1977, the overall unemployment rate would have been 5.8 rather than6.6 percent.
Adjusting the unemployment rate for changes in the demographic com-position of the labor force implies that the value of the overall unemploy-ment rate at which wage changes tend to accelerate has increased by1 percentage point during the past two decades. On the other hand, the shiftin the demographic composition of the labor force toward high unemploy-ment groups has slowed and is expected to turn in the other direction in themid-1980s.
Another way to adjust the overall unemployment rate is based on thehypothesis that the wage rates of some demographic groups are relativelyinsensitive to their own unemployment rates. According to this view in itsmost extreme form, unemployment rates of experienced workers with ahistory of continuous labor market attachment are likely to offer the bestexplanation of the rates of change of all wage rates. For example, because ofunion bargaining or for reasons of equity, firms might adjust wage rates by auniform percentage for all skill levels even though some of these are in excess
170
Digitized for FRASER http://fraser.stlouisfed.org/ Federal Reserve Bank of St. Louis
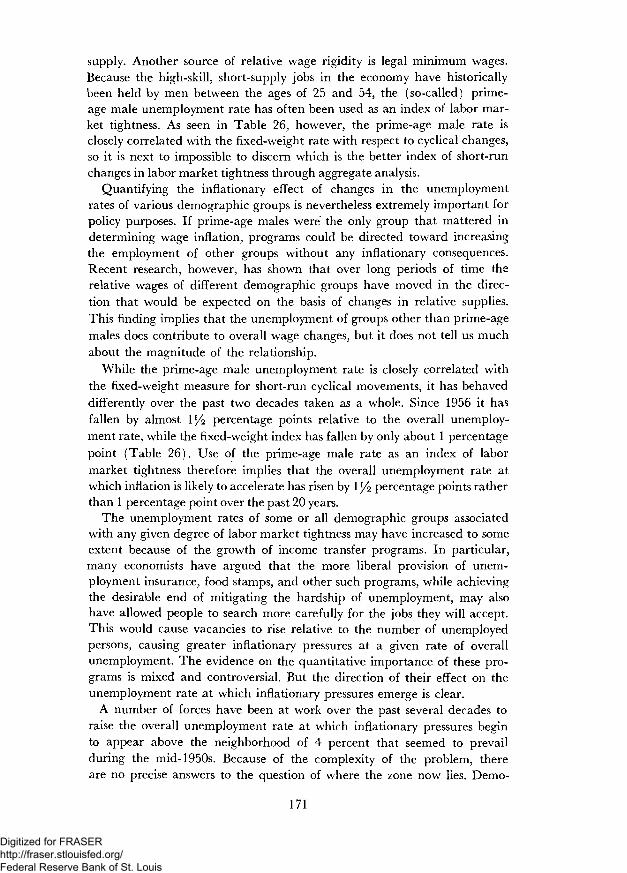
supply. Another source of relative wage rigidity is legal minimum wages.Because the high-skill, short-supply jobs in the economy have historicallybeen held by men between the ages of 25 and 54, the (so-called) prime-age male unemployment rate has often been used as an index of labor mar-ket tightness. As seen in Table 26, however, the prime-age male rate isclosely correlated with the fixed-weight rate with respect to cyclical changes,so it is next to impossible to discern which is the better index of short-runchanges in labor market tightness through aggregate analysis.
Quantifying the inflationary effect of changes in the unemploymentrates of various demographic groups is nevertheless extremely important forpolicy purposes. If prime-age males were the only group that mattered indetermining wage inflation, programs could be directed toward increasingthe employment of other groups without any inflationary consequences.Recent research, however, has shown that over long periods of time therelative wages of different demographic groups have moved in the direc-tion that would be expected on the basis of changes in relative supplies.This finding implies that the unemployment of groups other than prime-agemales does contribute to overall wage changes, but it does not tell us muchabout the magnitude of the relationship.
While the prime-age male unemployment rate is closely correlated withthe fixed-weight measure for short-run cyclical movements, it has behaveddifferently over the past two decades taken as a whole. Since 1956 it hasfallen by almost I/2 percentage points relative to the overall unemploy-ment rate, while the fixed-weight index has fallen by only about 1 percentagepoint (Table 26). Use of the prime-age male rate as an index of labormarket tightness therefore implies that the overall unemployment rate atwhich inflation is likely to accelerate has risen by 1J/2 percentage points ratherthan 1 percentage point over the past 20 years.
The unemployment rates of some or all demographic groups associatedwith any given degree of labor market tightness may have increased to someextent because of the growth of income transfer programs. In particular,many economists have argued that the more liberal provision of unem-ployment insurance, food stamps, and other such programs, while achievingthe desirable end of mitigating the hardship of unemployment, may alsohave allowed people to search more carefully for the jobs they will accept.This would cause vacancies to rise relative to the number of unemployedpersons, causing greater inflationary pressures at a given rate of overallunemployment. The evidence on the quantitative importance of these pro-grams is mixed and controversial. But the direction of their effect on theunemployment rate at which inflationary pressures emerge is clear.
A number of forces have been at work over the past several decades toraise the overall unemployment rate at which inflationary pressures beginto appear above the neighborhood of 4 percent that seemed to prevailduring the mid-1950s. Because of the complexity of the problem, thereare no precise answers to the question of where the zone now lies. Demo-
171
Digitized for FRASER http://fraser.stlouisfed.org/ Federal Reserve Bank of St. Louis
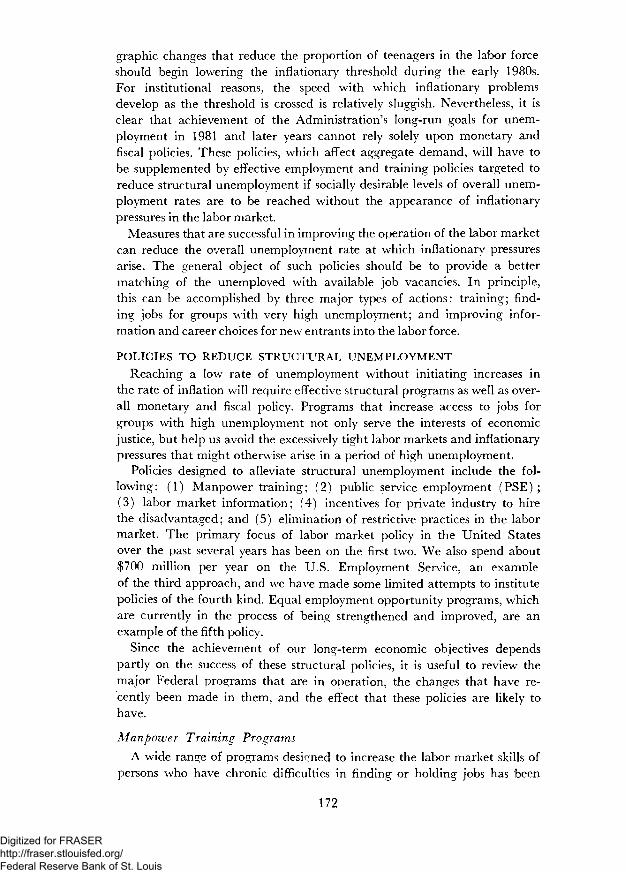
graphic changes that reduce the proportion of teenagers in the labor forceshould begin lowering the inflationary threshold during the early 1980s.For institutional reasons, the speed with which inflationary problemsdevelop as the threshold is crossed is relatively sluggish. Nevertheless, it isclear that achievement of the Administration's long-run goals for unem-ployment in 1981 and later years cannot rely solely upon monetary andfiscal policies. These policies, which affect aggregate demand, will have tobe supplemented by effective employment and training policies targeted toreduce structural unemployment if socially desirable levels of overall unem-ployment rates are to be reached without the appearance of inflationarypressures in the labor market.
Measures that are successful in improving the operation of the labor marketcan reduce the overall unemployment rate at which inflationary pressuresarise. The general object of such policies should be to provide a bettermatching of the unemployed with available job vacancies. In principle,this can be accomplished by three major types of actions: training; find-ing jobs for groups with very high unemployment; and improving infor-mation and career choices for new entrants into the labor force.
POLICIES TO REDUCE STRUCTURAL UNEMPLOYMENTReaching a low rate of unemployment without initiating increases in
the rate of inflation will require effective structural programs as well as over-all monetary and fiscal policy. Programs that increase access to jobs forgroups with high unemployment not only serve the interests of economicjustice, but help us avoid the excessively tight labor markets and inflationarypressures that might otherwise arise in a period of high unemployment.
Policies designed to alleviate structural unemployment include the fol-lowing: (1) Manpower training; (2) public service employment (PSE) ;(3) labor market information; (4) incentives for private industry to hirethe disadvantaged; and (5) elimination of restrictive practices in the labormarket. The primary focus of labor market policy in the United Statesover the past several years has been on the first two. We also spend about$700 million per year on the U.S. Employment Service, an exampleof the third approach, and we have made some limited attempts to institutepolicies of the fourth kind. Equal employment opportunity programs, whichare currently in the process of being strengthened and improved, are anexample of the fifth policy.
Since the achievement of our long-term economic objectives dependspartly on the success of these structural policies, it is useful to review themajor Federal programs that are in operation, the changes that have re-cently been made in them, and the effect that these policies are likely tohave.
Manpower Training Programs
A wide range of programs designed to increase the labor market skills ofpersons who have chronic difficulties in finding or holding jobs has been
172
Digitized for FRASER http://fraser.stlouisfed.org/ Federal Reserve Bank of St. Louis

offered since the early 1960s. During 1978 approximately $1.9 billion willbe spent on classroom and on-the-job training programs (Table 27). Tothe extent that training programs can raise the skills of the unemployed sothat they correspond more closely to those needed in vacant jobs they shouldlower the unemployment rate at which excessive labor market tightnessbegins to appear. Since the benefits of these programs accrue for some timeafter the training period, it is difficult to find out whether they are havingtheir intended impact until the work experience and earnings of traineeshave been observed for many years. Scattered evidence based on the pro-grams of the 1960s, however, suggests that the return on classroom trainingprograms is approximately comparable to returns on other types of invest-ment in our economy. Moreover, the training programs do appear to bemoderately well targeted to the least skilled participants in the labor force.
TABLE 27.—Estimated Federal outlays and participation in training andemployment programs during fiscal year 1978
Program
Total training and employment.
Training
Institutional.On-the-job. .
Public service employment (PSE).
Regular PSEWork experience (principally youth).Summer youthOlder Americans...
Outlays(millions of
dollars)
10,317.0
1, 890. 7
1, 345. 7545.0
8, 426. 3
5, 809.11, 794.9
672.0150.3
Person-years
(thousands)
1, 865. 3
487.8
350.2137.6
1, 377. 5
681.4403.5255.037.6
Source: Office of Management and Budget.
The extent to which these programs do in fact improve the inflation-unemployment tradeoff is not known. The observed increases in the earningsof participants in these programs arise from a combination of reducedunemployment and increased productivity, but the evidence necessary todetermine the importance of each factor is lacking. Under the assumptionthat half of the benefits to training come in the form of increased employ-ment and the other half from increased productivity, an additional $1 billionspent each year on training would, ignoring population growth, lower theunemployment rate, for a given degree of labor market tightness, by about0.05 percentage point after 5 years and slightly more thereafter. Accordingly,the scale of training programs would need to be many times greater thanit now is before it would have a significant impact on the unemployment rate.Moreover, it is likely that the average effectiveness of these programs interms of reducing unemployment would decline as they were expanded toreach a much wider portion of the population.
Training programs are a good investment, but on the basis of presentevidence their potential role is modest in relation to the total unemploy-ment problem.
173
248-947 O - 78 - 12
Digitized for FRASER http://fraser.stlouisfed.org/ Federal Reserve Bank of St. Louis

Public Service Employment
Since 1971 the principal emphasis of manpower policy has shifted fromtraining toward the direct provision of federally funded employment throughState and local government. This shift resulted partly from the slack labormarkets of most of the 1970s and partly from the lack of definitive evidenceconcerning the impact of training programs.
This Administration's first major economic action on taking office was topropose legislation, which the Congress enacted by mid-1977, calling for asubstantial expansion of PSE. During fiscal 1978 approximately $8.4 billionwill be spent on various forms of PSE. Under the enlarged programs anaverage of 1.4 million people will be employed over the year, a 60-percentincrease over the previous year. These jobs are supposedly targeted primarilytoward the low-income, long-term unemployed and unemployed youth.
The stated goals of PSE programs have been quite varied: countercyclicalstimulus, reduction of structural unemployment, and fiscal relief for hard-pressed local governments. For the present purposes, however, the secondof these objectives is of major interest. Can PSE programs help improve theinflation-unemployment tradeoff?
Two factors are involved in answering this question. First, in order tobe an effective instrument for mitigating structural unemployment, PSEprograms must concentrate on individuals who would have special diffi-culty obtaining employment in the private sector. If, for example, a cityhired accountants or registered nurses with its PSE funds, it would onlybe bidding them away from other jobs. Prior to the recent program expan-sion, adult participants in PSE programs came from approximately themiddle of the skill distribution. Relatively few of the structurally unem-ployed were reached.
Under the new programs for adults, eligibility is being progressively re-stricted to individuals who have been out of work for 15 of the last 20 weeks,and to those with low incomes prior to participating in the program. Takenin combination with the special projects requirement, these new eligibilityconditions are changing the PSE programs in such a way that they shouldnow serve more of the disadvantaged than formerly. Ignoring loop-holes in the law (for example, a local government can hire recent collegegraduates whom it would have hired anyway and still be within the pro-gram regulations), these eligibility requirements should also help to reducesubstitution of PSE funds for regular government revenues.
In periods of generally high employment, PSE programs for youthcan more easily be directed toward increasing public employment withouttightening the labor market for private employment. This is certainly truefor minority youth, who suffer extremely high unemployment rates. It maybe less true of programs for youth administered in largely white communi-ties, for the labor market for most white teenagers appears to work reason-
174
Digitized for FRASER http://fraser.stlouisfed.org/ Federal Reserve Bank of St. Louis
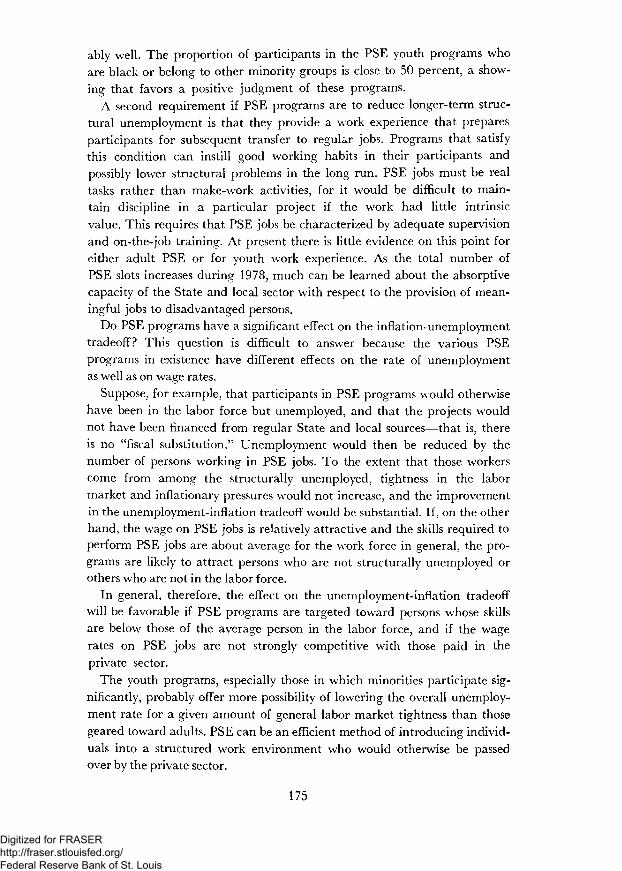
ably well. The proportion of participants in the PSE youth programs whoare black or belong to other minority groups is close to 50 percent, a show-ing that favors a positive judgment of these programs.
A second requirement if PSE programs are to reduce longer-term struc-tural unemployment is that they provide a work experience that preparesparticipants for subsequent transfer to regular jobs. Programs that satisfythis condition can instill good working habits in their participants andpossibly lower structural problems in the long run. PSE jobs must be realtasks rather than make-work activities, for it would be difficult to main-tain discipline in a particular project if the work had little intrinsicvalue. This requires that PSE jobs be characterized by adequate supervisionand on-the-job training. At present there is little evidence on this point foreither adult PSE or for youth wrork experience. As the total number ofPSE slots increases during 1978, much can be learned about the absorptivecapacity of the State and local sector with respect to the provision of mean-ingful jobs to disadvantaged persons.
Do PSE programs have a significant effect on the inflation-unemploymenttradeoff? This question is difficult to answer because the various PSEprograms in existence have different effects on the rate of unemploymentas well as on wage rates.
Suppose, for example, that participants in PSE programs w ould otherwisehave been in the labor force but unemployed, and that the projects wouldnot have been financed from regular State and local sources—that is, thereis no "fiscal substitution." Unemployment would then be reduced by thenumber of persons working in PSE jobs. To the extent that those workerscome from among the structurally unemployed, tightness in the labormarket and inflationary pressures would not increase, and the improvementin the unemployment-inflation tradeoff would be substantial. If, on the otherhand, the wage on PSE jobs is relatively attractive and the skills required toperform PSE jobs are about average for the work force in general, the pro-grams are likely to attract persons who are not structurally unemployed orothers who are not in the labor force.
In general, therefore, the effect on the unemployment-inflation tradeoffwill be favorable if PSE programs are targeted toward persons whose skillsare below those of the average person in the labor force, and if the wagerates on PSE jobs are not strongly competitive with those paid in theprivate sector.
The youth programs, especially those in which minorities participate sig-nificantly, probably offer more possibility of lowering the overall unemploy-ment rate for a given amount of general labor market tightness than thosegeared toward adults. PSE can be an efficient method of introducing individ-uals into a structured work environment who would otherwise be passedover by the private sector.
175
Digitized for FRASER http://fraser.stlouisfed.org/ Federal Reserve Bank of St. Louis
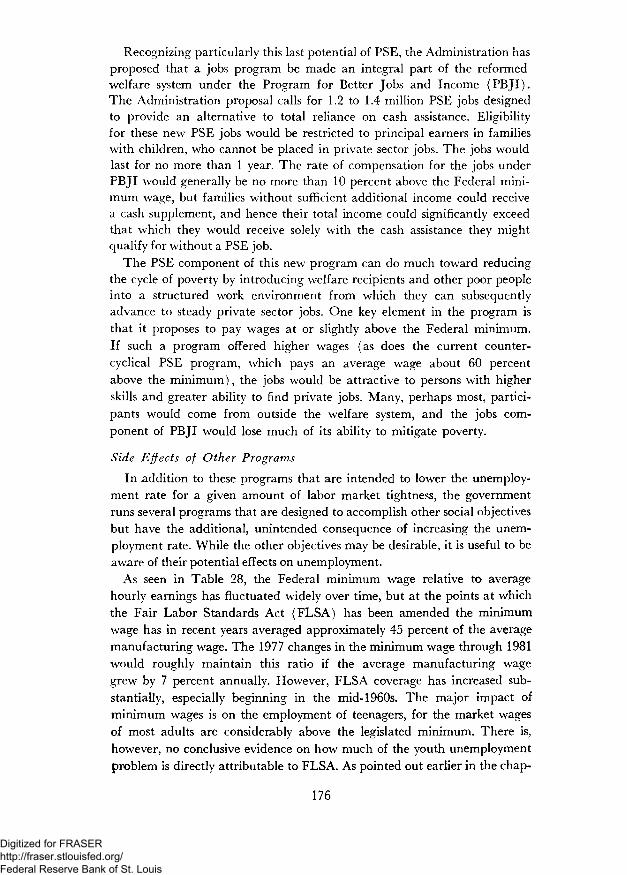
Recognizing particularly this last potential of PSE, the Administration hasproposed that a jobs program be made an integral part of the reformedwelfare system under the Program for Better Jobs and Income (PBJI).The Administration proposal calls for 1.2 to 1.4 million PSE jobs designedto provide an alternative to total reliance on cash assistance. Eligibilityfor these new PSE jobs would be restricted to principal earners in familieswith children, who cannot be placed in private sector jobs. The jobs wouldlast for no more than 1 year. The rate of compensation for the jobs underPBJI would generally be no more than 10 percent above the Federal mini-mum wage, but families without sufficient additional income could receivea cash supplement, and hence their total income could significantly exceedthat which they would receive solely with the cash assistance they mightqualify for without a PSE job.
The PSE component of this new program can do much toward reducingthe cycle of poverty by introducing welfare recipients and other poor peopleinto a structured work environment from which they can subsequentlyadvance to steady private sector jobs. One key element in the program isthat it proposes to pay wages at or slightly above the Federal minimum.If such a program offered higher wages (as does the current counter-cyclical PSE program, which pays an average wage about 60 percentabove the minimum), the jobs would be attractive to persons with higherskills and greater ability to find private jobs. Many, perhaps most, partici-pants would come from outside the welfare system, and the jobs com-ponent of PBJI would lose much of its ability to mitigate poverty.
Side Effects of Other Programs
In addition to these programs that are intended to lower the unemploy-ment rate for a given amount of labor market tightness, the governmentruns several programs that are designed to accomplish other social objectivesbut have the additional, unintended consequence of increasing the unem-ployment rate. While the other objectives may be desirable, it is useful to beaware of their potential effects on unemployment.
As seen in Table 28, the Federal minimum wage relative to averagehourly earnings has fluctuated widely over time, but at the points at whichthe Fair Labor Standards Act (FLSA) has been amended the minimumwage has in recent years averaged approximately 45 percent of the averagemanufacturing wage. The 1977 changes in the minimum wage through 1981would roughly maintain this ratio if the average manufacturing wagegrew by 7 percent annually. However, FLSA coverage has increased sub-stantially, especially beginning in the mid-1960s. The major impact ofminimum wages is on the employment of teenagers, for the market wagesof most adults are considerably above the legislated minimum. There is,however, no conclusive evidence on how much of the youth unemploymentproblem is directly attributable to FLSA. As pointed out earlier in the chap-
176
Digitized for FRASER http://fraser.stlouisfed.org/ Federal Reserve Bank of St. Louis
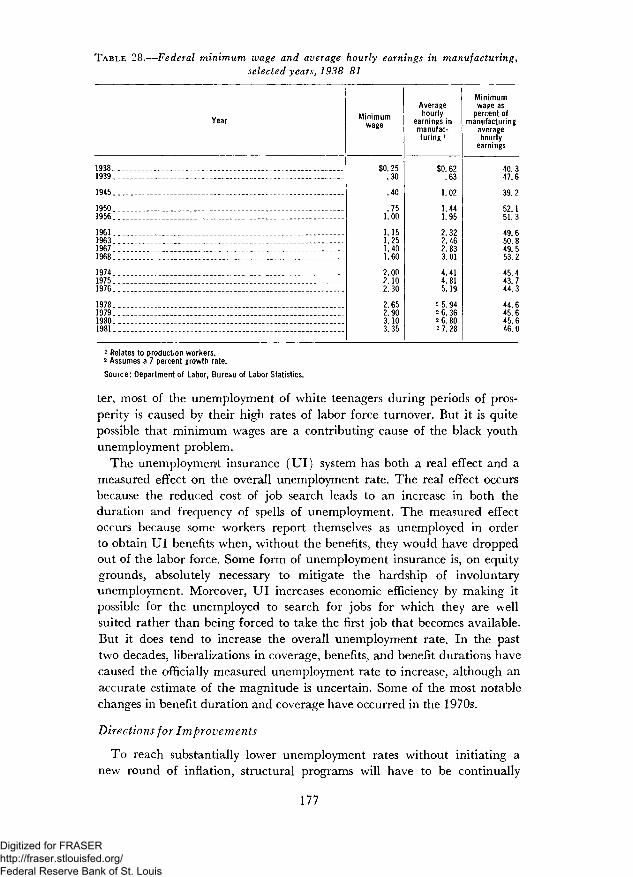
TABLE 28.—Federal minimum wage and average hourly earnings in manufacturing,selected years, 1938-81
19381939
1945
19501956
1961196319671968
197419751976
1978197919801981 . .
Year Minimumwage
$0.25.30
.40
.751.00
1.151 251.401.60
2.002 102.30
2.652.903 103.35
Averagehourly
earnings inmanufac-turing l
$0.62.63
1.02
1 441.95
2.322 462.833.01
4.414.815.19
2 5.942 6.362 6.802 7.28
Minimumwage as
percent ofmanufacturing
averagehourly
earnings
40.347.6
39.2
52 151.3
49.650 849.553.2
45.443 744.3
44.645.645.646.0
1 Relates to production workers.2 Assumes a 7 percent growth rate.
Source: Department of Labor, Bureau of Labor Statistics.
ter, most of the unemployment of white teenagers during periods of pros-perity is caused by their high rates of labor force turnover. But it is quitepossible that minimum wages are a contributing cause of the black youthunemployment problem.
The unemployment insurance (UI) system has both a real effect and ameasured effect on the overall unemployment rate. The real effect occursbecause the reduced cost of job search leads to an increase in both theduration and frequency of spells of unemployment. The measured effectoccurs because some workers report themselves as unemployed in orderto obtain UI benefits when, without the benefits, they would have droppedout of the labor force. Some form of unemployment insurance is, on equitygrounds, absolutely necessary to mitigate the hardship of involuntaryunemployment. Moreover, UI increases economic efficiency by making itpossible for the unemployed to search for jobs for which they are wellsuited rather than being forced to take the first job that becomes available.But it does tend to increase the overall unemployment rate. In the pasttwo decades, liberalizations in coverage, benefits, and benefit durations havecaused the officially measured unemployment rate to increase, although anaccurate estimate of the magnitude is uncertain. Some of the most notablechanges in benefit duration and coverage have occurred in the 1970s.
Directions for Improvements
To reach substantially lower unemployment rates without initiating anew round of inflation, structural programs will have to be continually
177
Digitized for FRASER http://fraser.stlouisfed.org/ Federal Reserve Bank of St. Louis
improved. The first priority is better targeting of the programs sothat they more effectively improve long-term job opportunities for thosegroups with the most severe structural unemployment problems. Althoughthe record is far from perfect, the training and employment programs foryouth have been fairly successful in this regard. Until recently, however,regular PSE programs for adults have not focused significantly on the struc-turally unemployed to the extent that they should. As the overall unem-ployment rate declines, employment and training programs should be care-fully directed demographically and geographically toward this goal.
Some demographic groups have high unemployment rates, even in periodsof generally tight labor markets, because many employers seek to hire newemployees only from among those applicants with prior experience and ahistory of job stability. The high cost of labor turnover to business firmsand the existence of wage floors or other barriers to hiring the inexperi-enced are major factors behind this tendency. Accordingly, one approachto reducing unemployment is to provide incentives for private employersto hire from among those groups with the most severe incidence of structuralunemployment. This approach is sometimes criticized because it wouldcause a substitution of low-skilled youths for highly skilled adults and thusraise the unemployment rates of adult males. This criticism, however,ignores the fact that such a program, if successful, could induce a greaterincrease in aggregate demand and thus lower the overall unemploymentrate. Moreover most occupations composed primarily of highly skilled adultshave very low unemployment rates in the first place and tend to adjustvery quickly to excess supply.
This country's experience with incentive schemes to hire the structurallyunemployed is not very extensive—although similar programs are quitecommon in Western Europe. Since five out of every six jobs in the economyare in the private sector, a successful labor market policy must rely prin-cipally on the private sector to enlarge job opportunities for the structurallyunemployed. To this end the Administration is currently designing a set ofoptions for programs under which employers will have incentives to hirepersons with severe unemployment difficulties.
A third priority for the improvement of labor market policy is the col-lection of better data that will permit an assessment of the extent to whichits component programs are actually having a beneficial impact. At presentour ability to lower unemployment without adding to inflation is severelyhampered by uncertainty about the effectiveness of various approaches.Evaluative research is not easy, but without such information it is difficultto justify major expansions of incumbent programs. A principal goal ofnew labor market programs, like those provided under the Youth Employ-ment and Demonstration Projects Act of 1977, is to find out whichapproaches are successful. This emphasis should be extended to otherprograms.
178
Digitized for FRASER http://fraser.stlouisfed.org/ Federal Reserve Bank of St. Louis