inferring the nature of the gene network connectivity dynamic modeling of gene expression data neal...
Post on 21-Dec-2015
218 views
TRANSCRIPT
Inferring the nature of the gene network connectivity
Dynamic modeling of gene expression dataNeal S. Holter, Amos Maritan, Marek Cieplak, Nina V. Fedoroff, and Jayanth R. Banavar
Topics in biophysics13.1.2009Effi Kenigbserg
Outline
Gene networks basics what can be measured
microarray technology - the explosion of dataset
Holter’s paper – trying to simplify the problem
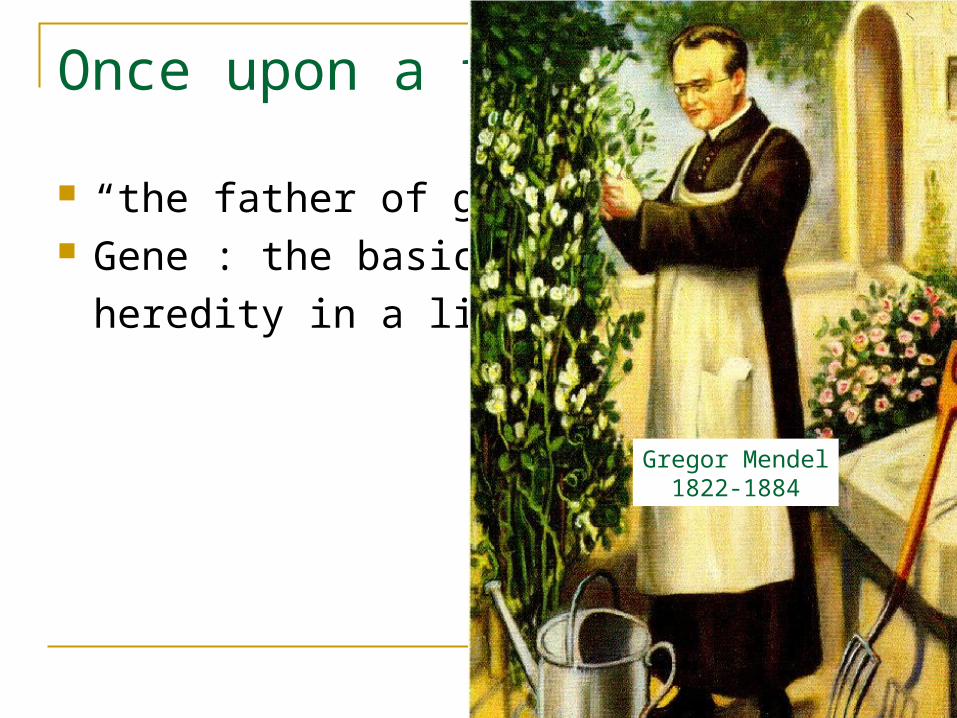
Once upon a time
“the father of genetics“ Gene : the basic unit of
heredity in a living organism
Gregor Mendel1822-1884
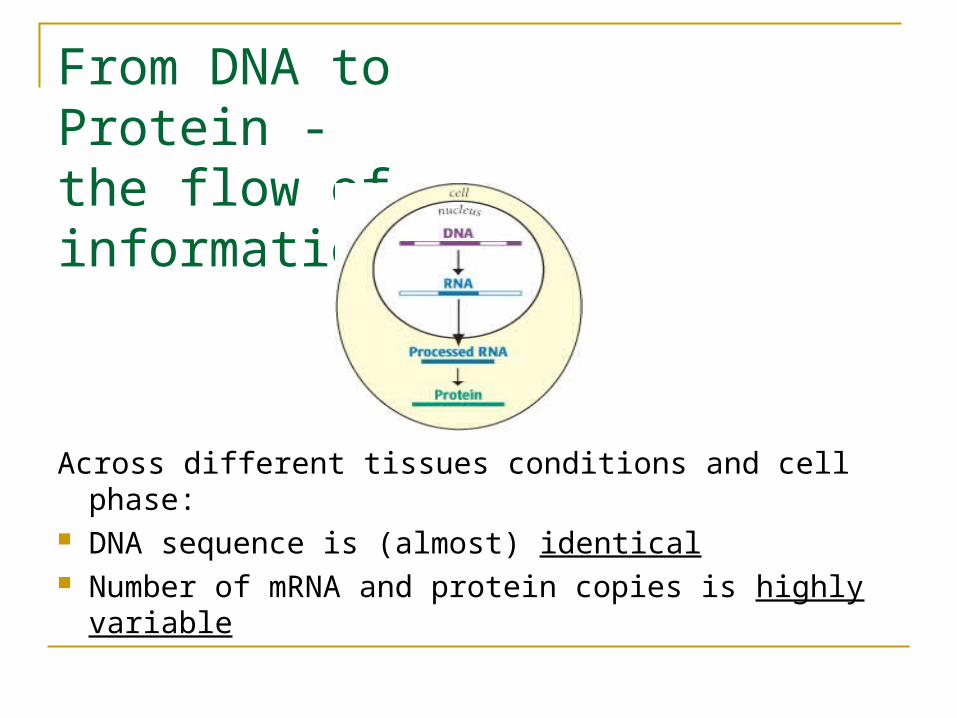
From DNA to Protein -the flow of information
Across different tissues conditions and cell phase: DNA sequence is (almost) identical Number of mRNA and protein copies is highly
variable
Cells within the same tissues and conditions show similar gene expression profiles Proteins are crucial functional units of the
living cell Cells that function similarly express similar
protein profiles
How is protein abundance regulated?
The key variables
Abundance (concentration) of proteins –high throughput measurement hasn’t been done yet.
mRNA expression - a fair predictor of protein abundance (r ~ 0.7 in yeast ).Before 1995, it was not practical.Now days it is relatively easy
How is mRNA expression measured?
Microarray technology
Allows detection of thousands of DNA molecules simultaneously
Two competing array type: Gene chip (DNA chip, Affymetrix chip) cDNA chip DNA microarray, two-channel array)
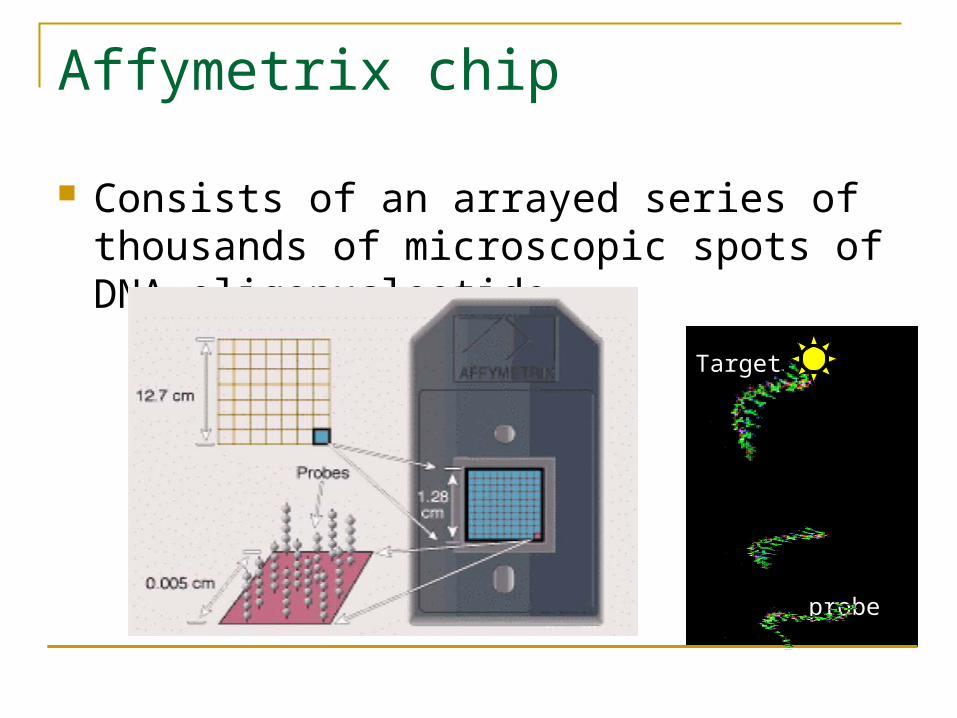
Affymetrix chip
Consists of an arrayed series of thousands of microscopic spots of DNA oligonucleotide
probe
Target

Making a labeled DNA from mRNA sample Extract mRNA from the cell Convert mRNA into colored cDNA
(complementary fluorescently labeled DNA) Hybridize cDNA with array Each cDNA sequence hybridizes (attaches)
specifically with the corresponding gene sequence in the array
Wash unhybridized cDNA off
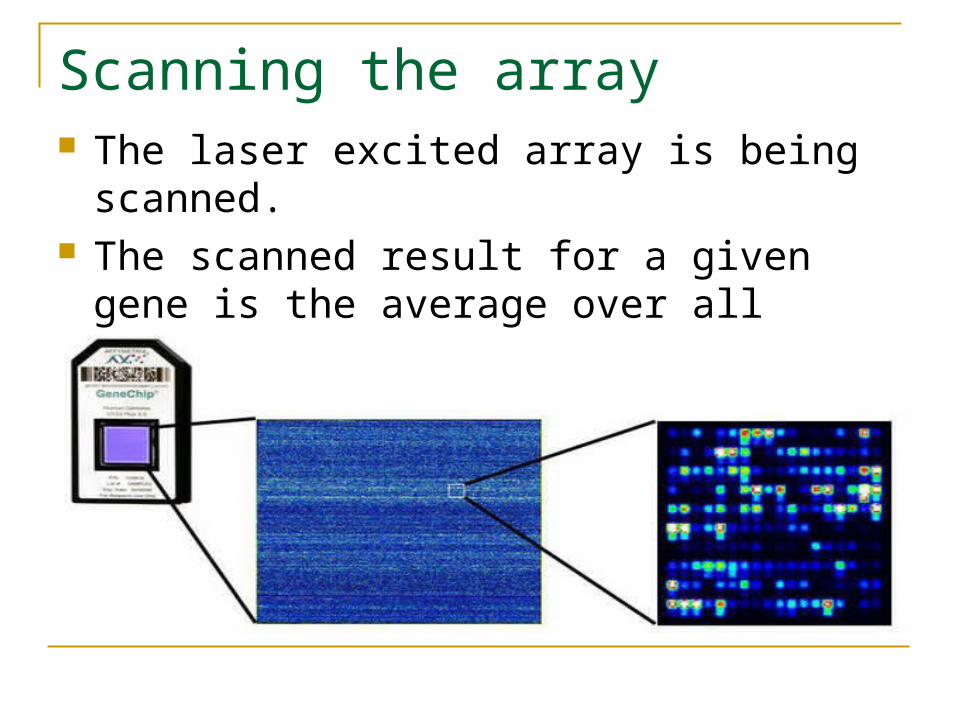
Scanning the array The laser excited array is being scanned. The scanned result for a given gene is the
average over all probes which correspond to this gene.

Analyzing the array scans
SCHENA, Brown, et al.
Data Explosion!
Hundred of thousands (or maybe millions?) microarray experiments are conducted every year
Will we ever understand this data?
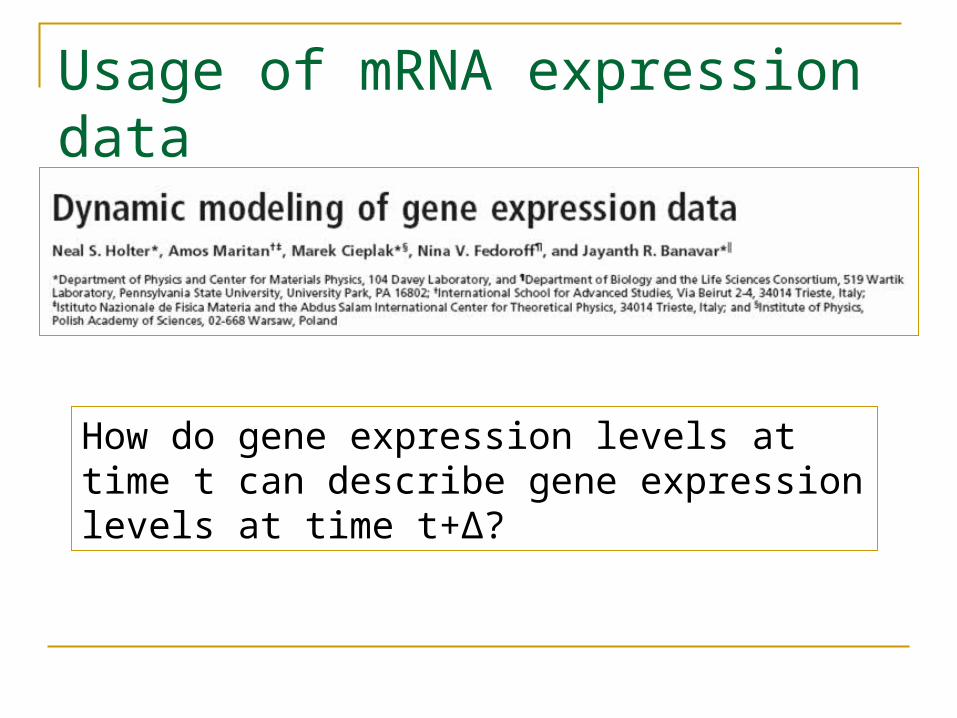
Usage of mRNA expression data
How do gene expression levels at time t can describe gene expression levels at time t+Δ?
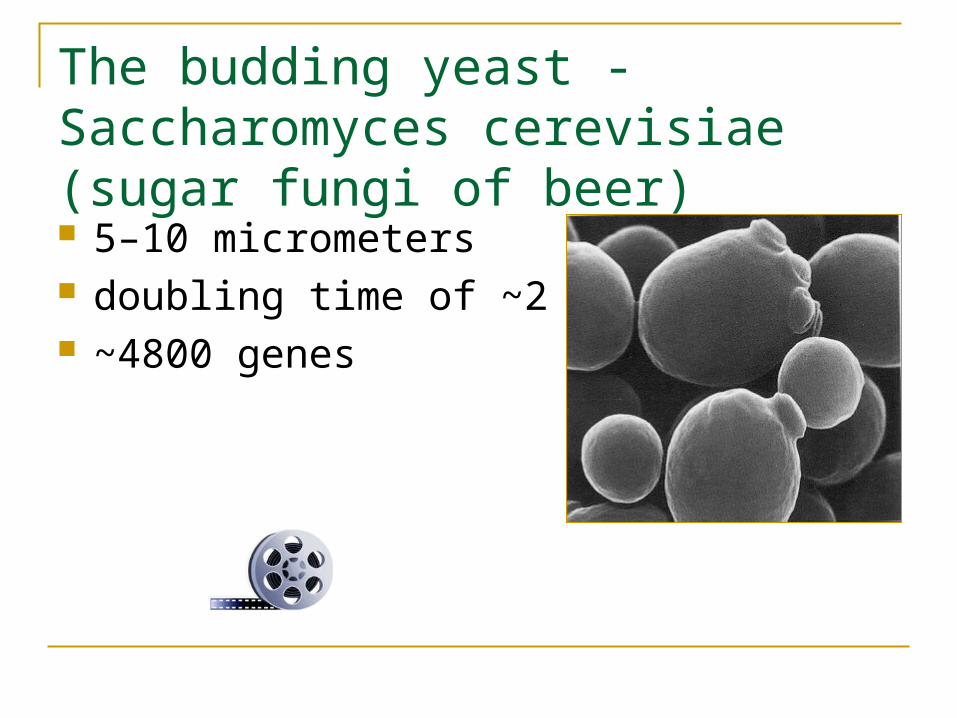
5–10 micrometers doubling time of ~2 hours ~4800 genes
The budding yeast - Saccharomyces cerevisiae (sugar fungi of beer)
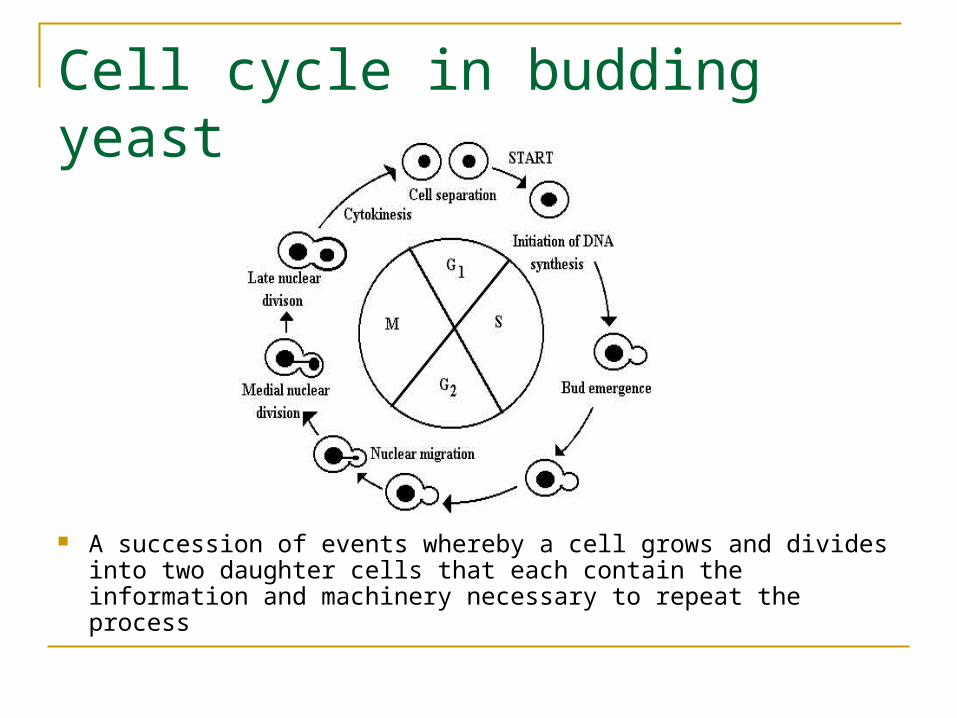
Cell cycle in budding yeast
A succession of events whereby a cell grows and divides into two daughter cells that each contain the information and machinery necessary to repeat the process
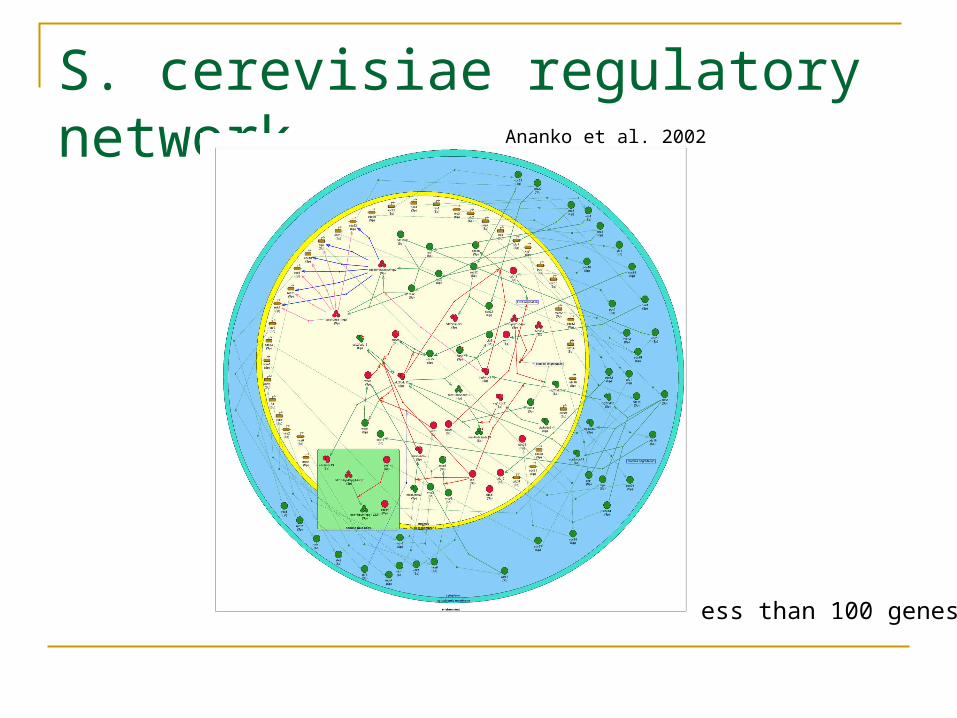
S. cerevisiae regulatory network
Less than 100 genes
Ananko et al. 2002
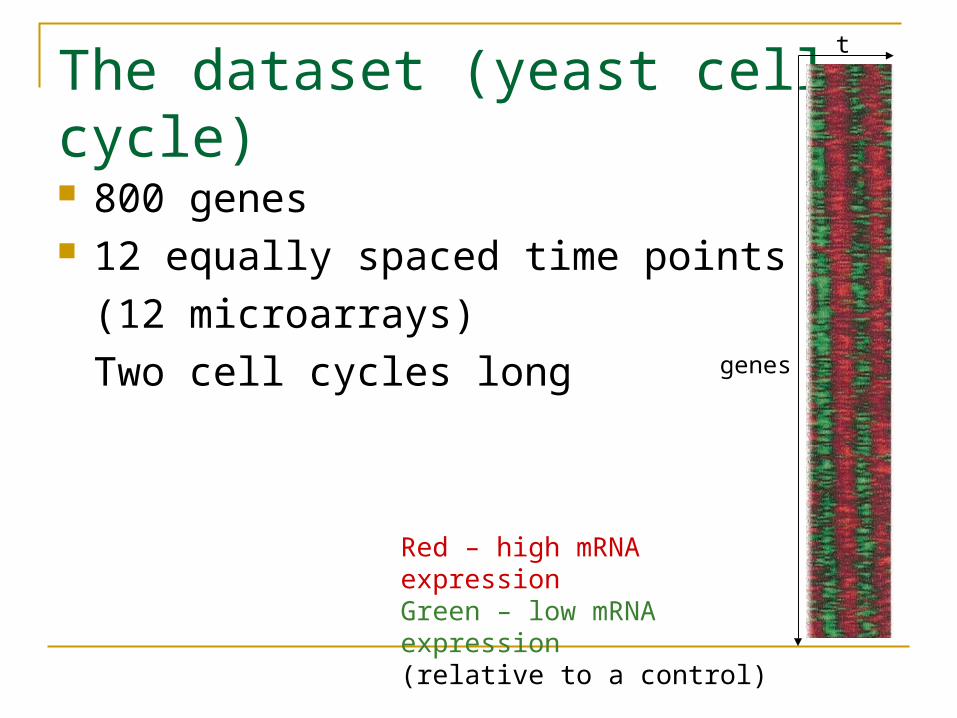
The dataset (yeast cell cycle)
800 genes 12 equally spaced time points
(12 microarrays)
Two cell cycles long genes
t
Red – high mRNA expressionGreen – low mRNA expression(relative to a control)
The linear interaction model
the expression levels of the n genes at a given time are postulated to be linear combinations of their levels at a previous time
In order to learn n² gene interactions,
n equations (time points) are needed
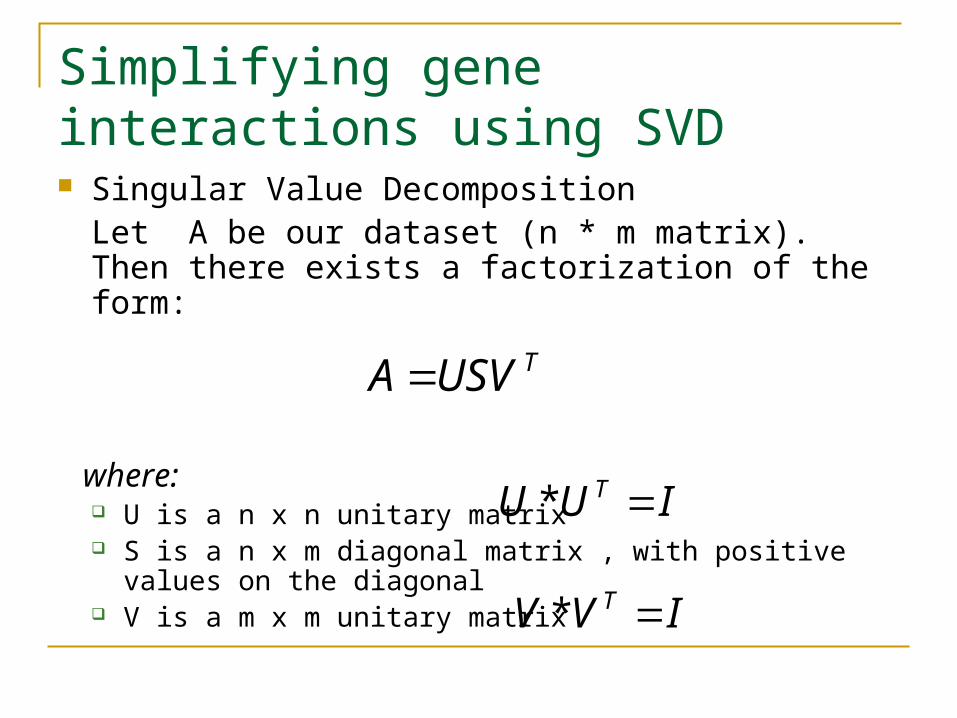
Simplifying gene interactions using SVD Singular Value Decomposition
Let A be our dataset (n * m matrix). Then there exists a factorization of the form:
where: U is a n x n unitary matrix S is a n x m diagonal matrix , with positive values on the
diagonal V is a m x m unitary matrix
TUSVA
IUU T *
IVV T *
S
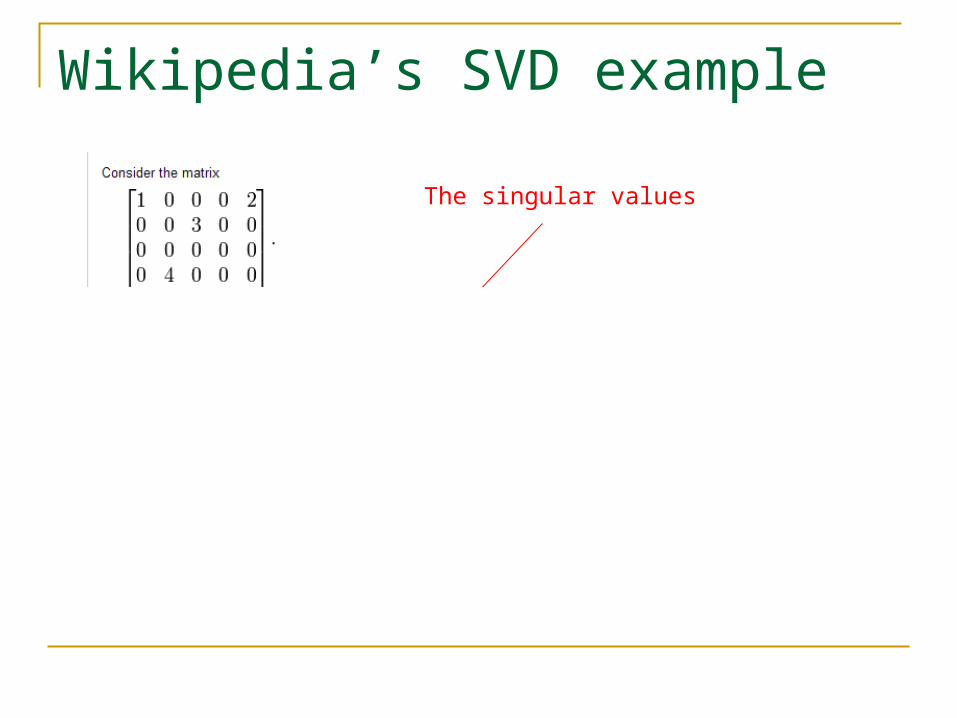
Wikipedia’s SVD example
The singular values

Using SVD
The modes: the first r rows of the matrix , i = 1..r r=number of singular values
Expression of each gene is a linear combination of the modes
r
iiijj tXUtA
1, )()(
iXTSV
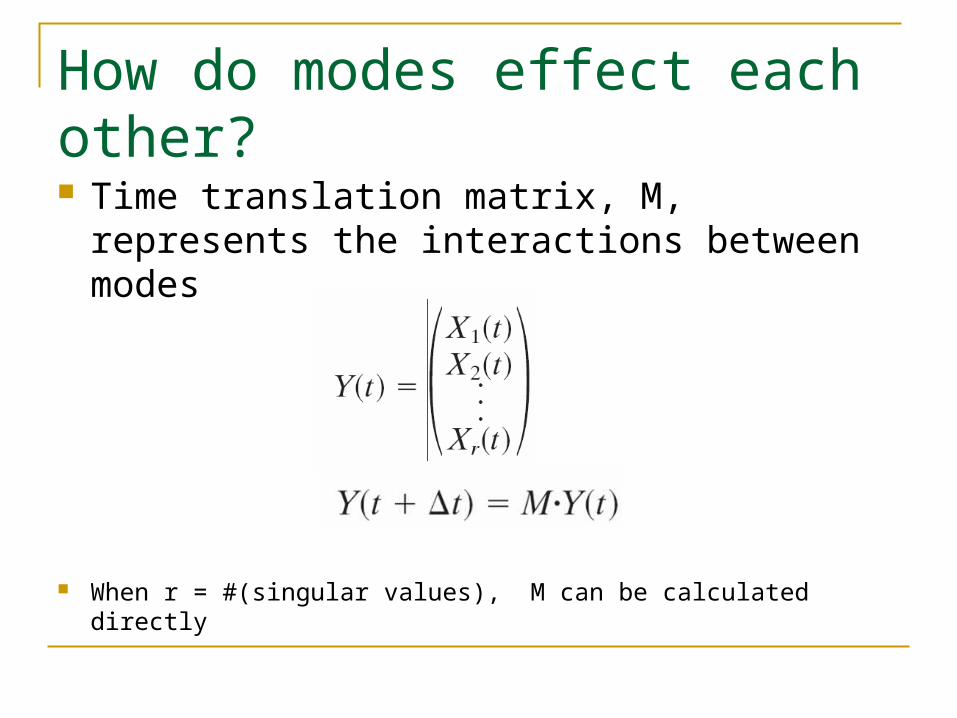
How do modes effect each other? Time translation matrix, M, represents the
interactions between modes
When r = #(singular values), M can be calculated directly
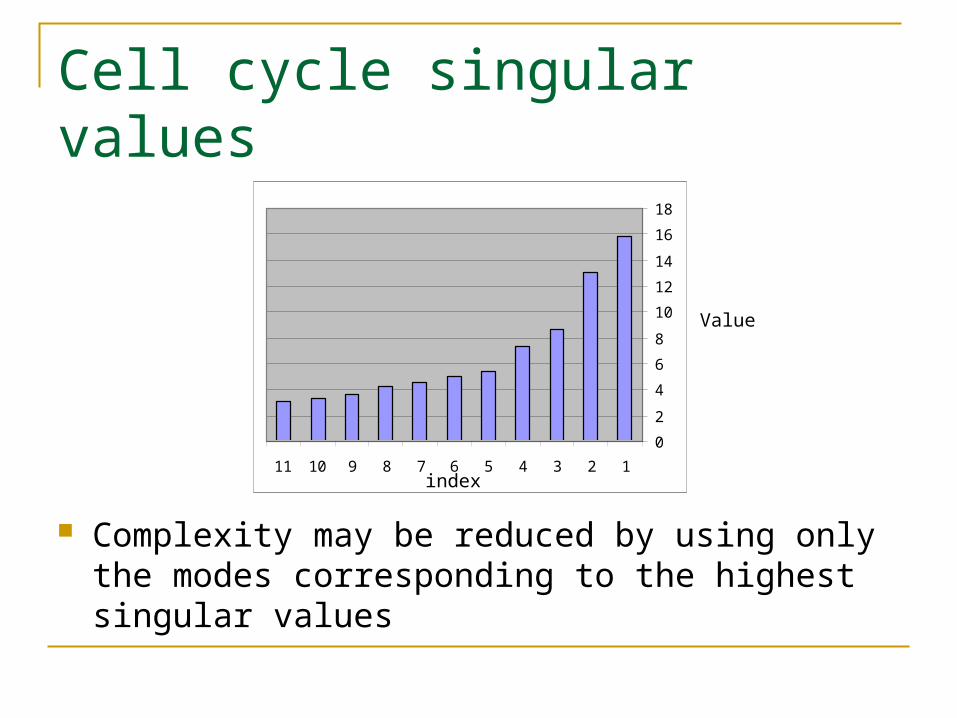
Cell cycle singular values
Complexity may be reduced by using only the modes corresponding to the highest singular values
0
2
4
6
8
10
12
14
16
18
1234567891011index
Value

Gene expression profile is well reconstructed using only 2 modes
The first two characteristic modes for the cell cycle data
o measured - approximated
Mode 1
Mode 2

Simplify gene interactions using clustering
Clustering genes by similarity and learning the interactions between clusters may simplify the problem
Spellman et al.
Alon, Barkai et al. 1999
Conclusions
Gene connectivity networks are highly redundant
It is possible to describe some of variability of huge biological datasets by simple interaction models
There is a lot of biological data out there