inferring microbial gene function from evolution of synonymous codon usage biases
TRANSCRIPT

Synonymous mutations - from
bacterial evolution to somatic changes in
human cancer
Fran Supek
1) Lehner group, CRG/EMBL Systems Biology Unit, Barcelona2) Division of Electronics, RBI, Zagreb, Croatia
XXI Jornades de Biologia MolecularBarcelona, 11.6.2014
Part 1: Inferring microbial gene function from evolution of codon biases.

synonymous mutations =changes in the gene sequencethat don’t alter the protein sequence

Synonymous mutations
• (some) synonymous mutations are subject to evolutionary pressures• clearly shown for many bacteria and yeasts• likely also higher Eukarya (but weaker signal)
• how does selection for/against synonymous changes relate to gene function in (a) evolution of bacteria and (b) in carcinogenesis?
evolutionary trace across ~1000 bacterial genomes somatic mutations in ~4000 human cancersmalignant transformationadaptation to diverse environments
( plush microbes in photos are from http://www.giantmicrobes.com/ )

• In what way can evolution of synoymous codon preference be used to systematically infer gene function in bacteria?
• There are other simpler (known) ways to determine gene function from the genome sequences:
• commonly/systematically applied: transfer of annotation via sequence similarity (BLAST, COG, Pfam...)
• >30% of genes end up with no known function annotated. They may not have known homologs, or their homologs may have no experimentally determined function.
• known but less common: genomic context methods, such as phyletic profiling
evolutionary trace across ~1000 bacterial genomesadaptation to diverse environments
( plush microbes in photos are from http://www.giantmicrobes.com/ )

Phyletic (or phylogenetic) profiling
Pellegrini, Marcotte et al., PNAS (1999)
one genomic context method:
examines presence/absence patterns of homologous genes across species.

Kensche et al. (2008) J Royal Soc Interface. ~30 examples of success of phyletic profiling
• by 2008 -> n~=30
• by 2014 -> n~=300 (estimate)
• aim for: N > 3000

Enriching phyletic profileswith information on orthology and paralogy
orthologs in cliquesorth. outside cliquesparalogs
groups of orthologs from OMA database:Schneider, Dessimoz and Gonnet (2007) Bioinformatics
Skunca et al. PLoS Comp Biology 2013doi:10.1371/journal.pcbi.1002852

Accuracy of predicting GO categories strongly increases when adding paralogs
+ paralogs + orthologs(outside clique)
+ para + orthoclique only
(bubbles are Gene Ontology categories)

Supervised machine learning is superior to common approaches based on pairwise distances
Based on correlationof profiles
AUC
(are
a un
der
ROC
curv
e)
Decision trees
Schietgat et al. 2010. BMC Bioinfo

Experimental validation of predictions made with phyletic profiling
• knockout mutants of E. coli in predicted genes• three selected GO categories targeted by particular antibiotics:
• ‘response to DNA damage’• ‘translation’• ‘peptidoglycan-based cell wall biogenesis’
• predictions: 38 genes with expected precision > 60%

inhibitstranslationinitiation
inhibits cell wall synthesis
DNA damaging
agent

Does this gene participate in ‘peptidoglycan-based cell wall biogenesis’ ?

Does this gene participate in ‘peptidoglycan-based cell wall biogenesis’ ?
25/38 validated predictions (experimental precision = 66%; theoretically expected = 60%)Þ our method is useful for prioritizing genes for experimentally
determining gene function


“We predict Gene Ontology annotations ... for about 1.3 million poorly annotated genes in 998 prokaryotes at a stringent threshold of 90% Precision...”
“...about 19000 of those are highly specific functions.”
published in:Skunca et al. PLoS Comp Biology 2013doi:10.1371/journal.pcbi.1002852

• Codon usage biases are another useful source of evolutionary information
• ... complementary to gene presence/absence• ... available from just the genome sequence• ... with an established biological rationale

tRNA levels and codon usage biases
E. coli K-12, tRNA gene counts (proxy for tRNA levels)
codon
anticodon
Commonly used codons typically correspond to abundant tRNAs, particularly in highly expressed genes.

Codon biases correlate to gene expression
0.5
1
1.5
2
2.5
0.5 1 1.5 2 2.5 3 3.5
MIL
C (n
on-R
P ge
nes)
MILC (ribosomal protein genes)
ribosomal protein genes other highly expressed genes rest of genome
B
Figure fromSupek and Vlahoviček (2005) BMC Bioinformaticsdoi:10.1186/1471-2105-6-182
E. coli genome

• organisms adapt to the environment through changes in translation efficiency?
• Carbone A (2005) J Mol Evol – codon adaptation in metabolic pathways:
Photosynthesis genes in Synechocystis
Methanogenesis genes in Methanosarcina
Archaea
Bacteria

An example phenotype: oxygen requirement
• Man & Pilpel (2007) Nat Genet: 9 yeasts
TCA cycle glycolysis
aerobic anaerobic (low) codon adaptation (high)
• Based on these examples, we aimed to systematically link:• Many environments/phenotypes, with
• evolutionary change in translation efficiency across many gene families

Measuring translation efficiency
Method fromSupek et al. (2010)PLoS Geneticsdoi:10.1371/journal.pgen.1001004
non-HE HE
4-20% of genome
Expression levels: microarrayson 19 diverse bacteria
01234
log 2
expr
essio
n ra
tio
OCU/non-OCU, from ref. [7] HE/non-HE ribosomal proteins/all genes
gene 1
intergenicDNA
codonusage
all otherproteingenes
highly expressed
genes *
increasein
probability after adding
codon usage?
classifier predicts probability:
expr.
A
gene1
gene2
gene3
* ribosome, translationelongation factors, chaperones
vs.
B
C
3.9x6.0x

Correlation vs. causality?
a randomization test to control for confounding phenotypes and phylogeny
This passes the randomization test:
This fails (association not unique):
associations between phenotypes, and also with phylogeny:

• 514 aerotolerant vs. 214 aerointolerant:
295 COGs are significantly enrichedwith HE genes
• obligate vs. facultative aerobes:
• thermophiles
• halophiles
+ 20 other phenotypes tested
control for confounders 23 COGs
11 COGs
16 COGs
6 COGs
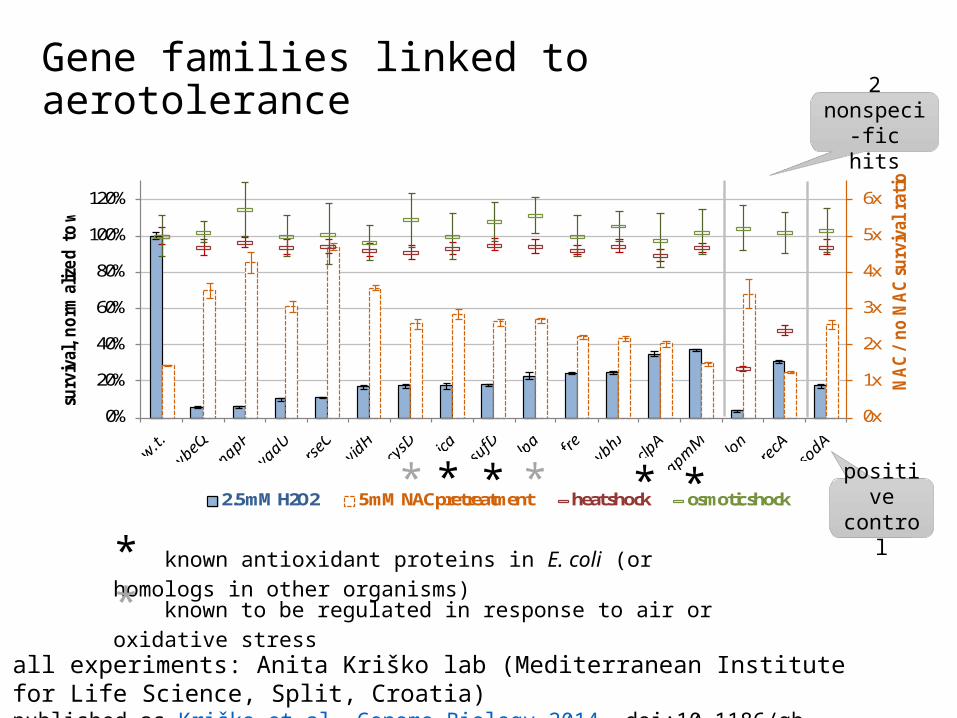
Gene families linked to aerotolerance
all experiments: Anita Kriško lab (Mediterranean Institute for Life Science, Split, Croatia)published as Kriško et al, Genome Biology 2014. doi:10.1186/gb-2014-15-3-r44
0%
20%
40%
60%
80%
100%
120%
w.t
.yj
jBflg
Hcy
sGm
nmA
nlpE
proX
osmotic oxidative heat
C
0%
20%
40%
60%
80%
100%
120%
w.t
.cl
pSop
pA tig
ssuD
nudF
pnp
typA
mng
Rls
rRye
bSrh
lEya
jLpy
kFdt
deu
tDgl
oByf
cAm
arR
yccX
pncB
ttdB
moa
Ads
bB
surv
ival
, no
rmal
ize
d to
w.t
.
heat oxidative osmotic
B
0x
1x
2x
3x
4x
5x
6x
0%
20%
40%
60%
80%
100%
120%
NA
C /
no
NA
C s
urv
ival
rati
o
surv
ival
, n
orm
aliz
ed
to
w.t
.
2.5 mM H2O2 5 mM NAC pretreatment heat shock osmotic shock
A
** ** **
* known antioxidant proteins in E. coli (or homologs in other organisms)
* known to be regulated in response to air or oxidative stress
positive control
2 nonspeci-fic hits
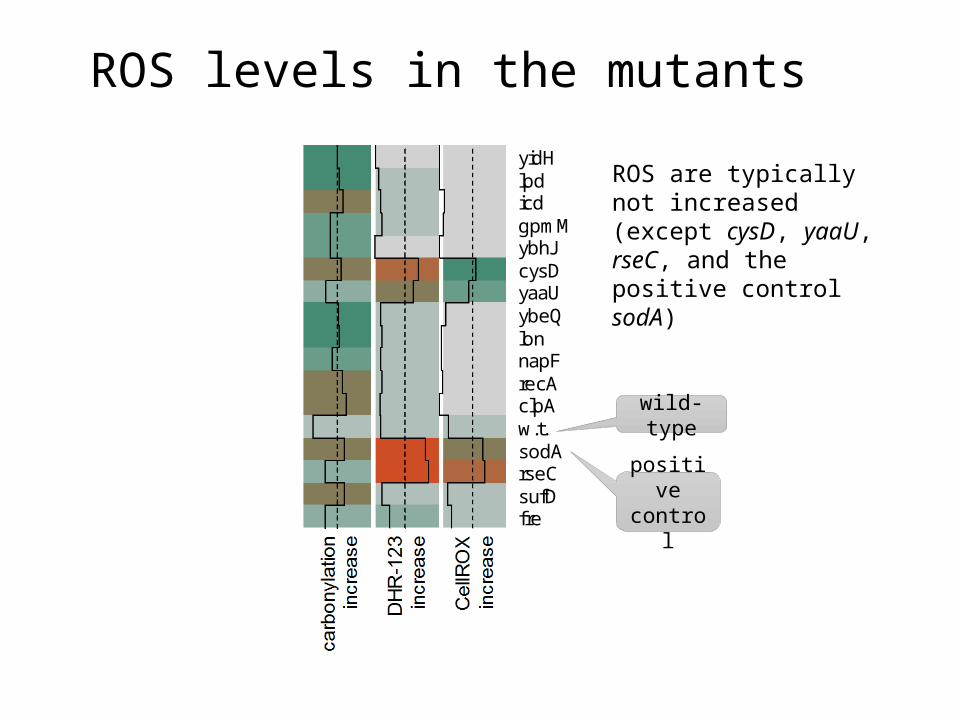
ROS levels in the mutantsca
rbo
nyl
atio
nin
cre
ase
DH
R-1
23
incr
ea
se
Ce
llRO
Xin
cre
ase
tota
lF
ein
cre
ase
dip
yrid
ylre
scu
e
NA
DP
Hle
vel
incr
ea
se
NA
DP
Hre
scu
e
fresufDrseCsodAw.t.clpArecAnapFlonybeQyaaUcysDybhJgpmMicdlpdyidH
0 0.4 0.8
positive control
wild-type
ROS are typically not increased (except cysD, yaaU, rseC, and the positive control sodA)

Predicted functional interactions from STRING v9
Gene families whose codon biases are associated to aerobicity/aerotolerance:

Putative mechanisms of oxidative stress resistance
NAD(P)Hrelated
iron-related
unknown
all experiments: Anita Kriško lab (Mediterranean Institute for Life Science, Split, Croatia)published as Kriško et al, Genome Biology 2014. doi:10.1186/gb-2014-15-3-r44
carb
onyl
ation
incr
ease
DH
R-12
3in
crea
se
CellR
OX
incr
ease
tota
l Fe
incr
ease
dipy
ridyl
resc
ue
NAD
PH le
vel
decr
ease
exog
enou
s N
ADPH
resc
ue

0%
20%
40%
60%
80%
100%
120%
w.t
.yj
jBflg
Hcy
sGm
nmA
nlpE
proX
osmotic oxidative heat
C
0%
20%
40%
60%
80%
100%
120%
w.t
.cl
pSop
pA tig
ssuD
nudF
pnp
typA
mng
Rls
rRye
bSrh
lEya
jLpy
kFdt
deu
tDgl
oByf
cAm
arR
yccX
pncB
ttdB
moa
Ads
bB
surv
ival
, no
rmal
ize
d to
w.t
.
heat oxidative osmotic
B
0x
1x
2x
3x
4x
5x
6x
0%
20%
40%
60%
80%
100%
120%
NA
C /
no
NA
C s
urv
ival
rati
o
surv
ival
, n
orm
aliz
ed
to
w.t
.
2.5 mM H2O2 5 mM NAC pretreatment heat shock osmotic shock
A
Other phenotypes: thermophilicity, halophilicity
Knockout of candidate genes affects heat shock resistance and osmotic shock resistance.

Validation using synthetic genes with introduced suboptimal codons
0%
5%
10%
15%
20%
25%
30%
w.t. ΔclpS ΔclpS + clpS_w.t.
ΔclpS + clpS_15
ΔclpS + clpS_20
ΔclpS + clpS_25
% s
urv
ival
0
0.1
0.2
0.3
0.4
0.5
0.6
0 0.5 1 1.5 2 2.5
rela
tive
fre
qu
en
cy
codon distance (MILC) to ribosomal protein genes
ribosomal protein genesall other E. coli genes
w.t.
1520 25
w.t.
21 28 35
yjjB
clpS
0%
5%
10%
15%
20%
25%
30%
w.t. ΔyjjB ΔyjjB + yjjB_w.t.
ΔyjjB + yjjB_21
ΔyjjB + yjjB_28
ΔyjjB + yjjB_35
% s
urv
ival
osmotic shock
heat shockC
DB
A
all experiments: Anita Kriško lab (Mediterranean Institute for Life Science, Split, Croatia)published as Kriško et al, Genome Biology 2014. doi:10.1186/gb-2014-15-3-r44

Overall
• 200 links between 187 different COG gene families
- and -
24 diverse phenotypic traits, including• spore-forming ability• motility• pathogenicity to plants or mammals
• affecting certain tissues/organs
• (1000s more predictions at less stringent thresholds)
Anita Kriško lab – MediterraneanInstitute for Life Sciences (MedILS)Split, Croatia.
all experimentalwork shown
Nives Škunca ETH Zurich.
Phyletic profiling,
GORBI


Thank you!
Fran Supek
1) Lehner group, CRG/EMBL Systems Biology Unit, Barcelona2) Division of Electronics, RBI, Zagreb, Croatia
XXI Jornades de Biologia MolecularBarcelona, 11.6.2014
End of Part 1. Part 2 deals with causal synonymous mutations inhuman cancer genomes, and is available separately.