inferring gene regulatory networks from time-course gene
TRANSCRIPT
Inferring Gene Regulatory Networks fromTime-Course Gene Expression Data
Camille Charbonnier and Julien Chiquet and Christophe Ambroise
Laboratoire Statistique et Genome,La genopole - Universite d’Evry
JOBIM – 7-9 septembre 2010
Camille Charbonnier and Julien Chiquet and Christophe Ambroise 1

Problem
t0t1
tn
≈ 10s microarrays over time
≈ 1000s probes (“genes”)
Inference
Which interactions?
The main statistical issue is the high dimensional setting.
Camille Charbonnier and Julien Chiquet and Christophe Ambroise 2
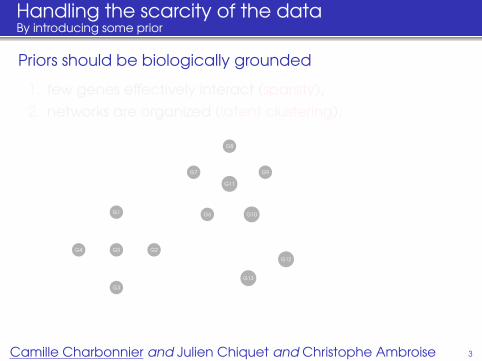
Handling the scarcity of the dataBy introducing some prior
Priors should be biologically grounded
1. few genes effectively interact (sparsity),2. networks are organized (latent clustering),
G1
G2
G3
G4 G5
G6
G7
G8
G9
G10
G11
G12
G13
Camille Charbonnier and Julien Chiquet and Christophe Ambroise 3

Handling the scarcity of the dataBy introducing some prior
Priors should be biologically grounded
1. few genes effectively interact (sparsity),2. networks are organized (latent clustering),
G1
G2
G3
G4 G5
G6
G7
G8
G9
G10
G11
G12
G13
Camille Charbonnier and Julien Chiquet and Christophe Ambroise 3

Handling the scarcity of the dataBy introducing some prior
Priors should be biologically grounded
1. few genes effectively interact (sparsity),2. networks are organized (latent clustering),
A1
A2
A3
A4 A
B1
B2
B3
B4
B5
B
C1
C
Camille Charbonnier and Julien Chiquet and Christophe Ambroise 3

Outline
Statistical modelsGaussian Graphical Model for Time-course dataStructured Regularization
Algorithms and methodsOverall viewModel selection
Numerical experimentsInference methodsPerformance on simulated dataE. coli S.O.S DNA repair network
Camille Charbonnier and Julien Chiquet and Christophe Ambroise 4
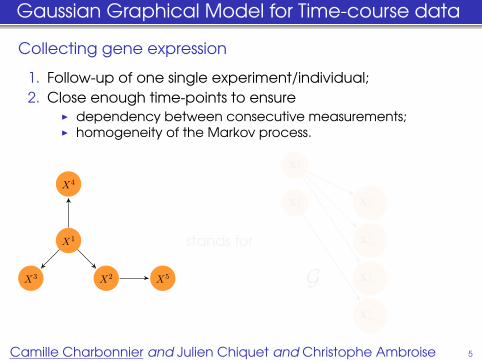
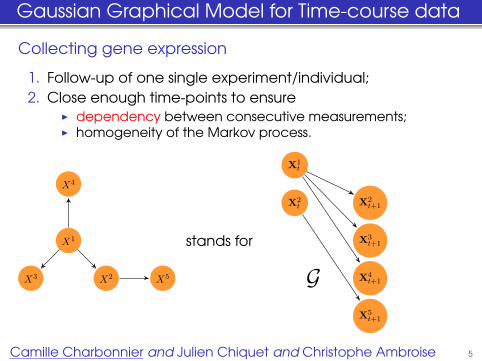
Gaussian Graphical Model for Time-course data
Collecting gene expression
1. Follow-up of one single experiment/individual;2. Close enough time-points to ensure
I dependency between consecutive measurements;I homogeneity of the Markov process.
X1
X2X3
X4
X5
stands for
X1t
X2t X2
t+1
X3t+1
X4t+1G
X5t+1
Camille Charbonnier and Julien Chiquet and Christophe Ambroise 5

Gaussian Graphical Model for Time-course data
Collecting gene expression
1. Follow-up of one single experiment/individual;2. Close enough time-points to ensure
I dependency between consecutive measurements;I homogeneity of the Markov process.
X1t X1
2. . . X1
n
X21 X2
2. . . X2
n
X31 X3
2. . . X3
n
X41 X4
2. . . X4
n
G G GX5
1 X52
. . . X5n
Camille Charbonnier and Julien Chiquet and Christophe Ambroise 5

Gaussian Graphical Model for Time-Course data
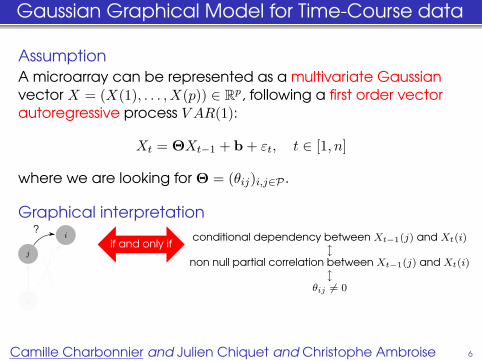
AssumptionA microarray can be represented as a multivariate Gaussianvector X = (X(1), . . . , X(p)) ∈ Rp, following a first order vectorautoregressive process V AR(1):
Xt = ΘXt−1 + b + εt, t ∈ [1, n]
where we are looking for Θ = (θij)i,j∈P .
Graphical interpretationconditional dependency between Xt−1(j) and Xt(i)
lnon null partial correlation between Xt−1(j) and Xt(i)
lθij 6= 0
if and only ifi
j
k
Camille Charbonnier and Julien Chiquet and Christophe Ambroise 6
Gaussian Graphical Model for Time-Course data
AssumptionA microarray can be represented as a multivariate Gaussianvector X = (X(1), . . . , X(p)) ∈ Rp, following a first order vectorautoregressive process V AR(1):
Xt = ΘXt−1 + b + εt, t ∈ [1, n]
where we are looking for Θ = (θij)i,j∈P .
Graphical interpretationconditional dependency between Xt−1(j) and Xt(i)
lnon null partial correlation between Xt−1(j) and Xt(i)
lθij 6= 0
if and only ifi
j
?
k
Camille Charbonnier and Julien Chiquet and Christophe Ambroise 6
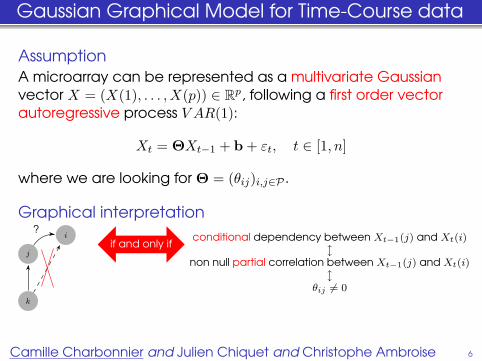

Gaussian Graphical Model for Time-course data
LetI X be the n× p matrix whose kth row is Xk,I S = n−1Xᵀ
\nX\n be the within time covariance matrix,
I V = n−1Xᵀ\nX\0 be the across time covariance matrix.
The log-likelihood
Ltime(Θ; S,V) = n Trace (VΘ)− n
2Trace (ΘᵀSΘ) + c.
Maximum Likelihood Estimator ΘMLE = S−1VI not defined for n < p;I even if n > p, requires multiple testing.
Camille Charbonnier and Julien Chiquet and Christophe Ambroise 7

Structured regularization`1 penalized log-likelihood
Charbonnier, Chiquet, Ambroise, SAGMB 2010
Θλ = arg maxΘ
Ltime(Θ; S,V)− λ ·∑i,j∈P
PZij |Θij |
where λ is an overall tuning parameter and PZ is a(non-symmetric) matrix of weights depending on the underlyingclustering Z.
It performs1. regularization (needed when n� p),2. selection (specificity of the `1-norm),3. cluster-driven inference (penalty adapted to Z).
Camille Charbonnier and Julien Chiquet and Christophe Ambroise 8

Structured regularization“Bayesian” interpretation of `1 regularization
Laplacian prior on Θ depends on the clustering Z
P(Θ|Z) ∝∏i,j
exp{−λ ·PZ
ij · |Θij |}.
PZ summarizes prior information on the position of edges
-1.0 -0.5 0.0 0.5 1.0
0.2
0.4
0.6
0.8
1.0
Θij
prio
rdi
stri
buti
on
λPZij = 1
λPZij = 2
Camille Charbonnier and Julien Chiquet and Christophe Ambroise 9
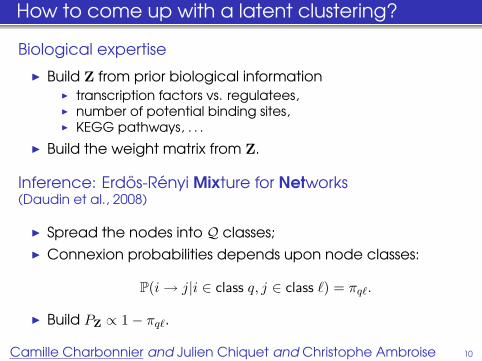
How to come up with a latent clustering?
Biological expertise
I Build Z from prior biological informationI transcription factors vs. regulatees,I number of potential binding sites,I KEGG pathways, . . .
I Build the weight matrix from Z.
Inference: Erdos-Renyi Mixture for Networks(Daudin et al., 2008)
I Spread the nodes into Q classes;I Connexion probabilities depends upon node classes:
P(i→ j|i ∈ class q, j ∈ class `) = πq`.
I Build PZ ∝ 1− πq`.
Camille Charbonnier and Julien Chiquet and Christophe Ambroise 10

Algorithm
SIMoNESuppose you want to recover a clustered network:
Target Adjacency Matrix
Graph
Target Network
Camille Charbonnier and Julien Chiquet and Christophe Ambroise 11

Algorithm
SIMoNEStart with microarray data
Data
Camille Charbonnier and Julien Chiquet and Christophe Ambroise 11

Algorithm
SIMoNE
DataAdjacency Matrix
corresponding to G?
Inference without prior
Camille Charbonnier and Julien Chiquet and Christophe Ambroise 11

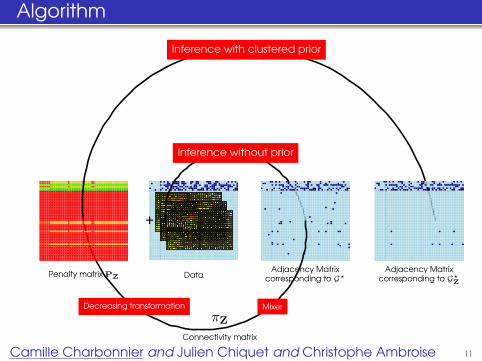
Algorithm
SIMoNE
DataAdjacency Matrix
corresponding to G?
Inference without prior
πZ
Connectivity matrix
Mixer
Penalty matrix PZ
Decreasing transformation
Camille Charbonnier and Julien Chiquet and Christophe Ambroise 11
Algorithm
SIMoNE
DataAdjacency Matrix
corresponding to G?
Inference without prior
πZ
Connectivity matrix
Mixer
Penalty matrix PZ
Decreasing transformation
Adjacency Matrixcorresponding to G?
Z
+
Inference with clustered prior
Camille Charbonnier and Julien Chiquet and Christophe Ambroise 11
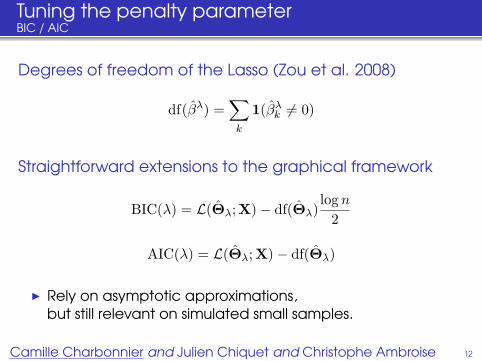
Tuning the penalty parameterBIC / AIC
Degrees of freedom of the Lasso (Zou et al. 2008)
df(βλ) =∑k
1(βλk 6= 0)
Straightforward extensions to the graphical framework
BIC(λ) = L(Θλ; X)− df(Θλ)log n
2
AIC(λ) = L(Θλ; X)− df(Θλ)
I Rely on asymptotic approximations,but still relevant on simulated small samples.
Camille Charbonnier and Julien Chiquet and Christophe Ambroise 12

Inference methods
1. Lasso (Tibshirani)
2. Adaptive Lasso (Zou et al.)Weights inversely proportional to an initial Lasso estimate.
3. KnwClWeights structured according to true clustering.
4. InfClWeights structured according to inferred clustering.
5. Renet-VAR (Shimamura et al.)Edge estimation based on a recursive elastic net.
6. G1DBN (Lebre et al.)Edge estimation based on dynamic Bayesian networks followed by statistical
testing of edges.
7. Shrinkage (Opgen-Rhein et al.)Edge estimation based on shrinkage followed by multiple testing local false
discovery rate correction.
Camille Charbonnier and Julien Chiquet and Christophe Ambroise 13
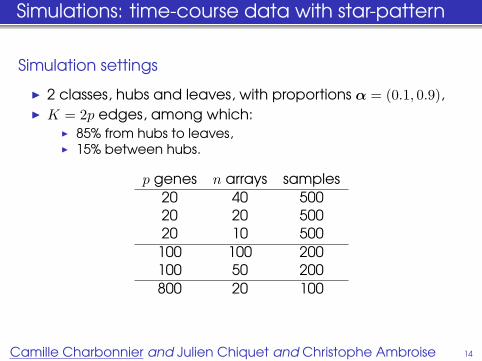
Simulations: time-course data with star-pattern
Simulation settings
I 2 classes, hubs and leaves, with proportions α = (0.1, 0.9),I K = 2p edges, among which:
I 85% from hubs to leaves,I 15% between hubs.
p genes n arrays samples20 40 50020 20 50020 10 500
100 100 200100 50 200800 20 100
Camille Charbonnier and Julien Chiquet and Christophe Ambroise 14
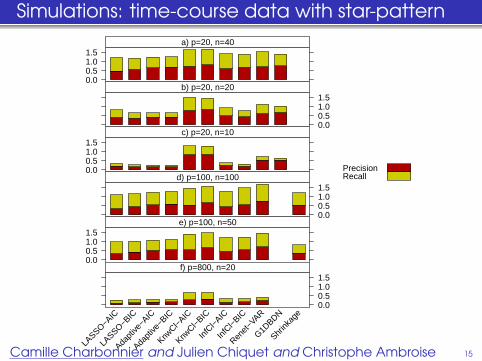
Simulations: time-course data with star-pattern
0.00.51.01.5
a) p=20, n=40
0.00.51.01.5
b) p=20, n=20
0.00.51.01.5
c) p=20, n=10
0.00.51.01.5
d) p=100, n=100
0.00.51.01.5
e) p=100, n=50
LASSO−A
IC
LASSO−B
IC
Adapt
ive−A
IC
Adapt
ive−B
IC
KnwCl−A
IC
KnwCl−B
IC
InfC
l−AIC
InfC
l−BIC
Renet
−VAR
G1DBDN
Shrink
age
0.00.51.01.5
f) p=800, n=20
PrecisionRecall
Camille Charbonnier and Julien Chiquet and Christophe Ambroise 15
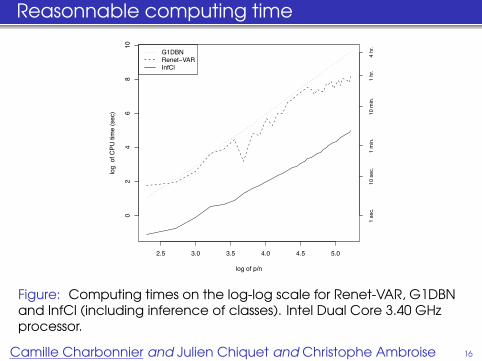
Reasonnable computing time
2.5 3.0 3.5 4.0 4.5 5.0
02
46
810
CPU time (log scale)
log of p/n
log
of C
PU ti
me
(sec
)
1 se
c.10
sec
.1
min
.10
min
.1
hr.
4 hr
.
G1DBNRenet−VARInfCl
Figure: Computing times on the log-log scale for Renet-VAR, G1DBNand InfCl (including inference of classes). Intel Dual Core 3.40 GHzprocessor.
Camille Charbonnier and Julien Chiquet and Christophe Ambroise 16
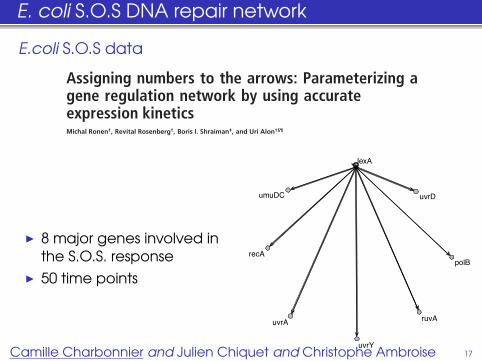
E. coli S.O.S DNA repair network
E.coli S.O.S data
Assigning numbers to the arrows: Parameterizing agene regulation network by using accurateexpression kineticsMichal Ronen†, Revital Rosenberg†, Boris I. Shraiman‡, and Uri Alon†§¶
Departments of †Molecular Cell Biology and §Physics of Complex Systems, Weizmann Institute of Science, Rehovot 76100, Israel; and ‡Bell Laboratories,Lucent Technologies, Murray Hill, NJ 07974
Edited by David Botstein, Stanford University School of Medicine, Stanford, CA, and approved June 5, 2002 (received for review January 28, 2002)
A basic challenge in systems biology is to understand the dynam-ical behavior of gene regulation networks. Current approaches aimat determining the network structure based on genomic-scale data.However, the network connectivity alone is not sufficient to defineits dynamics; one needs to also specify the kinetic parameters forthe regulation reactions. Here, we ask whether effective kineticparameters can be assigned to a transcriptional network based onexpression data. We present a combined experimental and theo-retical approach based on accurate high temporal-resolution mea-surement of promoter activities from living cells by using greenfluorescent protein (GFP) reporter plasmids. We present algorithmsthat use these data to assign effective kinetic parameters within amathematical model of the network. To demonstrate this, weemploy a well defined network, the SOS DNA repair system ofEscherichia coli. We find a strikingly detailed temporal program ofexpression that correlates with the functional role of the SOSgenes and is driven by a hierarchy of effective kinetic parameterstrengths for the various promoters. The calculated parameters canbe used to determine the kinetics of all SOS genes given theexpression profile of just one representative, allowing a significantreduction in complexity. The concentration profile of the masterSOS transcriptional repressor can be calculated, demonstratingthat relative protein levels may be determined from purely tran-scriptional data. This finding opens the possibility of assigningkinetic parameters to transcriptional networks on a genomic scale.
There is much interest in understanding the design principlesunderlying the structure and dynamics of gene regulation
networks (1–10, 36). Determining the dynamic behavior of thesesystems requires specifying not only the network connectivity,but also the kinetic parameters for the various regulationreactions. Standard biochemical methods of measuring thesekinetic parameters are usually done outside of the cellularcontext and cannot be easily scaled up to a genomic level. Itwould therefore be valuable to develop methods to assigneffective kinetic parameters to transcriptional networks based onin vivo measurements. Here we present an approach for deter-mining the effective kinetic parameters of a transcriptionalnetwork based on accurate promoter activity measurements andanalysis algorithms (Fig. 1).
We developed a system for real-time monitoring of thetranscriptional activity of operons by means of low-copy reporterplasmids (10) in which a promoter controls green fluorescentprotein (GFP) (11). In each plasmid a different promotercontrols the transcription rate of the same reporter gene, gfp, andthus rate of transcript production from the promoter is propor-tional to the rate of GFP accumulation. By continuous mea-surements from living cells grown in a multiwell plate fluorim-eter, high-resolution time courses of the promoter strength andcell density are obtained. With this method, temporal resolutionof minutes can be achieved. This process complements, at higheraccuracy, the genomic-scale perspective given by DNA microar-rays (12). In a previous study, we demonstrated that this ap-proach can be used to determine the order of genes in an
assembly pathway (10). Here, we extend it by presenting analysisalgorithms that use accurate expression data to assign kineticparameters that can be incorporated into a mathematical modelof the dynamics.
We apply this method to a well characterized transcriptionalnetwork, the SOS DNA repair system in Escherichia coli. TheSOS system includes about 30 operons regulated at the tran-scriptional level (12–16). A master repressor (LexA) binds sitesin the promoter regions of these operons (16, 17). One of theSOS proteins, RecA, acts as a sensor of DNA damage: by bindingto single-stranded DNA it becomes activated and mediates LexAautocleavage. The drop in LexA levels causes the de-repressionof the SOS genes (Fig. 2). Once damage has been repaired orbypassed, the level of activated RecA drops, LexA accumulatesand represses the SOS operons, and the cells return to theiroriginal state.
We demonstrate that effective kinetic parameters can be usedto detect SOS genes with additional regulation, capture thetemporal transcriptional program, and calculate the concentra-tion profile of the regulatory protein.
MethodsPlasmids and Strains. Promoter regions were amplified fromMG1655 genomic DNA by using PCR and the following startand end coordinates for the primers taken from the sequencedE. coli genome (18): uvrA (4271368–4271753), uvrD (3995429–3995664), lexA (4254491–4254751), recA (2821707–2821893),ruvA (1943919–1944201), polB (65704–65932), umuD (1229552–1230069), uvrY (1993282–1993900), and lacZ (365438–365669).Each amplified region includes the entire region between ORFswith an additional 50–150 bp into each of the flanking ORFs.The promoter regions were cloned by using XhoI and BamHIsites upstream of a promoterless GFPmut3 gene in a low copypSC101 origin plasmid as described (10). The plasmids weretransformed into E. coli strain AB1157 [argE3, his4, leuB6,proA2, thr1, ara14, galK2, lacY1, mtl1, xyl5, thi1, tsx33, rpsL31, andsupE44] (24).
Culture and Measurements. Cultures of strain AB1157 (1 ml)inoculated from glycerol frozen stocks were grown for 16 h in LBmedium with kanamycin (25 !g!ml) at 37°C with shaking at 250rpm. The cultures were diluted 1:100 into defined medium (24)[M9 supplemented with thiamine (10 !g!ml), glucose (2 mg!ml), MgSO4 (1 mM), MgCl2 (0.1 mM), thymine (20 !g!ml), eachof the 20 aa except tryptophan (50 !g!ml) ! 25 !g!ml kana-mycin], at a final volume of 100 !l per well in a flat-bottom96-well plate (Sarstedt). The cultures were covered with anadhesive pad to prevent evaporation and grown in a WallacVictor2 multiwell f luorimeter at 37°C, set with an automatically
This paper was submitted directly (Track II) to the PNAS office.
Abbreviation: GFP, green fluorescent protein.¶To whom reprint requests should be addressed. E-mail: [email protected].
www.pnas.org!cgi!doi!10.1073!pnas.152046799 PNAS " August 6, 2002 " vol. 99 " no. 16 " 10555–10560
GEN
ETIC
S
I 8 major genes involved inthe S.O.S. response
I 50 time points
uvrD
lexA
umuDC
recA
uvrA
uvrY
ruvA
polB
Camille Charbonnier and Julien Chiquet and Christophe Ambroise 17
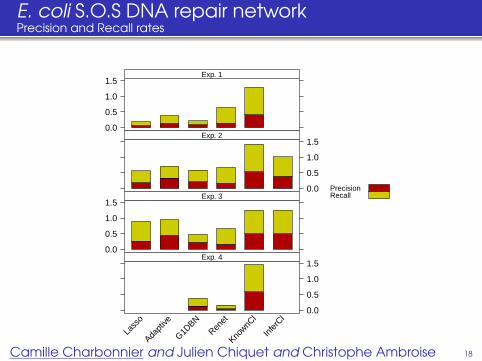
E. coli S.O.S DNA repair networkPrecision and Recall rates
0.0
0.5
1.0
1.5Exp. 1
0.0
0.5
1.0
1.5Exp. 2
0.0
0.5
1.0
1.5Exp. 3
Lass
o
Adapt
ive
G1DBN
Renet
KnownC
l
Infer
Cl0.0
0.5
1.0
1.5Exp. 4
PrecisionRecall
Camille Charbonnier and Julien Chiquet and Christophe Ambroise 18
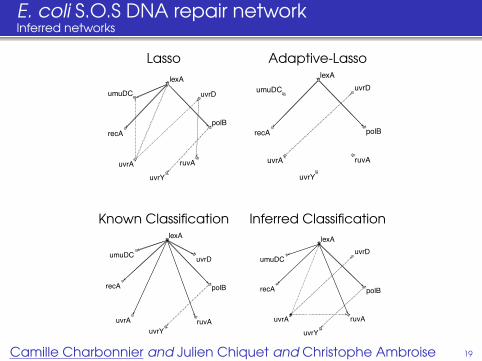
E. coli S.O.S DNA repair networkInferred networks
Lasso Adaptive-Lasso
uvrD
lexA
umuDC
recA
uvrA
uvrY
ruvA
polB
uvrDlexA
umuDC
recA
uvrA
uvrY
ruvA
polB
Known Classification Inferred Classification
uvrD
lexA
umuDC
recA
uvrAuvrY
ruvA
polB
uvrDlexA
umuDC
recA
uvrA
uvrY
ruvA
polB
Camille Charbonnier and Julien Chiquet and Christophe Ambroise 19

Conclusions
To sum-up
I cluster-driven inference of gene regulatory networks fromtime-course data,
I expert-based or inferred latent structure,I embedded in the SIMoNe R package along with similar
algorithms dealing with steady-state or multitask data.
Perspectives
I inference of truely dynamic networks,I use of additive biological information to refine the
inference,I comparison of inferred networks.
Camille Charbonnier and Julien Chiquet and Christophe Ambroise 20
Publications
Ambroise, Chiquet, Matias, 2009.Inferring sparse Gaussian graphical models with latent structureElectronic Journal of Statistics, 3, 205-238.
Chiquet, Smith, Grasseau, Matias, Ambroise, 2009.SIMoNe: Statistical Inference for MOdular NEtworks Bioinformatics,25(3), 417-418.
Charbonnier, Chiquet, Ambroise, 2010.Weighted-Lasso for Structured Network Inference from TimeCourse Data., SAGMB, 9.
Chiquet, Grandvalet, Ambroise, 2010. Statistics and Computing.Inferring multiple Gaussian graphical models.
Camille Charbonnier and Julien Chiquet and Christophe Ambroise 21
Publications
Ambroise, Chiquet, Matias, 2009.Inferring sparse Gaussian graphical models with latent structureElectronic Journal of Statistics, 3, 205-238.
Chiquet, Smith, Grasseau, Matias, Ambroise, 2009.SIMoNe: Statistical Inference for MOdular NEtworks Bioinformatics,25(3), 417-418.
Charbonnier, Chiquet, Ambroise, 2010.Weighted-Lasso for Structured Network Inference from TimeCourse Data., SAGMB, 9.
Chiquet, Grandvalet, Ambroise, 2010. Statistics and Computing.Inferring multiple Gaussian graphical models.
Working paper: Chiquet, Charbonnier, Ambroise, Grasseau.SIMoNe: An R package for inferring Gausssian networks withlatent structure, Journal of Statistical Softwares.
Working paper: Chiquet, Grandvalet, Ambroise, Jeanmougin.Biological analysis of breast cancer by multitasks learning.
Camille Charbonnier and Julien Chiquet and Christophe Ambroise 21