inertial range oscillations in the combined qscat-adeos-ii
TRANSCRIPT

Inertial Range Oscillations in the combined QSCAT-ADEOS-II ocean surface wind data set
Robert G. StockwellNWRA, CoRA Division
Boulder, CO
OVWST Meeting presentation; 19 May 2009 Ball Aerospace Technology Corp, Boulder
Purpose: to prove that one can see IROs in satellite based measurements.
1) Introduction: IROs2) Ground Truthing (what do IROs look like in NBDC data?)3) Can satellites see IROs? (sampling issues)
4) Comparison: moored buoys v. satellite5) Global IRO measurements

OVWST Meeting presentation; 19 May 2009 Ball Aerospace Technology Corp, Boulder
Anticyclonic oscillations near the local inertial frequency in the upper ocean currents can be forced by the surface wind field.
Inertial oscillations can be generated by the sudden onset of a steady wind blowing over an ocean mixed layer and they can play a major role in deepening the layer.
Inertial variability in surface winds has been observed at various sites, but due to its transient nature, has been considered to be less dominant.

OVWST Meeting presentation; 19 May 2009 Ball Aerospace Technology Corp, Boulder
IROs in the NDBC datasetThe National Data Buoy Center (NDBC) is
an agency within the National Weather Service (NWS) of (NOAA).
They provide data for hundreds of moored data buoys that provide high time resolution winds. These are an ideal source in which to search for IROs.
The moored data buoy dataset provides wind data at with sufficient sampling (hourly) to sample inertial range oscillations at all latitudes.
We analyzed data from several hundred moored buoys.
http://www.ndbc.noaa.gov/

OVWST Meeting presentation; 19 May 2009 Ball Aerospace Technology Corp, Boulder
IROs from data buoys• IROs are strong, transient signals, thus a local spectral analysis (S-Transform) is appropriate.
• Station 41012 at (30.0 N 80.5 W) sampled hourly shows strong IRO signals (IR period = 24 hours)
• ST shows the rotational spectrum of u + iv as a function of time. (anticyclonic, CC in NH is +n)

OVWST Meeting presentation; 19 May 2009 Ball Aerospace Technology Corp, Boulder
IROs from data buoys• Closeup of a single IRO event from a 23 year long data record.

OVWST Meeting presentation; 19 May 2009 Ball Aerospace Technology Corp, Boulder
IROs from data buoys: Latitudinal Dist.
This shows the amplitude of the IROs vs latitude.
It summarizes the entire Moored Buoy Dataset, and can be used for comparison with satellite results.
Note: There is a geographical bias, most of the buoys are near coastal N.A.

OVWST Meeting presentation; 19 May 2009 Ball Aerospace Technology Corp, Boulder
Can satellites see IROs? (sampling)Global Coverage provided by QSCAT and ADEOS-II over 6 hours.

OVWST Meeting presentation; 19 May 2009 Ball Aerospace Technology Corp, Boulder
Can satellites see IROs? (sampling)

OVWST Meeting presentation; 19 May 2009 Ball Aerospace Technology Corp, Boulder
Can satellites see IROs? (sampling)

OVWST Meeting presentation; 19 May 2009 Ball Aerospace Technology Corp, Boulder
Can satellites see IROs? (sampling)

OVWST Meeting presentation; 19 May 2009 Ball Aerospace Technology Corp, Boulder
IRO from Satellite measurements The strategy is to:
1) create a very high time resolution (yet non-stationary) regularly gridded wind product, then,
2) apply non-stationary analysis using a local spectral analysis.
The gridded wind product is derived by a modified LOESS (local regression) analysis.
It is a data adaptive process where Singular Value Decompositions were used to solve three dimensional weighted least squares fit over small Regions of Interest (ROI) using a raised Gaussian window. Multiple quality checks are performed on the results (singular values, goodness of fit, 3D data centroid, etc.) and the best solution is found. (LOESS calculates center bin values, i.e. no jitter error).
IMPORTANT: This gridded product does not have uniform statistics. The gridded product is best thought of as a collection of time series.

OVWST Meeting presentation; 19 May 2009 Ball Aerospace Technology Corp, Boulder
Gridded Wind ProductSnapshot at 06-01 2003 at 0UT.
Caveat, it is a collection of time series. Spatial characteristics are not uniform.

OVWST Meeting presentation; 19 May 2009 Ball Aerospace Technology Corp, Boulder
Comparison of the gridded wind with data buoy measurements
.
Note: a buoy measurement is completely different than a satellite measurement.
A wise man one said "BE CAREFUL WHEN VALIDATING SCATTEROMETER WINDS AGAINST POINT MEASUREMENTS"
That's correct, however, a derived product like the local IRO can be measured in both instruments, and can be directly compared. It may be a more appropriate comparison than a direct wind measurement.
(orange = buoy, black = gridded wind)

OVWST Meeting presentation; 19 May 2009 Ball Aerospace Technology Corp, Boulder
Comparison of the gridded wind with data buoy measurements
.
The derived Inertial Range Oscillation Amplitude from the gridded winds, and from the hourly data buoy measurements for June of 2003.
The comparison of these gridded results with all data buoys in the NDBC database is in progress.
(Dark line = buoy, grey line = gridded wind result)

OVWST Meeting presentation; 19 May 2009 Ball Aerospace Technology Corp, Boulder
Comparison of the gridded wind with data buoy measurements
Latitudinal distribution of IRO amplitudes from the entire NDBC data base.
Latitudinal distribution of IRO amplitudes from the gridded winds.

OVWST Meeting presentation; 19 May 2009 Ball Aerospace Technology Corp, Boulder
Comparison of the gridded wind with data buoy measurements
Latitudinal distribution of IRO amplitudes from the entire NDBC data base.
Latitudinal distribution of IRO amplitudes from the gridded winds, now restricted to the spatial regions sampled by the NDBC database (i.e. predominantly the coast of North America)
Therefore the gridded wind IRO results agree in a direct comparison (a single point to the Data Buoy), and they agree well in the aggregate.
OVWST Meeting presentation; 19 May 2009 Ball Aerospace Technology Corp, Boulder
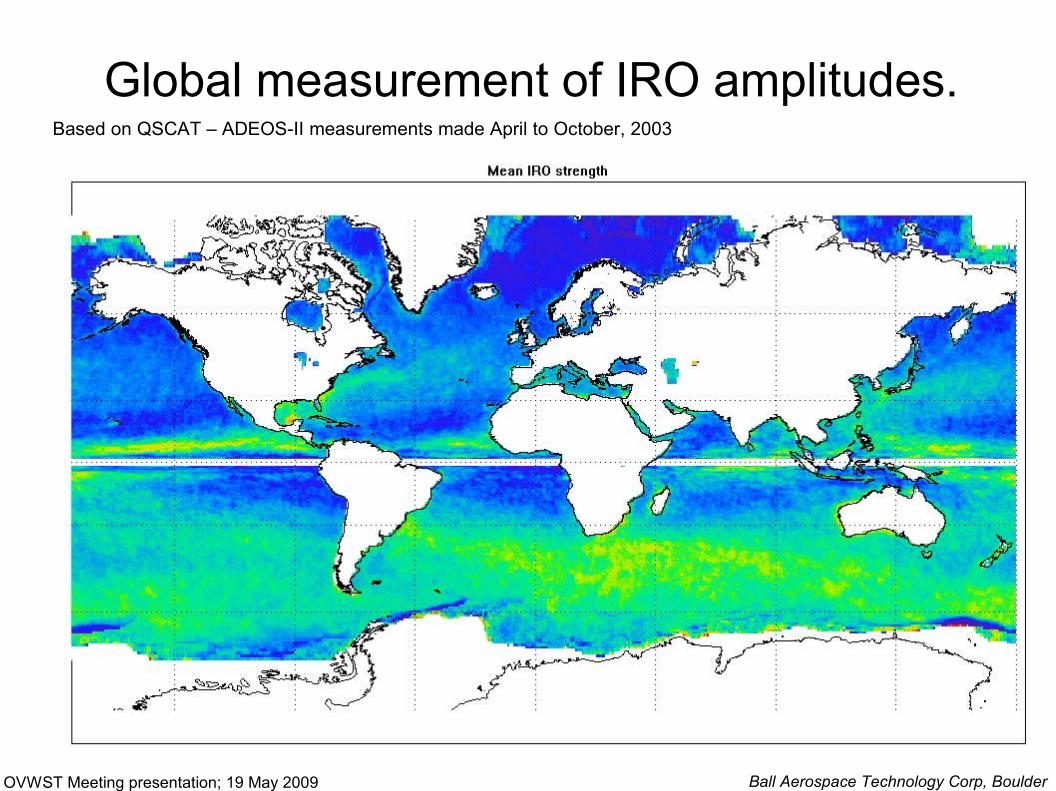
Global measurement of IRO amplitudes.Based on QSCAT – ADEOS-II measurements made April to October, 2003

Conclusion
In spite of the very difficult problems presented by irregularly sampled satellite data, it is possible to measure IRO amplitudes over the whole earth
from space with multiple satellites.