inert gas accumulation in sonoluminescing bubbles
TRANSCRIPT
Inert gas accumulation in sonoluminescing bubblesDetlef Lohse and Sascha Hilgenfeldt Citation: The Journal of Chemical Physics 107, 6986 (1997); doi: 10.1063/1.474939 View online: http://dx.doi.org/10.1063/1.474939 View Table of Contents: http://scitation.aip.org/content/aip/journal/jcp/107/17?ver=pdfcov Published by the AIP Publishing Articles you may be interested in Sonoluminescence, sonochemistry and bubble dynamics of single bubble cavitation AIP Conf. Proc. 1474, 163 (2012); 10.1063/1.4749322 Mechanism of single-bubble sonoluminescence AIP Conf. Proc. 524, 437 (2000); 10.1063/1.1309259 The effects of buoyancy on sonoluminescing bubbles ARLO 1, 13 (2000); 10.1121/1.1314681 The radial motion of a sonoluminescence bubble driven with multiple harmonics J. Acoust. Soc. Am. 107, 1774 (2000); 10.1121/1.428575 Single-bubble sonoluminescence from hydrogen J. Chem. Phys. 111, 5384 (1999); 10.1063/1.479798
This article is copyrighted as indicated in the article. Reuse of AIP content is subject to the terms at: http://scitation.aip.org/termsconditions. Downloaded to IP:
209.183.183.254 On: Sun, 07 Dec 2014 20:58:08

Inert gas accumulation in sonoluminescing bubblesDetlef Lohsea) and Sascha Hilgenfeldtb)
Fachbereich Physik der Universita¨t Marburg, Renthof 6, 35032 Marburg, Germany
~Received 31 March 1997; accepted 25 July 1997!
In this paper we elaborate on the idea@Lohseet al., Phys. Rev. Lett.78, 1359–1362~1997!# that~single! sonoluminescing air bubbles rectify argon. The reason for the rectification is that nitrogenand oxygen dissociate and their reaction products dissolve in water. We give further experimentaland theoretical evidence and extend the theory to other gas mixtures. We show that in the absenceof chemical reactions~e.g., for inert gas mixtures! gas accumulation in strongly acoustically drivenbubbles can also occur. ©1997 American Institute of Physics.@S0021-9606~97!51241-4#
I. INTRODUCTION
Sonoluminescence~SL! has long been known to be verysensitive to the gas used.1–5 This effect is even more pro-nounced for single bubble sonoluminescence~SBSL!, a phe-nomenon in which a single gas bubble is driven by a strongacoustic field and can emit short light pulses for hours.6,7
Detailed experiments by the Putterman group at UCLA8–16
revealed that inert gas as part of the operating gas is essen-tial. In Figure 1 we show the experimental SL intensity froma SL bubble in water as a function of the percentagej l ofnoble gas mixed with nitrogen, taken from Ref. 11. Purenitrogen bubbles show hardly any SL emission; the optimumis aroundj l50.0151%, i.e., the amount of argon containedin air.
Besides the noble gas percentagej l the other experimen-tally controllable parameters in SBSL experiments are theforcing pressure amplitudePa of the forcing sound field
P~ t !5Pa cosvt, ~1!
the total gas pressure overheadp` , and the ambient pressureP0 , which is normally 1 atm. The frequencyv/2p which isin a range between 20 kHz and 40 kHz is fixed as it has to beadopted to the size of the resonator~‘‘Crum cell,’’ 17!. Notethat the ambient radiusR0 of the bubble~i.e., the bubbleradius at ambient standard conditionsP051 atm and at thetemperature of the water! is not a free parameter, but thesystem adjustsR0 itself by diffusional processes.
There are two types of SBSL: stable and unstableSBSL.13,18 In unstableSBSL the phase of light emission~measured relative to the phase of the forcing sound field!drifts on a diffusional time scale of seconds, interrupted bysudden breakdowns. The same is true for the maximalbubble size per cycle and for the light intensity. An examplefor the bubble dynamics and light intensity for unstableSBSL is shown in Figure 6 of Ref. 15. In Ref. 18 we quan-titatively accounted for unstable SBSL as light emissionfrom a bubble growing by rectified diffusion5,15,18–22 andthereby running into a shape instability5,18,22–25 where itpinches off a microbubble and starts over. The pinch offleads to arecoil of the bubble which makes it appear ‘‘jig-gling’’ or ‘‘dancing’’. 6,7,13 Meanwhile, the pinched off mi-
crobubble could be visualized.26 The second type of SBSL isstableSBSL, distinguished by a constant phase and intensityof the light pulses, repeating for hours with remarkableprecision.8,9,27
In Ref. 18 we calculatedphase diagramsof SL bubblesin the ambient radius vs forcing pressure and gas pressure vsforcing pressure phase spaces. These diagrams are based onthe Rayleigh–Plesset equation for the bubble radiusR(t), asimilar type of approximation for shape distortions, and theadvection diffusion equation. We call this approach theRayleigh–Plesset SL bubble approach. Shape stabilities anddiffusional stabilities are considered. The phase diagramsquantitatively agree with Barberet al.’s13 and Lofstedtet al.’s15 experiments for argon~and other inert gas! bubbles,but not for air bubbles.
For argon bubbles stable SBSL is only possible in asmall window of tiny gas concentration, see Figure 2 whichis calculated for a water temperature of 20°C, as all calcula-tions done in this paper. ForPa51.3 atm this window isbetweenp`
Ar/P050.002 and 0.004 in very good agreementwith Lofstedtet al.’s experimental data. Repeating the calcu-lation of such phase diagrams for air bubbles essentiallygives the same result, however, experimentally stable SBSLin air bubbles is found at about one hundred times larger gaspressure overhead.6,13,22 This discrepancy between air andargon bubbles was first pointed out by Lo¨fstedtet al.,15 whohypothesized an ‘‘as yet unidentified mass ejection mecha-nism’’ in air bubbles which ‘‘is the key to SL in a singlebubble.’’
II. AIR BUBBLES VS ARGON BUBBLES
In Refs. 28 and 29 we have suggested that this mecha-nism ischemical. The occurrence of chemical reactions hasin fact led to the discovery of multibubble sonoluminescence~MBSL!2–5,30–32: Frenzel and Schultes1 were stimulated tolook for luminescence as the formation of hydrogen peroxidein aqueous fluids subjected to sound that had been observedbefore. Later, Schultes and Gohr33 found that also nitric andnitrous acids were produced. The reason is that the high tem-peratures generated by the bubble collapse are beyond thedissociation temperature of oxygen and nitrogen~'9000 K34!, leading to the formation of O and N radicalswhich react with the H and O radicals formed from the dis-sociation of water vapor. Rearrangement of the radicals will
a!Electronic mail: [email protected]!Electronic mail: [email protected]
6986 J. Chem. Phys. 107 (17), 1 November 1997 0021-9606/97/107(17)/6986/12/$10.00 © 1997 American Institute of Physics This article is copyrighted as indicated in the article. Reuse of AIP content is subject to the terms at: http://scitation.aip.org/termsconditions. Downloaded to IP:
209.183.183.254 On: Sun, 07 Dec 2014 20:58:08

lead to the formation of NO, OH, and NH, which eventuallydissolve in water to form H2O2, HNO2, and HNO3, amongother products.
Based on fits of SBSL spectra10,35 and hydrodynamiccalculations,14,36 it is assumed that internal bubble tempera-tures in SBSL are even higher than in MBSL. Therefore, thesame reactions as in MBSL will occur. The reaction products~NO2, NO,...! are pressed into the surrounding liquid, and arenot recollected during the next bubble cycle, since their solu-bility in water is enormous. These chemical processes de-prive the gas in the bubble of its reactive components. Smallamounts of N2 and O2 that diffuse into the bubble during theexpansion react and their dissociation products are expelledback into the surrounding liquid at the bubble collapse. Theonly gases that can remain within a SBSL bubble over manybubble cycles are those which at high temperatures do notreact with the liquid vapor, i.e., inert gases. Hence, when airis dissolved in water, a strongly forced bubble is almost com-
pletely filled with argon. This argon rectification happens inSBSL but not in MBSL because it requires long time bubblestability.
This argument immediately suggests that thepartialpressure of argon
p`Ar5j l p` ~2!
determines bubble stability,not the total pressurep` . In-deed, if we include Holt and Gaitan’s experimental data forair bubbles22 on inert gas-nitrogen mixtures andonly con-sider the inert gas partial pressureas the relevant quantityfor diffusive stability, excellent agreement with the theoreti-cal phase diagrams18 is found.
The phase diagram shows that forPa51.3 atm argonbubbles exist between 0.002,p`
Ar/P0,0.004. Forpure ar-gon dissolved in water,p`
Ar5p` . For air bubbles, however,the partial pressure of argon is onlyp`
Ar50.01p` which re-quires 0.2,p` /P0,0.4 for stable SL with ‘‘air’’ bubbles, ingood agreement with experiment. Since this amount of de-gassing is easily achieved, air with its 1% argon is a particu-larly friendly gas for SL experiments. The theory suggeststhat for an argon ratio ofj l'0.0033 atPa51.3 atm there isstable SL between 0.6,p` /P0,1.2, so that degassing is notrequired. Also, the window of stability is even wider than forair. The major problem in experimentally achieving SBSLwithout degassing is spontaneous cavitation, provoked byimpurities in the liquid. These must be eliminated for theexperiment to work. Another way to obtain stable SL with-out degassing would be to slightly increase the ambient pres-sureP0 so that the ratiop`
Ar/P0 is in the required window.Indeed, with such a kind of experiment stable SBSL withoutdegassing could recently be achieved.37
Before we proceed with a quantitative analysis, we willgive further support for the nitrogen dissociationhypothesis28,29 from comparison with various experimentalresults on gas mixtures.
(1) Transition toward SL:The transition toward SL withincreasing forcing pressurePa is shown in Figure 3 for bothargon and air bubbles. For pure argon bubbles the transitionto SL is very smooth. For air, however, one can observe abreakdown of the bubble radius at about 1.1 atm, signalingthat the dissociation threshold of N2 is achieved. Before thetransition the bubble is filled with a mixture of nitrogen,oxygen, and argon, and the ambient radius is determined bythe combination of all three gases. Beyond the dissociationthreshold, only argon is left in the bubble. The transitionfrom the no SL regime in Figure 2 to the SL regime can alsobe seen in Figure 1, where the SL light intensity is plotted asa function ofj l for fixed Pa ~we assumePa51.3 atm! andfixed p` /P0;0.20. According to our theory we expect SLfor p`
Ar/P0.0.002 or
j l.p`
Ar/P0
p` /P050.01, ~3!
in pretty good agreement with Figure 1 where we indeedobserve that strong SL is ‘‘switched on’’ at about that con-centration. Our theory also predicts that near the switch onwe always have stable SL, whereas for largerj l unstableSL
FIG. 1. SL intensity~normalized to air! from a SL bubble in water as afunction of the percentage~mole fraction! of noble gas mixed with nitrogen.The gas mixture was dissolved in water at a pressure head of 150 mm Hg,i.e., p` /P0;0.2. The data are taken from Figure 1 of Hilleret al. ~Ref. 11!.
FIG. 2. Phase diagram for pure argon bubbles in thep`Ar/P0 versusPa /P0
parameter space. Stable SL is only possible in a very small window of argonconcentration. The experimental data points included for comparison referto observed stable SL~filled symbols! or stable non-SL bubbles~open sym-bols! from Refs. 15~diamonds! and 22~circles! and show good agreementwith the theory. Note that only those data can be included for whichPa , p`
andj l are experimentally known.
6987D. Lohse and S. Hilgenfeldt: Inert gas in sonoluminescing bubbles
J. Chem. Phys., Vol. 107, No. 17, 1 November 1997 This article is copyrighted as indicated in the article. Reuse of AIP content is subject to the terms at: http://scitation.aip.org/termsconditions. Downloaded to IP:
209.183.183.254 On: Sun, 07 Dec 2014 20:58:08

develops. The window of stable SL is only in between0.002,p`
Ar/P0,0.004, so that beyondj l50.004P0/p` weexpect unstable SL, a prediction which should be verified.
(2) Hysteresis:Above we have seen that by decreasingthe percentagej l of inert gas down toj l'0.0033 atPa51.3 atm, we obtain a very wide window of stable SLaroundp` /P051. When the percentagej l of inert gas iseven lower, the argon partial pressurep`
Ar/P05j l p` /P0 canbe pushed below the stable SL regime in Figure 2 even forp` /P051. An example of this has been observed in Figure11 of Lofstedt et al.,15 see Figure 4 of the present work,which studies SBSL of xenon doped nitrogen bubbles~whichbehave like argon doped nitrogen bubbles! in water atj l50.001 and p` /P050.2, corresponding top`
Ar/P0
50.0002, provided that the gas temperature is high enoughto exceed the dissociation temperature of nitrogen. This isthe case atPa51.3 atm and according to Figure 2 no stableSL is possible. However, for largerPa51.4 atm stable SLbecomes possible again~as the window of stable SL movesdown to smaller concentrations with increasingPa!, just asobserved in experiment. Moreover, the system shows hyster-esis: the SL state atPa51.4 atm can be reached by continu-ously increasing the forcing and thus continuously substitut-ing N2 with xenon. On the other hand, decreasing the forcingpressure below the stability threshold for pure xenon bubblesleads to the dissolution of the bubble.
(3) Unstable SL:An example for unstable SL is shownin Figure 6 of Ref. 15. For that figure we havej l50.05 andp` /P050.20. Thus, from Equation ~2! we havep`
Ar/P050.01 and according to the phase diagram Figure 2we are well in the unstable SL regime, just in agreement withthe observations.
(4) Large Pa bubble dissolution islands:Further supportcomes from the recent work of Holt and Gaitan,22 who mea-sured detailed phase diagrams as a function of the ambientradiusR0 and the forcing pressurePa for different air pres-sure overheadp` /P0 . Their central result is that atp` /P050.2 there is a relatively large forcing pressurePa;1.2– 1.3 atm regime where bubbles dissolve, see Figure5. Such dissolution islands do not exist within theories of
FIG. 3. Transition in the maximal radius towards the SL regime for argonbubbles~dots! and for air bubbles~squares!. Bubbles aroundPa51.1 atmstart to glow. Only for air bubbles a breakdown in the radius is seen nearthat onset of SL, signaling the threshold for nitrogen dissociation. The datafor argon are taken from Figure 4 of Hilleret al.’s work ~Ref. 11!, the totalgas concentration is aboutp`5150 mm Hg.This meansp`
Ar/P050.2 andaccording to Figure 2 the bubble should be in the unstable SL regime inagreement with the observations of Ref. 11. The data for air are taken fromFigure 2 of Barberet al.’s work ~Ref. 36!. The gas saturation is about 10%,corresponding top`
Ar/P050.01•0.150.001. According to Figure 2 we havestable SL aroundPa;1.4 atm which again is in agreement with the experi-ment reported in Ref. 36.
FIG. 4. The transition~in Rmax! to SL for a bubble filled with an initial 0.1%xenon in nitrogen gas mixture at a partial pressure of 150 mm Hg. Only thebubble atPa51.4 atm emits light. According to the dissociation hypothesisthis corresponds top`
Xe/P050.0002 for a pure sonoluminescing xenonbubble. From the phase diagram Figure 2 which is~with tiny corrections!also valid for xenon we conclude that bubbles driven atPa51.3 atm dis-solve for these low concentrations, whereas bubbles atPa51.4 atm showstable SL, just as seen here. The data are taken from Figure 11 of Lo¨fstedtet al. ~Ref. 15!.
FIG. 5. Adopted from Holt and Gaitan’s measurement Figure 1~c! of Ref.22. It is the phase diagram in theR0–Pa parameter space for air atp` /P050.20; the driving frequency is 20.6 kHz. Arrows indicate whetherthe bubbles grow or shrink. Three equilibrium curves A, B, and C can berecognized. In between curves B and C there is a ‘‘dissolution island.’’ Theshaded area shows the shape stable parameter domain. Note that in the SLregion the onset of shape instabilities is atR0'7 mm rather than atR0'5 mm as theoretically calculated in Ref. 18. One contribution to thisdeviation is that the driving frequency chosen by Holt and Gaitan is smallerthan thev/2p526.5 kHz used by Barberet al. ~Ref. 36! and throughout thecalculations presented here; another one is the oversimplified model of ther-mal effects we use.
6988 D. Lohse and S. Hilgenfeldt: Inert gas in sonoluminescing bubbles
J. Chem. Phys., Vol. 107, No. 17, 1 November 1997 This article is copyrighted as indicated in the article. Reuse of AIP content is subject to the terms at: http://scitation.aip.org/termsconditions. Downloaded to IP:
209.183.183.254 On: Sun, 07 Dec 2014 20:58:08
rectified diffusion,15,18–20which predict the bubbles to growin that regime. However, considering the nitrogen dissocia-tion at largePa , one realizes that the observed dissolutionislands are a direct consequence: chemical reactions depletethe bubbles from air and only argon is left. As the relevantpartial pressurep`
Ar/P050.002 is so low, bubbles must in-deed shrink in that regime.
(5) Isotope scrambling:Experiments with hydrogen gasalso support the dissociation hypothesis. Hilleret al.12 ana-lyze SL in H2 and D2 gas bubbles, both in normal and inheavy water. Since the gas dynamics inside the bubble de-termines the strength of the light emission, the SL intensitycurves should group according to the gas content. Howeverthe four experiments~H2 in H2O, H2 in D2O, D2 in H2O, andD2 in D2O! group according to the surrounding liquids, cf.Figure 2 of Ref. 12. This suggests the following scenario:Both the gas and the liquid vapor in the bubble dissociate tosome extent during the~hot! compression phase and recom-bine later on during expansion. Even if there is only a minoramount of this isotope ‘‘scrambling,’’ after thousands ofcycles the gas in solution around the bubble would containthe same hydrogen isotope as the bulk liquid. This kind of‘‘scrambling’’ is well known in MBSL.38 The acoustic reso-nator theory of SBSL39 stipulates that the light intensity de-creases with increasing acoustic transmission, which scaleswith the ratio of the gas density to the liquid density. SinceD2 is heavier than H2, SBSL in heavy water should be dim-mer than in normal water, as observed by Hiller andPutterman.12
III. MODELING THERMAL EFFECTS WITHINRAYLEIGH–PLESSET BUBBLE DYNAMICS
We now proceed to a quantitative calculation of phasediagrams for gas mixtures. The dynamics of the bubble ra-dius R(t) is well described by the Rayleigh–Plessetequation,5,40
RR13
2R25
1
r l~p~R,t !2P~ t !2P0!1
R
r lcl
d
dtp~R,t !
24nR
R2
2s
r lR~4!
with a van der Waals pressure
g~R1t !5p~R~ t !!5S P012s
R0D S R0
32h3
R3~ t !2h3D g
. ~5!
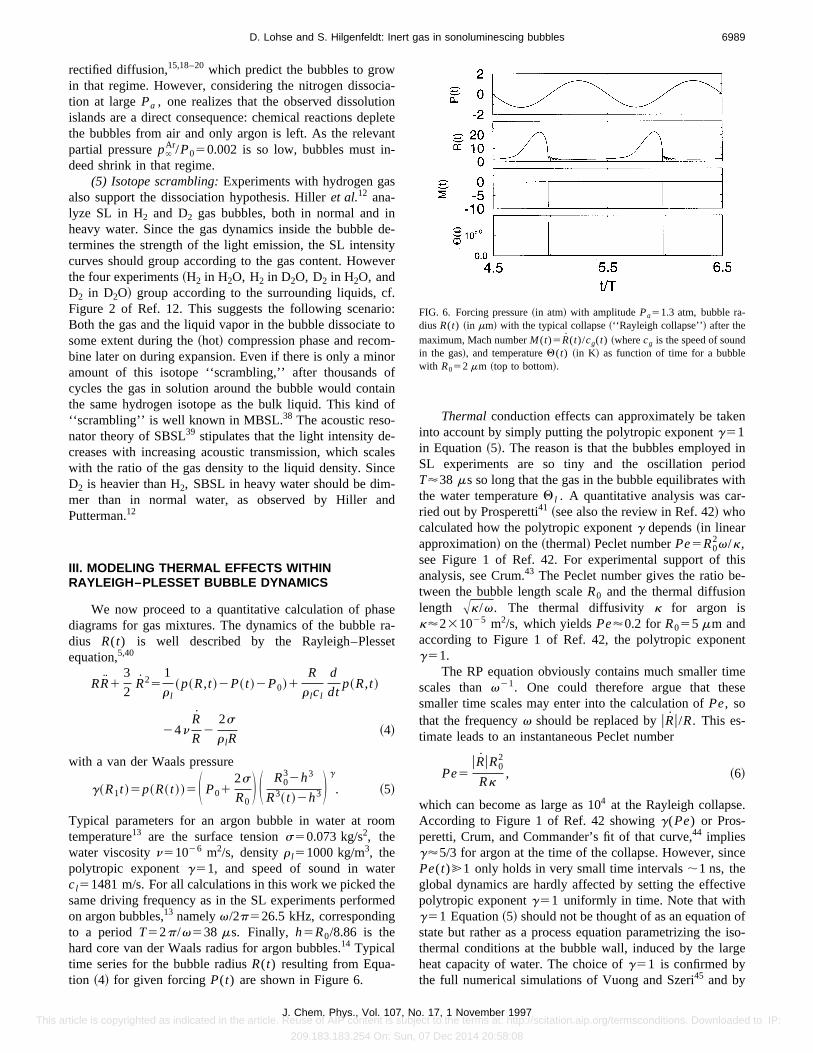
Typical parameters for an argon bubble in water at roomtemperature13 are the surface tensions50.073 kg/s2, thewater viscosityn51026 m2/s, densityr l51000 kg/m3, thepolytropic exponentg51, and speed of sound in watercl51481 m/s. For all calculations in this work we picked thesame driving frequency as in the SL experiments performedon argon bubbles,13 namelyv/2p526.5 kHz, correspondingto a periodT52p/v538 ms. Finally, h5R0/8.86 is thehard core van der Waals radius for argon bubbles.14 Typicaltime series for the bubble radiusR(t) resulting from Equa-tion ~4! for given forcingP(t) are shown in Figure 6.
Thermalconduction effects can approximately be takeninto account by simply putting the polytropic exponentg51in Equation~5!. The reason is that the bubbles employed inSL experiments are so tiny and the oscillation periodT'38 ms so long that the gas in the bubble equilibrates withthe water temperatureQ l . A quantitative analysis was car-ried out by Prosperetti41 ~see also the review in Ref. 42! whocalculated how the polytropic exponentg depends~in linearapproximation! on the~thermal! Peclet numberPe5R0
2v/k,see Figure 1 of Ref. 42. For experimental support of thisanalysis, see Crum.43 The Peclet number gives the ratio be-tween the bubble length scaleR0 and the thermal diffusionlength Ak/v. The thermal diffusivity k for argon isk'231025 m2/s, which yieldsPe'0.2 for R055 mm andaccording to Figure 1 of Ref. 42, the polytropic exponentg51.
The RP equation obviously contains much smaller timescales thanv21. One could therefore argue that thesesmaller time scales may enter into the calculation ofPe, sothat the frequencyv should be replaced byuRu/R. This es-timate leads to an instantaneous Peclet number
Pe5uRuR0
2
Rk, ~6!
which can become as large as 104 at the Rayleigh collapse.According to Figure 1 of Ref. 42 showingg(Pe) or Pros-peretti, Crum, and Commander’s fit of that curve,44 impliesg'5/3 for argon at the time of the collapse. However, sincePe(t)@1 only holds in very small time intervals;1 ns, theglobal dynamics are hardly affected by setting the effectivepolytropic exponentg51 uniformly in time. Note that withg51 Equation~5! should not be thought of as an equation ofstate but rather as a process equation parametrizing the iso-thermal conditions at the bubble wall, induced by the largeheat capacity of water. The choice ofg51 is confirmed bythe full numerical simulations of Vuong and Szeri45 and by
FIG. 6. Forcing pressure~in atm! with amplitudePa51.3 atm, bubble ra-dius R(t) ~in mm! with the typical collapse~‘‘Rayleigh collapse’’! after themaximum, Mach numberM (t)5R(t)/cg(t) ~wherecg is the speed of soundin the gas!, and temperatureQ(t) ~in K! as function of time for a bubblewith R052 mm ~top to bottom!.
6989D. Lohse and S. Hilgenfeldt: Inert gas in sonoluminescing bubbles
J. Chem. Phys., Vol. 107, No. 17, 1 November 1997 This article is copyrighted as indicated in the article. Reuse of AIP content is subject to the terms at: http://scitation.aip.org/termsconditions. Downloaded to IP:
209.183.183.254 On: Sun, 07 Dec 2014 20:58:08

the analysis of Kamathet al.46 Note that, as a consequence,there are heat fluxes back and forth across the bubble wall.
Another confirmation for puttingg51 for the bubbledynamics comes from a recent work of Yasui,47 who mod-eled the heat flow through the bubble wall and also includedwater evaporation and condensation. Consideration of theseeffects47 fits the experimentally measuredR(t) curves13,14,36
pretty well.48 However, the essence of the dynamics is thesame as with simply puttingg51 and the phase diagramswe are going to calculate in this paper are hardly affected byneglecting the details of the thermal effects.
Even if thermal effects are simply treated by puttingg51 for most of the time during the bubble oscillation, theyare essential at the final stage of the collapse and thus forestimates of thetemperatureachieved in the bubble. Thepresent understanding5,44 is that the only way to reliably pre-dict the temperatures in the bubble is a full numerical simu-lation of the gas dynamical equations inside the bubble.Clearly, for strong enough forcing, shock waves will bounceback and forth inside the bubble and the spatial temperaturedistribution in the bubble will be highly inhomogeneous.49
Such full numerical calculation is not within the spirit ofthe Rayleigh–Plesset SL bubble approach.18 We thereforecome back to Prosperetti’s41 model and estimate also in thecase of nonlinear bubble oscillations the temperature withinthat model. For example, we calculate the instantaneous Pe-clet number~6!, determine the resulting effective polytropicexponentgeff from Figure 1 of Ref. 42 and assume a van derWaals behavior of the internal gas according to
Q~ t !5Q l S R032h3
R3~ t !2h3D geff21
, ~7!
whereQ l is the temperature of the liquid. This, as any modelwhich neglects spatial inhomogeneities in the gas, is a verycrude model for the temperature and will only be able to giveorders of magnitude. The physical statements resulting fromit, however, donot depend on details of this model and so wefeel that such an approach is justified.
It can be seen from Figures 7c and 6d that this tempera-ture model gives the correct trends. In Figure 7c we show themaximalgeff per cycle as a function ofPa . We also give theminimal and the maximal bubble radius in Figures 7a and b.For smallPa the maximal effective polytropic exponentgeff
is close to one and jumps toward 5/3 at the transition fromthe sinusoidal to the bouncing bubbleR(t) dynamics. Thistransition has been analyzed in detail in Ref. 50. The tem-peratureQ(t) from Equation~7! is shown in Figure 6d. Itstrongly peaks at the collapse; for all other times it essen-tially equals the liquid temperatureQ l ~5293 K in this ex-ample!. The heating at the collapse can be enormous.
What are the temperatures achieved in this approach? InFigures 7d and 8 we plot themaximaltemperature within ourmodel as a function ofR0 andPa . In the parameter regimeof interest for SL, values as high as 20000–60000 K areachieved. These values agree order of magnitude-wise withthe independent results of Bernsteinet al.,35,51who extracted
the temperature from the spectral shape and obtained 30000to 60000 K, depending on the gas contents.
IV. PHASE DIAGRAMS FOR AIR BUBBLES
Now consider a bubble in water containing a mixture ofa reactive gas~taken to be N2! and an inert gas Ar. The totalnumber of moles of gas in the bubble is
Ntot54pR0
3P0
3GQ05NN2
1NAr , ~8!
where Q05273 K is the normal temperature andG58.3143 J/~mol K! is the gas constant. The argon ratiointhe bubble is
jb5NAr
Ntot, ~9!
and that of nitrogen
12jb5NN2
Ntot. ~10!
FIG. 7. The minimal radius, the maximal radius, the maximal effectivepolytropic exponentgeff , and the maximal temperatureQmax are shown fortwo different ambient radiiR052 mm ~solid! andR055 mm ~dashed! as afunction of the forcing pressure amplitudePa . For smaller bubbles thecrossover from the harmonically oscillating regime for smallPa to thebouncing bubble regime for largePa is more abrupt.
FIG. 8. Maximal temperature in the bubble as a function ofR0 and Pa
within our model calculation.
6990 D. Lohse and S. Hilgenfeldt: Inert gas in sonoluminescing bubbles
J. Chem. Phys., Vol. 107, No. 17, 1 November 1997 This article is copyrighted as indicated in the article. Reuse of AIP content is subject to the terms at: http://scitation.aip.org/termsconditions. Downloaded to IP:
209.183.183.254 On: Sun, 07 Dec 2014 20:58:08
If cAr(r ,t) andcN2(r ,t) are the concentration fields of Ar andN2 in the liquid, respectively, the rate of change of the num-ber of moles of N2 and Ar in the bubble is given by
NAr54pR2DAr] rc
Arur 5R
mAr, ~11!
NN25
4pR2DN2] rc
N2ur 5R
mN2
2ANN2expS 2
Q*
Q D . ~12!
Here, DAr , DN2, mAr and mN2
are the respective diffusionconstants and molecular masses. The concentration fieldsobey a mass advection diffusion equation,18,20whose bound-ary conditions are set by the external concentrations
ca~`,t !5c`a5c0
ap`
a
P0
~Henry’s law! and by the partial gas pressurespa(t) in thebubble
ca~R~ t !,t !5c0a pa~R~ t !!
P0,
a5Ar, N2. The solubilities for nitrogen and argon are dif-ferent,c0
Ar50.061 kg/m3 andc0N250.020 kg/m3.52 The diffu-
sion constants are approximately the same,53 DAr5DN2
5231029 m2/s. The second term in Eq.~12! represents thebubble’s nitrogen loss by chemical reaction. The reactionrate will depend on the temperatureQ(t) in the bubble. Forsimplicity, we assume that the reactions follow an Arrheniuslaw, with empirical parameters appropriate for nitrogendissociation ~Ref. 51!: A5631019(Q0 /Q)2.5(r0 /mN2
)3(R0 /R)3 cm3/~mol s! giving the time scale of the reaction;Q* 5113000 K51 is the activation temperature andr0 theequilibrium gas density. This reaction law is rather crude, asit neglects backward reactions as well as the kinetics of theexpulsion of reaction products; however, it is sufficient forthis demonstrative calculation.
We can straightforwardly extend the adiabatic approxi-mation of the slow diffusional dynamics15,18,20~i.e., separa-tion of times scales! to Equations~11!, ~12!. The only re-quirement is that the involved chemical reactions are fastcompared to diffusional processes which definitely is thecase. The result of the adiabatic approximation is that thechange per cycle is given by
DNAr
T5
4pDArc0Ar
mArP0I~p`
Ar2jb^p&4!, ~13!
DNN2
T5
4pDN2c0
N2
mN2P0I
~p`N22~12jb!^p&4!
2NN2^A exp~2Q* /Q!&0 ~14!
with the weightedtime averages
^ f ~ t !& i5*0
Tf ~ t !Ri~ t !dt
*0TRi~ t !dt
. ~15!
For further simplification in the numerical calculations tocome we in addition employ the saddle point approximationof the integralI defined by
I 5E0
` dh8
^~3h81R3~ t !!4/3&0~16!
as I'1/Rmax, as already done in Ref. 15.The last term in Eq.~14! will only contribute at the
collapse whenQ(t) is large. The chemical reaction rate willdepend on the detailed space and time dependence of thetemperature in the bubble which we model by the polytropiclaw ~7!–as explained in the previous section.
With these approximations equilibrium pointsDNAr5DNN2
50 in the two dimensional space (NAr ,NN2),
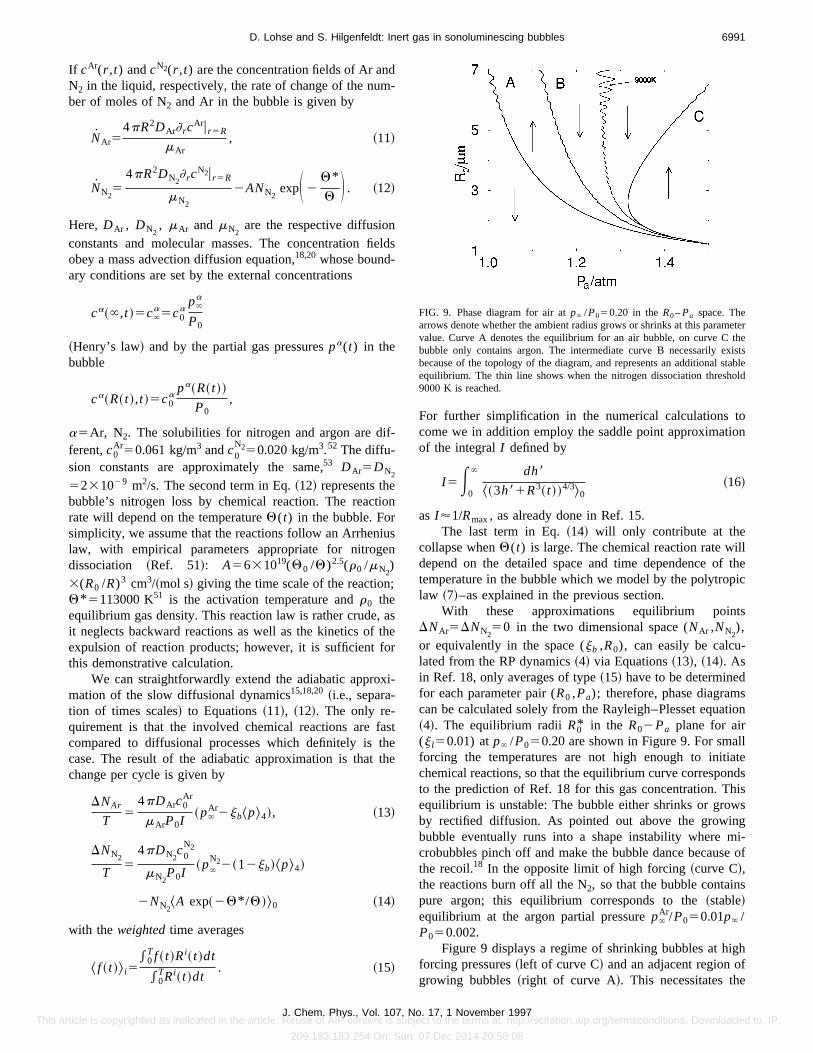
or equivalently in the space (jb ,R0), can easily be calcu-lated from the RP dynamics~4! via Equations~13!, ~14!. Asin Ref. 18, only averages of type~15! have to be determinedfor each parameter pair (R0 ,Pa); therefore, phase diagramscan be calculated solely from the Rayleigh–Plesset equation~4!. The equilibrium radiiR0* in the R02Pa plane for air(j l50.01) atp` /P050.20 are shown in Figure 9. For smallforcing the temperatures are not high enough to initiatechemical reactions, so that the equilibrium curve correspondsto the prediction of Ref. 18 for this gas concentration. Thisequilibrium is unstable: The bubble either shrinks or growsby rectified diffusion. As pointed out above the growingbubble eventually runs into a shape instability where mi-crobubbles pinch off and make the bubble dance because ofthe recoil.18 In the opposite limit of high forcing~curve C!,the reactions burn off all the N2, so that the bubble containspure argon; this equilibrium corresponds to the~stable!equilibrium at the argon partial pressurep`
Ar/P050.01p` /P050.002.
Figure 9 displays a regime of shrinking bubbles at highforcing pressures~left of curve C! and an adjacent region ofgrowing bubbles~right of curve A!. This necessitates the
FIG. 9. Phase diagram for air atp` /P050.20 in theR0–Pa space. Thearrows denote whether the ambient radius grows or shrinks at this parametervalue. Curve A denotes the equilibrium for an air bubble, on curve C thebubble only contains argon. The intermediate curve B necessarily existsbecause of the topology of the diagram, and represents an additional stableequilibrium. The thin line shows when the nitrogen dissociation threshold9000 K is reached.
6991D. Lohse and S. Hilgenfeldt: Inert gas in sonoluminescing bubbles
J. Chem. Phys., Vol. 107, No. 17, 1 November 1997 This article is copyrighted as indicated in the article. Reuse of AIP content is subject to the terms at: http://scitation.aip.org/termsconditions. Downloaded to IP:
209.183.183.254 On: Sun, 07 Dec 2014 20:58:08

existence of an additional equilibrium at intermediate forcingpressures, curve B in Figure 9, for which growth by rectifieddiffusion and mass loss by reactions balance. This additionalequilibrium occurs close to the point of nitrogen dissociation,and turns out to be stable; the argon fractionjb* for thisequilibrium is slightly larger than the fractionj l in the liquid~for not too strong forcing!.
In Figure 10 we present the net loss/gain per cycle forboth argon and nitrogen for aR055 mm bubble. At smallPa,1.15 atm the second term in Equation~14! is not impor-tant as the gas does not become hot enough. The bubblediffusively shrinks~for Pa,1.045 atm! or grows because ofrectified diffusion; the argon ratio is constant atjb* 5j l50.01. In between the shrinking and the growing re-gime is the unstable equilibrium point A. AroundPa51.17 atm the heating is sufficient to lead to some nitro-gen dissociation and atPa51.18 atm the nitrogen lossthrough dissociation balances its gain through rectified diffu-sion. At that forcing pressure also argon is in equilibrium asthe argon ratio has increased up tojb* '0.1 so thatp`
Ar5jb* ^p&4 : We have reached the stable equilibrium pointB. At larger forcing pressurePa the bubble is in the disso-lution island. For increasingPa the nitrogen loss becomesless because less and less nitrogen is left in the bubble. Theargon loss, on the other hand, diminishes because we ap-proach the stable diffusive equilibrium point C atPa'1.4 atm. Beyond this forcing pressure, the bubblegrows again by rectified argon diffusion; essentially no ni-trogen is left in the bubble (12jb* '631025 atPa51.40 atm!. Note that because of the separation of timescales the values onjb* refer to anaveragevalue over thewhole cycle. When the bubble is close to its maximum, thenitrogen concentration will be slightly larger, right at thecollapse the argon concentration will be slightly larger.
How robust is this picture, i.e., how does it depend on
details of temperature dynamics and the chemical reactionmechanism which are both poorly understood? The largeR0
parts of branches A and C do not depend at all on thesedetails. The reason becomes clear from Figure 11 in whichwe show the equilibrium compositionjb* as a function ofR0
andPa . It is given by
DNAr~jb* !
DNN2~jb* !
5jb*
12jb*. ~17!
Plugging~13! and~14! into ~17! gives the quadratic equationfor the equilibrium argon ratiojb* ,
~a1e!jb*21~b2e!jb* 1d50 ~18!
with the coefficients
a54p
I
^p&4
P0S DN2
c0N2
mN2
2DArc0
Ar
mArD , ~19!
b54p
IP0S DN2
c0N2
mN2
~p`N22^p&4!1
DArc0Ar
mAr~p`
Ar1^p&4!D ,
~20!
e54pP0R0
3
3GQ0K A expS 2
Q*
Q D L0
, ~21!
d524pDArc`
Ar
ImAr. ~22!
From the two solutions only the one with 0<jb* <1 hasphysical meaning. The interpretation of Figure 11 is straight-forward: Weakly forced bubbles havejb* 'j l , thusp` /P050.20 is relevant for stability. Strongly forcedbubbles havejb* '1@j l , thusp`
Ar/P050.002 is the relevantquantity. The transition between these regimes is abrupt, andoccurs when the bubble temperature surpasses the dissocia-tion temperature~'9000 K for N2!. Where exactly this hap-pens depends on the model of the temperature and thus sodoes the equilibrium curve B in Figure 9.
However, theexistenceof this additional stable equilib-rium is independent of the model details. It simply followsfrom topological reasons: To the right of the curve A the
FIG. 10. The top curve shows the equilibrium argon ratiojb* in a R055 mmbubble as a function of the forcing pressurePa . The bottom curve presentsthe corresponding argon and nitrogen loss/gain per cycle, normalized to thetotal amount of moles.
FIG. 11. The fractionjb* of argon in the bubble as a function ofPa andR0 .
6992 D. Lohse and S. Hilgenfeldt: Inert gas in sonoluminescing bubbles
J. Chem. Phys., Vol. 107, No. 17, 1 November 1997 This article is copyrighted as indicated in the article. Reuse of AIP content is subject to the terms at: http://scitation.aip.org/termsconditions. Downloaded to IP:
209.183.183.254 On: Sun, 07 Dec 2014 20:58:08
bubbles are growing, to the left of curve C they are shrink-ing, so in between there must be an equilibrium. Indeed, asmentioned already above and shown in Figure 5, Holt andGaitan’s22 recent detailed measurements ofR02Pa phasediagrams found such a classically unexpected equilibrium~for the same air pressurep` /P050.20 as chosen here! andthe connected largePa ‘‘dissolution island’’ between curvesB and C.
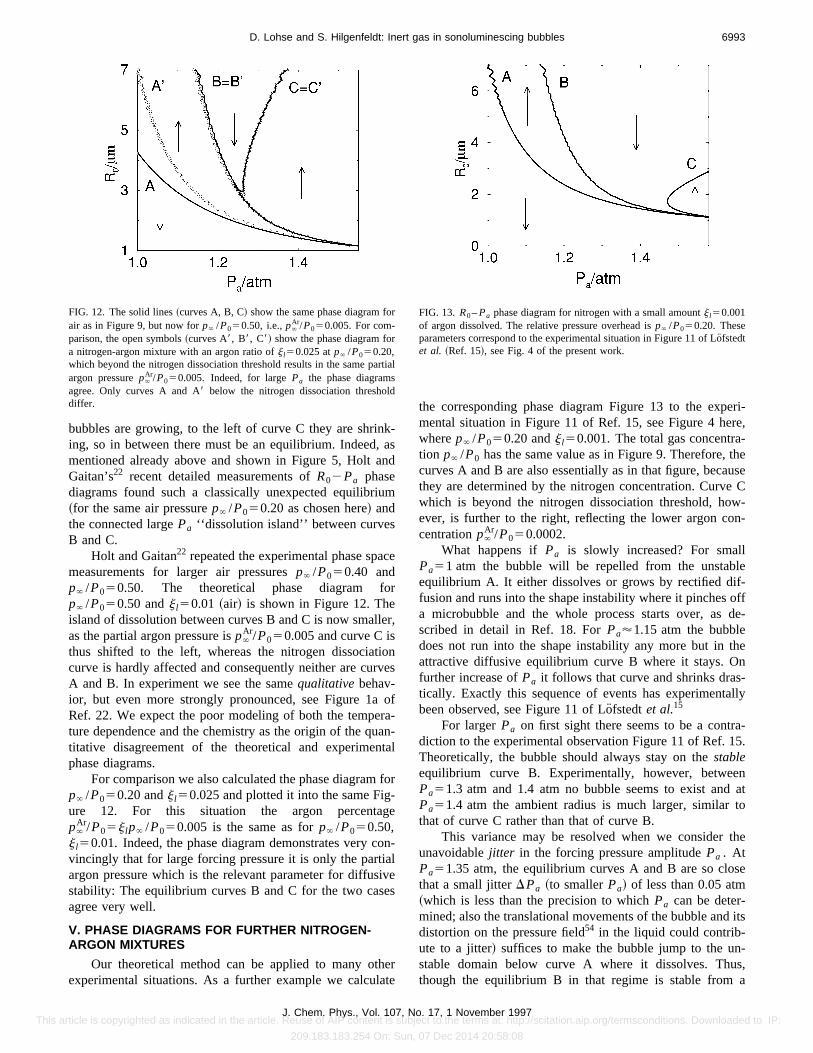
Holt and Gaitan22 repeated the experimental phase spacemeasurements for larger air pressuresp` /P050.40 andp` /P050.50. The theoretical phase diagram forp` /P050.50 andj l50.01 ~air! is shown in Figure 12. Theisland of dissolution between curves B and C is now smaller,as the partial argon pressure isp`
Ar/P050.005 and curve C isthus shifted to the left, whereas the nitrogen dissociationcurve is hardly affected and consequently neither are curvesA and B. In experiment we see the samequalitativebehav-ior, but even more strongly pronounced, see Figure 1a ofRef. 22. We expect the poor modeling of both the tempera-ture dependence and the chemistry as the origin of the quan-titative disagreement of the theoretical and experimentalphase diagrams.
For comparison we also calculated the phase diagram forp` /P050.20 andj l50.025 and plotted it into the same Fig-ure 12. For this situation the argon percentagep`
Ar/P05j l p` /P050.005 is the same as forp` /P050.50,j l50.01. Indeed, the phase diagram demonstrates very con-vincingly that for large forcing pressure it is only the partialargon pressure which is the relevant parameter for diffusivestability: The equilibrium curves B and C for the two casesagree very well.
V. PHASE DIAGRAMS FOR FURTHER NITROGEN-ARGON MIXTURES
Our theoretical method can be applied to many otherexperimental situations. As a further example we calculate
the corresponding phase diagram Figure 13 to the experi-mental situation in Figure 11 of Ref. 15, see Figure 4 here,wherep` /P050.20 andj l50.001. The total gas concentra-tion p` /P0 has the same value as in Figure 9. Therefore, thecurves A and B are also essentially as in that figure, becausethey are determined by the nitrogen concentration. Curve Cwhich is beyond the nitrogen dissociation threshold, how-ever, is further to the right, reflecting the lower argon con-centrationp`
Ar/P050.0002.What happens ifPa is slowly increased? For small
Pa51 atm the bubble will be repelled from the unstableequilibrium A. It either dissolves or grows by rectified dif-fusion and runs into the shape instability where it pinches offa microbubble and the whole process starts over, as de-scribed in detail in Ref. 18. ForPa'1.15 atm the bubbledoes not run into the shape instability any more but in theattractive diffusive equilibrium curve B where it stays. Onfurther increase ofPa it follows that curve and shrinks dras-tically. Exactly this sequence of events has experimentallybeen observed, see Figure 11 of Lo¨fstedtet al.15
For largerPa on first sight there seems to be a contra-diction to the experimental observation Figure 11 of Ref. 15.Theoretically, the bubble should always stay on thestableequilibrium curve B. Experimentally, however, betweenPa51.3 atm and 1.4 atm no bubble seems to exist and atPa51.4 atm the ambient radius is much larger, similar tothat of curve C rather than that of curve B.
This variance may be resolved when we consider theunavoidablejitter in the forcing pressure amplitudePa . AtPa51.35 atm, the equilibrium curves A and B are so closethat a small jitterDPa ~to smallerPa! of less than 0.05 atm~which is less than the precision to whichPa can be deter-mined; also the translational movements of the bubble and itsdistortion on the pressure field54 in the liquid could contrib-ute to a jitter! suffices to make the bubble jump to the un-stable domain below curve A where it dissolves. Thus,though the equilibrium B in that regime is stable from a
FIG. 12. The solid lines~curves A, B, C! show the same phase diagram forair as in Figure 9, but now forp` /P050.50, i.e.,p`
Ar/P050.005. For com-parison, the open symbols~curves A8, B8, C8! show the phase diagram fora nitrogen-argon mixture with an argon ratio ofj l50.025 atp` /P050.20,which beyond the nitrogen dissociation threshold results in the same partialargon pressurep`
Ar/P050.005. Indeed, for largePa the phase diagramsagree. Only curves A and A8 below the nitrogen dissociation thresholddiffer.
FIG. 13. R0–Pa phase diagram for nitrogen with a small amountj l50.001of argon dissolved. The relative pressure overhead isp` /P050.20. Theseparameters correspond to the experimental situation in Figure 11 of Lo¨fstedtet al. ~Ref. 15!, see Fig. 4 of the present work.
6993D. Lohse and S. Hilgenfeldt: Inert gas in sonoluminescing bubbles
J. Chem. Phys., Vol. 107, No. 17, 1 November 1997 This article is copyrighted as indicated in the article. Reuse of AIP content is subject to the terms at: http://scitation.aip.org/termsconditions. Downloaded to IP:
209.183.183.254 On: Sun, 07 Dec 2014 20:58:08

mathematical point of view, from a physical point of view itmay be not and the bubble can dissolve. Support for thisclaim could come from an experiment in which the jitter isartificially increased: the gap in Figure 4 where no bubbleexists should widen.
With the help of the phase diagram Figure 13 we nowbetter understand the above-mentioned hysteresis. The stablepart of branch C is reached by a fast increase ofPa . Thebubble is then boosted into the growing regime below thestable branch of curve C. Subsequently, this stable branch Cis reached through rectified diffusion. On the other hand, ifPa is decreased fromPa51.4 atm, the bubble will first fol-low the stable equilibrium curve C and shrink. At the bifur-cation point it falls off the equilibrium curve and shrinkstoward the stable curve B. Because of the jitter inPa curve Bmay not be able to trap the bubble as explained above andthe bubble dissolves. Even a fast decrease ofPa towardmuch smaller values'1.1 atm does not save the bubblefrom dissolution as it only contains argon and the nitrogenneeded for a stable equilibrium has been burned off in thefirst part of the cycle during whichPa was increased andrecollecting nitrogen only happens on the slow diffusive timescale.
For even lower argon concentration as, e.g., in Figure 14where we chosej l50.0001 andp` /P050.20 the situation issimilar. The only difference is that curve C moves even fur-
ther to the right and may not be reached in experiment be-cause of the~short time scale! shape instabilities discussed inRefs. 18 and 25.
Let us discuss the situation in the limiting casej l50,i.e., pure nitrogen. As explained above forj l50.001, onincreasingPa the bubble should first ‘‘dance’’ because ofgrowth by rectified diffusion and pinching off of mi-crobubbles and then it should be caught by thestable ~butnot necessarily sonoluminescing! equilibrium curve B. Atthis equilibrium bubble growth by rectified diffusion and ni-trogen loss by dissociation again just balance. For largePa;1.3 atm the bubble should dissolve by the same mecha-nism discussed above: Curves A and B are so close that ajitter in Pa leads to a jump from the stable equilibrium curveB to the dissolution domain below the unstable curve A. Wesuggest to experimentally look for the stable equilibriumcurve B which is suggested by the nitrogen dissociation hy-pothesis.
What experiments on pure nitrogen bubbles have beendone up to now? To our knowledge only one experiment hasbeen reported~Hiller et al.11!. In that experiment the nitro-gen was 99.7% pure. Hilleret al.11 managed to measure ex-tremely weakly sonoluminescing unstable bubbles whichwere hard to keep alive. This supports the presented theorythat in the strong forcing regime the high temperature de-stroys the nitrogen and thus the bubbles. However, the lightintensity Figure 5 of Ref. 11 shows an oscillating pattern~ona time scale of seconds! which we do not understand.
VI. INERT GAS MIXTURES
It is interesting to note that the chemical instability ofone component of the gas mixture is not a necessary require-ment for the accumulation of one gas species in the bubble.A similar accumulation can be achieved for inert gas mix-tures if the diffusion constants and the equilibrium concen-trations of the two gases in the mixtures are different. As anexample we consider a 1:1 mixture of helium and argon atp` /P050.20, i.e.,j l50.50 for the argon ratio. The diffusionconstants areDAr5231029 m2/s andDHe55.831029 m2/s53
and the equilibrium concentrations arec0Ar561 g/m3 and
c0He50.78 g/m3.52 The molecular masses aremAr540 g/mol
and mHe54 g/mol. The resulting equilibrium concentrationjb* in the bubble is shown in Figure 15. For small forcing,helium accumulates in the bubble and for large forcing, ar-gon accumulates. The borderline between these two regimesis the unstable diffusive equilibrium curve calculated in Ref.18 and denoted ‘‘curve A’’ within the plots shown here. Asno reactions occur, this is the only equilibrium: Below thatcurve bubbles diffusively shrink, above it they grow by rec-tified diffusion. From this behavior the helium or argon ac-cumulation can immediately be qualitatively understood:The diffusive change of mass is proportional to the productof the material constantsDc0 /m, see Eq. ~13!. NowDArc0
Ar/mAr53.131029 mol s21 m21 and DHec0He/mHe51.1
31029 mol s21 m21. Thus in the shrinking regime argon canescape faster and helium accumulates. By contrast, in thegrowing regime the rectified diffusion of argon into the
FIG. 14. Phase diagram inR0–Pa space forp` /P050.20 and a tiny argonconcentration ofj l50.0001. Only for very high forcing pressure diffusivelystable bubbles are possible~but are likely to be unstable towards the surfaceshape instability!. The bottom figure shows an enlargement of the lowerright part of the top figure.
6994 D. Lohse and S. Hilgenfeldt: Inert gas in sonoluminescing bubbles
J. Chem. Phys., Vol. 107, No. 17, 1 November 1997 This article is copyrighted as indicated in the article. Reuse of AIP content is subject to the terms at: http://scitation.aip.org/termsconditions. Downloaded to IP:
209.183.183.254 On: Sun, 07 Dec 2014 20:58:08
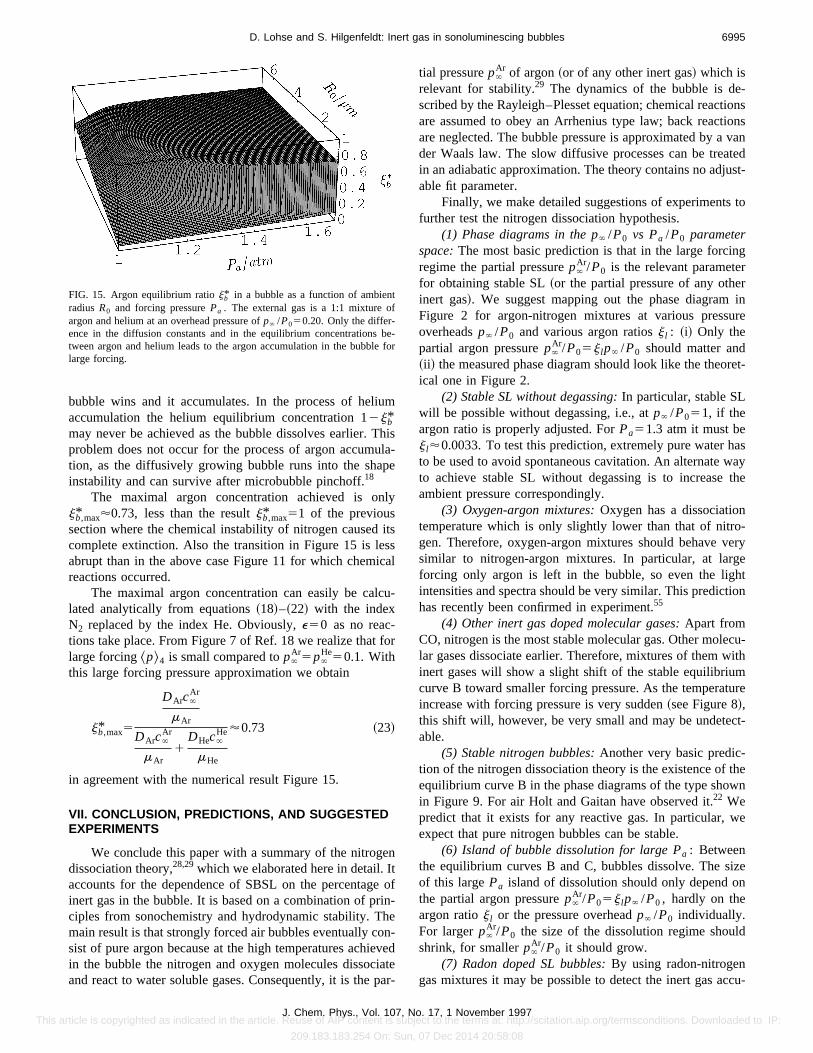
bubble wins and it accumulates. In the process of heliumaccumulation the helium equilibrium concentration 12jb*may never be achieved as the bubble dissolves earlier. Thisproblem does not occur for the process of argon accumula-tion, as the diffusively growing bubble runs into the shapeinstability and can survive after microbubble pinchoff.18
The maximal argon concentration achieved is onlyjb,max* '0.73, less than the resultjb,max* 51 of the previoussection where the chemical instability of nitrogen caused itscomplete extinction. Also the transition in Figure 15 is lessabrupt than in the above case Figure 11 for which chemicalreactions occurred.
The maximal argon concentration can easily be calcu-lated analytically from equations~18!–~22! with the indexN2 replaced by the index He. Obviously,e50 as no reac-tions take place. From Figure 7 of Ref. 18 we realize that forlarge forcing^p&4 is small compared top`
Ar5p`He50.1. With
this large forcing pressure approximation we obtain
jb,max* 5
DArc`Ar
mAr
DArc`Ar
mAr1
DHec`He
mHe
'0.73 ~23!
in agreement with the numerical result Figure 15.
VII. CONCLUSION, PREDICTIONS, AND SUGGESTEDEXPERIMENTS
We conclude this paper with a summary of the nitrogendissociation theory,28,29which we elaborated here in detail. Itaccounts for the dependence of SBSL on the percentage ofinert gas in the bubble. It is based on a combination of prin-ciples from sonochemistry and hydrodynamic stability. Themain result is that strongly forced air bubbles eventually con-sist of pure argon because at the high temperatures achievedin the bubble the nitrogen and oxygen molecules dissociateand react to water soluble gases. Consequently, it is the par-
tial pressurep`Ar of argon~or of any other inert gas! which is
relevant for stability.29 The dynamics of the bubble is de-scribed by the Rayleigh–Plesset equation; chemical reactionsare assumed to obey an Arrhenius type law; back reactionsare neglected. The bubble pressure is approximated by a vander Waals law. The slow diffusive processes can be treatedin an adiabatic approximation. The theory contains no adjust-able fit parameter.
Finally, we make detailed suggestions of experiments tofurther test the nitrogen dissociation hypothesis.
(1) Phase diagrams in the p/P0 vs Pa /P0 parameterspace:The most basic prediction is that in the large forcingregime the partial pressurep`
Ar/P0 is the relevant parameterfor obtaining stable SL~or the partial pressure of any otherinert gas!. We suggest mapping out the phase diagram inFigure 2 for argon-nitrogen mixtures at various pressureoverheadsp` /P0 and various argon ratiosj l : ~i! Only thepartial argon pressurep`
Ar/P05j l p` /P0 should matter and~ii ! the measured phase diagram should look like the theoret-ical one in Figure 2.
(2) Stable SL without degassing:In particular, stable SLwill be possible without degassing, i.e., atp` /P051, if theargon ratio is properly adjusted. ForPa51.3 atm it must bej l'0.0033. To test this prediction, extremely pure water hasto be used to avoid spontaneous cavitation. An alternate wayto achieve stable SL without degassing is to increase theambient pressure correspondingly.
(3) Oxygen-argon mixtures:Oxygen has a dissociationtemperature which is only slightly lower than that of nitro-gen. Therefore, oxygen-argon mixtures should behave verysimilar to nitrogen-argon mixtures. In particular, at largeforcing only argon is left in the bubble, so even the lightintensities and spectra should be very similar. This predictionhas recently been confirmed in experiment.55
(4) Other inert gas doped molecular gases:Apart fromCO, nitrogen is the most stable molecular gas. Other molecu-lar gases dissociate earlier. Therefore, mixtures of them withinert gases will show a slight shift of the stable equilibriumcurve B toward smaller forcing pressure. As the temperatureincrease with forcing pressure is very sudden~see Figure 8!,this shift will, however, be very small and may be undetect-able.
(5) Stable nitrogen bubbles:Another very basic predic-tion of the nitrogen dissociation theory is the existence of theequilibrium curve B in the phase diagrams of the type shownin Figure 9. For air Holt and Gaitan have observed it.22 Wepredict that it exists for any reactive gas. In particular, weexpect that pure nitrogen bubbles can be stable.
(6) Island of bubble dissolution for large Pa : Betweenthe equilibrium curves B and C, bubbles dissolve. The sizeof this largePa island of dissolution should only depend onthe partial argon pressurep`
Ar/P05j l p` /P0 , hardly on theargon ratioj l or the pressure overheadp` /P0 individually.For largerp`
Ar/P0 the size of the dissolution regime shouldshrink, for smallerp`
Ar/P0 it should grow.(7) Radon doped SL bubbles:By using radon-nitrogen
gas mixtures it may be possible to detect the inert gas accu-
FIG. 15. Argon equilibrium ratiojb* in a bubble as a function of ambientradius R0 and forcing pressurePa . The external gas is a 1:1 mixture ofargon and helium at an overhead pressure ofp` /P050.20. Only the differ-ence in the diffusion constants and in the equilibrium concentrations be-tween argon and helium leads to the argon accumulation in the bubble forlarge forcing.
6995D. Lohse and S. Hilgenfeldt: Inert gas in sonoluminescing bubbles
J. Chem. Phys., Vol. 107, No. 17, 1 November 1997 This article is copyrighted as indicated in the article. Reuse of AIP content is subject to the terms at: http://scitation.aip.org/termsconditions. Downloaded to IP:
209.183.183.254 On: Sun, 07 Dec 2014 20:58:08

mulation in the bubble because of the radioactivity of radon.(8) Inert gas accumulation:Even for a mixture of non-
reactive gases as He and Ar we in general havejbÞj l . Inthe large forcing pressure regime argon accumulates for thisexample.
(9) pH measurements for air bubbles:A very appealingtest is to measure the concentration of the reaction productsof the dissociated gases as a function of time, as already donein MBSL.38 For nitrogen-argon mixtures nitrous acid produc-tion would lead to a decrease in pH as already predicted inRef. 29. For an estimate of the production rate we assumethat all the nitrogen that diffuses into the bubble during thebubble expansion is burned off at the collapse. This amountis estimated in Ref. 15 as
DNN25
2pDN2c`
N2RmaxT
mN2
~24!
per cycle. With typical values ofRmax510R0 for the maxi-mal radius,R055 mm, DN2
5231029 m2/s, c`N2'0.20c0
N2 ,
c0N250.02 kg/m3, and T538 ms one obtains
DNN2'3310218 mol per cycle or;3310210 mol of N2 per
hour converted to reaction products. The consequence is asmall but detectable pH decrease: In a 100 ml flask with purewater (pH57) there are initially 1028 mol H1 ions. Assumethat all ejected N atoms eventually form either HNO2 orHNO3, then 6310210 mol H1 ions are produced. Thismeans a concentration increase to (10271631029) mol/l ora pH value of 6.975 after an hour.
(10) pH measurements for bubbles of other gas mix-tures: As a blind test one should also measure the pH as afunction of time for pure argon bubbles. No pH changeshould occur. Neither do we expect a pH change for oxygen-argon mixtures as the main reaction product of the dissoci-ated oxygen should be H2O2.
ACKNOWLEDGMENTS
We are grateful to Michael Brenner for our joint devel-opment of the Rayleigh–Plesset SL bubble approach. Thisongoing collaboration has always been a pleasure to all of us.We thank him for lots of discussions and exchange over thelast years. Without him this work would not have been pos-sible. Many thanks also go to Todd Dupont, Siegfried Gross-mann, Leo Kadanoff, Blaine Johnston, David Oxtoby, andKen Suslick. We would also like to acknowledge Brad Bar-ber’s remark that high partial pressure air bubbles experi-mentally behave similar to low partial pressure argonbubbles, see Ref. 13. Support for this work by the DeutscheForschungsgemeinschaft ~DFG! under Grant No.SBF185-D8 is acknowledged.
1H. Frenzel and H. Schultes, Z. Phys. Chem.27B, 421 ~1934!.2E. N. Harvey, J. Am. Chem. Soc.61, 2392~1939!.3H. Kuttruff, Acustica12, 230 ~1962!.4M. A. Margulis, Ultrasonics23, 157 ~1985!.5C. E. Brennen,Cavitation and Bubble Dynamics~Oxford UniversityPress, Oxford, 1995!.
6D. F. Gaitan, Ph.D. thesis, The University of Mississippi, 1990; D. F.
Gaitan, L. A. Crum, R. A. Roy, and C. C. Church, J. Acoust. Soc. Am.91,3166 ~1992!.
7L. A. Crum, Phys. Today47, 22 ~1994!; S. J. Putterman, Sci. Am.272, 32~1995!.
8B. P. Barber and S. J. Putterman, Nature~London! 352, 318 ~1991!.9B. P. Barber and S. J. Putterman, Phys. Rev. Lett.69, 3839~1992!.
10R. Hiller, S. J. Putterman, and B. P. Barber, Phys. Rev. Lett.69, 1182~1992!.
11R. Hiller, K. Weninger, S. J. Putterman, and B. P. Barber, Science266,248 ~1994!.
12R. Hiller and S. J. Putterman, Phys. Rev. Lett.75, 3549~1995!, also seethe erratum, Phys. Rev. Lett.77, 2345~1996!.
13B. P. Barber, K. Weninger, R. Lo¨fstedt, and S. J. Putterman, Phys. Rev.Lett. 74, 5276~1995!.
14R. Lofstedt, B. P. Barber, and S. J. Putterman, Phys. Fluids A5, 2911~1993!.
15R. Lofstedt, K. Weninger, S. J. Putterman, and B. P. Barber, Phys. Rev. E51, 4400~1995!.
16K. Weningeret al., J. Phys. Chem.99, 14195~1995!.17L. A. Crum, J. Acoust. Soc. Am.57, 1363~1975!.18S. Hilgenfeldt, D. Lohse, and M. P. Brenner, Phys. Fluids8, 2808~1996!.19A. Eller, J. Acoust. Soc. Am.46, 1246~1969!; A. Eller and L.A. Crum, J.
Acoust. Soc. Am. Suppl.47, 762 ~1970!.20M. M. Fyrillas and A. J. Szeri, J. Fluid Mech.277, 381 ~1994!.21M. P. Brenner, D. Lohse, D. Oxtoby, and T. F. Dupont, Phys. Rev. Lett.
76, 1158~1996!.22G. Holt and F. Gaitan, Phys. Rev. Lett.77, 3791~1996!.23M. Plesset, J. Appl. Phys.25, 96 ~1954!; H. W. Strube, Acustica25, 289
~1971!.24A. Prosperetti, Q. Appl. Math.34, 339 ~1977!.25M. P. Brenner, D. Lohse, and T. F. Dupont, Phys. Rev. Lett.75, 954
~1995!.26J. Holzfuss~private communication, 1997!. Similar experiments were also
made by F. Gaitan and G. Holt. The features of unstable SBSL are alsoseen in the acoustic signal, see J. Holzfuss, M. Ru¨ggeberg, and A. Billo,Fortschritte der Akustik-DAGA 97, Bad Honnef: DPG GmbH~1997!.
27R. G. Holt, D. F. Gaitan, A. A. Atchley, and J. Holzfuss, Phys. Rev. Lett.72, 1376~1994!.
28M. P. Brenner, S. Hilgenfeldt, and D. Lohse, inNonlinear Physics ofComplex Systems—Current Status and Future Trends, edited by J. Parisi,S. C. Muller, and W. Zimmermann~Springer, Berlin, 1996!, p. 79.
29D. Lohse, M. Brenner, T. Dupont, S. Hilgenfeldt, and B. Johnston, Phys.Rev. Lett.78, 1359~1997!.
30A. Weissler, J. Acoust. Soc. Am.25, 651 ~1953!.31R. E. Verral and C. M. Sehgal, inSonoluminescence in Ultrasound: Its
Chemical, Physical and Biological Effects, edited by K. Suslick~VCH,Weinheim, 1988!, p. 227.
32K. Suslick, Science247, 1439 ~1990!; E. B. Flint and K. Suslick,ibid.253, 1397 ~1991!; K. Suslick, E. B. Flint, M. W. Grinstaff, and K. A.Kemper, J. Phys. Chem.97, 3098 ~1993!; K. Suslick, The Yearbook ofScience and the Future 1994, Encyclopedia Britannica, Chicago, pp. 138–155; T. Matulaet al., Phys. Rev. Lett.75, 2602~1995!.
33H. Schultes and H. Gohr, Angew. Chem.49, 420 ~1936!.34This value follows from the tabulated values for the enthalpy and the
entropy changes, see, e.g., G. M. Barrow,Physical Chemistry~McGraw-Hill, New York, 1973!. It is the value for which the Gibbs free energyDGpasses through zero.
35L. Bernstein and M. Zakin, J. Phys. Chem.99, 14619~1995!.36B. P. Barberet al., Phys. Rev. Lett.72, 1380~1994!.37L. Kondic ~private communication 1996!; L. Kondic, C. Yuan, and C. K.
Chan~preprint!.38E. Hart, Ch. H. Fischer, and A. Henglein, J. Phys. Chem.91, 4166~1987!.39M. P. Brenner, S. Hilgenfeldt, D. Lohse, and R. Rosales, Phys. Rev. Lett.
77, 3467~1996!.40Lord Rayleigh, Philos. Mag.34, 94 ~1917!; M. Plesset, J. Appl. Mech.16,
277 ~1949!; A. Prosperetti, J. Acoust. Soc. Am.56, 878 ~1974!; W. Lau-terborn,ibid. 59, 283 ~1976!; A. Prosperetti, Ultrasonics22, 69 ~1984!.
41A. Prosperetti, J. Acoust. Soc. Am.61, 17 ~1977!.42M. Plesset and A. Prosperetti, Annu. Rev. Fluid Mech.9, 145 ~1977!.43L. A. Crum, J. Acoust. Soc. Am.73, 116 ~1983!.44A. Prosperetti, L. A. Crum, and K. W. Commander, J. Acoust. Soc. Am.
83, 502 ~1988!.45V. Q. Vuong and A. J. Szeri, Phys. Fluids8, 2354~1996!.
6996 D. Lohse and S. Hilgenfeldt: Inert gas in sonoluminescing bubbles
J. Chem. Phys., Vol. 107, No. 17, 1 November 1997 This article is copyrighted as indicated in the article. Reuse of AIP content is subject to the terms at: http://scitation.aip.org/termsconditions. Downloaded to IP:
209.183.183.254 On: Sun, 07 Dec 2014 20:58:08
46V. Kamath, A. Prosperetti, and F. N. Egolfopoulos, J. Acoust. Soc. Am.94, 248 ~1993!.
47K. Yasui, J. Acoust. Soc. Am.98, 2772~1995!.48Note that using unrealistic ‘‘effective’’ viscosities as large as seven times
the real viscosity of water and also effective surface tensions as done byPutterman’s group@~see Refs. 13, 14, and 36! and K. Weninger, B. Bar-ber, and S. Putterman, Phys. Rev. Lett.78, 1799~1997!# is neither justi-fied nor necessary to fit the data.
49C. C. Wu and P. H. Roberts, Phys. Rev. Lett.70, 3424 ~1993!; Proc. R.Soc. London Ser. A445, 323 ~1994!; W. Moss, D. Clarke, J. White, andD. Young, Phys. Fluids6, 2979~1994!; Phys. Lett. A211, 69 ~1995!; L.Kondic, J. Gersten, and C. Yuan, Phys. Rev. E52, 4976 ~1995!; V. Q.Vuong and A. J. Szeri, Phys. Fluids8, 2354~1996!.
50S. Hilgenfeldt, M. P. Brenner, S. Grossmann, and D. Lohse, J. FluidMech. ~submitted!.
51L. Bernstein, M. Zakin, E. Flint, and K. Suslick, J. Phys. Chem.100, 6612~1996!.
52Handbook of Chemistry and Physics, edited by D. R. Lide~ChemicalRubber, Boca Raton, FL, 1991!.
53Landolt and Bo¨rnstein,Zahlenwerte und Funktionen aus Physik und Che-mie ~Springer, Berlin, 1969!.
54T. J. Matula, S. M. Cordry, R. A. Roy, and L. A. Crum, J. Acoust. Soc.Am. ~submitted!.
55D. Chow, K. Weninger, B. P. Barber, and S. J. Putterman, J. Acoust. Soc.Am. 100, 2718~1996!.
6997D. Lohse and S. Hilgenfeldt: Inert gas in sonoluminescing bubbles
J. Chem. Phys., Vol. 107, No. 17, 1 November 1997 This article is copyrighted as indicated in the article. Reuse of AIP content is subject to the terms at: http://scitation.aip.org/termsconditions. Downloaded to IP:
209.183.183.254 On: Sun, 07 Dec 2014 20:58:08