inequality of opportunity in asia and the pacific: education inequality 29012018.pdfeducational...
TRANSCRIPT
SOCIAL DEVELOPMENT DIVISION
INEQUALITY OF OPPORTUNITY IN ASIA AND THE PACIFIC:
Education

The Economic and Social Commission for Asia and the Pacific (ESCAP) serves as the United Nations’ regional hub promoting cooperation among countries to achieve inclusive and sustainable development. The largest regional intergovernmental platform with 53 Member States and 9 associate members, ESCAP has emerged as a strong regional think-tank offering countries sound analytical products that shed insight into the evolving economic, social and environmental dynamics of the region. The Commission’s strategic focus is to deliver on the 2030 Agenda for Sustainable Development, which it does by reinforcing and deepening regional cooperation and integration to advance connectivity, financial cooperation and market integration. ESCAP’s research and analysis coupled with its policy advisory services, capacity building and technical assistance to governments aims to support countries’ sustainable and inclusive development ambitions.
The shaded areas of the map indicate ESCAP members and associate members.

ST/ESCAP/2817
Disclaimer
The views expressed in this paper are those of the authors and do not necessarily reflect the views and policies of the United Nations or other international agencies. The paper has been issued without formal editing. Reproduction and dissemination of material in this paper for educational or other non-commercial purposes are authorized without prior written permission from the copyright holder, provided that the source is fully acknowledged. For further information on this paper, please contact:
Social Development DivisionUnited Nations Economic and Social Commission for Asia and the PacificUnited Nations BuildingRajadamnern Nok AvenueBangkok 10200, ThailandEmail: [email protected]: www.unescap.org
INEQUALITY OF OPPORTUNITY IN ASIA AND THE PACIFIC:
Education

Acknowledgements
This paper was prepared under the leadership of Patrik Andersson, Chief, Sustainable Socioeconomic Transformation Section, Social Development Division, and the overall guidance of Nagesh Kumar, Director of the Social Development Division. The drafting team was led by Ermina Sokou and consisted of Nina Loncar and Predrag Savić. The statistical and econometric analysis was done by Yichun Wang. Valuable comments were provided by discussants and participants of the Strategic Dialogue on Poverty and Inequality, that took place on 5–6 October 2017 in Bangkok, in particular Mihika Chaterjee, Carlos Gradin, Giorgi Kalakashvili, Marco Mira d’Ercole, Selim Raihan and Elan Satriawan. Useful inputs were also provided by Chad Anderson, Thérèse Björk, Stephanie Choo, Imogen Howells, Orlando Miguel Zambrano Roman and Le Hai Yen Tran.
Special thanks also are due to Satoko Yano, Chief of Education at the UNESCO New Delhi Cluster Office, who reviewed the paper and provided valuable comments.
The editing was done by Daniel Swaisgood and the graphic design by Daniel Feary.
The research for this report and the rest of the series on Inequality of Opportunity in Asia and the Pacific is prepared under an interregional project entitled Promoting Equality: Strengthening the capacity of select developing countries to design and implement equality-oriented public policies and programmes.
2

List of figuresFigure 1: GDP per capita and mean years of education in Asia-Pacific, 2013 7
Figure 2: Classification tree highlighting differences in secondary educational attainment in Mongolia, 2013 (ages 20–35) 11
Figure 3: Classification tree highlighting differences in higher educational attainment in the Philippines, 2013 (ages 25–35) 11
Figure 4: Gaps in secondary education attainment for individuals aged 20 to 35 years of age, latest year 12
Figure 5: Secondary education average attainment and attainment gaps, latest year 12
Figure 6: Gaps in higher education attainment for individuals 25 to 35 years of age, latest year 13
Figure 7: Higher education average attainment and attainment gaps, latest year 13
Figure 8: Distance of the worst-off group from the average in secondary education attainment for individuals 20 to 35 years of age, earliest–2010s 17
Figure 9: Distance of the worst-off group from the average in higher education attainment for individuals 25 to 35 years of age over time, earliest–2010s 17
Figure 10: Inequality in secondary education attainment and its decomposition, latest year 20
Figure 11: Inequality in higher education attainment and its decomposition, latest year 20
Figure 12: The role of ethnicity, religion and language in shaping inequality in education, latest year 24
Table of contents
Acknowledgements 2
List of figures 3
List of tables 4
Country abbreviations 4
About the Inequality of Opportunity papers 5
Chapter 1: Introduction 6
Chapter 2: Why does inequality in education matter? 7
Chapter 3: A new approach to identifying the furthest behind 10
Chapter 4: Who are the furthest behind? 12
Chapter 5: Understanding overall inequality in educational attainment 18
Chapter 6: Does ethnicity matter for determining the furthest behind? 22
Chapter 7: Recommendations for closing the gaps 26
Annex: Methodology for identifying gaps in access to opportunities 27
References 34
3

List of tables
Table 1: The impact of various circumstances on secondary education attainment for individuals 20 to 35 years of age 15
Table 2: The impact of various circumstances on higher education attainment for individuals 25 to 35 years of age 16
Table 3: Attainment rate of secondary education for different groups with individuals between 20 and 35 years of age, all available years 22
Table 4: Attainment rate of higher education for different groups with individuals between 25 and 35 years of age, all available years 23
Table A1: List of countries and survey years 27
Table A2: Indicators selected 31
Table A3: Logit model results: Secondary education 32
Table A4: Logit model results: Higher education 33
Country abbreviations
AF AfghanistanAM ArmeniaAU AustraliaAZ AzerbaijanBD BangladeshBN Brunei DarussalamBT BhutanKH CambodiaCN ChinaFJ FijiPF French PolynesiaGE GeorgiaGU GuamHK Hong Kong SAR, ChinaIN IndiaID IndonesiaIR Iran, Islamic Republic ofJP JapanKZ KazakhstanKI KiribatiKP Korea, Democratic People’s RepublicKR Korea, Republic ofKG KyrgyzstanLA Lao People’s Democratic RepublicMO Macao SAR, ChinaMV MaldivesMY MalaysiaMH Marshall Islands
FM Micronesia, Federated States ofMN MongoliaMM MyanmarNR NauruNP NepalNC New CaledoniaNZ New ZealandMP Northern Mariana IslandsPK PakistanPW PalauPG Papua New GuineaPH PhilippinesRU Russian FederationWS SamoaSG SingaporeSB Solomon IslandsLK Sri LankaTL Timor-LesteTH ThailandTJ TajikistanTM TurkmenistanTO TongaTR TurkeyTV TuvaluVU VanuatuUZ UzbekistanVN Viet Nam
4

About the Inequality of Opportunity papers
i All thematic reports follow the same methodology, except for decent employment and political participation, where the available datasets did not include adequate questions.
The ESCAP Inequality of Opportunity papers place men and women at the heart of sustainable and inclusive development. The papers do so by identifying nine areas where inequality jeopardizes a person’s prospects, namely: education; women’s access to health care; children’s nutrition; decent employment; basic water and sanitation; access to clean energy; basic technology; financial inclusion; and political participation. Each of these opportunities are covered by specific commitments outlined in the 2030 Agenda for Sustainable Development and addressed in a separate thematic paper covering 21 countries throughout Asia and the Pacific.i
ESCAP first discussed inequality of opportunity in its 2015 report Time for Equality and established the distinction between inequality of outcome and inequality of opportunity. While the former depicts the consequences of unequally distributed income and wealth, the latter is concerned with access to key dimensions necessary for fulfilling one’s potential.
The present papers build on the work of many scholars and the findings from Time for Equality. It applies a novel approach to analysing household surveys with the aim of identifying the groups of individuals with the lowest access to the above-referenced opportunities. These groups are defined by common circumstances over which the individual has no direct control.
In addition to identifying the furthest behind, the Inequality of Opportunity papers also explore the gaps between in-country groups in accessing the key opportunities, as well as the extent to which these have narrowed or widened over time. These inequalities are then analysed to identify the impact and importance each key circumstance plays.
Ultimately, these findings are of direct use for generating discussion on transformations needed to reach the “furthest behind first” as pledged in the 2030 Agenda.
5

Introduction
i UNESCO-UIS (2015) calculates that there were 17.3 million out-of-school children of primary school age in 2013, the majority of them in South and West Asia.
ii Please see table A2 in the Annex for more information on the categorization
Equitable opportunities for education are a fundamental human right. Article 28 of the Convention on the Rights of the Child (CRC), Article 26 of the Universal Declaration of Human Rights and Articles 13 and 14 of the International Covenant on Economic, Social and Cultural Rights each enshrine this right.
This commitment is further cemented in the 2030 Agenda for Sustainable Development and reflected in Sustainable Development Goal (SDG) 4; a goal encompassing inclusive, equitable and life-long, quality learning opportunities, and calling for equitable and inclusive quality education.
Equity in education is at the core of the SDG4-Education 2030 Agenda. Targets 4.1, 4.3 and 4.5 address the issue of inequality, particularly relating to gender gaps and marginalized groups, including persons with disabilities, indigenous peoples and vulnerable children. Equal opportunities for education are therefore key in ensuring that no man, woman or child is left behind.
In that context, primary school net enrolment rates are above 90 per cent in almost every country around the Asia-Pacific region, with some notable exceptions in the Pacific, South and South-West Asia.i This impressive achievement indicates that nearly every child enters primary school in most of the countries in the region, despite the remaining challenges countries still face in bringing all children to school.
Gross enrolment rates for secondary education however, vary widely among countries and can be as low as 45 per cent in Cambodia and Pakistan, for example.1 Moreover, both higher education enrolment rates and educational attainment rates fluctuate even more, with some in-country groups having far higher rates than others. This report will explore inequality in secondary and higher educational attainment, rather than enrolment, for three reasons.
First, although school enrolment constitutes access, high dropout rates mean that enrolment does not necessarily indicate whether adults took advantage of their educational opportunities. Subsequently, examining enrolment rates of present-day children in excluded groups would not reveal whether they will have the opportunity to complete their school careers. Second, completion is a better proxy for assessing the quality of education. In other words, if completing education is expected to generate better employment opportunities or improve their well-being, then completion rates will be higher. Third, data on completion (or attainment) is easier to access.
Covering 21 countries, this research targets population groups between 20 and 35 years of age for secondary education and between 25 and 35 years of age for higher education.ii The analysis focuses on these age groups because they are transitioning to the workplace.
The analysis of the data reveals clear patterns of exclusion across countries in Asia and the Pacific that are closely linked to household circumstances. Young men and women and their family members make school decisions alongside a web of social, economic and cultural factors. To the extent possible, these factors are revealed in this report and provide a foundation for policymakers towards understanding inequalities in educational attainment.
The aim of this report is: i) to outline why it is important to reduce inequality in educational attainment; ii) to introduce a new way of analysing survey data by identifying the shared circumstances of those “furthest behind”; and iii) to analyse observed inequality by the relative contribution of each circumstance.
6
CHAPTER 1

Why does inequality in education matter?
Inequality in education matters because more education often results in a better job with higher incomes and a chance to break patterns of poverty and vulnerability. Education also leads to improvements in both human and environmental health and well-being. Unequitable education therefore, not only jeopardizes the potential of the most disadvantaged, but also compromises any prospective benefits that would have accrued for society.
Despite making substantial progress in primary education, gaps remain throughout the region. For instance, in many countries quality secondary and higher education are only accessible for select groups.
Large gaps are also still found among countries. While gross enrolment rates for higher education in the Republic of Korea reached close to 97 per cent in 2014, Bangladesh and Afghanistan only had rates of 13.2 per cent and 3.7 per cent in 2012 and 2011, respectively.2 These stark disparities repeat themselves within countries as well, creating societies with unequal opportunities.
2.1More education often leads to better jobs and higher incomes
Education stimulates income growth, increases productivity and provides better opportunities for decent work. For the individual, education not only shapes future outcomes from the earliest stages of life, but directly impacts the earning potential and hence, the rest of a person’s future. This is why quality education should be made available to all, irrespective of their circumstances.
Collectively, fewer years and lower educational quality also affect the productivity of an economy and its growth potential. Without sustained human capital accumulation, including lifelong learning opportunities, labour market productivity suffers and economic growth is hampered.
Generally, higher incomes and standards of living are correlated with higher educational attainment. This is also the case for Asia-Pacific countries (Figure 1). On average, the higher education enrolment rate in high-income Asia-Pacific countries is 75 per cent, while average enrolment rates are below 20 per cent for the Least Developed Countries (LDCs).3
FIGURE 1GDP per capita and mean years of education in Asia-Pacific, 2013
AF
AM
AU
AZ
BD
BT
BN
KH
CN
FJ
GE
HK
IN
IDIR
JPKZ
KI
KR
KG
LA
MY
MV
FM MN
NP
NZ
PK
PW
PG
PH
RU
WSSG
SB
LKTJ
TH
TL
TO
TR
TMUZVU
VN
0
2
4
6
8
10
12
14
16
500 5 000 50 000
GDP PER CAPITA (US$)
MEA
N Y
EAR
S O
F ED
UC
ATI
ON
(YEA
RS)
Correlation coe�cient r=0.50
Source: ESCAP calculations based on World Bank (2013) and UNDP HDR (2013).
7
CHAPTER 2

2.2Human and environmental health improve with education
Education is a prerequisite for accessing critical knowledge on health and nutrition. Ongoing research finds that inequality in accessing key opportunities, such as adequate child nutrition, access to water and sanitation, clean fuels and electricity, associates with lower overall educational attainment in the household. The multidimensional nature of inequalities thus makes accessing education a central component of human development and dignity.
Moreover, education plays an instrumental role in advancing environmental sustainability by making people aware of environmental risks, hazards and mitigation techniques. For example, research demonstrates that people with higher levels of schooling are better at identifying various environmental issues in 70 out of 119 countries.4
Furthermore, research from the 2010 International Social Survey Programme (ISSP) exhibits that each step on the educational ladder increases the chance that people will express concern for the environment. This is true even after taking into account factors such as wealth, individual characteristics and political affiliation.5 Inequality in accessing education therefore creates a divide in environmental awareness and behaviour.
At the same time, people with lower education tend to be more vulnerable to environmental degradation. Not only is their work unsafe or more harmful, but they often reside in the most environmentally degraded and impoverished areas.
2.3Education drives gender equality
Achieving gender equality requires addressing the gaps in educational attainment between women and men. Traditional gender roles often trap women in bearing the brunt of household work and caretaker tasks, thereby forcing girls to drop out of school. School attendance for many girls is also made more difficult after puberty because of inadequate water and sanitation facilities.
Educating women and girls also carries important health ramifications for children and contributes to strengthening gender equality by reducing unwanted or unplanned pregnancies. 6
While achieving gender equality and empowering all women (SDG 5) is complex, educational attainment plays a vital role in improving women’s lives and health outcomes, as well as increasing their options for income generation and political participation.
“The multidimensional
nature of inequalities makes
accessing education a central
component of human
development and dignity”
“Educating women and girls… carries
important health ramifications
for children and contributes to
strengthening gender equality by
reducing unwanted or unplanned
pregnancies”
8
CHAPTER 2: Why does inequality in education matter?

2.4Education fosters stronger societal cohesion and political institutions
Education not only creates shared values and common social identities, it balances social dynamics by generating opportunities for children with different starting circumstances. In contrast, when disadvantaged population groups receive lower quality education, social cohesion is jeopardized.
Persistent cycles of poverty are then recreated and aggravated, trapping individuals and households in their present socioeconomic situations. Over time, intergenerational poverty stems from the inability to use education as a stepping stone for social mobility. Such traps subsequently compromise the achievement of SDG 1 on “Ending poverty” and SDG 10 on “Reducing inequality”.
“…intergenerational poverty stems
from the inability to use education
as a stepping stone for social
mobility”
“Having a large, uneducated segment
of the population undermines political
participation and trust and thereby
weakens political institutions”
Additionally, to the extent that educational asymmetries are reflected within societal structures, they can lead to social unrest and polarization. Having a large, uneducated segment of the population undermines political participation and trust and thereby weakens political institutions.7
Contacting a public representative to request information or express an opinion is a form of direct participation. Across 102 countries, adults with higher education were 60 per cent more likely to request information from the government than those with a primary education or below.8 In developing countries, this figure is even higher at 80 per cent.
Another study of 104 countries found that even after controlling for country-specific effects, a more equal distribution of education was the main determinant for the transition to democracy.9 Consequently, promoting education as an inclusive learning tool is vital to achieving the “peace, justice and strong institutions” recognized by SDG 16.
9
CHAPTER 2: Why does inequality in education matter?
A new approach to identifying the furthest behind
iii The five ESCAP sub-regions are East and North-East Asia, North and Central Asia, Pacific, South and South-West Asia, and South-East Asia. The three income groups covered are low income, lower-middle income, upper-middle income. High income countries are not included in analysis.
iv Older age groups (35- 49 years old) are not considered in this analysis although similar results have been produced and are available upon request for the purpose of comparison.
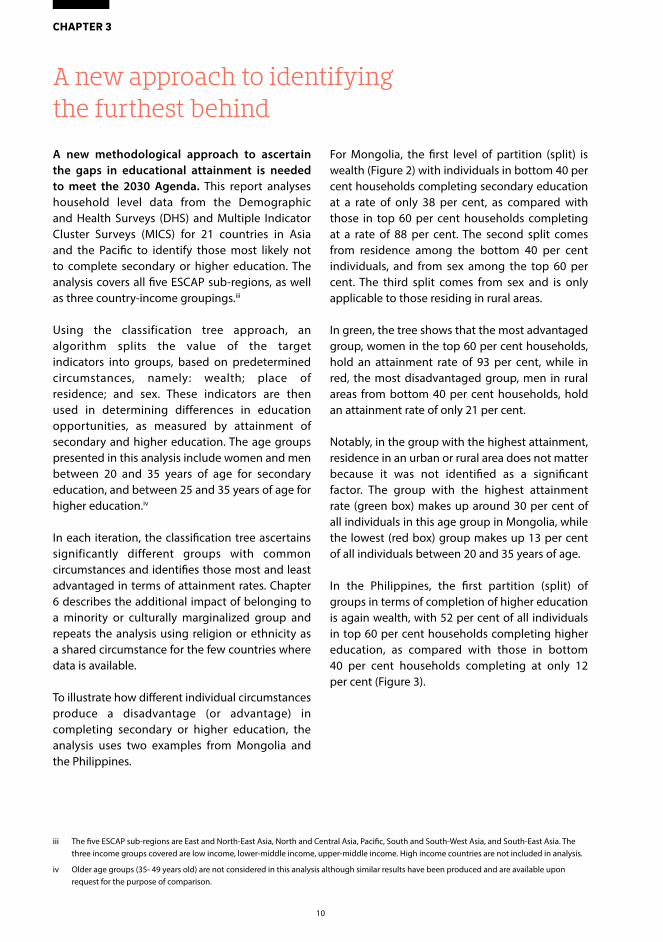
A new methodological approach to ascertain the gaps in educational attainment is needed to meet the 2030 Agenda. This report analyses household level data from the Demographic and Health Surveys (DHS) and Multiple Indicator Cluster Surveys (MICS) for 21 countries in Asia and the Pacific to identify those most likely not to complete secondary or higher education. The analysis covers all five ESCAP sub-regions, as well as three country-income groupings.iii
Using the classification tree approach, an algorithm splits the value of the target indicators into groups, based on predetermined circumstances, namely: wealth; place of residence; and sex. These indicators are then used in determining differences in education opportunities, as measured by attainment of secondary and higher education. The age groups presented in this analysis include women and men between 20 and 35 years of age for secondary education, and between 25 and 35 years of age for higher education.iv
In each iteration, the classification tree ascertains significantly different groups with common circumstances and identifies those most and least advantaged in terms of attainment rates. Chapter 6 describes the additional impact of belonging to a minority or culturally marginalized group and repeats the analysis using religion or ethnicity as a shared circumstance for the few countries where data is available.
To illustrate how different individual circumstances produce a disadvantage (or advantage) in completing secondary or higher education, the analysis uses two examples from Mongolia and the Philippines.
For Mongolia, the first level of partition (split) is wealth (Figure 2) with individuals in bottom 40 per cent households completing secondary education at a rate of only 38 per cent, as compared with those in top 60 per cent households completing at a rate of 88 per cent. The second split comes from residence among the bottom 40 per cent individuals, and from sex among the top 60 per cent. The third split comes from sex and is only applicable to those residing in rural areas.
In green, the tree shows that the most advantaged group, women in the top 60 per cent households, hold an attainment rate of 93 per cent, while in red, the most disadvantaged group, men in rural areas from bottom 40 per cent households, hold an attainment rate of only 21 per cent.
Notably, in the group with the highest attainment, residence in an urban or rural area does not matter because it was not identified as a significant factor. The group with the highest attainment rate (green box) makes up around 30 per cent of all individuals in this age group in Mongolia, while the lowest (red box) group makes up 13 per cent of all individuals between 20 and 35 years of age.
In the Philippines, the first partition (split) of groups in terms of completion of higher education is again wealth, with 52 per cent of all individuals in top 60 per cent households completing higher education, as compared with those in bottom 40 per cent households completing at only 12 per cent (Figure 3).
10
CHAPTER 3

The second separator is sex for both groups. For the top 60 per cent group, men have lower higher completion rate (50 per cent) when compared with women (55 per cent). Overall, the group with the highest completion rate represents 33 per cent
of the population. The red box depicts how among men residing in bottom 40 per cent households, rural or urban, only 1 in 10 completes higher education. This group represents 19 per cent of all adults in the 25–35 age cohort in the Philippines.
FIGURE 2Classification tree highlighting differences in secondary educational attainment in Mongolia, 2013 (ages 20–35)
AV
ERA
GE
ATT
AIN
MEN
TW
EALT
HR
ESID
ENC
E/SE
XSE
X
MALE
Attainment: 21%
Size: 13%
RURAL
Attainment: 29%
Size: 25%
URBAN
Attainment: 58%
Size: 14%
BOTTOM 40
Attainment: 38%
Average attainment: 69%
Size: 100%
Size: 39%
TOP 60
Attainment: 88%
Size: 61%
MALE
Attainment: 83%
Size: 29%
FEMALE
Attainment: 93%
Size: 32%
FEMALE
Attainment: 37%
Size: 12%
FIGURE 3Classification tree highlighting differences in higher educational attainment in the Philippines, 2013 (ages 25–35)
AV
ERA
GE
ATT
AIN
MEN
TW
EALT
HSE
X
MALE
Attainment: 10%
Size: 19%
FEMALE
Attainment: 14%
Size: 16%
BOTTOM 40
Attainment: 12%
Average attainment: 38%
Size: 100%
Size: 35%
TOP 60
Attainment: 52%
Size: 65%
MALE
Attainment: 50%
Size: 32%
FEMALE
Attainment: 55%
Size: 33%
11
CHAPTER 3: a neW approach to identifying the furthest behind

Who are the furthest behind?
v The actual composition of the most advantaged or disadvantaged groups is discussed later in this Chapter.
Ample evidence demonstrates that many people in Asia and the Pacific are still being left behind. This reality contrasts starkly with the principle of universalism permeating the 2030 Agenda. Realizing that they are being left behind, marginalized people get discouraged and disillusioned with the promise of progress, which reduces trust in national economic systems and political institutions.
Policymakers therefore need to identify who is being left behind and make those groups, households and individuals the focus of their efforts. Only then can prosperity be shared and future socioeconomic stability protected.
4.1How large are the gaps?
The tree analysis described in Chapter 3 allows for comparison of gaps across countries. This analysis was used for 21 countries and the results are summarized in Figures 4 and 6. The upper lines of each bar represent the attainment rate of the most advantaged group (those with highest attainment rates) for each country. The lower lines represent the attainment rate of the most disadvantaged group (those with lowest attainment rates). The middle line is the average attainment rates by which countries are sorted.v
FIGURE 5Secondary education average attainment and attainment gaps, latest year
KZ
AM
KG
PH
MN
TJ
TM
THIDVNVU
PKTL
BD
LAINAF
BTMM
KH
MV
R²=0.48944
0
10
20
30
40
50
60
70
80
0 10 20 30 40 50 60 70 80 90 100
ATT
AIN
MEN
T G
AP
(PER
CEN
TAG
E PO
INTS
)
AVERAGE ATTAINMENT (%)
Source: ESCAP calculations based on latest DHS and MICS surveys.
FIGURE 4Gaps in secondary education attainment for individuals aged 20 to 35 years of age, latest year
Average attainment rate Group attainment rate (lowest) Group attainment rate (highest)
0
20
40
60
80
100
Kaza
khst
an
Arm
enia
Kyrg
yzst
an
Phili
ppin
es
Mon
golia
Tajik
ista
n
Turk
men
ista
n
Thai
land
Indo
nesi
a
Viet
Nam
Vanu
atu
Paki
stan
Tim
or-L
este
Bang
lade
sh
Lao
PDR
Indi
a
Afg
hani
stan
Bhut
an
Mya
nmar
Cam
bodi
a
Mal
dive
s
ATT
AIN
MEN
T R
ATE
(% )
Source: ESCAP calculations based on latest DHS and MICS surveys.
12
CHAPTER 4CHAPTER 4

With respect to secondary education for men and women between 20 and 35 years of age, Armenia and Kazakhstan fare the best with 94 and 91 per cent average attainment rates (Figure 4) and no substantial gaps between population groups.
By contrast, Cambodia (15 per cent) and the Maldives (13 per cent) have the lowest observed attainment levels of secondary education. In Mongolia, Vanuatu and the Philippines, average attainment is around the middle of the distribution, but gaps between the best-off and worst-off groups exceed 50 percentage points.
The relationship between average attainment rates of secondary education and gap can be further illustrated by using a binomial equation (Figure 5). The inverted U-shape curve depicts
that relationship. When average attainment is low, the gaps are around 25 to 35 percentage points. When average attainment increases, gaps increase and can be as high as 70 percentage points. As countries edge towards universal attainment the gaps fall.
Notably, Turkmenistan’s gap in completing secondary education is relatively lower compared with several countries with similarly average attainment (e.g., Tajikistan and Thailand). In fact, one in two of the most disadvantaged group in Turkmenistan completed secondary education, a higher rate than the equivalent groups in Mongolia and the Philippines; both countries with higher average attainment overall (see Table 1 for the composition of the most disadvantaged groups).
FIGURE 6Gaps in higher education attainment for individuals 25 to 35 years of age, latest year
Source: ESCAP calculations based on latest DHS and MICS surveys.
Average attainment rate Group attainment rate (lowest) Group attainment rate (highest)
0
20
40
60
80
100
ATT
AIN
MEN
T R
ATE
(% )
Mon
golia
Kyrg
yzst
an
Kaza
khst
an
Phili
ppin
es
Thai
land
Arm
enia
Viet
Nam
Tajik
ista
n
Turk
men
ista
n
Paki
stan
Bang
lade
sh
Indi
a
Indo
nesi
a
Mal
dive
s
Mya
nmar
Bhut
an
Lao
PDR
Tim
or-L
este
Cam
bodi
a
Afg
hani
stan
Vanu
atu
FIGURE 7Higher education average attainment and attainment gaps, latest year
MN
KGKZ
PHTH
AM
VNTJ
TMPKBDIN
IDMVMM
BT
LATL
KH
AF
VU
0
10
20
30
40
50
60
70
80
0 10 20 30 40 50 60 70 80 90 100
ATT
AIN
MEN
T G
AP
(PER
CEN
TAG
E PO
INTS
)
AVERAGE ATTAINMENT (%)
R² = 0.72301
Source: ESCAP calculations based on latest DHS and MICS surveys.
13
CHAPTER 4: Who are the furthest behind?

In terms of higher education for men and women, average attainment rates are expectedly lower as compared with secondary education (Figure 6). On average, Kyrgyzstan and Mongolia showed the highest attainment rates with 47 per cent and 44 per cent of the population between 25 and 35 years of age attaining higher education.
Afghanistan, Cambodia and Vanuatu showed the lowest attainment rates, with average attainment rates for higher education around 6 per cent. At the same time, Mongolia is experiencing the highest gaps between the least and the most disadvantaged groups, followed by the Philippines and Thailand.
Again, the relationship between average attainment rate of higher education in a country and the attainment gap is illustrated by using a binomial equation (Figure 7). The inverted U-pattern anticipated is not observed because no country achieved more than 50 per cent of higher education attainment, and thereafter gaps still increase.
Nevertheless, Kyrgyzstan stands out because the gap in higher education attainment is much lower compared with several other countries having similarly average attainment (e.g., Mongolia, Kazakhstan, Philippines and Thailand). Cambodia on the other hand is a negative outlier, suggesting that large parts of the population are being left behind.
4.2Identifying those left behind
Addressing these gaps requires identifying the shared circumstances of those who do not complete secondary or higher education. This section narrows focus onto the most disadvantaged groups in each country to identify shared circumstances. Although the circumstances of the most disadvantaged groups in each country are not the same across the 21 countries analysed, some commonalities exist.
vi These tables to do not show the composition of the most advantaged group (with the highest attainment rate), but this information will be made available online.
vii Armenia, Kazakhstan, Mongolia and the Philippines are notable exceptions to this generalization, where men from bottom 40 households have the lowest secondary education attainment rates.
Tables 1 and 2 list the circumstances of groups (column 1) with lowest attainment rates (column 2), the size of the population represented (column 3) and the gap between the groups with the highest and lowest attainment (column 4).vi
The combination of being poor, a woman and living in a rural area forms the most common barrier to secondary education (Table 1). For all 21 countries analysed, wealth is a common determining circumstance, as those with the lowest secondary education attainment rates belong to households from the poorest 40 per cent of the population. Rural residence is also associated with lower secondary education attainment rates in 11 out of 21 countries.
In 10 out of 21 countries, poorer women with rural backgrounds have lower attainment rates.vii For example, in Lao People’s Democratic Republic, these women represent 18 per cent of the population in the most disadvantaged group and their secondary education attainment rate is only 1 per cent. In other words, the likelihood that a poor, rural Laotian woman completes secondary education is close to zero.
The determining circumstances for the most disadvantaged groups do not change drastically when it comes to higher education (Table 2). Rural women living in bottom 40 per cent households again represent the most disadvantaged group in many countries. Even though they represent one fifth, or close to 20 per cent, of the population, women in this group have higher education attainment rates close to zero.
On the contrary, in Kyrgyzstan and Mongolia it is rural men living in bottom 40 per cent households who are the most disadvantaged group. In Kyrgyzstan specifically, their average attainment rate stands at 30 per cent; far lower than the most privileged part of the Kyrgyz population, whose attainment rate is 65 per cent.
14
CHAPTER 4: Who are the furthest behind?

In Mongolia, the higher education attainment rate of rural men from bottom 40 per cent households is only 8 per cent, compared with 75 per cent for the most advantaged group, namely women in top 60 per cent households.
Nevertheless, poverty is still the circumstance shared by all disadvantaged groups. Coming from the poorest 40 per cent of the population significantly reduces one’s likelihood of attaining higher education. In Thailand for example, the higher education attainment rate for those living in poorer households is 11 per cent, despite this group making up 30 per cent of the population.
In half of the countries analysed, coming from rural areas is also associated with lower education attainment rates. In Lao People’s Democratic Republic, one third of all 25 to 35 year olds live in poorer households in rural areas, yet no one in this group has attained higher education.
“…poverty is the circumstance shared
by all disadvantaged groups”
TABLE 1The impact of various circumstances on secondary education attainment for individuals 20 to 35 years of age
CIRCUMSTANCES OF THE MOST DISADVANTAGED GROUPS BY COUNTRY (1)
ATTAINMENT LEVEL OF THE MOST DISADVANTAGED GROUP (2)
SIZE OF THE MOST DISADVANTAGED GROUP AS A SHARE OF TOTAL POPULATION (3)
ATTAINMENT GAP FROM MOST ADVANTAGED GROUP (PERCENTAGE POINTS) (4)
WOMEN FROM RURAL POORER (BOTTOM 40) HOUSEHOLDS
KyrgyzstanIndonesiaVanuatuTimor-LesteMyanmarAfghanistanCambodiaMaldivesBhutanLao PDR
80%18%12%8%4%3%2%2%1%1%
16%14%21%17%18%18%18%19%17%18%
14 pp49 pp52 pp49 pp32 pp36 pp43 pp23 pp29 pp44 pp
MEN FROM RURAL POORER HOUSEHOLDS
Mongolia 21% 13% 72 pp
MEN FROM POORER HOUSEHOLDS
KazakhstanArmeniaPhilippines
89%81%37%
19%19%19%
8 pp16 pp51 pp
WOMEN FROM POORER HOUSEHOLDS
TurkmenistanTajikistanViet NamBangladeshPakistan
50%41%20%5%4%
20%20%18%20%19%
16 pp43 pp49 pp33 pp49 pp
FROM POORER HOUSEHOLDS
ThailandIndia
30%3%
30%36%
42 pp36 pp
Source: ESCAP estimations based on latest DHS and MICS survey.Note: Attainment gap is defined as the difference between attainment rates of groups with the highest and lowest attainment.
15
CHAPTER 4: Who are the furthest behind?

4.3Are the gaps in education attainment falling over time?
Gaps in attainment rates are not falling despite an increase in overall prosperity. Progress across countries in this analysis is not fully comparable because the time lag between the two surveys spans from 7 years (in Thailand) to 22 years (in Pakistan). The results should therefore be viewed with this in mind. Furthermore, the composition of the most disadvantaged group may vary between the two surveys.viii
That being said, if growth benefits everyone equally, two achievements should be expected. First, average attainment should increase over time
viii A full list of the classification trees that reveals the composition of all groups is available upon request and will be posted on the ESCAP website soon.
ix It is important to note that the most disadvantaged group, which has the lowest attainment rate, always represents at least 10 per cent of the sample population since this is a requirement set in the classification tree analysis (see Annex 1).
and second, the distance of the most marginalized group from the average should fall.ix
In most countries, except Kyrgyzstan, Lao People’s Democratic Republic and Turkmenistan, average attainment rates for secondary education do increase in the period between the two surveys (Figure 8). However, it is only in Kazakhstan, the Philippines and Thailand that the distance of the most marginalized group from the average marginally falls. In the remaining 11 countries, the percentage point difference from the mean, and between the surveys, increased.
With respect to higher education, average attainment also increased over time in all countries except Turkmenistan. The change was often
TABLE 2The impact of various circumstances on higher education attainment for individuals 25 to 35 years of ageCIRCUMSTANCES OF THE MOST DISADVANTAGED GROUPS BY COUNTRY (1)
ATTAINMENT LEVEL OF THE MOST DISADVANTAGED GROUP (2)
SIZE OF THE MOST DISADVANTAGED GROUP AS A SHARE OF TOTAL POPULATION (3)
ATTAINMENT GAP FROM MOST ADVANTAGED GROUP (PERCENTAGE POINTS) (4)
WOMEN FROM RURAL POORER (BOTTOM 40) HOUSEHOLDS
TurkmenistanTajikistanAfghanistanMaldivesVanuatuBhutanCambodiaTimor-Leste
6%5%1%1%1%0%0%0%
19%20%18%19%20%17%19%17%
27 pp43 pp11 pp17 pp16 pp16 pp30 pp23 pp
MEN FROM RURAL POORER HOUSEHOLDS
KyrgyzstanMongolia
30%8%
17%14%
35 pp67 pp
MEN FROM POORER HOUSEHOLDS
KazakhstanArmeniaPhilippines
18%10%10%
18%18%19%
41 pp30 pp45 pp
WOMEN FROM POORER HOUSEHOLDS
Viet NamBangladeshPakistan
6%1%1%
18%19%19%
42 pp28 pp31 pp
FROM RURAL POORER HOUSEHOLDS
IndonesiaMyanmarLao PDR
3%2%0%
28%34%36%
22 pp20 pp21 pp
FROM POORER HOUSEHOLDS
ThailandIndia
11%1%
30%38%
46 pp26 pp
Source: ESCAP estimations based on latest DHS and MICS surveys.
16
CHAPTER 4: Who are the furthest behind?

rapid, especially in Kazakhstan, Kyrgyzstan and Mongolia where almost half of all individuals 25 to 35 years of age are now completing higher education (Figure 9).
Still, certain groups are left behind, with the percentage point distance of the most marginalized groups from the average attainment increasing in all countries studied. Lao People’s Democratic Republic and Turkmenistan are
notable exceptions, where marginal decreases probably reflect the overall decrease in higher education opportunities in the country.
Finally, although delays in progress are not the subject of this report, the trend in marginalization is worrying. Given the important role education plays in achievements later in life, the groups left behind are likely to fall behind in future development.
FIGURE 8Distance of the worst-off group from the average in secondary education attainment for individuals 20 to 35 years of age, earliest–2010s
Average attainment rate Attainment rate of the worst-o� group
0
20
40
60
80
100
2003 2014 2010 2015 2000 2011 2000 2014 1991 2013 2003 2012 2000 2013 2005 2012 2006 2015 2000 2013 1998 2013 1997 2012 2000 2010 2006 2015
ATT
AIN
MEN
T R
ATE
S(%
OF
POPU
LATI
ON
AG
ES 2
0–35
)
-17
-27 -26 -27
-25 -30
-48-35
-33
-1
-5 -13 -1 -14 -22 -19 -17
Cam
bodi
a
Afg
hani
stan
Bang
lade
sh
Paki
stan
Indo
nesi
a
Viet
Nam
Thai
land
Turk
men
ista
n
Mon
golia
Phili
ppin
es
Kyrg
yzst
an
Arm
enia
Kaza
khst
an
Lao
PDR
-6 -28
-23
-18
-6 -8
-7 -9 -10-6 -5
Source: ESCAP calculations based on latest DHS and MICS surveys.Note: Average means the average rate of secondary attainment in a respective year. With respect to the attainment rate of the worst-off or most disadvantaged group, the size and composition of that group may vary from year to year.
FIGURE 9Distance of the worst-off group from the average in higher education attainment for individuals 25 to 35 years of age over time, earliest–2010s
Average attainment rate Attainment rate of the worst-o� group
-1 -7 -3 -5 -11 -7 -10 -12 -6 -10 -3 -15-13 -12
-5 -19-12 -20 -25 -27
-20-26
-10
-14
-16-24 -20
-390
20
40
60
80
100
2003 2014 2010 2015 2000 2011 2000 2014 2003 2012 1991 2013 2006 2015 2000 2013 2000 2010 1998 2013 2005 2012 1997 2012 2006 2015 2000 2013
Cam
bodi
a
Afg
hani
stan
Lao
PDR
Bang
lade
sh
Indo
nesi
a
Paki
stan
Turk
men
ista
n
Viet
Nam
Arm
enia
Phili
ppin
es
Thai
land
Kyrg
yzst
an
Kaza
khst
an
Mon
golia
ATT
AIN
MEN
T R
ATE
S(%
OF
POPU
LATI
ON
AG
ES 2
5–35
)
Source: ESCAP calculations based on latest DHS and MICS surveys.Note: Average means the average rate of secondary attainment in a respective year. With respect to the attainment rate of the worst-off or most disadvantaged group, the size and composition of that group may vary from year to year.
17
CHAPTER 4: Who are the furthest behind?

Understanding overall inequality in educational attainment
x This discrepancy is present because the calculation formula of the D-index “penalizes” countries with lower average attainment rate. See Box 1.
Beyond identifying the most disadvantaged groups, this chapter calculates overall levels of inequality in educational attainment experienced by all groups in a given country. The calculated inequality can be decomposed by circumstances, thereby capturing the individual impact on inequality of opportunity for every country. Policymakers can follow this analysis in identifying factors aggravating inequality in their country.
5.1Calculating overall inequality
The first step to measuring overall inequality is identifying all possible groups and their attainment levels. The Dissimilarity Index (D-index) is then determined by taking the distances for each group’s attainment rate and comparing the sum of these to the average attainment level for each country (see Box 1). The calculated D-index represents the overall inequality in attainment. This analysis is repeated for each level of education, both secondary and higher.
5.2Where is overall inequality highest?
The results show that overall inequality is highest in countries with lower average secondary education attainment. For example, with a high D-index of around 0.4, Cambodia, Lao People’s Democratic Republic and the Maldives have the highest inequality in secondary educational attainment (Figure 10), whereas Armenia,
Kazakhstan, Kyrgyzstan and Turkmenistan have a D-index at or below 0.05 (5 per cent).
Inequality in higher education attainment is substantially higher than for secondary education, with D-indexes reaching 0.45 in Cambodia and 0.5 in Lao People’s Democratic Republic (Figure 11). These results do not fully reflect the gaps between the most disadvantaged and advantaged groups, but instead highlight widespread inequality.x
“…two countries with identical
secondary attainment rates may
have a very different D-index if the
distribution of attainment in one
country excludes certain groups”
BOX 1Calculating the Dissimilarity Index
The dissimilarity index, or D-index, measures how all different population groups fare in terms of completing secondary or higher education. For example, two countries with identical secondary attainment rates may have a very different D-index if the distribution of attainment in one country excludes certain groups (such as poorer groups, or ethnic minorities). To obtain the D-index, inequalities in attainment among all possible population groups are calculated using the following equation:
where is the weighted sampling proportion of group i, (sum of equals 1), is the average attainment rate in the country and is the level of attainment of population group , and takes values from 0 to 1. There are n number of groups defined by using the interactions of the circumstances selected for the analysis.
Three circumstances are used to determine the number and composition of the population groups: wealth (2 groups); residence (2 groups); and sex (2 groups). This produces n=8 groups (2x2x2), covering the entire sample population.
18
CHAPTER 5

5.3What circumstances matter more for attaining education?
Building on the D-index calculation, the contribution of each circumstance is estimated by following the Shapley decomposition methodology (Box 2). From a policymaking perspective, understanding these patterns is useful for informing education priorities, particularly if the goal is to “leave no one behind”.
BOX 2Shapley decomposition
The Shapley decomposition method estimates the marginal contribution of each circumstance to inequality in educational attainment. The basic idea behind this decomposition, taken from cooperative game theory, is measuring how much the estimated D-index would change when a circumstance is added to the pre-existing set of circumstances. The change in inequality caused by the addition of a new circumstance would be a reasonable indicator of its contribution to inequality.10
The impact of adding a circumstance A (e.g. wealth) is given by the following formula:
Where N is the set of all n circumstances; and S is the subset of N circumstances obtained after omitting the circumstance A. D(S) is the D-index estimated with the sub set of circumstances S. D(SU{A}) is the D-index calculated with set of circumstances S and the circumstance A.
The contribution of characteristic A to the D-index is then formula:
The critical property satisfied by the Shapley decomposition is that the sum of contributions of all characteristics adds up to 1 (100 per cent).
As measured by the D-index, the relative contribution of each specific circumstance to overall inequality in educational attainment does not vary much across the region. Wealth is the most important circumstance for most countries and determines more than half of the inequality in several countries.
Residence is also important, particularly in countries with higher D-indexes, suggesting that a lack of access to schools or adequate infrastructure may hinder individuals from completing secondary education. In Afghanistan and Tajikistan however, being female outweighs all other circumstances in producing inequality in terms of secondary education.
The picture is more varied in terms of higher education attainment (Figure 11). In 10 out of 21 countries, wealth matters most for completing higher education, while in another 9 out of 21 residence is more important. Again, Afghanistan and Tajikistan are exceptions to these trends, where being female produces most of the observed inequality.
Knowing which circumstance contributes more toward inequality can therefore guide policymakers toward the most effective intervention areas.
“Wealth is the most important
circumstance for most countries and
determines more than half of the
inequality in several countries”
19
CHAPTER 5: understanding overall inequality in educational attainment

5.4How does each circumstance contribute to determining attainment?
To bolster the analytical findings, logistic regressions were conducted to observe the effects of circumstance variables (household wealth, residence and sex) on an individual’s secondary or higher education attainment.
The logistic regression model for each country is given by:
xi The logistic regressions are summarized in the Annex.
Where stands for (y=1) and y is a binary response variable which assumes two values:
and
where β0..n are logit model coefficients and X1 ..n are circumstance variables, i.e. X1 is household wealth of the individual, X2 is their residence, and X3 is the sex of the individual, either male or female.
The base references used in the model are individuals belonging to the top 60 per cent in terms of wealth, those residing in urban households and males.xi
FIGURE 10Inequality in secondary education attainment and its decomposition, latest year
Source: ESCAP calculations using data from the latest DHS and MICS surveys.
0.000.050.100.150.200.250.300.350.40
Kaza
khst
an
Arm
enia
Kyrg
yzst
an
Turk
men
ista
n
Tajik
ista
n
Phili
ppin
es
Thai
land
Mon
golia
Indo
nesi
a
Viet
Nam
Vanu
atu
Tim
or-L
este
Paki
stan
Bang
lade
sh
Afg
hani
stan
Bhut
an
Mya
nmar
Indi
a
Cam
bodi
a
Mal
dive
s
Lao
PDR
DEC
OM
POSI
TIO
N O
F D
-IN
DEX
Wealth Residence Sex
FIGURE 11Inequality in higher education attainment and its decomposition, latest year
Source: ESCAP calculations using data from the latest DHS and MICS surveys.
DEC
OM
POSI
TIO
N O
F D
-IN
DEX
Wealth Residence SexKy
rgyz
stan
Kaza
khst
an
Thai
land
Arm
enia
Phili
ppin
es
Tajik
ista
n
Mon
golia
Viet
Nam
Turk
men
ista
n
Indo
nesi
a
Bang
lade
sh
Paki
stan
Afg
hani
stan
Vanu
atu
Bhut
an
Indi
a
Mal
dive
s
Mya
nmar
Tim
or-L
este
Cam
bodi
a
Lao
PDR0.0
0.1
0.2
0.3
0.4
0.5
20
CHAPTER 5: understanding overall inequality in educational attainment

In the case of secondary education, the logistic model shows that in all countries, individuals between 20 and 35 years of age, and belonging to households in the bottom 40 per cent of the population, are less likely to complete their education. For instance, in the case of Bhutan, the odds of an individual from this group having completed secondary education are 81 per cent lower for a person in a bottom 40 per cent household (Tables A3 and A4).
Residence also appears statistically significant in almost all countries. This indicates that the odds of completing secondary education differ between individuals living in urban and rural areas. In the example of Bhutan, the odds of an individual from this group having completed secondary education are 50 per cent lower for households in rural areas.
Gender is a mixed determinant of secondary education completion in the region. In Kazakhstan, Kyrgyzstan, Mongolia, Myanmar, the Philippines and Thailand the odds for completing secondary education for a woman between 20 and 35 years of age are higher than those of a man from the same group. In Armenia and Mongolia women have more than twice the odds of men in completing secondary education. In all remaining countries, the odds of women completing
xii For the full list of estimates please see the Annex.
secondary education are lower than those of men. This is also the case in Bhutan, where the odds of men between 20 and 35 years of age are twice those of women. The two countries where sex matters most are Afghanistan and Tajikistan, where men are almost five and three times more likely to complete secondary education than women.
The results are similar for higher education. Household wealth and residence are important circumstances for completing higher education, but the role of gender depends on context. Individuals between 25 and 35 years of age and belonging to the bottom 40 per cent of households, and those living in rural areas, are less likely to complete this stage.
In the case of Bhutan, the odds of an individual from this group completing higher education are 94 per cent lower if the individual lives in a poorer household. In addition, individuals living in rural areas are 58 per cent less likely to complete higher education.
Again, the gender effect is mixed. Generally, it follows the same pattern as for secondary education. The odds of completing higher education are between 10 and 40 per cent higher for women in Indonesia, Kyrgyzstan, Mongolia, Myanmar, Philippines, Thailand, and almost 70 per cent higher in Kazakhstan. In Bangladesh, Bhutan, Cambodia, India, Lao People’s Democratic Republic, Pakistan, Tajikistan, Timor-Leste, Turkmenistan and Vanuatu, men have 1.5 to 2.5 times higher odds than women in completing higher education. In Afghanistan, men’s odds are again almost five times as high.xii
“In Afghanistan, men are almost
five times more likely to complete
secondary education than women”
21
CHAPTER 5: understanding overall inequality in educational attainment
Does ethnicity matter for determining the furthest behind?
xiii These results are also confirmed in the regression analysis results provided in the Annex.
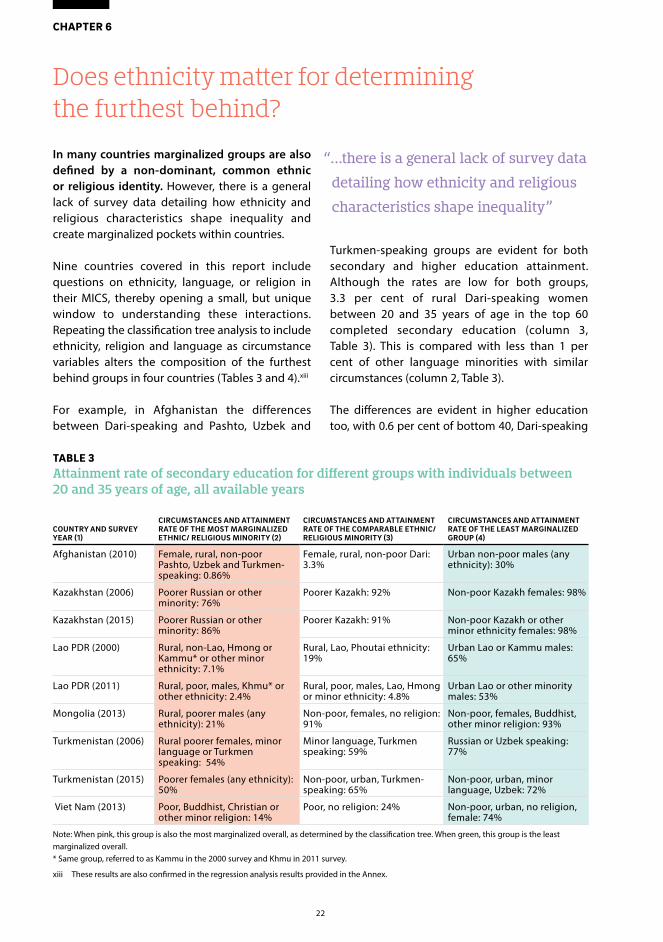
In many countries marginalized groups are also defined by a non-dominant, common ethnic or religious identity. However, there is a general lack of survey data detailing how ethnicity and religious characteristics shape inequality and create marginalized pockets within countries.
Nine countries covered in this report include questions on ethnicity, language, or religion in their MICS, thereby opening a small, but unique window to understanding these interactions. Repeating the classification tree analysis to include ethnicity, religion and language as circumstance variables alters the composition of the furthest behind groups in four countries (Tables 3 and 4).xiii
For example, in Afghanistan the differences between Dari-speaking and Pashto, Uzbek and
Turkmen-speaking groups are evident for both secondary and higher education attainment. Although the rates are low for both groups, 3.3 per cent of rural Dari-speaking women between 20 and 35 years of age in the top 60 completed secondary education (column 3, Table 3). This is compared with less than 1 per cent of other language minorities with similar circumstances (column 2, Table 3).
The differences are evident in higher education too, with 0.6 per cent of bottom 40, Dari-speaking
TABLE 3Attainment rate of secondary education for different groups with individuals between 20 and 35 years of age, all available years
COUNTRY AND SURVEY YEAR (1)
CIRCUMSTANCES AND ATTAINMENT RATE OF THE MOST MARGINALIZED ETHNIC/ RELIGIOUS MINORITY (2)
CIRCUMSTANCES AND ATTAINMENT RATE OF THE COMPARABLE ETHNIC/ RELIGIOUS MINORITY (3)
CIRCUMSTANCES AND ATTAINMENT RATE OF THE LEAST MARGINALIZED GROUP (4)
Afghanistan (2010) Female, rural, non-poor Pashto, Uzbek and Turkmen-speaking: 0.86%
Female, rural, non-poor Dari: 3.3%
Urban non-poor males (any ethnicity): 30%
Kazakhstan (2006) Poorer Russian or other minority: 76%
Poorer Kazakh: 92% Non-poor Kazakh females: 98%
Kazakhstan (2015) Poorer Russian or other minority: 86%
Poorer Kazakh: 91% Non-poor Kazakh or other minor ethnicity females: 98%
Lao PDR (2000) Rural, non-Lao, Hmong or Kammu* or other minor ethnicity: 7.1%
Rural, Lao, Phoutai ethnicity: 19%
Urban Lao or Kammu males: 65%
Lao PDR (2011) Rural, poor, males, Khmu* or other ethnicity: 2.4%
Rural, poor, males, Lao, Hmong or minor ethnicity: 4.8%
Urban Lao or other minority males: 53%
Mongolia (2013) Rural, poorer males (any ethnicity): 21%
Non-poor, females, no religion: 91%
Non-poor, females, Buddhist, other minor religion: 93%
Turkmenistan (2006) Rural poorer females, minor language or Turkmen speaking: 54%
Minor language, Turkmen speaking: 59%
Russian or Uzbek speaking: 77%
Turkmenistan (2015) Poorer females (any ethnicity): 50%
Non-poor, urban, Turkmen-speaking: 65%
Non-poor, urban, minor language, Uzbek: 72%
Viet Nam (2013) Poor, Buddhist, Christian or other minor religion: 14%
Poor, no religion: 24% Non-poor, urban, no religion, female: 74%
Note: When pink, this group is also the most marginalized overall, as determined by the classification tree. When green, this group is the least marginalized overall.* Same group, referred to as Kammu in the 2000 survey and Khmu in 2011 survey.
“…there is a general lack of survey data
detailing how ethnicity and religious
characteristics shape inequality”
22
CHAPTER 6
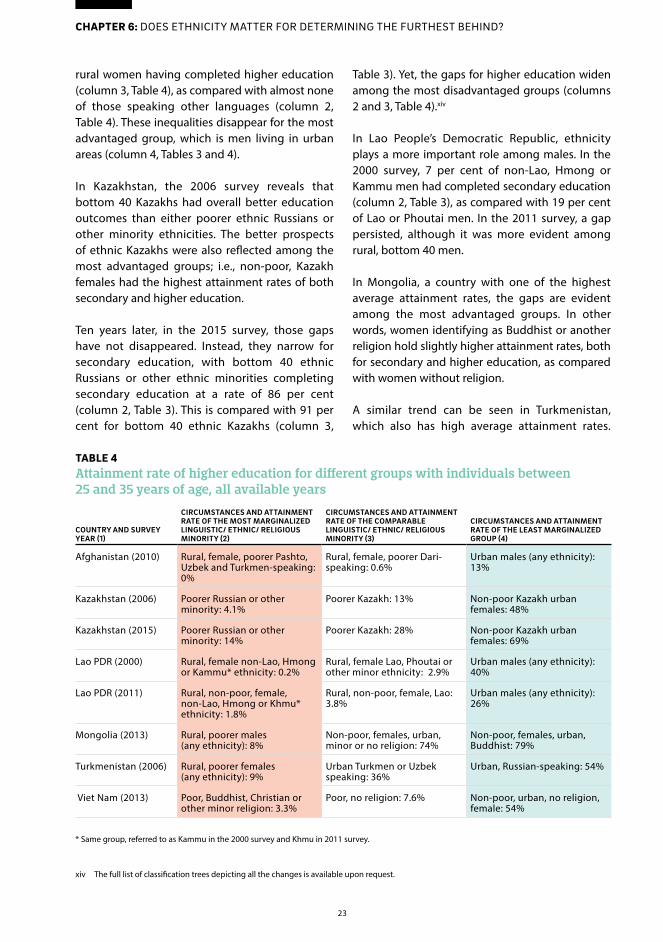
rural women having completed higher education (column 3, Table 4), as compared with almost none of those speaking other languages (column 2, Table 4). These inequalities disappear for the most advantaged group, which is men living in urban areas (column 4, Tables 3 and 4).
In Kazakhstan, the 2006 survey reveals that bottom 40 Kazakhs had overall better education outcomes than either poorer ethnic Russians or other minority ethnicities. The better prospects of ethnic Kazakhs were also reflected among the most advantaged groups; i.e., non-poor, Kazakh females had the highest attainment rates of both secondary and higher education.
Ten years later, in the 2015 survey, those gaps have not disappeared. Instead, they narrow for secondary education, with bottom 40 ethnic Russians or other ethnic minorities completing secondary education at a rate of 86 per cent (column 2, Table 3). This is compared with 91 per cent for bottom 40 ethnic Kazakhs (column 3,
xiv The full list of classification trees depicting all the changes is available upon request.
Table 3). Yet, the gaps for higher education widen among the most disadvantaged groups (columns 2 and 3, Table 4).xiv
In Lao People’s Democratic Republic, ethnicity plays a more important role among males. In the 2000 survey, 7 per cent of non-Lao, Hmong or Kammu men had completed secondary education (column 2, Table 3), as compared with 19 per cent of Lao or Phoutai men. In the 2011 survey, a gap persisted, although it was more evident among rural, bottom 40 men.
In Mongolia, a country with one of the highest average attainment rates, the gaps are evident among the most advantaged groups. In other words, women identifying as Buddhist or another religion hold slightly higher attainment rates, both for secondary and higher education, as compared with women without religion.
A similar trend can be seen in Turkmenistan, which also has high average attainment rates.
TABLE 4Attainment rate of higher education for different groups with individuals between 25 and 35 years of age, all available years
COUNTRY AND SURVEY YEAR (1)
CIRCUMSTANCES AND ATTAINMENT RATE OF THE MOST MARGINALIZED LINGUISTIC/ ETHNIC/ RELIGIOUS MINORITY (2)
CIRCUMSTANCES AND ATTAINMENT RATE OF THE COMPARABLE LINGUISTIC/ ETHNIC/ RELIGIOUS MINORITY (3)
CIRCUMSTANCES AND ATTAINMENT RATE OF THE LEAST MARGINALIZED GROUP (4)
Afghanistan (2010) Rural, female, poorer Pashto, Uzbek and Turkmen-speaking: 0%
Rural, female, poorer Dari-speaking: 0.6%
Urban males (any ethnicity): 13%
Kazakhstan (2006) Poorer Russian or other minority: 4.1%
Poorer Kazakh: 13% Non-poor Kazakh urban females: 48%
Kazakhstan (2015) Poorer Russian or other minority: 14%
Poorer Kazakh: 28% Non-poor Kazakh urban females: 69%
Lao PDR (2000) Rural, female non-Lao, Hmong or Kammu* ethnicity: 0.2%
Rural, female Lao, Phoutai or other minor ethnicity: 2.9%
Urban males (any ethnicity): 40%
Lao PDR (2011) Rural, non-poor, female, non-Lao, Hmong or Khmu* ethnicity: 1.8%
Rural, non-poor, female, Lao: 3.8%
Urban males (any ethnicity): 26%
Mongolia (2013) Rural, poorer males (any ethnicity): 8%
Non-poor, females, urban, minor or no religion: 74%
Non-poor, females, urban, Buddhist: 79%
Turkmenistan (2006) Rural, poorer females (any ethnicity): 9%
Urban Turkmen or Uzbek speaking: 36%
Urban, Russian-speaking: 54%
Viet Nam (2013) Poor, Buddhist, Christian or other minor religion: 3.3%
Poor, no religion: 7.6% Non-poor, urban, no religion, female: 54%
* Same group, referred to as Kammu in the 2000 survey and Khmu in 2011 survey.
23
CHAPTER 6: does ethnicity matter for determining the furthest behind?

In Turkmenistan’s 2006 survey, the Russian speaking population is the group with the highest secondary and higher education attainment rates. In 2015, ethnicity no longer plays a role for higher education attainment. However, for secondary education, the Turkmen-speaking population is still disadvantaged compared with Uzbek or other-language speaking population (columns 3 and 4, Table 3).
In Viet Nam, belonging to a religion seems to be associated with disadvantages for both secondary and higher education. Buddhists and Christians belonging to the bottom 40 have half the attainment rates of non-religious men and women who are also in the bottom 40. Non-religious are also in the most advantaged groups, suggesting that they have more opportunities overall.
To conclude, in all six countries where ethnicity, language or religion mattered, coming from a poorer and rural household remains a common, significant circumstance for determining educational attainment. Notably though, the impact of ethnicity or religion is still generally evident among the advantaged groups, except in Afghanistan and in the Lao People’s Democratic Republic where this applied only to higher education.
6.1So what’s the impact on overall inequality?
The analysis in this Chapter shows that ethnic marginalization can be both partly concealed and partly compounded by economic, social or geographical circumstances. Recalculating the decomposition of inequality to include ethnicity and religion confirms these findings. Although household wealth still matters the most in shaping inequality, ethnicity is the second most important circumstance for inequality in higher education in the Lao People’s Democratic Republic and third most important in Kazakhstan and Viet Nam (Figure 12). This importance is visibly lower in secondary education, as compared with higher education.
Although this analysis is not exhaustive and relies on a limited set of household surveys, ethnic minorities and indigenous groups are generally less educated than their majority, non-indigenous, counterparts. Significantly lower levels of education were found, for example, among the Dalit castes in Nepal.11 In India, there are reports of abuse, humiliation and harassment of Dalits girls on their way to school, including sometimes at school, by upper caste teachers, contributing to
FIGURE 12The role of ethnicity, religion and language in shaping inequality in education, latest year
0.00
0.10
0.20
0.30
0.40
0.50
0.60
2010 2015 2011 2013 2012 2015 2007 2013Afghanistan Kazakhstan Lao PDR Mongolia Thailand Turkmenistan Vanuatu Viet Nam
Wealth
DEC
OM
POSI
TIO
N O
F D
-IN
DEX
Seco
ndar
yed
ucat
ion
Hig
her
educ
atio
n
Seco
ndar
yed
ucat
ion
Hig
her
educ
atio
n
Seco
ndar
yed
ucat
ion
Hig
her
educ
atio
n
Seco
ndar
yed
ucat
ion
Hig
her
educ
atio
n
Seco
ndar
yed
ucat
ion
Hig
her
educ
atio
n
Seco
ndar
yed
ucat
ion
Hig
her
educ
atio
n
Seco
ndar
yed
ucat
ion
Hig
her
educ
atio
n
Seco
ndar
yed
ucat
ion
Hig
her
educ
atio
n
Residence Sex Ethnicity, religion and language
Source: ESCAP calculations using data from the latest DHS and MICS surveys. Countries in which ethnicity, religion or language contribute over 5 per cent to overall inequality.
24
CHAPTER 6: does ethnicity matter for determining the furthest behind?

their high primary school exclusion rates.12 Lower educational attainment was also found among Indigenous Australians, with Year 12 completion rates being twice as high for non-Indigenous compared with Aboriginal and Torres Strait Islander peoples aged 18 years of age and over.13
This relationship between ethnicity and education often intersects with other circumstances, such as coming from a poor or rural household. On the other hand, ethnic groups with higher levels of educational attainment are more likely to participate in social, economic and even political life. For example, research shows that educated members of ethnic minorities engage more in non-violent protests than those with lower levels of education.14
Additionally, although not included in the data analysis, New Zealand is making progress on improving early childhood education for Maori children by involving Maori communities in curriculum development, Maori language speakers in teaching and responding to the needs of indigenous children.15
In addition to ethnic or religious minorities, other marginalized groups may likewise be subject to unequal opportunities. As the DHS and MICS did not include other questions by which to identify marginalized groups, such as migrants, or persons with disabilities, it is difficult to produce comparative analysis.16 However, Box 3 presents a broad overview of inequalities that these groups may be facing.
BOX 3Other vulnerable groups who are furthest behind
Asia-Pacific is home to 690 million persons with a disability. Regional, international migrant numbers are also rising and currently stands at approximately 59 million. This is important because these groups face multiple vulnerabilities, including unequal access to secondary and higher education.
Persons with disabilities experience lower educational opportunities as children and therefore also face fewer opportunities as adults. This pattern is more pronounced among lower income countries whose population groups include households with a member having a disability. These groups tend to be disproportionately poor, thereby demonstrating an intersection between relevant circumstances.
Children with disabilities experience barriers to participating in education that result in enrolment rate drops of up to 53 per cent between primary and secondary education. Even for children who enter secondary education, the compounded effect of this disparity is carried into later years, making it increasingly difficult for persons with disabilities to hold comparable levels of educational attainment.
Finally, the irregular status of migrants means that these groups are not able to attend formal schooling. Even if the host country provides for universal education, cultural, language and economic obstacles prevent migrants from enrolling. In Thailand for instance, many migrants attend learning centres operated by non-accredited, non-governmental organizations. As a result, the certificates of attainment received by students are usually not recognized.
25
CHAPTER 6: does ethnicity matter for determining the furthest behind?

Recommendations for closing the gapsAlthough average education attainment rates generally increase for individuals in all age ranges, the findings of this study highlight that sizeable portions of the population are still excluded. To address these gaps, policymakers need to implement policies sensitive to the circumstances affecting inequality.
The following are put forward as key considerations for policymakers when designing regulatory and other applicable policies aimed at decreasing the inequalities in education:
1 Identify the shared common circumstances shaping household choices to educational attainment. Unequal education opportunities are strongly linked to unequal outcomes in other development objectives (e.g. lower access to decent employment). Understanding the key circumstances shaping household choices is therefore paramount to addressing not only education inequalities, but others as well.
2 Explore the social, economic and cultural reasons for localized disparities in education. In communities with poor educational outcomes, multi-stakeholder consultations are necessary for understanding household motivations and decisions. Research demonstrates that one household may stop sending children to school after secondary level, while a neighbouring family, perhaps from a different ethnic group, instead invests in longer periods of education. Hence, it is important to understand the nuances restricting some households from making “better” choices.
3 Encourage collaboration among government ministries and agencies to strengthen household incentives for keeping children in school. Given the diversity of circumstances impacting household decisions, cross-sectoral and inter-ministerial coordination is imperative for creating opportunities for households to invest in the educational opportunities afforded them.
4 Strengthen data collection efforts to understand how education deficits impact individual household members. Existing data used in this study do not allow for a full understanding of household choices, behaviours or subsequent inequalities arising among and within households. Granular data is therefore necessary for dissecting how different members of a particular household are both supported in attending school, as well as the consequences for not attending.
5 Ensure a good foundation for learning through universal primary and secondary education, as well as quality early childhood education and care services. Although primary education has become near universal in many countries in Asia-Pacific, the issue of quality remains. For instance, often schools in rural areas are poorly resourced with less experienced or qualified teachers, affecting the children’s learning. In order to ensure all learners, regardless of their socioeconomic backgrounds, develop readiness for further education, learning at earlier levels of education must be prioritized.
6 Support women’s transition from secondary to higher education, and then to the workplace. In half of the countries, women’s secondary education attainment is comparable with or even higher than men’s. In higher education, men catch up or surpass women, with a few exceptions in both North and Central Asia and South-East Asia. Women also get discouraged during the school-to-work transition. Policy interventions should facilitate that transition by providing incentives for women to stay in school, complete tertiary education and aim for better jobs. Support for young mothers, including parental leave, could also serve as an incentive for completing education. Countries with deeply entrenched cultural and institutional discrimination practices need to break stereotypes and further educational opportunities for girls.17
7 Prioritize poorer households in education initiatives and consider introducing social protection programmes that provide a guaranteed minimum income to help poorer families send their children to school. Universal programmes have proven the most effective in reaching the poorest household. Cash transfer programmes such as child benefits and school stipends, but also programmes such as social pensions that do not specifically focus on children, have a positive impact on school enrolment and attendance as they enable families to absorb the costs associated with sending children to school.
8 Promote higher educational attainment as an investment in human resources and future productivity. The investment in quality education can bring households out of poverty, break poverty traps and create opportunities for successive generations.
26
CHAPTER 7

Methodology for identifying gaps in access to opportunities
xv Access to the DHS datasets for three additional Pacific countries has been requested and the requests are still under consideration.
The Inequality of Opportunity approach
To measure inequality of opportunity, the ESCAP reports on Inequality of Opportunity identify a set of opportunities and measure the gaps among different population groups in access to these opportunities. To do so, a set of circumstances is selected from available variables in the DHS and MICS datasets to define the groups. The circumstances are conditions over which the individuals or households have no control.
Those circumstances are used in the classification tree analysis to identify the groups that are most disadvantaged in each country; in this case, meaning those who have the lowest educational attainment. The composition of those groups varies from country to country, as does the size of the sample population they represent.
This approach differs from the use of “inequality of opportunity” in other recent literature, which instead uses regression analysis to explain the share of inequality of outcome (income inequality or consumption inequality) that can be attributed to circumstances over which individuals have no control, such as ethnicity and sex.
Given that the DHS and MICS datasets do not include information on income or consumption (both classified as outcomes), these thematic reports do not include such regressions. However, future analysis might use the wealth index of the DHS and MICS as a proxy “outcome” and regress it against the set of circumstances used in this analysis.
The data sources
This analysis in uses the Demographic and Health Surveys (DHS) and the Multiple Indicator Cluster Surveys (MICS). DHS and MICS are publicly available for 21 Asia-Pacific countries as shown
in Table 1.xv The DHS and MICS datasets are selected because of: a) the comparability across countries; b) the accessibility of the data; and c) the extensive questions on health, demographic and basic socioeconomic data referencing both the household (e.g., water and sanitation, financial inclusion, electricity and clean fuels, ownership of mobile phones) and individuals (e.g., level of education, nutrition status).
The countries
Based on available surveys, 21 out of 21 countries are included in this report on education. Twelve countries have surveys representing two different points in time, all of which include questions on education. Table A1 provides the full list of 21 countries and their survey years (latest and earliest).
TABLE A1List of countries and survey years
COUNTRYEARLIEST YEAR
EARLIEST SURVEY
LATEST YEAR
LATEST SURVEY
Afghanistan 2010 MICS 2015 DHSArmenia 2000 DHS 2010 DHSBangladesh 2000 DHS 2014 DHSCambodia 2000 DHS 2014 DHSIndonesia 2003 DHS 2012 DHSKazakhstan 2006 MICS 2015 MICSKyrgyzstan 1997 DHS 2012 DHSLao PDR 2000 MICS 2011 MICSMongolia 2000 MICS 2013 MICSPakistan 1991 DHS 2013 DHSPhilippines 1998 DHS 2013 DHSThailand 2005 MICS 2012 MICSTurkmenistan 2006 MICS 2015 MICSViet Nam 2000 MICS 2013 MICSBhutan n/a n/a 2010 MICSIndia n/a n/a 2006 DHSMaldives n/a n/a 2009 DHSMyanmar n/a n/a 2000 MICSTajikistan n/a n/a 2012 DHSTimor-Leste n/a n/a 2010 DHSVanuatu n/a n/a 2007 MICS
27
ANNEX: methodology for identifying gaps in access to opportunities

The indicators and circumstances
The indicators depicting inequality in education opportunities are secondary and higher education attainment rates. As reported by the Interagency Group on SDG Indicators (IAEG-SDGs), their connection to the Sustainable Development Goals (SDGs) were the main criterion for selecting these indicators.xvi The circumstances used are residence (rural or urban), wealth (belonging to the bottom 40 or top 60 per cent), sex (male or female) and ethnicity or language (where available) (Table A2).
The classification tree analysis
The primary goal of the household survey analysis is identifying the groups with the lowest and highest educational attainment rates by using the selected indicators. The indicators can be seen as “response variables”, while the factors characterizing the groups are defined as “circumstances”.
The analysis then uses a classification tree model to identify the groups with highest or lowest attainment. A classification tree is an analytical structure representing groups of the sample population with different response values, or different levels of access to a certain opportunity.
Consider the following example:
Opportunity: Education
Indicator (“response variable”): “Attainment rates for secondary education among men and women between 20 and 35 years of age”.
Factors (“circumstances”): The circumstances being considered are the following:
1 Residence (urban or rural); 2 Sex (male or female);3 Household wealth (Bottom 40 or Top 60).
To identify the groups with the highest or lowest educational attainment, a classification tree is constructed for each country, using R, an open source statistical software. The root node of the
xvi The latest indicators to be used for monitoring the SDGs can be found at: https://unstats.un.org/sdgs/iaeg-sdgs/.
tree is the entire population sample. The tree method algorithm starts by searching for the first split (or branch) of the tree. It does so by looking at each circumstance and splitting the sample in two groups, so that it achieves the most “information reduction”. This information metric can be defined in a few ways, while the most common one, and the one used in this analysis, is the “entropy”.18
The tree representation
A tree method is an algorithm that estimates the attainment of education by partitioning the target individuals into different groups based on the household circumstances chosen:
Where Yi is the observed opportunity for the i-th individual in the sample, X1i, ...., Xli are the circumstances. In the example of education, Y is secondary or higher educational attainment, X1, X2, X3 (where l = 3) are residence, household wealth level, and sex of the respondent. A1, A2, ..... Am are the different partitions of the sample, also called end nodes, where:
and
This means the end nodes are mutually exclusive and complementary, and every individual belongs to one and only one of the end nodes. I () only takes value 1 when the i-th individual belongs to j-th end node, otherwise, I () takes value 0. The tree algorithm generates the end nodes, according to metrics that measure the effectiveness of the partition that gives to different levels of educational attainment.
Information theory and entropy is a very common choice for the metrics. Entropy for j-th end node can be calculated according to the definition:
28
ANNEX: methodology for identifying gaps in access to opportunities

The aggregated entropy for the tree is calculated by:a
Where qj is the sample proportion of Aj. The actual algorithm that generates the end-nodes works step-by-step, starting from the entire sample. Each time the sample is partitioned, new end-nodes are generated and the entropy is calculated and compared to the entropy before the new partition. Each partition (and hence the new end nodes) is kept when the increment of entropy is bigger than a pre-set threshold. The algorithm stops when no more increment of entropy can be made through a new partition, or a set of present conditions can’t be satisfied.
In addition to finding groups that have significant differences in their educational attainment, the classification tree algorithm also operates under the limitation that each group should have enough group members. To avoid a too small sub-sample size, the analysis has set the tree nodes to have a minimum size of at least 10 per cent of the total population and the split of tree is only made when an “information reduction” criterion is satisfied.
In Chapter 6, which introduces ethnicity and religion as a circumstance, the minimum size of the population group criterion is reduced to 5 per cent of the population to fully capture minority religions and ethnicities.
Choice of circumstances
Out of the many variables available in the DHS and MICS surveys, several determinant factors are considered to help identify the most excluded groups. The selection of variables is consistent across all surveys to maintain comparability across countries.
The classification tree includes these factors in the tree as branches only if they are found to reduce entropy. Ultimately, these circumstances (determinant factors) define the composition of the groups. However, circumstances should not be interpreted as “causes” of inequality. The association found does not imply causality. Furthermore, there are many other factors that
these models cannot consider, because of the limitations of the datasets.
Ideally, it would have been preferred to include only circumstances over which a household member has very little control, such as the dominant religion in a household, ethnicity, existence of a disability, or the education of the mother or father of the respondent. The majority of the DHS did not ask these questions. Some MICS, however, did ask questions related to ethnicity, language and religion and the results are presented in Chapter 6.
Additional factors of interest for study are geographical variables, such as province or city in a given country, but inclusion would have affected comparability across countries. Geographic variables can be analysed in future work focusing on one country only.
Gaps and limitations
The available datasets limit the scope of this analysis somewhat. First, several relevant circumstances cannot be captured. For example, the distance of a household from a school is an important circumstance that might shape educational attainment.
Furthermore, and consistent with similar studies on inequalities among groups, this analysis does not consider inequality within groups.19 Even within homogenous groups, additional unobserved circumstances, or different levels of effort, may affect outcomes. This analysis only calculates observable average attainment for each group, and thus draws conclusions on gaps and inequality based on these average observations.
Finally, recent literature on inequality of opportunity also links inequality of outcome with inequality of opportunity, by calculating the share of income inequality (inequality of outcome) that can be explained by the circumstances of each group.20 The analysis in this series of reports on Inequality of Opportunity does not follow the same approach because the datasets do not include an income proxy besides the wealth index.
29
ANNEX: methodology for identifying gaps in access to opportunities

The wealth index and the bottom 40–top 60 wealth split
Wealth, as used in this report, is a composite index reflecting a household’s cumulative living standard that is developed by the DHS and MICS researchers and combines a range of household circumstances including: a) ownership of household assets, such as TVs, radios and bicycles; b) materials used for housing; and c) type of water and sanitation facilities.
The wealth index is calculated using the Principal Component Analysis and thus allows a relative ranking of households based on their assets.xvii The wealth index is not comparable across countries, however, as it consists of different assets in each country. Cross-country comparison based on wealth should be understood with that caveat.
In this series of reports, the wealth index is employed as a circumstance to distinguish between different types of households. Although technically not a circumstance over which households have no control, wealth is still a proxy for many hidden conditions that may limit access to a certain opportunity, especially considering the lack of other determinant factors to explore, such as education of mother or father, ethnicity, prevalence of a disability or migrant status.
In this report, individuals can belong to one of two possible groups based on the wealth index: the bottom 40 per cent (sometimes labelled as “bottom 40”) and the top 60 per cent (or “top 60”).
Several other possible cuts of the wealth index were considered, including by quintile, top 40–bottom 40, and top 10–bottom 40. These options were not selected however, because generally they produce more homogenous groups, thus overshadowing other circumstances (e.g. education levels, rural-urban distinctions). The top 40–bottom 40 approach (and its variation of top 10–bottom 40) were also rejected because they eliminate 20 to 50 per cent of the sample population from the analysis, with a risk of
xvii For more information see Demographic and Health Surveys (DHS) http://www.dhsprogram.com/programming/wealth%20index/DHS_Wealth_Index_Files.pdf
missing some “middle class” groups with common characteristics (e.g. secondary education).
Narrowing the sample population to only half (top 10–bottom 40) also runs the risk of not allowing for making statistically significant inferences. Moreover, neither the top node, or root, of the tree, nor the size of the groups of the rest of the nodes would be representative of the population.
Finally, the wealth index in the DHS and MICS produces a distribution of households by wealth, without any monetary values assigned to the distribution. Therefore, the comparisons of top 10 – top 40 per cent do not have the same explanatory value as they would if the wealth index had taken continuous monetary values.
30
ANNEX: methodology for identifying gaps in access to opportunities

TABLE A2Indicators selected
OPPORTUNITY STUDIEDFACTORS USED TO DETERMINE EXCLUDED GROUPS SDG REFERENCE SURVEY REFERENCE
OP
PO
RTU
NIT
Y C
OM
PO
NEN
T
IND
ICAT
OR
REF
EREN
CE
(TA
RG
ET) G
RO
UP
IN S
UR
VEY
FAC
TOR
1
FAC
TOR
2
FAC
TOR
3
REL
ATED
SD
G
IND
ICAT
OR
SUR
VEY
Q
UES
TIO
N IN
D
HS/
MIC
S
DES
CR
IPTI
ON
SUR
VEY
REC
OD
E
1 Education Secondary education
Individual (household member) age 20-35 (results also available for the 36 - 49 year old age cohort upon request)
Wealth Residence Sex 4.1.1 Proportion of children and young people: (a) in grades 2/3; (b) at the end of primary; and (c) at the end of lower secondary achieving at least a minimum proficiency level in (i) reading and (ii) mathematics, by sex
What is the highest level of school you attended: primary, secondary, or higher?
Generally 10 or 12 years of education, depending on the country, coded to produce the same official average education attainment rates as reported in the DHS and MICS survey reports. R code available upon request.
PR*
2 Education Higher education
Individual (household member) age 25-35 (results also available for the 36 -49 year old age cohort upon request)
Wealth Residence Sex 4.3.1 Participation rate of youth and adults in formal and non-formal education and training in the previous 12 months, by sex
What is the highest level of school you attended: primary, secondary, or higher?
Generally includes answers as in “Vocational, technical", "Higher education with diploma", "Bachelor's degree". The results were coded to produce the same official average education attainment rates as reported in the DHS and MICS survey reports. R code available upon request.
PR*
*PR = Household Member Recode
31
ANNEX: methodology for identifying gaps in access to opportunities

TABLE A3Logit model results: Secondary education
DHSAFGHANISTAN
(1)ARMENIA
(2)BANGLADESH
(3)CAMBODIA
(4)INDIA
(5)INDONESIA
(6)
Coeff SE OR Coeff SE OR Coeff SE OR Coeff SE OR Coeff SE OR Coeff SE OR
(Intercept) -0.22*** 0.02 2.48*** 0.08 -0.34*** 0.03 -0.21*** 0.03 -0.34*** 0.01 1.01*** 0.02
PoorerHousehold -0.68*** 0.03 0.51 -1.03*** 0.12 0.36 -1.78*** 0.05 0.17 -1.86*** 0.07 0.16 -2.25*** 0.03 0.11 -1.38*** 0.02 0.25
ResidenceRural -0.72*** 0.03 0.49 0.02 0.12 -0.36*** 0.03 0.70 -1.17*** 0.04 0.31 -0.72*** 0.01 0.49 -0.89*** 0.02 0.41
SexFemale -1.48*** 0.03 0.23 0.91*** 0.1 2.47 -0.27*** 0.03 0.76 -0.58*** 0.04 0.56 -0.36*** 0.01 0.70 -0.06*** 0.02 0.94
DHSKYRGYZSTAN
(7)MALDIVES
(8)PAKISTAN
(9)PHILIPPINES
(10)TAJISKISTAN
(11)TIMOR-LESTE
(12)
Coeff SE OR Coeff SE OR Coeff SE OR Coeff SE OR Coeff SE OR Coeff SE OR
(Intercept) 1.89*** 0.07 -0.97*** 0.06 0.66*** 0.02 1.46*** 0.04 1.71*** 0.05 0.26*** 0.04
PoorerHousehold 0.49*** 0.08 1.64 -0.68*** 0.1 0.505 -1.51*** 0.04 0.22 -1.94*** 0.04 0.144 -0.34*** 0.05 0.71 -1.29*** 0.05 0.27
ResidenceRural -0.33*** 0.08 0.72 -1.55*** 0.08 0.213 -0.68*** 0.03 0.51 -0.13*** 0.04 0.878 -0.34*** 0.05 0.71 -0.74*** 0.04 0.48
SexFemale 0.3*** 0.07 1.35 -0.26*** 0.07 0.774 -0.62*** 0.03 0.54 0.53*** 0.04 1.707 -1.16*** 0.05 0.31 -0.44*** 0.04 0.64
MICSBHUTAN
(1)KAZAKHSTAN
(2)LAO PDR
(3)MONGOLIA
(4)MYANMAR
(5)THAILAND
(6)
Coeff SE OR Coeff SE OR Coeff SE OR Coeff SE OR Coeff SE OR Coeff SE OR
(Intercept) -0.59*** 0.04 3.17*** 0.07 0.08** 0.03 1.82*** 0.04 -0.6*** 0.03 0.51*** 0.03
PoorerHousehold -1.68*** 0.07 0.19 -1.08*** 0.09 0.34 -2.15*** 0.07 0.17 -2.04*** 0.05 0.13 -1.56*** 0.05 0.21 -1.44*** 0.04 0.24
ResidenceRural -0.7*** 0.05 0.50 -0.23** 0.09 0.80 -1.45*** 0.04 0.23 -1.07*** 0.05 0.34 -1.39*** 0.03 0.249 -0.28*** 0.03 0.75
SexFemale -0.71*** 0.05 0.49 0.22*** 0.07 1.25 -0.58*** 0.04 0.56 0.82*** 0.05 2.27 0.15*** 0.03 1.162 0.29*** 0.03 1.33
MICSTURKMENISTAN
(7)VANUATU
(8)VIET NAM
(9)
Coeff SE OR Coeff SE OR Coeff SE OR
(Intercept) 0.71*** 0.04 0.46*** 0.06 0.67*** 0.04
PoorerHousehold -0.4*** 0.06 0.67 -1.27*** 0.12 0.28 -1.65*** 0.05 0.19
ResidenceRural -0.2*** 0.06 0.82 -0.93*** 0.09 0.40 -0.51*** 0.05 0.60
SexFemale -0.08 * 0.05 0.92 -0.31*** 0.08 0.73 0.01 0.05
Source: UNESCAP elaboration based on DHS and MICS household surveys.Notes: 1. Latest year available for each country. 2. Base references are top 60 household, urban household, and sex is male. 3. Coeff. = Coefficient, SE = Standard Error, OR = Odds Ratio.*** 1% level of significance** 5% level of significance* 10% level of significance
32
ANNEX: methodology for identifying gaps in access to opportunities

TABLE A4Logit model results: Higher education
DHSAFGHANISTAN
(1)ARMENIA
(2)BANGLADESH
(3)CAMBODIA
(4)INDIA
(5)INDONESIA
(6)
Coeff SE OR Coeff SE OR Coeff SE OR Coeff SE OR Coeff SE OR Coeff SE OR
(Intercept) -1.35*** 0.04 -0.52*** 0.06 -0.78*** 0.04 -0.89*** 0.05 -0.88*** 0.01 -1.04*** 0.03
PoorerHousehold -0.89*** 0.07 0.41 -1.22*** 0.11 0.30 -1.97*** 0.09 0.14 -2.54*** 0.19 0.08 -2.54*** 0.06 0.08 -1.69*** 0.04 0.18
ResidenceRural -0.88*** 0.05 0.42 -0.4*** 0.11 0.67 -0.61*** 0.05 0.55 -1.42*** 0.07 0.24 -0.93*** 0.02 0.40 -0.54*** 0.04 0.58
SexFemale -1.51*** 0.06 0.22 0 0.08 -0.43*** 0.05 0.65 -0.79*** 0.07 0.45 -0.38*** 0.02 0.68 0.17*** 0.03 1.18
DHSKYRGYZSTAN
(7)MALDIVES
(8)PAKISTAN
(9)PHILIPPINES
(10)TAJIKISTAN
(11)TIMOR-LESTE
(12)
Coeff SE OR Coeff SE OR Coeff SE OR Coeff SE OR Coeff SE OR Coeff SE OR
(Intercept) 0.07 0.06 -1.48*** 0.09 -0.21*** 0.03 0.01 0.04 0.15*** 0.05 -1.29*** 0.07
PoorerHousehold -0.03 0.07 -0.81*** 0.16 0.446 -1.82*** 0.07 0.163 -2.11*** 0.06 0.122 -0.81*** 0.08 0.45 -1.79*** 0.19 0.17
ResidenceRural -0.8*** 0.07 0.45 -1.56*** 0.12 0.21 -0.87*** 0.05 0.419 0.04 0.05 -0.77*** 0.07 0.46 -1.21*** 0.1 0.30
SexFemale 0.34*** 0.06 1.402 -0.16 0.11 -0.52*** 0.04 0.593 0.23*** 0.04 1.26 -0.92*** 0.06 0.40 -0.95*** 0.1 0.39
MICSBHUTAN
(1)KAZAKHSTAN
(2)LAO PDR
(3)MONGOLIA
(4)MYANMAR
(5)THAILAND
(6)
Coeff SE OR Coeff SE OR Coeff SE OR Coeff SE OR Coeff SE OR Coeff SE OR
(Intercept) -1.34*** 0.06 -0.11*** 0.03 -0.97*** 0.05 0.45*** 0.04 -1.45*** 0.04 -0.13*** 0.03
PoorerHousehold -2.86*** 0.24 0.06 -1.04*** 0.06 0.35 -2.4*** 0.18 0.091 -2.02*** 0.06 0.132 -1.77*** 0.1 0.17 -1.93*** 0.06 0.15
ResidenceRural -0.86*** 0.08 0.43 -0.43*** 0.06 0.65 -1.72*** 0.08 0.18 -0.75*** 0.06 0.474 -1.59*** 0.05 0.21 -0.41*** 0.04 0.67
SexFemale -0.95*** 0.08 0.39 0.52*** 0.04 1.68 -0.7*** 0.07 0.496 0.75*** 0.05 2.126 0.31*** 0.05 1.36 0.29*** 0.04 1.34
MICSTURKMENISTAN
(7)VANUATU
(8)VIET NAM
(9)
Coeff SE OR Coeff SE OR Coeff SE OR
(Intercept) -0.63*** 0.06 -1.66*** 0.11 -0.24*** 0.05
PoorerHousehold -0.69*** 0.12 0.50 -1.73*** 0.46 0.18 -1.83*** 0.09 0.16
ResidenceRural -1.08*** 0.09 0.34 -0.87*** 0.22 0.42 -0.75*** 0.06 0.47
SexFemale -0.32*** 0.07 0.73 -0.78*** 0.18 0.46 0.03 0.06
Source: UNESCAP elaboration based on DHS and MICS household surveys.Notes: 1. Latest year available for each country. 2. Base references are top 60 household, urban household, and sex is male. 3. Coeff. = Coefficient, SE = Standard Error, OR = Odds Ratio.*** 1% level of significance** 5% level of significance* 10% level of significance
33
ANNEX: methodology for identifying gaps in access to opportunities

References1 United Nations, Economic and Social Commission for Asia
and the Pacific (2017). Statistical Database. Available from http://data.unescap.org/escap_stat/.
2 United Nations, Economic and Social Commission for Asia and the Pacific. Time for Equality. ST/ESCAP/2735.
3 United Nations, Economic and Social Commission for Asia and the Pacific. Time for Equality. ST/ESCAP/2735.
4 Lee, Tien Ming and others. Predictors of public climate change awareness and risk perception around the world. Nature Climate Change, Vol. 5, No. 11 (July 2012).
5 Franzen, Axel and Vogl, Dominikus. Two decades of measuring environmental attitudes: a comparative analysis of 33 countries. Global Environmental Change, Vol. 23, No. 5 (October 2013).
6 United Nations, Economic and Social Commission for Asia and the Pacific. Time for Equality. ST/ESCAP/2735.
7 World Justice Project. World Justice Project: Open Government Index 2015 Report. Washington DC, 2015.
8 World Justice Project. World Justice Project: Open Government Index 2015 Report. Washington DC, 2015.
9 Castelló-Climent, Amparo. On the distribution of education and democracy. Journal of Development Economics, Vol. 87, No. 2 (October 2008).
10 Shorrocks, Anthony F. Decomposition procedures for distributional analysis: a unified framework based on the Shapley value. Journal of Economic Inequality, Vol. 11, No. 1 (December 2013).
11 Bhattachan, Krishna B., Sunar, Tej B. and Bhattachan, Yasso Kanti. Caste-based Discrimination in Nepal. Working Paper, No. 08. New Dehli, India: Indian Institute of Dalit Studies, 2009. Available from http://idsn.org/wp-content/uploads/user_folder/pdf/New_files/Nepal/Caste-based_Discrimination_in_Nepal.pdf.
12 United Nations, International Children’s Emergency Fund. Global Initiative on Out-of-School Children: South Asia Regional Study. Nepal, 2014.
13 Australian Government, Department of Prime Minister and Cabinet. Aboriginal and Torres Strait Islander Health Performance Framework 2014 Report. 2015. Available from https://www.pmc.gov.au/sites/default/files/publications/indigenous/Health-Performance-Framework-2014/tier-2-determinants-health/206-educational-participation-and-attainment-adults.html.
14 Shaykhutdinov, R. 2011. Education for peace: protest strategies of ethnic resistance movements. Journal of Peace Education, Vol. 8, No. 2, pp. 143–55
15 United Nations, Educational, Social and Cultural Organization. Reaching the Marginalized: Education for All Global Monitoring Report 2010. Oxford and Paris, 2010.
16 United Nations, Economic and Social Commission for Asia and the Pacific. Building Disability-Inclusive Societies in Asia and the Pacific. ST/ESCAP/2800.
17 United Nations, Economic and Social Commission for Asia and the Pacific. Gender Equality and Women’s Empowerment in Asia and the Pacific. ST/ESCAP/2726.
18 Kelleher, John D., Mac Namee, Brian and Aoife, D’Arcy. Fundamentals of Machine Learning for Predictive Data Analytics: Algorithms, Worked Examples, and Case Studies. Massachusetts, MIT Press Cambridge, 2015.
19 Ferreira, F and Gignoux, J. (2011). The Measurement of Inequality of Opportunity: Theory and Application to Latin America. Review of Income and Wealth. International Association for Research in Income and Wealth.
20 European Bank for Reconstruction and Development. Transition Report 2016-17: Transition for All: Equal Opportunities in an Unequal World. London, 2017.
34

Inequality of Opportunity in Asia and the Pacific: Education
Reducing inequality in all its forms is at the heart of the 2030 Agenda for Sustainable Development. It is emphasized in the stand-alone Goal 10 “Reduce inequality within and among countries” and in other Goals that call for universality and for ‘leaving no one behind’. Reducing inequality advances human rights and social justice and is fundamental for all three dimensions of sustainable development.
The ESCAP Inequality of Opportunity papers identify nine areas of basic opportunities where inequality jeopardizes a person’s life prospects, namely: education; women’s access to health care; children’s nutrition; decent employment; basic water and sanitation; access to clean energy; financial inclusion; basic technology and political participation. Each of these opportunities are covered by specific commitments outlined in the 2030 Agenda for Sustainable Development and addressed in a separate thematic paper covering 21 countries throughout Asia and the Pacific.
This paper on Inequality of Opportunity in Education explores gaps between in-country groups in educational attainment, as well as the extent to which these gaps have narrowed or widened over time. In addition to identifying the furthest behind, inequalities are also analysed to identify the relative contribution of each underlying circumstance. Ultimately, these findings are of direct use for generating discussion on transformations needed to reach the “furthest behind first” as pledged in the 2030 Agenda.