inequality and the financial crisis - acca · pdf fileinequality and the financial crisis:...
TRANSCRIPT


Headline News: US Income Inequality Soars to Highest Levels on Record since 1917
3

Inequality troubles not only the poor but also the rich & powerful
Janet Yellen
Lee Ka Shing
World Economic Forum
4

2013 - top 5% HH own 63% wealth; bottom 50% own 1%
5

Li Ka-shing
6

WEF: Wealth Gap –biggest global risk in coming years
7

Objectives
To show how inequality is both a cause of the recent Great Financial Crisis (GFC)– the neglected imbalance in financial crisis
And also a consequence of the GFC
Move beyond just reforming international financial architecture
Need to address international economic architecture
8

Three Levels of Causes to the Financial Crisis
I Level of Theory and Methodology
Efficient Market Hypothesis (EMH)
Fallacy of Composition in Econ Theory
II Level of Banking Industry
III Level of structural imbalances
Current account imbalances
Imbalance btw finance & real econ
Wealth & Income imbalance
9

Level of Theory & Methods - Failure of Economics
Paul Krugman:
“Much of the past 30 years of macroeconomics was spectacularly useless at best, and positively harmful at worst.”
Barry Eichengreen: “the crisis has cast into doubt much of what we thought we knew about economics.”
10

Level of Banking Industry: Financial Deregulation & Frequency of Financial Crises
11

Structural Imbalance – Financialization of Economy – Finance largest share of GDP
12
0%
5%
10%
15%
20%
25%
30%
1960 1970 1980 1990 2000 2006
Per C
en
t o
f U
.S.
GD
P
Year
U.S. - Financial vs Manufacturing Sector as
% of GDP
Manufacturing Sector Financial Sector

Structural Imbalance – Finance highest profit share
13

Structural Imbalance – Financial debt is largest
14
-
2,000
4,000
6,000
8,000
10,000
12,000
14,000
16,000
18,000
US
$
Billi
on
s
Year
U.S. Domestic Debt
1960-2007
Financial Sector Non-Financial Corporate
Household Sector Government
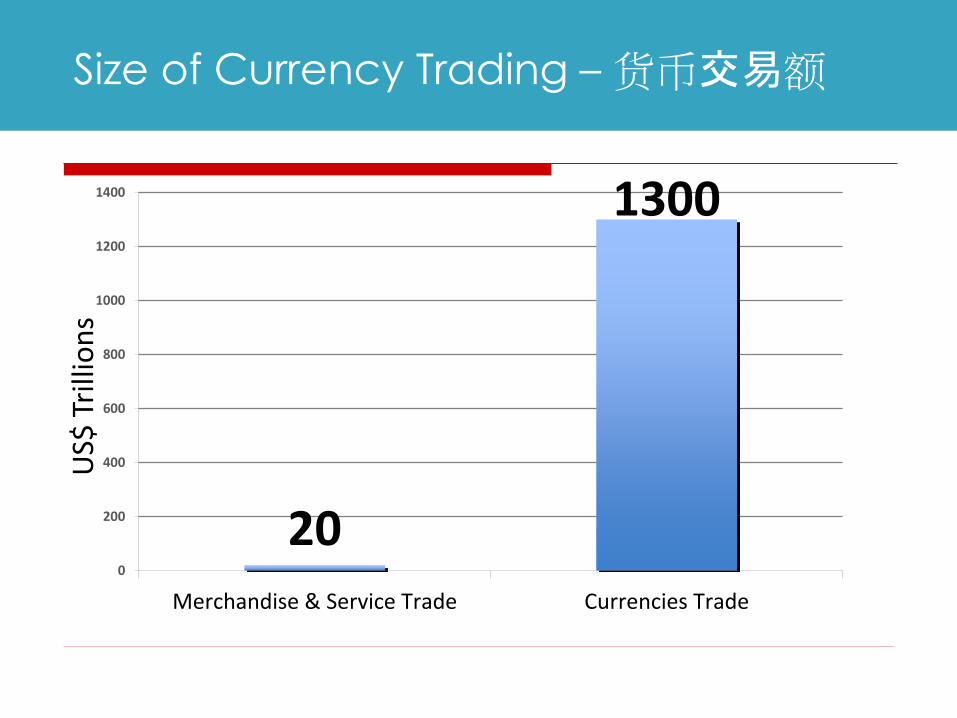
Size of Currency Trading – 货币交易额
20
1300
0
200
400
600
800
1000
1200
1400
Merchandise & Service Trade Currencies Trade
US$
Tri
llio
ns

Financial derivatives - 13x world’s GDP (2007)
16
Inverted Liquidity Pyramid - $607 trillion - 13 x world GDP

IMF 2012 Study – Too Much Finance? by J-L Arcand
Relation btw finance & growth is non-monotonic; fin contributes to growth
After a certain point too much finance is negative for growth – its marginal benefits are outweighed by marginal costs i/t of effect on fin instability and crises
17

Barclays --巴克莱银行

Fundamental Problem in Financial Industry
Too big
Too speculative
Finance -from servant of real economy to master
From being a means to an end in itself
19

Great Myth – rising tide lifts all boats

Neglected Imbalance in Financial Crises - Inequality
21

Functional Income Distribution (FID) – another measure of inequality
Definition of FID = How GDP distributed btw Labour (Wage + benefits) & Capital
Labor or Wage Share declining in most countries
22

Declining Wage Share of GDP in many countries (1970-2010)
Source: UNCTAD, TDR 2012 & CEIC
23

U.K. Wage Share of GDP, 1970-2013
Source: OECS Stats
24

U.S. – Rising & Declining Wage Share
25

26
CEO’s Pay, Corp Profits, S&P 500 Prodn Workers Pay, Fed Min wage
1990-2005
Minm wage minus 9% Prodn Workers Pay + 4% Corp Profits + 107% S&P 500 +141% CEO’s Pay +300%

27
Why Wage Share Declining? U.S.- Wages Lag Behind ProductivityGrowth

U.K. Productivity vs Wage Growth 1990-2012
28

How Inequality - A Cause of Great Financial Crisis
Wage – not just a cost item as assumed by neo-classical economists
Wage- imp factor aggregate demand
Falling Wage share of GDP means falling private demand/consumption
How to counter falling aggr demand?
Two ways : (a) increase personal (household) debt (b) increase exports
29

U.S. Debt Driven Economy
Econ growth powered by household debt – credit card, home mortgages > debt bubble
Private consumption is 72% of GDP
Fin industry recycled savings to debt
30

U.S. GDP Grew 27x; Total Debt Grew 64x btw 1960 & 2007
31

Hsehold Debt rose 64x from 40% to 100% GDP(1960-2007)
32

Debt Bubble

Excess Savings of Rich Invested in Risky Financial Products
Most of income gains accrued to top 1% of households
Marginal Propensity to consume of rich much lower than the poor
Excess savings chasing for high yields and invested in risky assets (financial innovation) > asset bubble
BOTH BUBBLES IMPLODED 2007
34

Asset Bubble

Fin Innovations – ATM Machines is abt the
only beneficial fin innovation in recent yrs

Fin Innovations – liken to financial weapons
of mass destruction

Turn to the China Story

China (current account surplus)
Declining wage share > decline in private consumption fr over 50% to 35% of GDP
Growth propped up through investments and export
Export rose fr <5% to 20% of GDP
Export earnings invested in US treasury & agency securities
Poor try financing rich country
39

China: Falling Wage Share & Consumption; Rising Exports
40

Summary
Global trade imbalance related to inequality & declining wage share
Shows up as debt & current account deficit in some ctries (U.S.) and export & current account surplus in others (China)
Both debt driven & export driven growth - financial & economically unstable & unsustainable
41

Any Significant Change in International Fin Architecture?
42

Consequence of Financial Crisis
World wide – pump priming & loose monetary policies
Unconventional monetary policy – quantitative easing world-wide
Fed balance sheet swollen to $4 trillion
Excess liquidity – flowing more into financial markets than real economy
43

U.S. - Private non-residential fixed investm–stagnating around 10% GDP
44

Asset Bubbles in the making
With negative real interest rates, funds flowing into property, stocks and bonds
Only people with money able to take advantage of rise in fin assets prices resulting fr QEs, exacerbating inequality
45

U.S. S&P, Corp Profit, Wage Indices 1990-2012
46

Conclusion and Policy Implications
Inequality + Financialization = a toxic mix that resulted in financial crisis
Policy Implications:
Need to fix inequality issue
Need to fix finance
47

Addressing issue of Inequality
Senator Elizabeth Warren:
“Any effective policy has to start with the households. Years of flat wages, low savings and high debt have left America’s households extremely vulnerable”
48

Reducing Inequality : can be ex-ante or ex-post
Ex-ante – wages tied to productivity growth; should not be less or more than productivity growth
Ex-post – have correct fiscal policies; reduce present bias in favor of capital
Increase capital gains tax-graduated, esp for ST speculative transactions
> 50% of stock trading avg holding time 10 seconds –high freq trading
49

Better Regulation of Finance
Need finance to serve real economy but NOT financialization which drives speculation and bubbles
Finance needs to be better regulated because finance is an industry with high negative externalities
50

3 Issues in Restructuring Internat’l Fin Architecture
More comprehensive
Capital Controls
Tax Havens
51

I- Comprehensive
Include shadow banking system as banks acct for only 25% of tot fin assets; hedge funds leverage much higher
Focus on systemic risks not just individual institutions
Must have global regulatory system
Global resolution system for failed banks & sovereign debt restructuring
52

II – Capital Controls
A major source of financial & econ volatility & instability is related to free capital flows esp of short-term nature
Carry trades undermine national monetary policies e.g., raise int rate to cool inflation can end up attracting more ST capital inflows – US,NZ
QE major source surge in international liquidity & asset bubbles
53

Capital Controls
Emerging mkt economies need the policy space to control inflow and outflow of capital; difficult to do it at individual level
Problem needs to be dealt with globally or at least regionally
International financial architecture must allow for use of capital controls as part of policy tools
54

III- Tax Havens
More international coordination to control tax havens that encourage regulatory arbitrage
Standardize accounting standards and country by country reporting of key data beyond extractive inds
Require declaration of beneficial ownership
55

Last Words
George Santayana(philosopher)
“Those who cannot remember the past are condemned to repeat it”
56

Thanks.
