inequality and poverty in the u.s. and california
TRANSCRIPT

Inequality and Poverty in the U.S. and California
JO N AT H A N F I S H E R STA N F O R D U N I V E R S I T Y
C E N T E R O N PO V E RT Y A N D IN E Q U A L I T Y

Inequality of income
and wealth
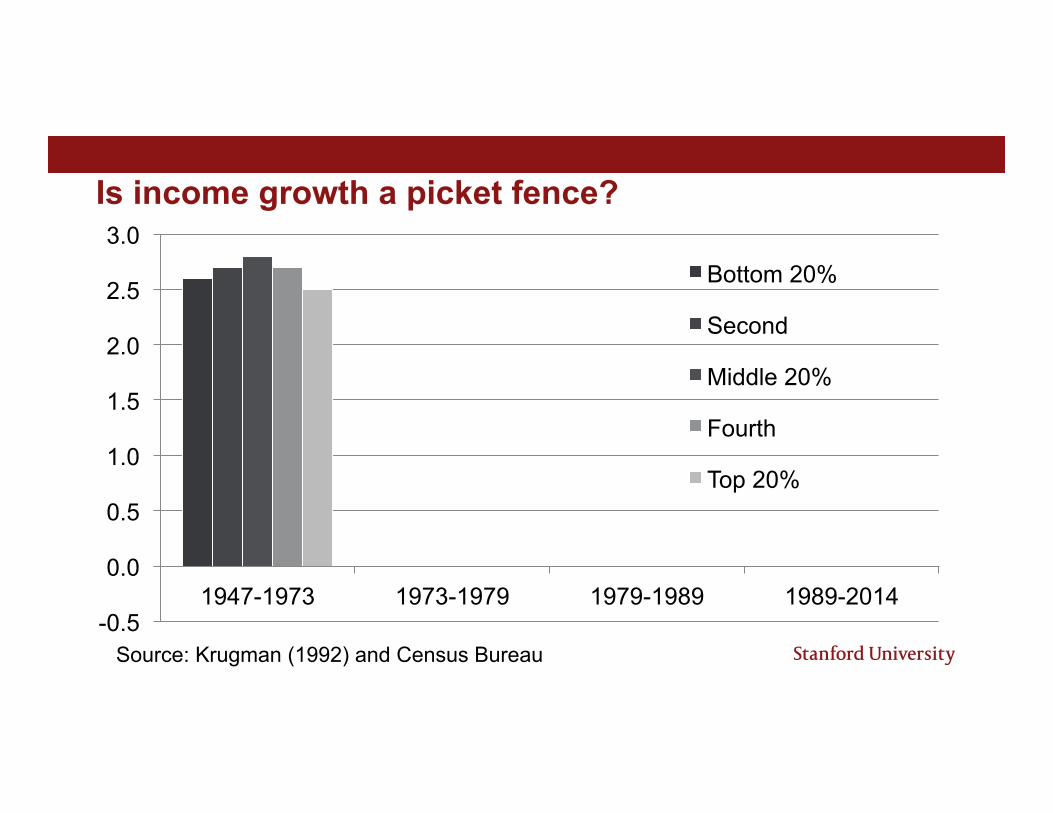
Is income growth a picket fence?
Source: Krugman (1992) and Census Bureau -0.5
0.0
0.5
1.0
1.5
2.0
2.5
3.0
1947-1973 1973-1979 1979-1989 1989-2014
Bottom 20%
Second
Middle 20%
Fourth
Top 20%

Or is income growth a staircase?
Source: Krugman (1992) and Census Bureau -0.5
0.0
0.5
1.0
1.5
2.0
2.5
3.0
1947-1973 1973-1979 1979-1989 1989-2014

Big picture on income inequality
Source: The World Top Incomes Database
.25.3
.35.4
.45.5
.55.6
Share
of In
come
of To
p 10%
1980 1985 1990 1995 2000 2005 2010
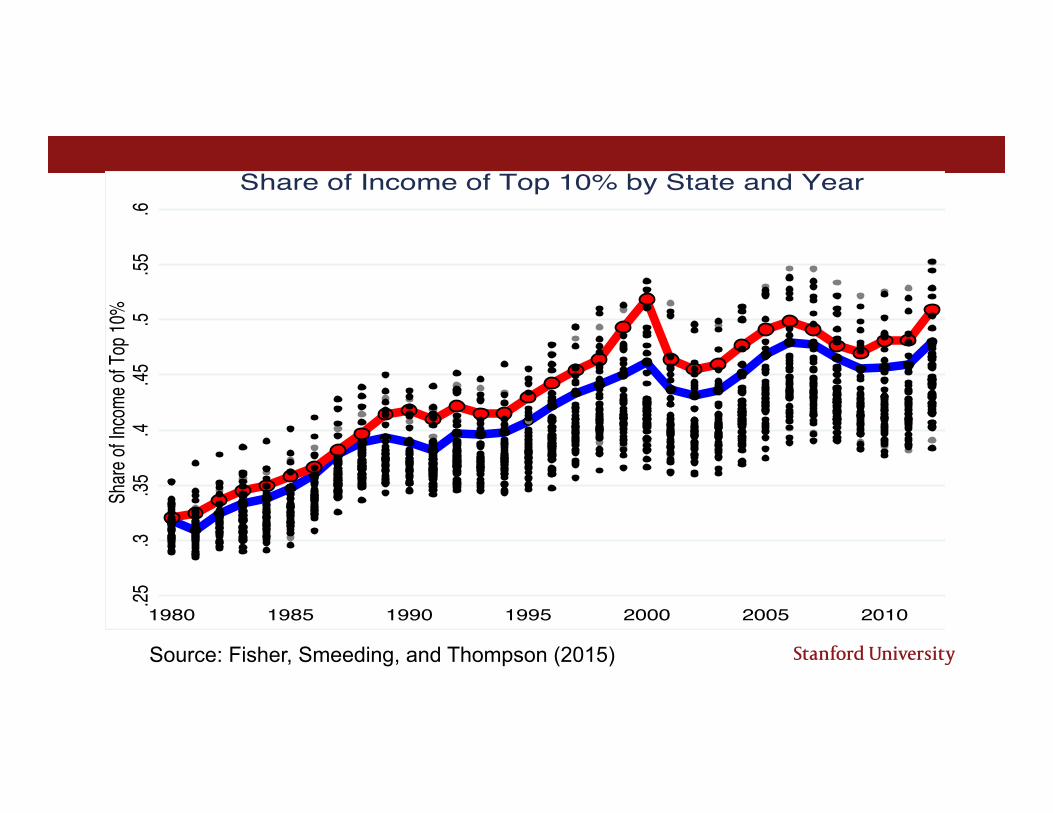
Share of Income of Top 10% by State and Year
Source: Fisher, Smeeding, and Thompson (2015)
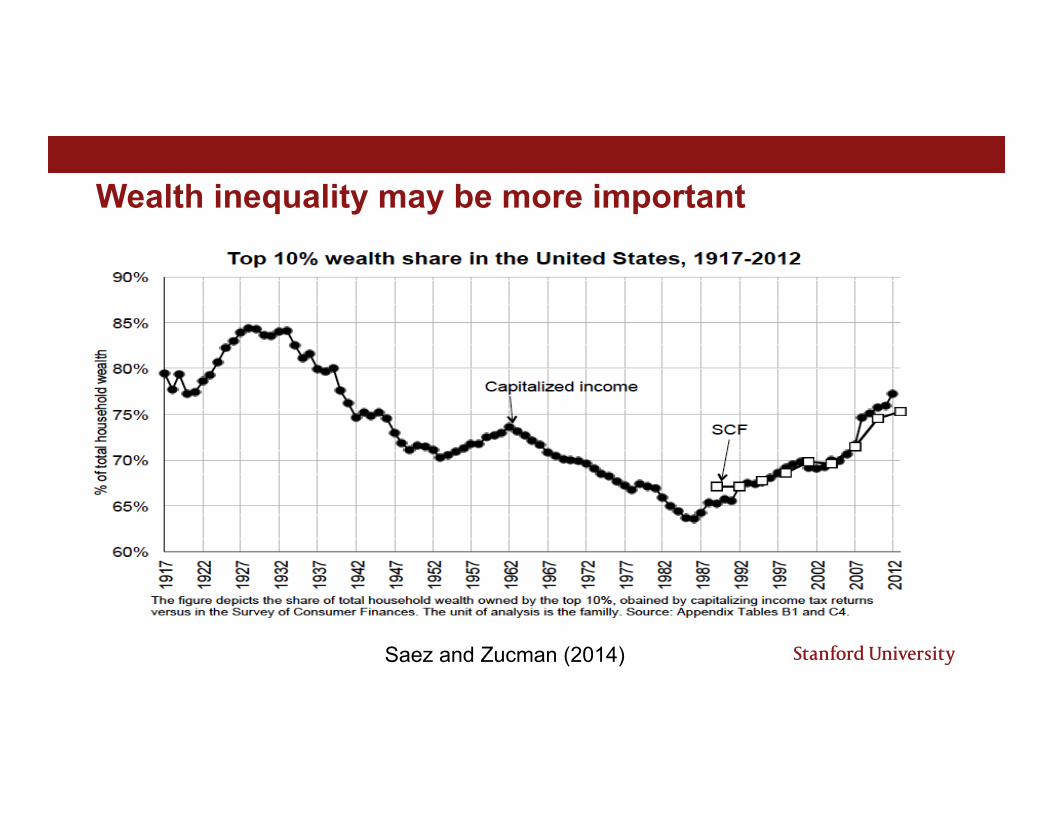
Wealth inequality may be more important
Saez and Zucman (2014)

Measuring poverty

The Official Poverty Measure (OPM)
0
5
10
15
20
25
1959 1969 1979 1989 1999 2009
National California
U.S. Census Bureau

Cost-of-living in the OPM $1 IN SAN MATEO BUYS THE SAME AS… $1 IN FRESNO AND $1 IN BAKERSFIELD AND $1 IN NEW MEXICO AND $1 IN NORTH DAKOTA AND $1 IN ARKANSAS

Cost-of-Living Adjustment in the Supplemental Poverty Measure (SPM)
0.0 0.2 0.4 0.6 0.8 1.0
New York Metro Arkansas
New Mexico North Dakota
Bakersfield Merced
Los Angeles Fresno
San Jose San Francisco
Renwick et al. (2014)
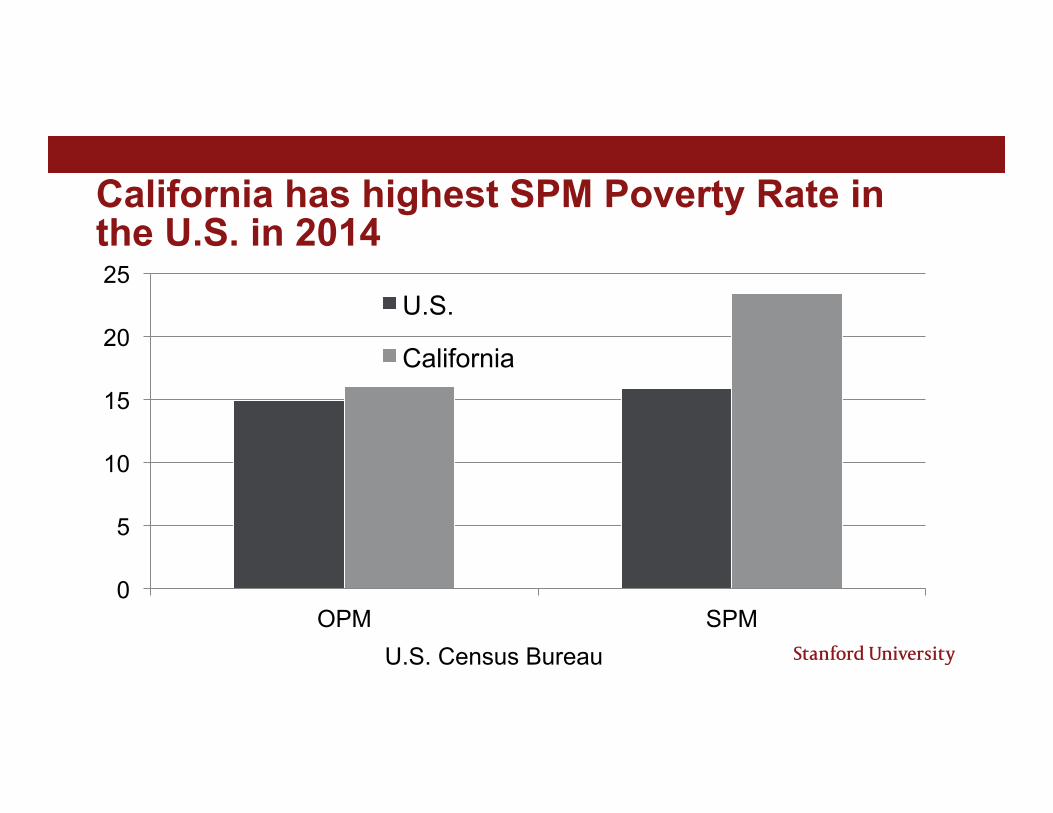
California has highest SPM Poverty Rate in the U.S. in 2014
0
5
10
15
20
25
OPM SPM
U.S.
California
U.S. Census Bureau
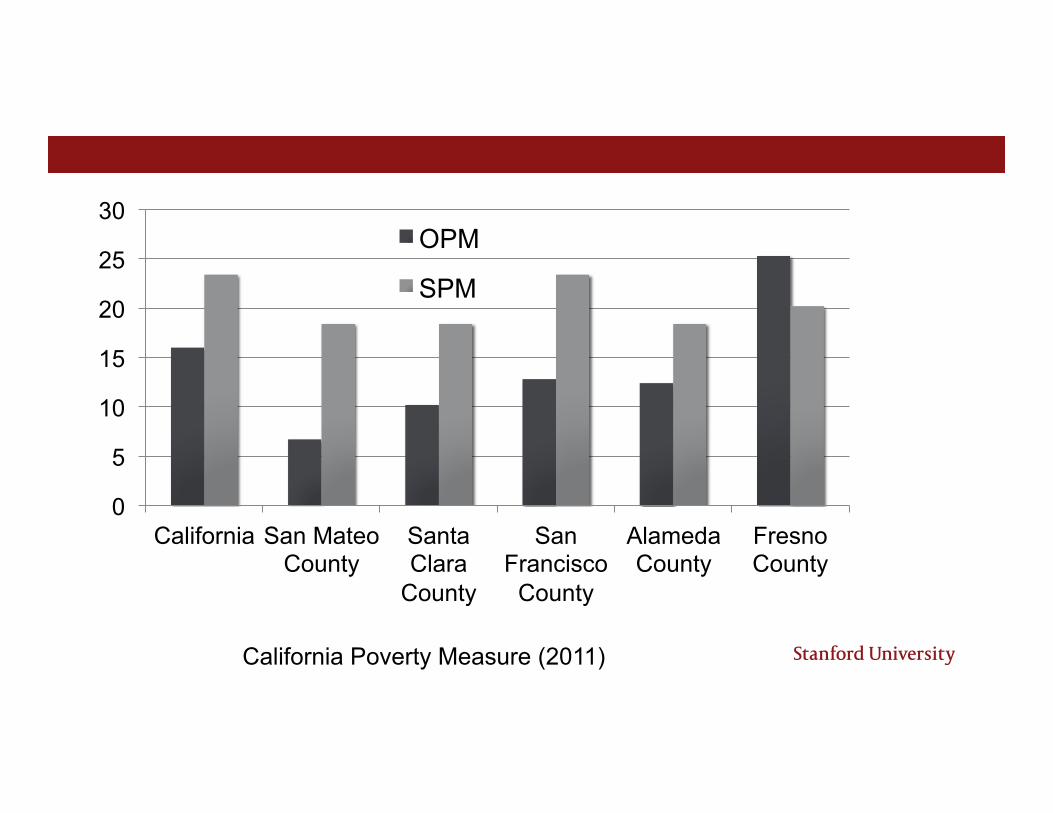
California Poverty Measure (2011)
0
5
10
15
20
25
30
California San Mateo County
Santa Clara
County
San Francisco
County
Alameda County
Fresno County
OPM
SPM

Housing Affordability in
California

Fraction of Before-Tax Income Spent on Housing by Income Bracket (Median)
American Community Survey, 2012-2014
0.0
0.2
0.4
0.6
0.8
1.0
<20,500 20,500-40,000 40,000-64,000 64,000-102,600 >102,600
U.S.
California
San Mateo
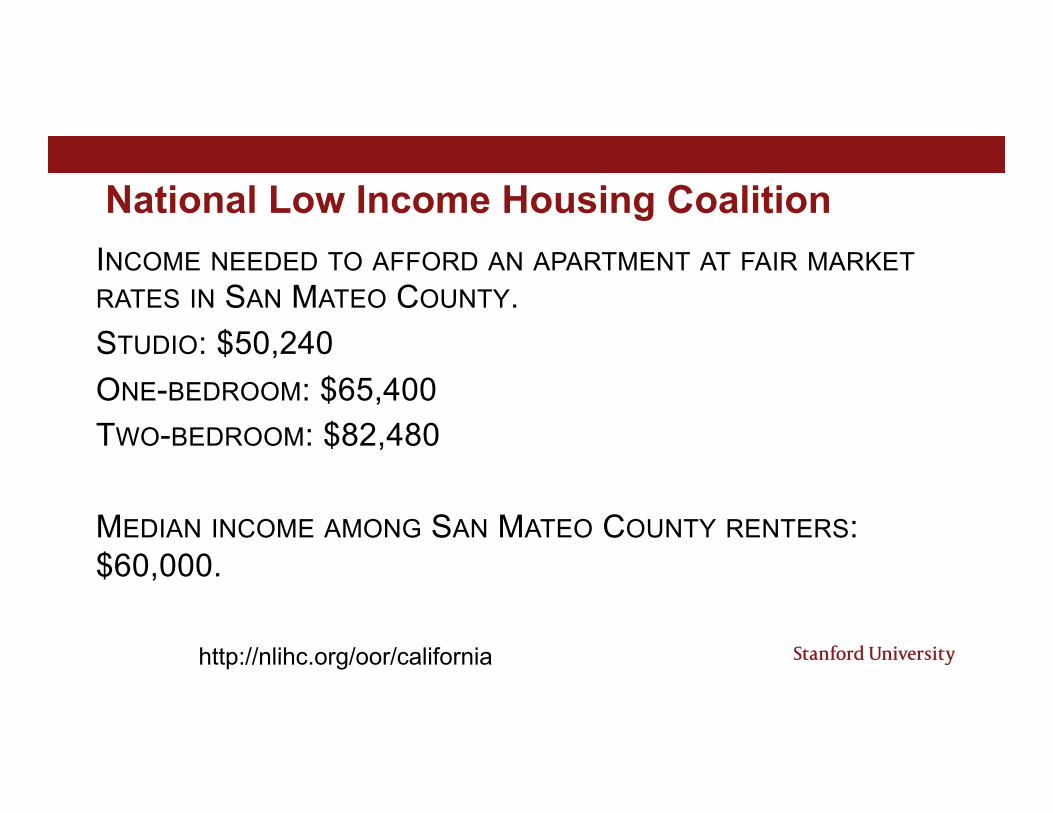
National Low Income Housing Coalition INCOME NEEDED TO AFFORD AN APARTMENT AT FAIR MARKET RATES IN SAN MATEO COUNTY. STUDIO: $50,240 ONE-BEDROOM: $65,400 TWO-BEDROOM: $82,480 MEDIAN INCOME AMONG SAN MATEO COUNTY RENTERS: $60,000.
http://nlihc.org/oor/california
Some hope?

Note: Lighter Color = More Absolute Upward Mobility
The Bay Area has a relatively high degree of upward mobility compared to the rest of the U.S.
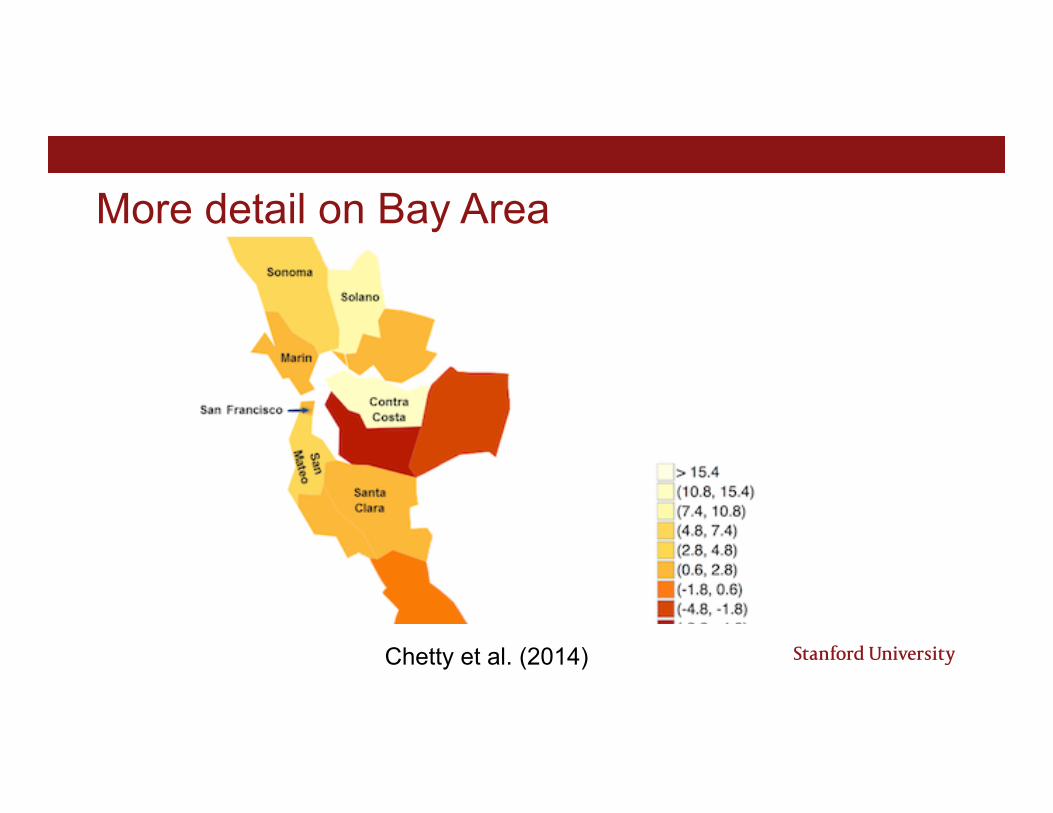
More detail on Bay Area
Chetty et al. (2014)
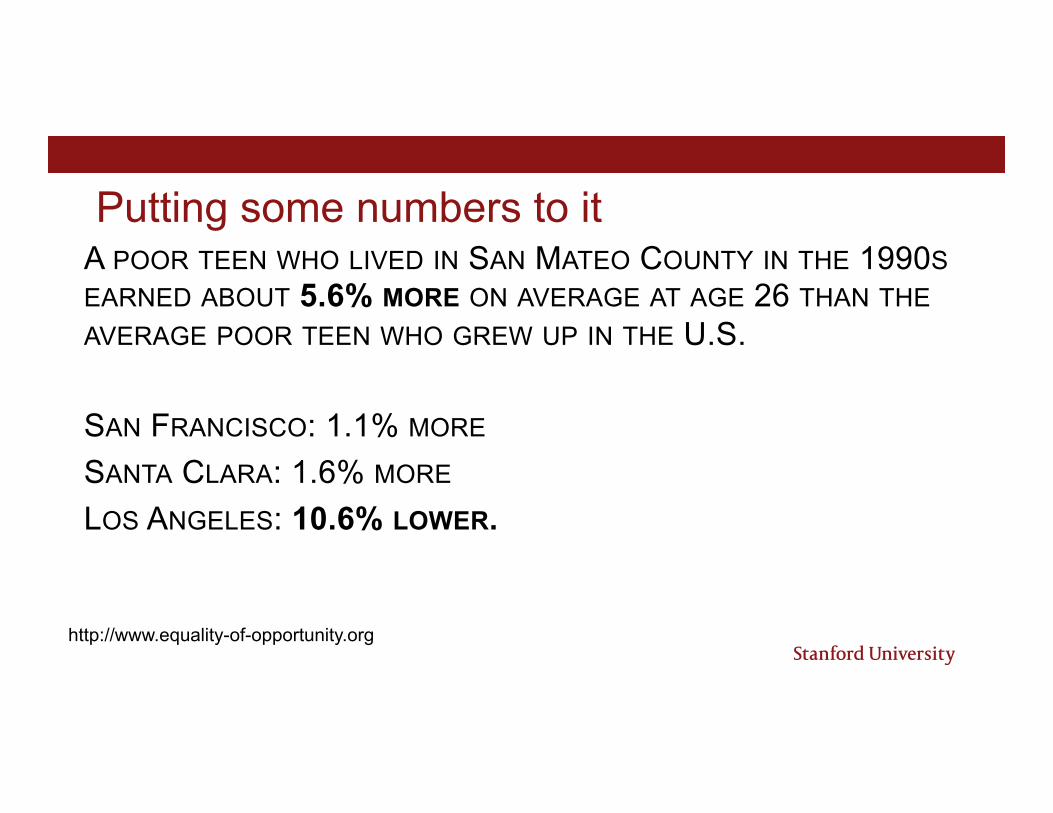
Putting some numbers to it A POOR TEEN WHO LIVED IN SAN MATEO COUNTY IN THE 1990S EARNED ABOUT 5.6% MORE ON AVERAGE AT AGE 26 THAN THE AVERAGE POOR TEEN WHO GREW UP IN THE U.S. SAN FRANCISCO: 1.1% MORE SANTA CLARA: 1.6% MORE LOS ANGELES: 10.6% LOWER.
http://www.equality-of-opportunity.org

QUESTIONS